Embed Size (px)
Citation preview
Slide 1
The DNA of Data Quality
John Owensby
of
Slide 2
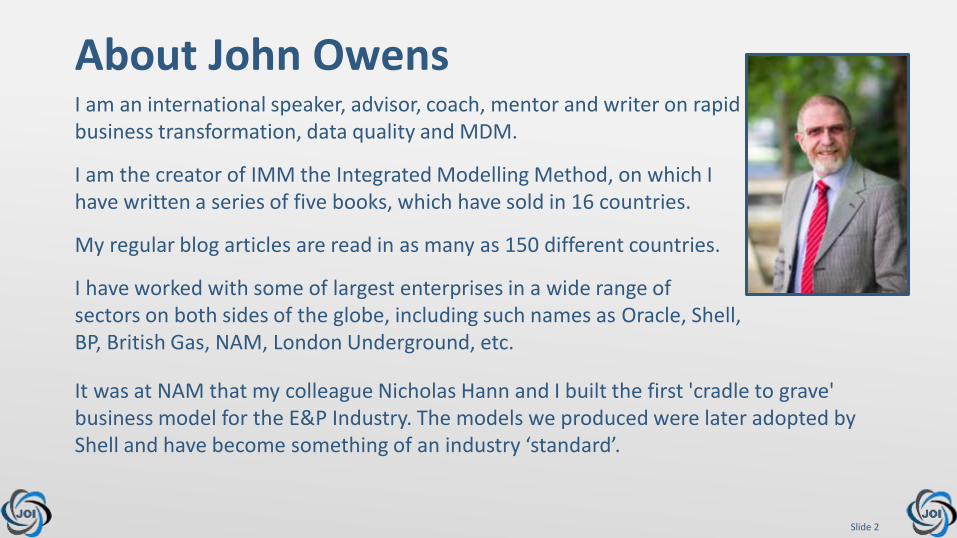
About John OwensI am an international speaker, advisor, coach, mentor and writer on rapid business transformation, data quality and MDM.
I am the creator of IMM the Integrated Modelling Method, on which I have written a series of five books, which have sold in 16 countries.
My regular blog articles are read in as many as 150 different countries.
I have worked with some of largest enterprises in a wide range of sectors on both sides of the globe, including such names as Oracle, Shell, BP, British Gas, NAM, London Underground, etc.
It was at NAM that my colleague Nicholas Hann and I built the first 'cradle to grave' business model for the E&P Industry. The models we produced were later adopted by Shell and have become something of an industry ‘standard’.

Slide 3
About John OwensI am also a practicing consultant and in this role I work with two main sets of enterprises.
The first set are those who are suffering the pains and losses caused by complexity or fragmentation in structure, process, systems or data. I help them to remove this pain and loss by enabling them to achieve what I call "power through accelerated integrated simplicity", using my innovative approach and highly effective techniques.
The second set are those who are already performing well, but who want to raise their game to a whole new level. My unique insights and highly tuned techniques enable these enterprises to excel.
Slide 4
“Data Quality is an indicator not a driver.
It is an indicator of how well or how badly the enterprise is performing its core activities – its Business Functions.”
Some of My Quotes
Slide 5
“Data has no intrinsic value. It is only of value if it supports the
effective execution of the Business Functions of the enterprise.”
Some of My Quotes

Slide 6
“Why spend time and money creating data errors and then more time and
money trying to find and correct them?
Why not just get it right first time?”
Some of My Quotes

Slide 7
“Data is what you need to do analytics.
Information is what you need to do business.”
Some of My Quotes
Slide 8
NAM Information AtlasOver a period of fourteen months Nick Hann and I mapped all of the Business Functions and Information Flows across every department of NAM.
This involved interviewing 127 people, ranging from senior executives to on-site 'doers’, from every organisational unit in the enterprise, in locations including Assen, Gronigen, Den Helder, Schoonebeek, etc.
The outcome of the project was that NAM had a complete and comprehensive model of everything it did and the information that it needed to do it. This model comprised a complete set of a Business Function Models (BFMs), one for every operational area of the business (e.g. exploration, drilling, work overs, etc.) plus information flow diagrams for every bottom level function in each BFM.
It was, at that time (and may still be), the most comprehensive modelling of an Oil & Gas E&P enterprise that had ever been done.
Slide 9
NAM Learnings
• The power of the Function Model as the backbone of every enterprise and of all other business models.
• The difference between data and information.
• That information must be ‘pulled’ not ‘pushed’.
• The power of patterns in highlighting similarities and differences.
• How modelling ‘what’ instead of ‘how’ overcomes the ‘illusion of constant change’.

Slide 10
Slide 11

Slide 12

Slide 13
An Historic Perspective
Our current perceived ‘data’ problems did not always exist.
To understand where they began we need to take a look back in time.
We actually need to look back to the era BC.

Slide 14
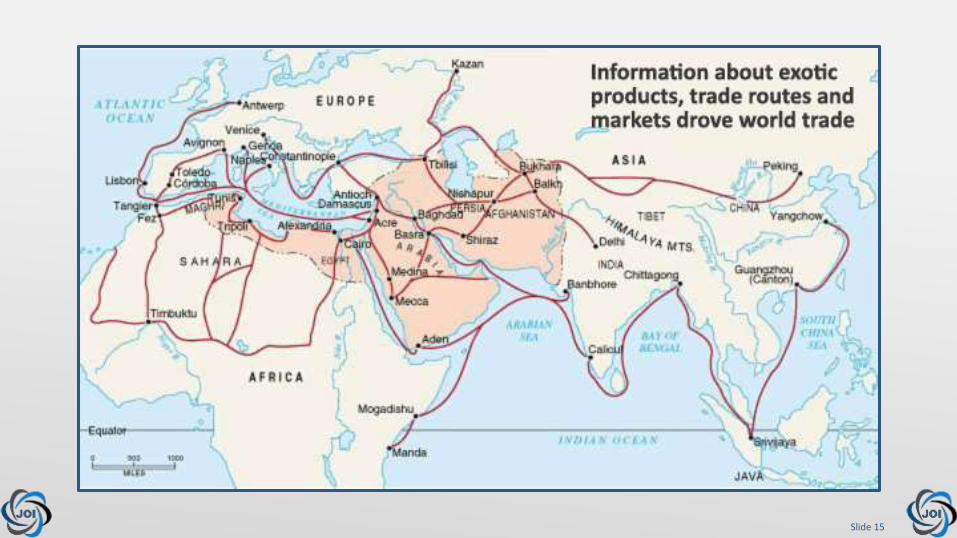
For thousands of years business men and women across the world new that high quality INFORMATION was invaluable to them.
Information about their products, markets, customers, competitors, etc.
Information was the most valuable asset they possessed as, without it, they could not capitalise on their other assets.
The Historic Time BC Before Computers
Slide 15
Slide 16
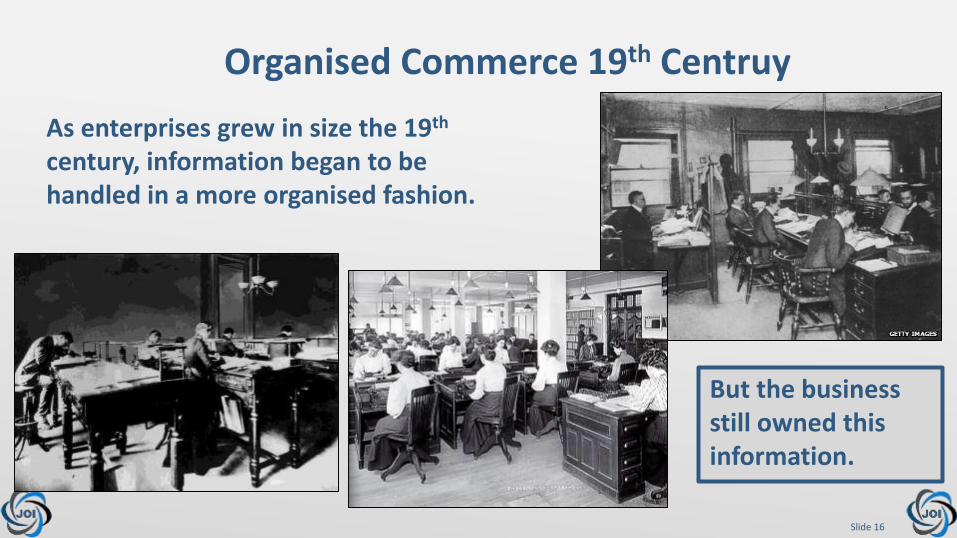
As enterprises grew in size the 19th
century, information began to be handled in a more organised fashion.
Organised Commerce 19th Centruy
But the business still owned this information.
Slide 17
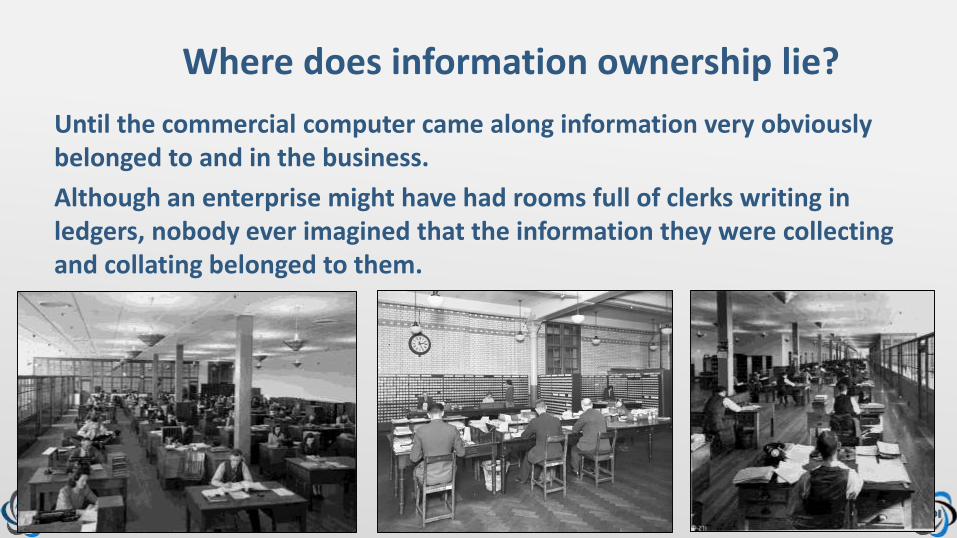
Until the commercial computer came along information very obviously belonged to and in the business.
Although an enterprise might have had rooms full of clerks writing in ledgers, nobody ever imagined that the information they were collecting and collating belonged to them.
Where does information ownership lie?

Slide 18
Even in the very early days of computerisation nobody would ever have considered that responsibility for and ownership of information was not in the business.
Early Computerisation
So, what went wrong and when?
Slide 19
Quiz Question!
Do you know what the first computer related virus was?
• It first struck some time in the 1980s
• Its spread was global
• Most enterprises are still infected today
• It never infected a single computer

Slide 20
Quiz Question!
Do you know what the first computer related virus was?
• It first struck some time in the 1980s
• Its spread was global
• Most enterprises are still infected today
• It never infected a single computer
• It did infect almost every C-Level Executive
• It is known as the Boggled Boss virus

Slide 21
Boggled Boss Symptoms
Infected executives:
• Became gibbering idiots with regards to computers.
• Lost all common sense & judgement in this area.
• Defered to anyone who could even spell ‘computer’.
• Could be made to sweat and feel faint with the use of terms like bit, byte, data, hexa, mega, etc.
• Acquiesed to any ‘data’ demand by anyone using the above terms.
Slide 22
Although this ‘virus’ might sound comical, it did have consequences that still seriously effect enterprises:
• The operational side of enterprises lost access to and control of information, its most valuable asset.
• Function (what the enterprise does) was split from data.
• A phantom ‘data’ enterprise was born inside every enterprise.
• The concept of information as an enterprise asset was lost and replaced with the misconception that data is its equivalent.
Serious Side
Slide 23
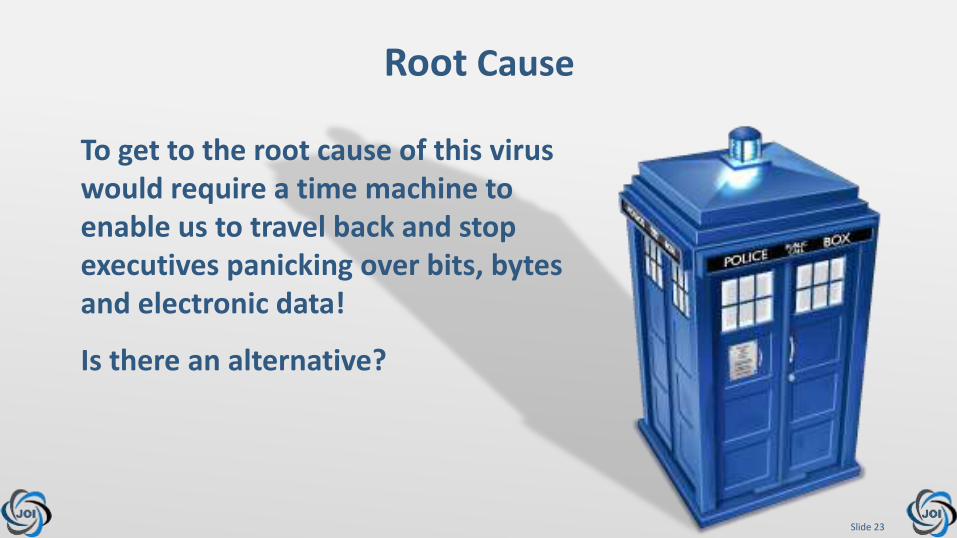
To get to the root cause of this virus would require a time machine to enable us to travel back and stop executives panicking over bits, bytes and electronic data!
Is there an alternative?
Root Cause
Slide 24
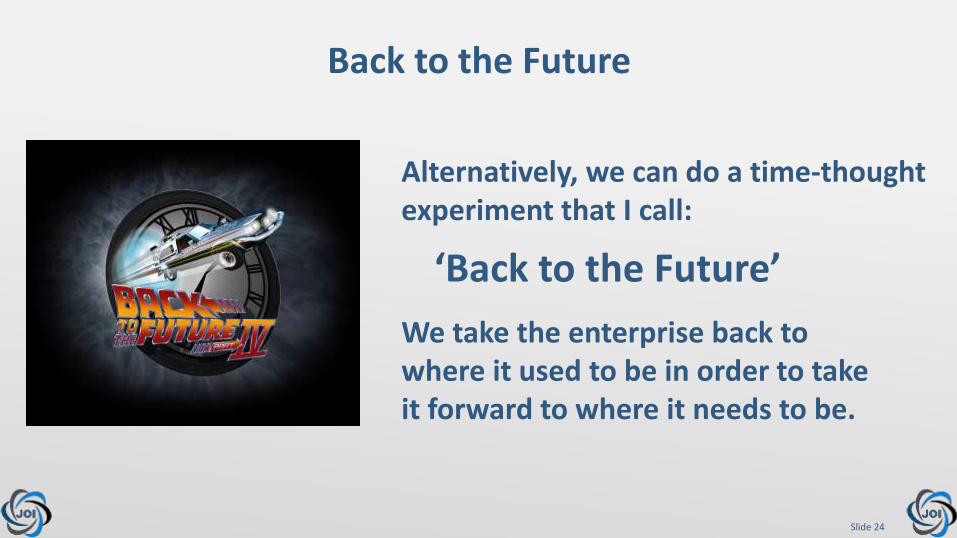
Alternatively, we can do a time-thought experiment that I call:
Back to the Future
‘Back to the Future’
We take the enterprise back to where it used to be in order to take it forward to where it needs to be.

Slide 25
How Do We Travel Back?
Information (not data) is the most valuable asset in any enterprise.
1.
We ‘travel back in time’ by re-establishing four key principles in the enterprise:

Slide 26
How Do We Travel Back?
All information belongs to, and is the responsibility of, those carrying out the core Business Functions of the enterprise.
2.

Slide 27
How Do We Travel Back?
Ownership and responsibility for information can NEVER be delegated (much less abdicated) to another party, though other parties may be used to assist the owners in the effective management of enterprise information.
3.

Slide 28
How Do We Travel Back?
Function and information are inextricably linked and must always remain so.
4.

Slide 29
How Do We Move Forward?
Once we have re-established these four key principles in the enterprise we will have taken it to where it was before viral insanity set in.
In order to move forward into the future, enterprises will now need to re-learn (some have never known it) effective Integrated Information Management.
Slide 30
This brings me to the subject of my talk:
The DNA of Data Quality
Slide 31
This brings me to the subject of my talk:
The DNA of Data Quality
While watching a TV programme on genetics, I became fascinated by the power of the DNA double helix and how a single strand could hold all of the instructions to build a living entity, be it a mouse, a mammoth or a man.
Shortly after the Programme an image started to form in my mind and I realised that there is an equally powerful structure in every enterprise.
There is a double helix that contains all of the instructions to define every function that an enterprise ought to perform and the information structures needed to enable it to do so.
It is that double helix structure that is the subject of this talk.
Slide 32
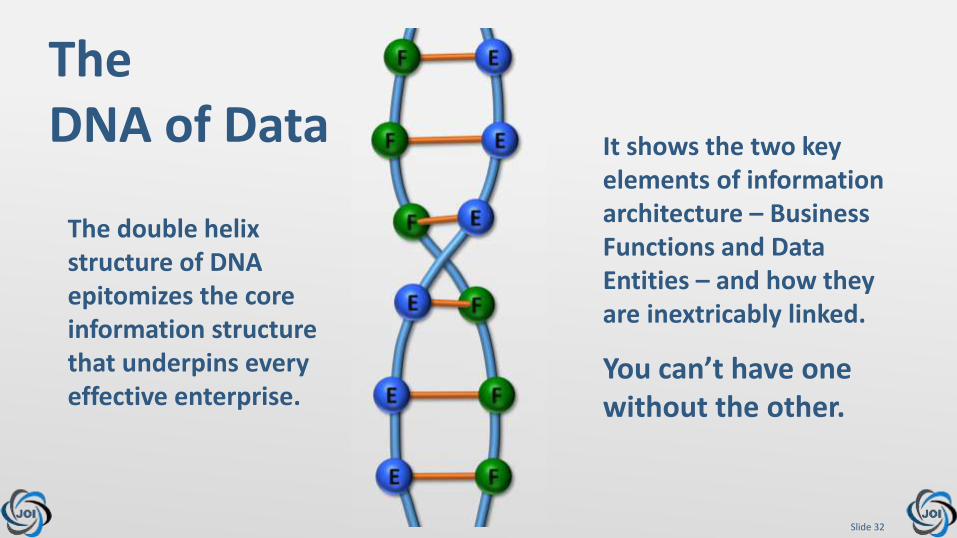
The double helix structure of DNA epitomizes the core information structure that underpins every effective enterprise.
It shows the two key elements of information architecture – Business Functions and Data Entities – and how they are inextricably linked.
You can’t have one without the other.
The DNA of Data

Slide 33
F
E
Business Function
Data Entity
Business Functions are the Core Activities of every enterprise
Business Functions create, use and transform all Data Entities
All Data Entities are created, used and transformed by Business Functions
Data Entities are those things about which the enterprise needs to know and hold data for the effective execution of Business Functions
Slide 34
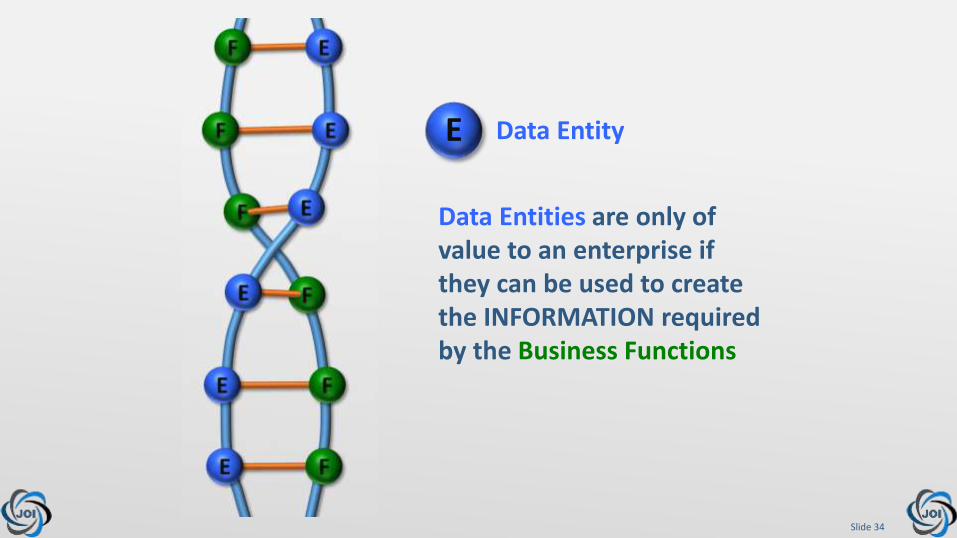
E Data Entity
Data Entities are only of value to an enterprise if they can be used to create the INFORMATION required by the Business Functions
Slide 35
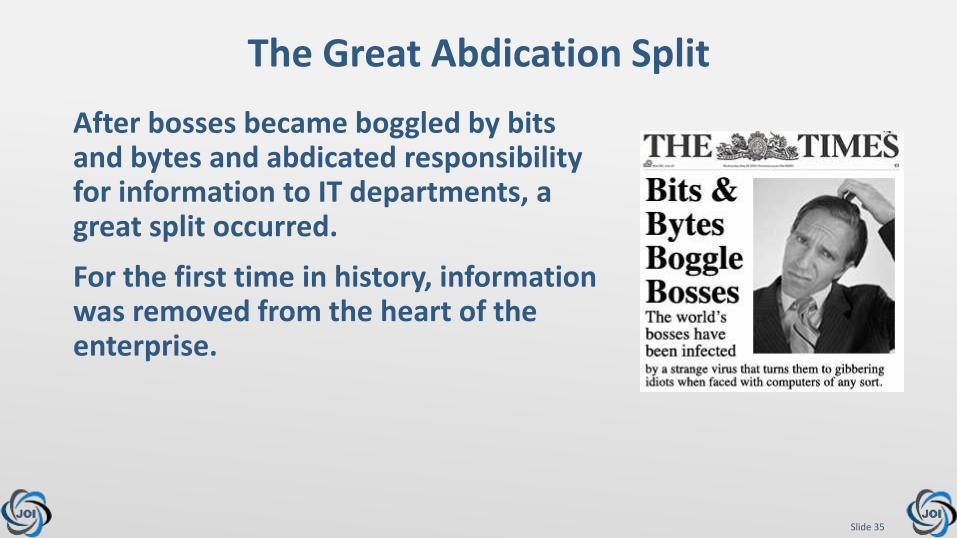
The Great Abdication Split
After bosses became boggled by bits and bytes and abdicated responsibility for information to IT departments, a great split occurred.
For the first time in history, information was removed from the heart of the enterprise.

Slide 36
F
F
F
F
F
F
E
E
E
E
E
E
F
F
F
F
F
E
E
E
E
E
E
The DNA of the Enterprise was Split
Slide 37
F
F
F
F
F
F
E
E
E
E
E
E
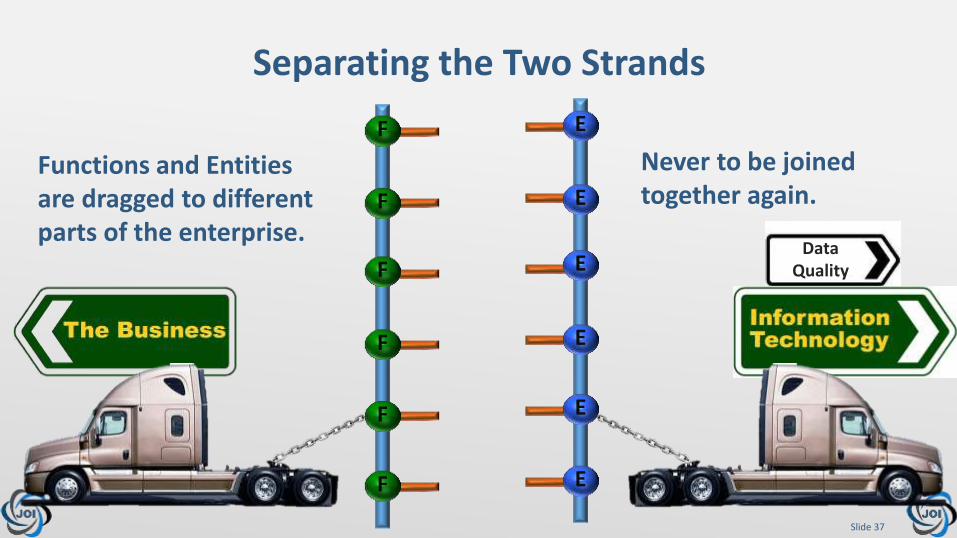
Functions and Entities are dragged to different parts of the enterprise.
Never to be joined together again.
Separating the Two Strands
Data Quality
Slide 38
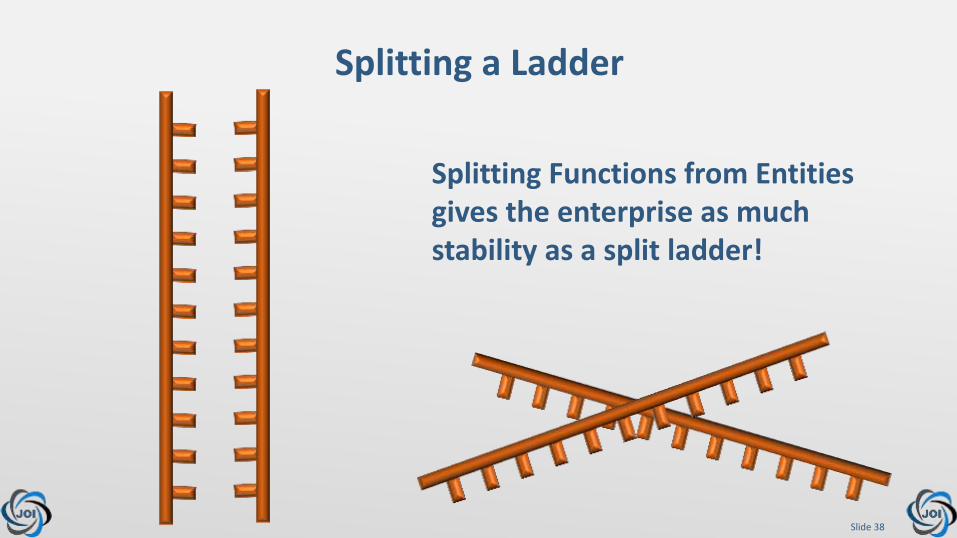
Splitting a Ladder
Splitting Functions from Entities gives the enterprise as much stability as a split ladder!
Slide 39
FEEE
EFF
F
F
FF
EEEE E
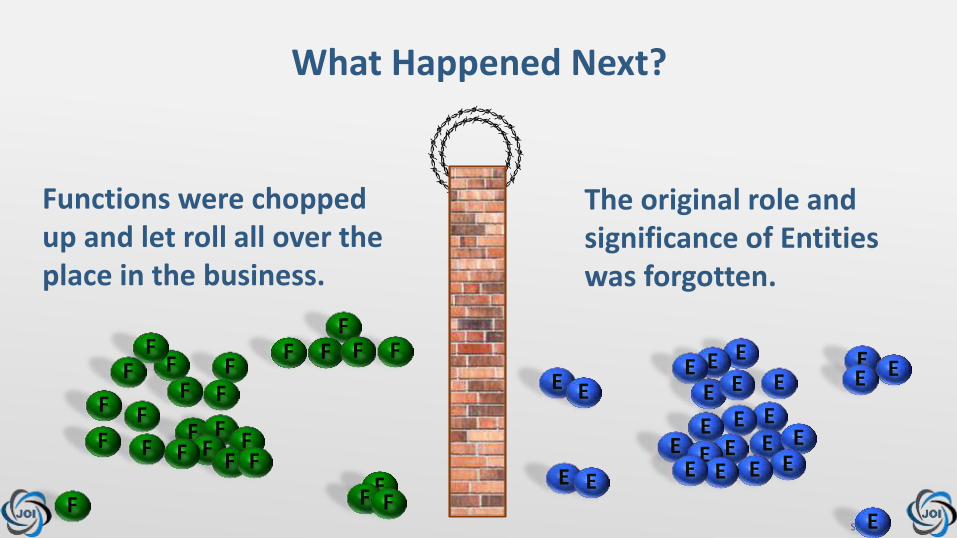
Functions were chopped up and let roll all over the place in the business.
The original role and significance of Entities was forgotten.
What Happened Next?
F
FF
F
F
F
FFF F FEE
E EE E
EEEEE
E EE
FF F
E
E
FF F F
FE

Slide 40
F
FF
F
F
FF
Many Functions were lost and never used again.
What Happened to Functions?
F
FF
F
F
F
FFF F FFF F
FF F F
F
Some enterprises, having forgotten about functions, tried to model processes but, as processes are based on functions, this was a failure.
How information ought be created and used became a mystery.
The enterprise lost its precious information asset.

Slide 41
EEE
EEEEE E
The original role and significance of Entities, i.e. that they form the basis for information for the enterprise, has been forgotten
Data is now created, updated and deleted in part or in whole without any explicitly defined purpose.
What Happened to Entities?
EE
E EE E
EEEEE
E EEE
E
E
IT has come to believe that data has a value in its own right and that ‘managing’ it is providing a valuable service to the enterprise.

Slide 42
The Poison Chalice
Slide 43
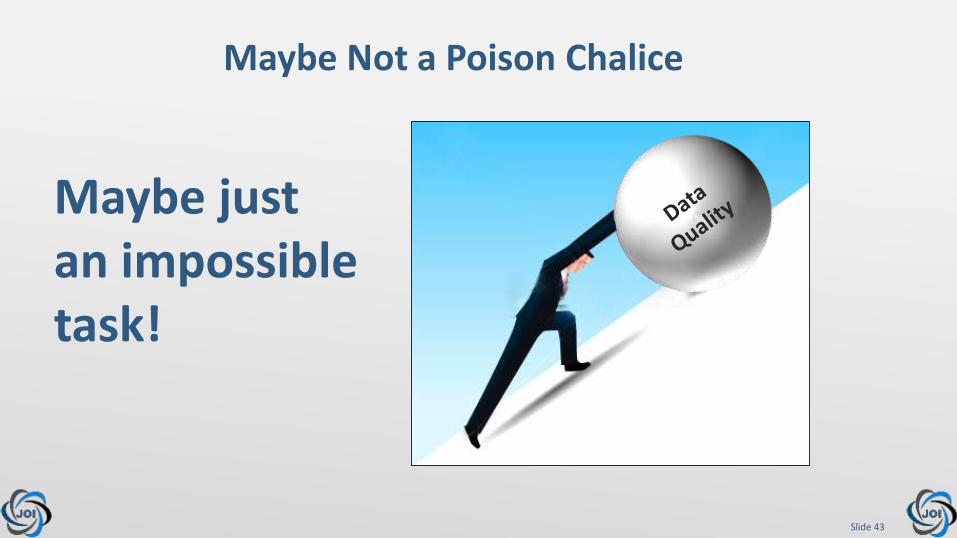
Maybe Not a Poison Chalice
Maybe just an impossible task!
Slide 44
Why an Impossible Task?
IT and Data Quality departments do not have the means to deliver quality data!!!
All data is created in and by the business.
At best, IT and Data Quality can clean up dirty data and put it back into the unhealthy business.
Slide 45
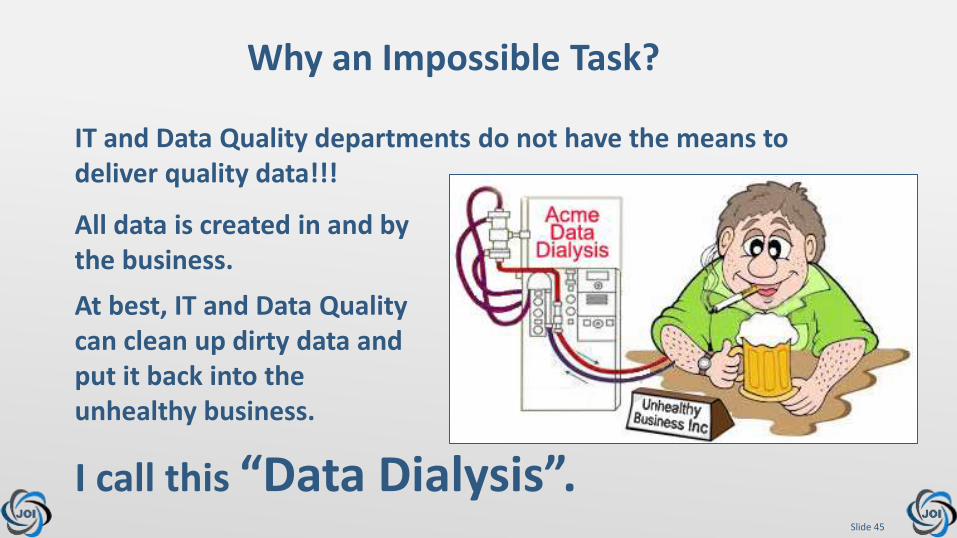
Why an Impossible Task?
IT and Data Quality departments do not have the means to deliver quality data!!!
All data is created in and by the business.
At best, IT and Data Quality can clean up dirty data and put it back into the unhealthy business.
I call this “Data Dialysis”.
Slide 46
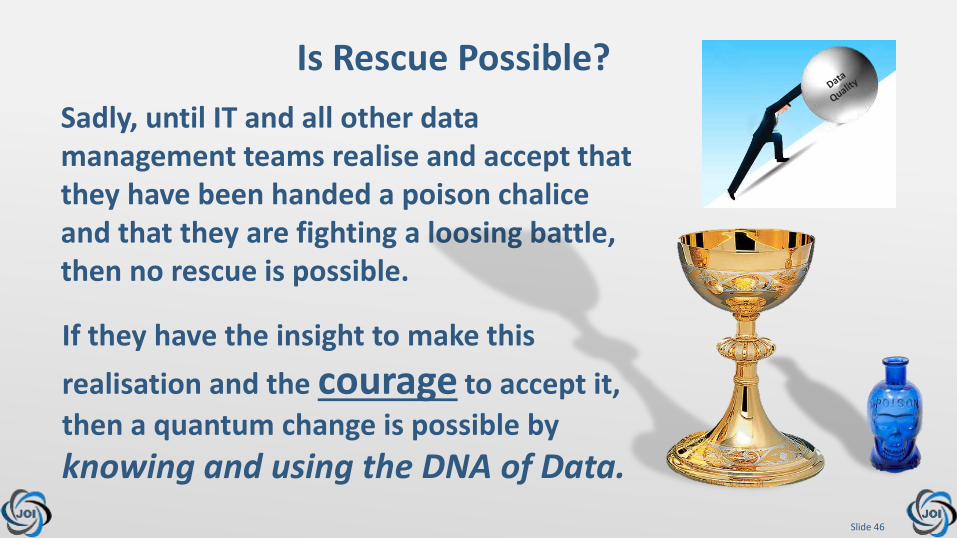
Is Rescue Possible?
Sadly, until IT and all other data management teams realise and accept that they have been handed a poison chalice and that they are fighting a loosing battle, then no rescue is possible.
If they have the insight to make this
realisation and the courage to accept it,
then a quantum change is possible by
knowing and using the DNA of Data.
Slide 47
The DNA of Entities
Let us look more closely at the DNA of Data.
Data Entities have a:
• Fingerprint.
• Structure.
• Usage profile
Slide 48
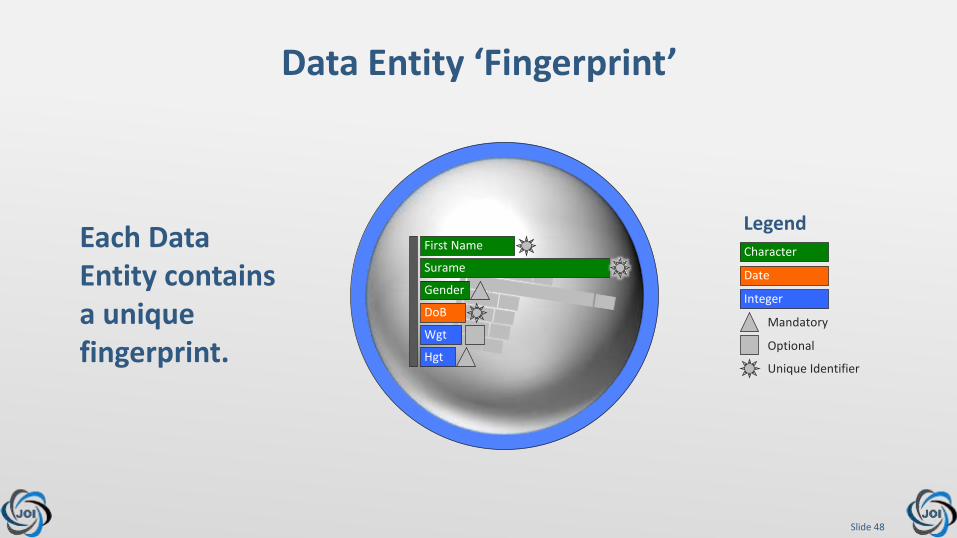
Data Entity ‘Fingerprint’
Character
Date
Integer
Each Data Entity contains a unique fingerprint.
Legend
Mandatory
Optional
Unique Identifier
First Name
Surame
DoB
Gender
Wgt
Hgt

Slide 49
Data Entity ‘Fingerprint’
Data Fingerprint Rules:
• The fingerprint of each Data Entity is unique.
• If two Entities have the same fingerprint, then they are the same Entity – even if they are currently called by different names.
Contractor
First Name
Surame
DoB
Gender
Wgt
Hgt
First Name
Surame
DoB
Gender
Wgt
Hgt
Contractor
Employee
Slide 50
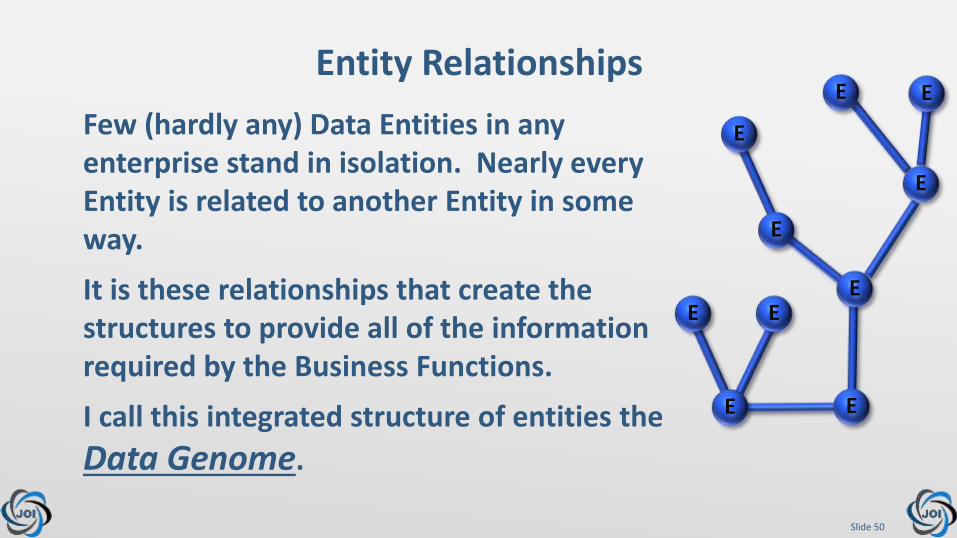
Entity Relationships
Few (hardly any) Data Entities in any enterprise stand in isolation. Nearly every Entity is related to another Entity in some way.
It is these relationships that create the structures to provide all of the information required by the Business Functions.
I call this integrated structure of entities the
Data Genome.
E
E
E
E
E
E
E
E
EE

Slide 51
Data Genome
The Data Genome is the means by which we can see how all of the Data Entities of the enterprise are related to each other.
In order to give consistency, robustness and integrity to the Genome, these relationships must conform to strict rules and formats. E
EE
E
E
Slide 52
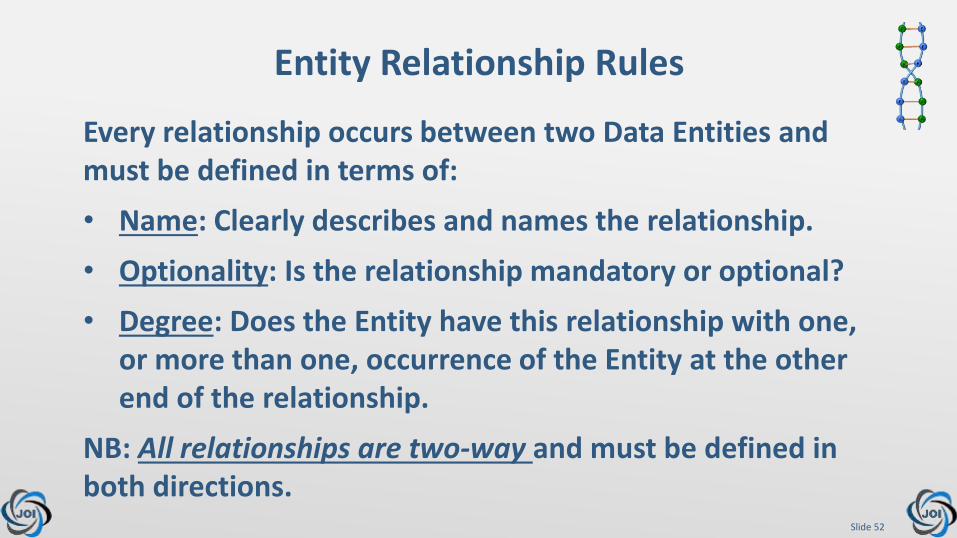
Entity Relationship Rules
Every relationship occurs between two Data Entities and must be defined in terms of:
• Name: Clearly describes and names the relationship.
• Optionality: Is the relationship mandatory or optional?
• Degree: Does the Entity have this relationship with one, or more than one, occurrence of the Entity at the other end of the relationship.
NB: All relationships are two-way and must be defined in both directions.

Slide 53
Relationship Drawing Conventions
Relationships must carry all of the information required to enable all the Business Functions to execute effectively.
Infinity Sign (∞) indicates that 1 occurrence of Entity 2 can be associated with 1 or more occurrence of Entity 1.
Broken Bar means that relationship from Entity 2 to Entity 1 is optional
∞ 1
The figure 1 indicates that 1 occurrence of Entity 1 can be associated with 1 and only 1 occuernce of Entity2.
Solid Bar means that relationship from Entity 1 to Entity 2 is mandatory

Slide 54
A Portion of the Data Genome
Focal Entity
Slide 55
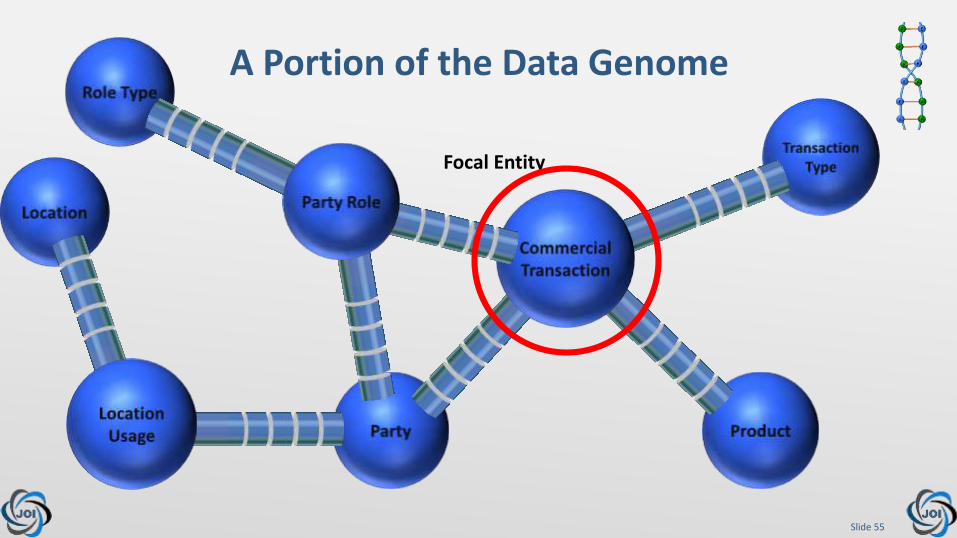
A Portion of the Data Genome
Focal Entity
Slide 56
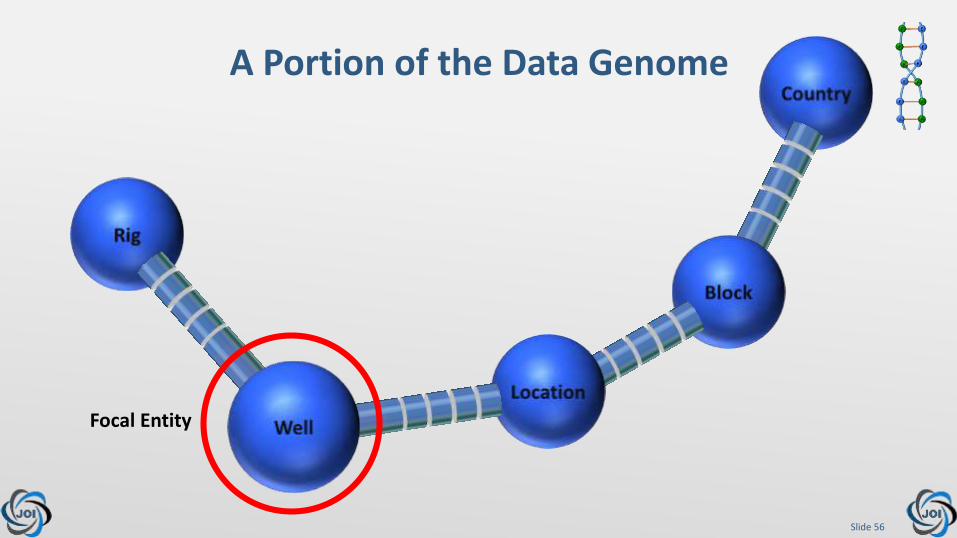
A Portion of the Data Genome
Focal Entity
Slide 57
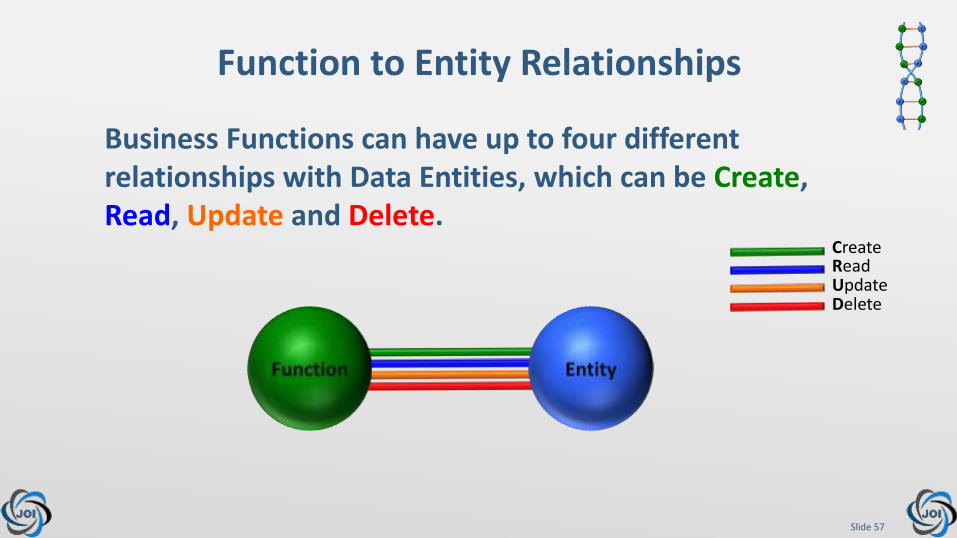
Function to Entity Relationships
Business Functions can have up to four different relationships with Data Entities, which can be Create, Read, Update and Delete.
Create
UpdateDelete
Read
Slide 58
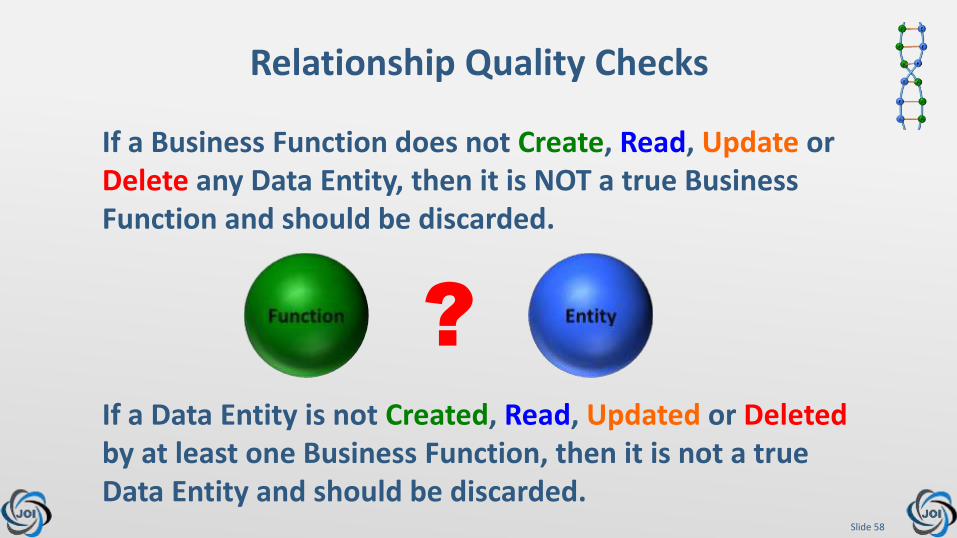
Relationship Quality Checks
If a Business Function does not Create, Read, Update or Delete any Data Entity, then it is NOT a true Business Function and should be discarded.
If a Data Entity is not Created, Read, Updated or Deleted by at least one Business Function, then it is not a trueData Entity and should be discarded.
?
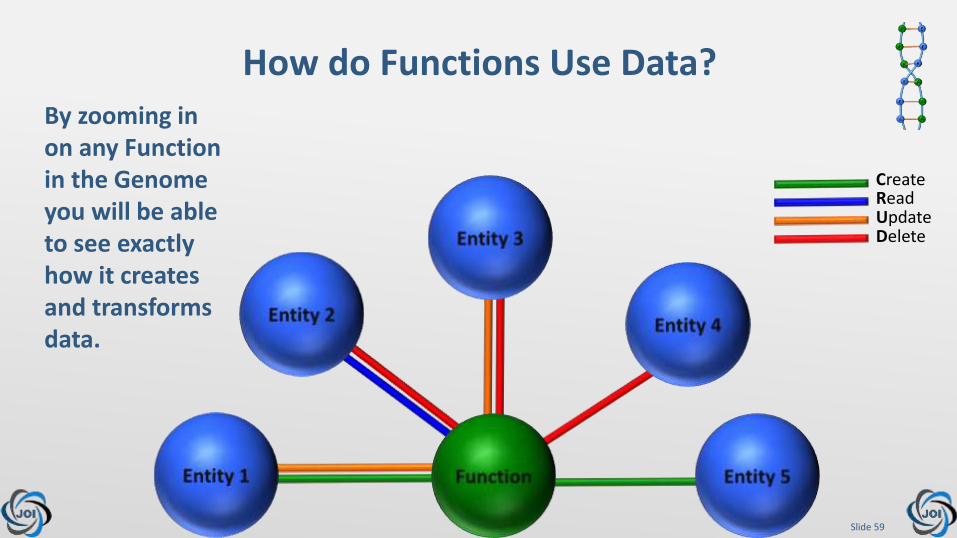
Slide 59
How do Functions Use Data?By zooming in on any Function in the Genome you will be able to see exactly how it createsand transforms data.
Create
UpdateDelete
Read

Slide 60
How are Entities Used by Functions?By zooming in on any Entity in the Genome you will be able to see exactly how it is created and transformed by Functions.
Create
UpdateDelete
Read
Slide 61
Should We Ever Delete Data?
Our previous slides showed Business Functions could delete occurrences of Data Entities.
• Should we allow this to happen?
• In previous times we did this to save space.
• Now storage that is so cheap can we avoid this?
• Sometimes policy or law will dicate that data must be deleted.

Slide 62
Deleting Data
Deleting for Policy
The enterprise might decide to retain data only for so long as it is compelled to by law to avoid the liability that incomplete historic records might place on it in, e.g. a class action.
Deleting for Legislation
The enterprise has to delete data to comply with legislation, even though it would prefer to keep it for opertational purposes, e.g. data about individuals.
Slide 63
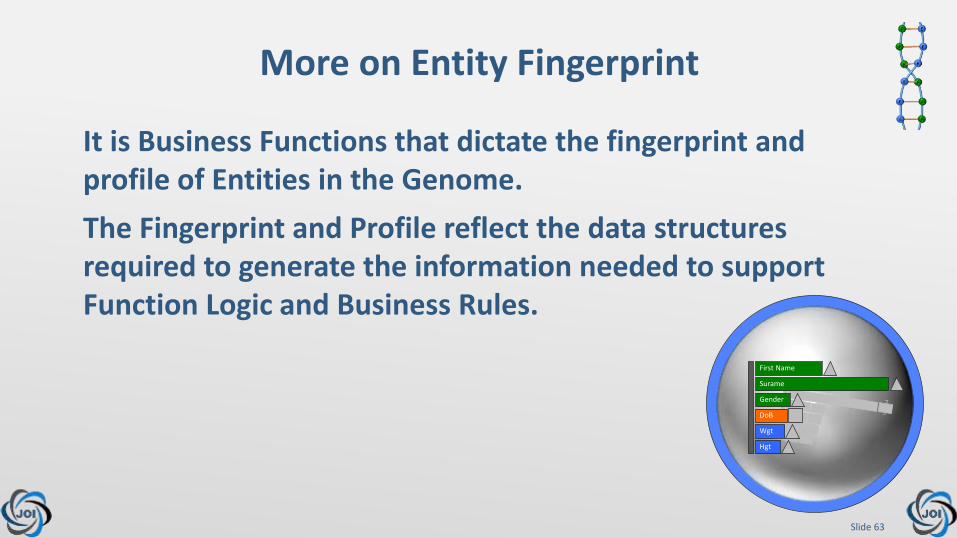
More on Entity Fingerprint
It is Business Functions that dictate the fingerprint and profile of Entities in the Genome.
First Name
Surame
DoB
Gender
Wgt
Hgt
The Fingerprint and Profile reflect the data structures required to generate the information needed to support Function Logic and Business Rules.
Slide 64
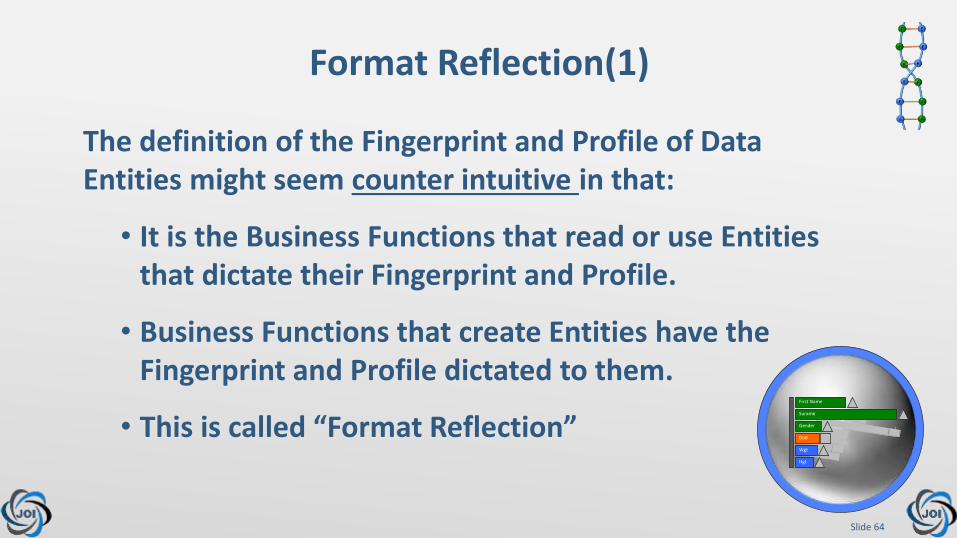
Format Reflection(1)
The definition of the Fingerprint and Profile of Data Entities might seem counter intuitive in that:
• It is the Business Functions that read or use Entities that dictate their Fingerprint and Profile.
• Business Functions that create Entities have the Fingerprint and Profile dictated to them.
• This is called “Format Reflection”First Name
Surame
DoB
Gender
Wgt
Hgt
Slide 65
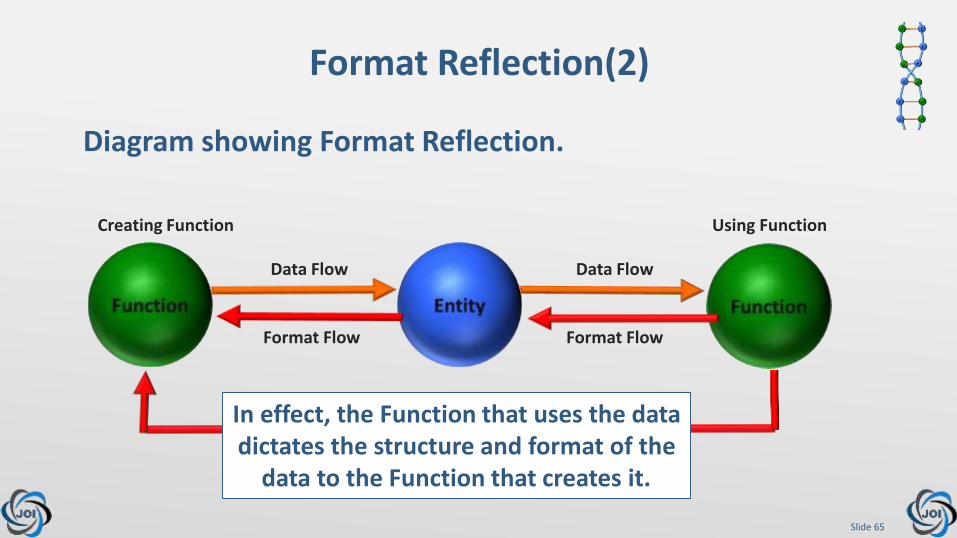
Format Reflection(2)
Diagram showing Format Reflection.
Creating Function Using Function
Format Flow
Data Flow Data Flow
Format Flow
In effect, the Function that uses the data dictates the structure and format of the
data to the Function that creates it.
Slide 66
This brings us to the fundamental rule that drives all data and information management in every enterprise around the globe, which is:
Function Defines Data
It is the Business Functions in an enterprise that define the format and structure of every item of data required by the enterprise.
This is true for every enterprise of every size in every sector.
Slide 67
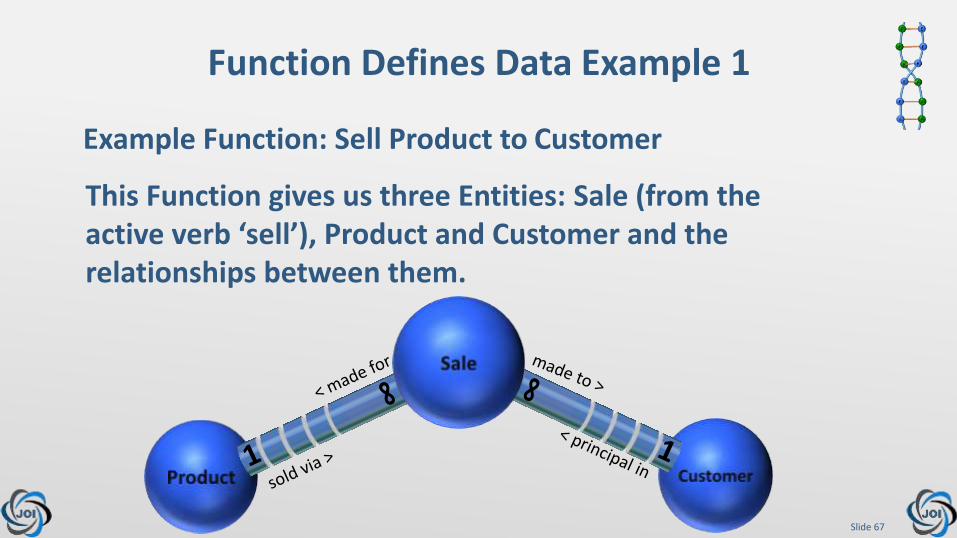
Function Defines Data Example 1
Example Function: Sell Product to Customer
This Function gives us three Entities: Sale (from the active verb ‘sell’), Product and Customer and the relationships between them.

Slide 68
Function Defines Data Example 2
Example Function: Analyse Sales by Product by Sales Rep by Region. This Function gives us four Entities:
Sale, Product, Region and Sales Rep.
Slide 69
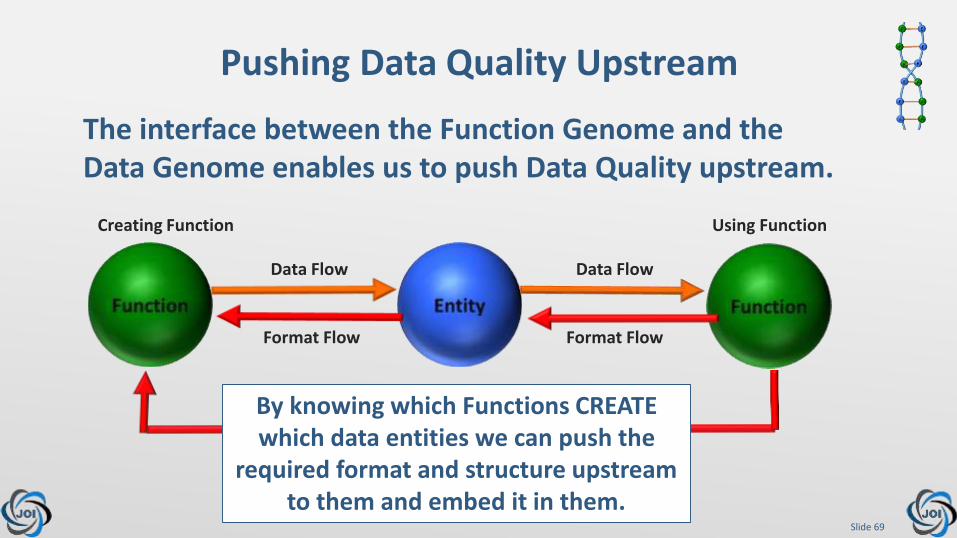
Pushing Data Quality Upstream
The interface between the Function Genome and the Data Genome enables us to push Data Quality upstream.
Creating Function Using Function
Format Flow
Data Flow Data Flow
Format Flow
By knowing which Functions CREATE which data entities we can push the
required format and structure upstream to them and embed it in them.
Slide 70
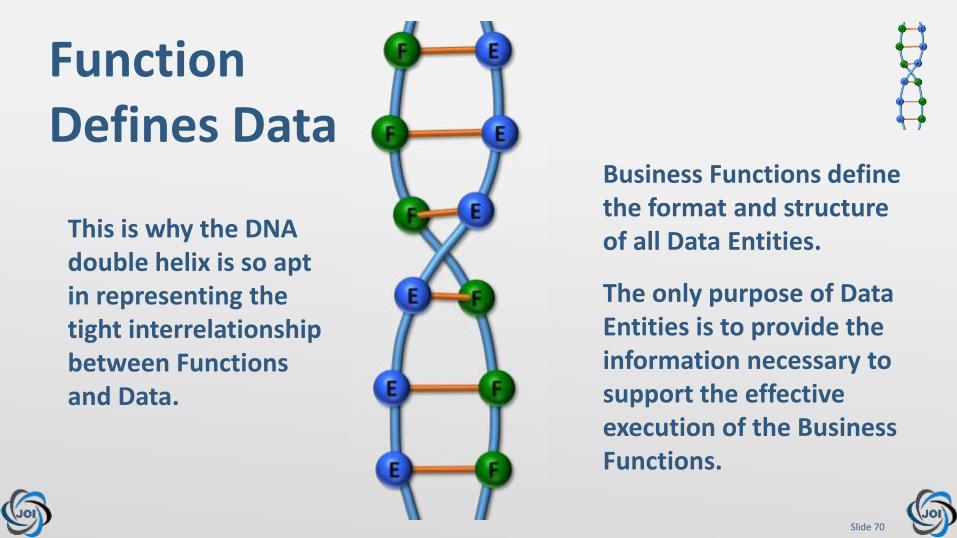
This is why the DNA double helix is so apt in representing the tight interrelationship between Functions and Data.
Business Functions define the format and structure of all Data Entities.
The only purpose of Data Entities is to provide the information necessary to support the effective execution of the Business Functions.
Function Defines Data
Slide 71
Legacy Systems & Legacy Data
The Function and Data Genomes are essential for establishing the ‘fitness for purpose’ of legacy systems by answering questions such as:
“Does the business logic and data usage of the system modules match the Business Functions?”
“Does the structure of the data in the system tables match the profile and structures in the Data Genome?”
Slide 72
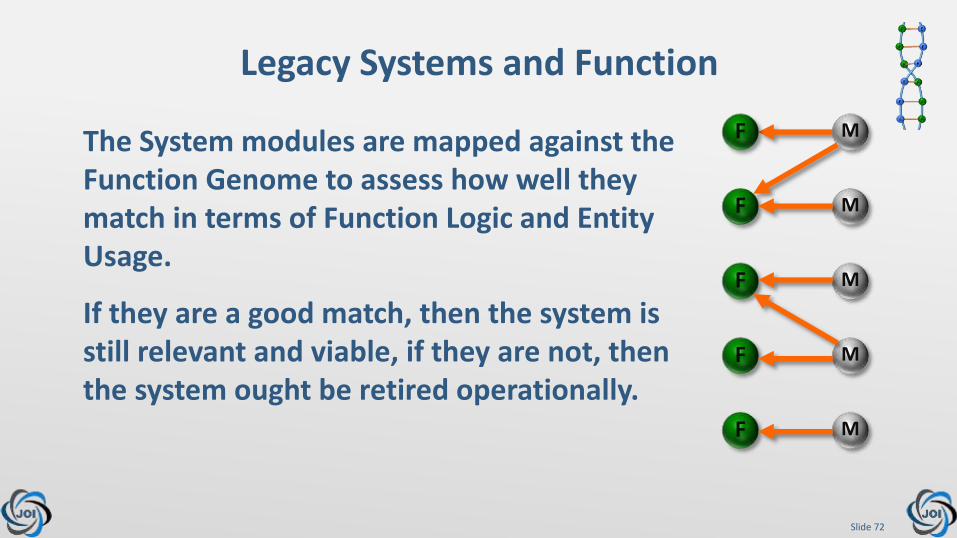
Legacy Systems and Function
The System modules are mapped against the Function Genome to assess how well they match in terms of Function Logic and Entity Usage.
If they are a good match, then the system is still relevant and viable, if they are not, then the system ought be retired operationally.
F
M
M
M
M
MF
F
F
F
Slide 73
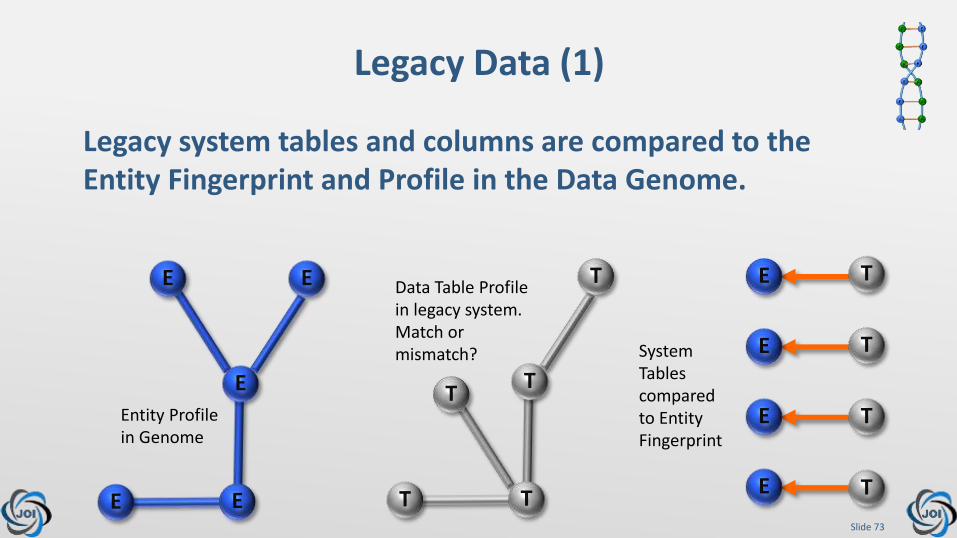
Legacy Data (1)
Legacy system tables and columns are compared to the Entity Fingerprint and Profile in the Data Genome.
E
EE
E
E
T
T
T
T
T
Entity Profile in Genome
Data Table Profile in legacy system. Match or mismatch?
TE
E
E
E
T
T
T
System Tables compared to Entity Fingerprint
Slide 74
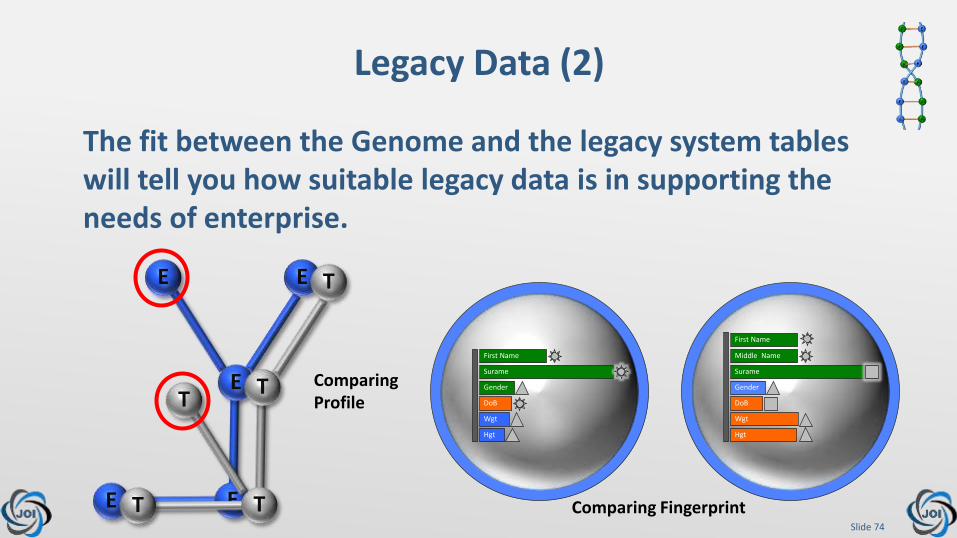
Legacy Data (2)
The fit between the Genome and the legacy system tables will tell you how suitable legacy data is in supporting the needs of enterprise.
E
EE
E
E
T
T
T
T
T Comparing Profile
First Name
Surame
DoB
Gender
Wgt
Hgt
Middle Name
Surame
DoB
Gender
Wgt
Hgt
First Name
Comparing Fingerprint

Slide 75
What happens to an enterprise when it looses sight of its Business Functions?
Question!
It becomes DysFunctional!
When everyone has to deal with a dysfunctional enterprise, strange practices begin to emerge to compensate for the unpredictable behaviour.

Slide 76
It’s Official!
DysFunctional Enterprises Breed Delinquent Data!
Data is created in all sorts of uncoordinated and disjointed ways in all parts of the enterprise – often without any clearly stated purpose.

Slide 77
What’s The Answer?
Good Parenting!
Every Entity needs a Function as a ‘Parent’!
To tell it who it is, why it’s there and how to behave!
Slide 78
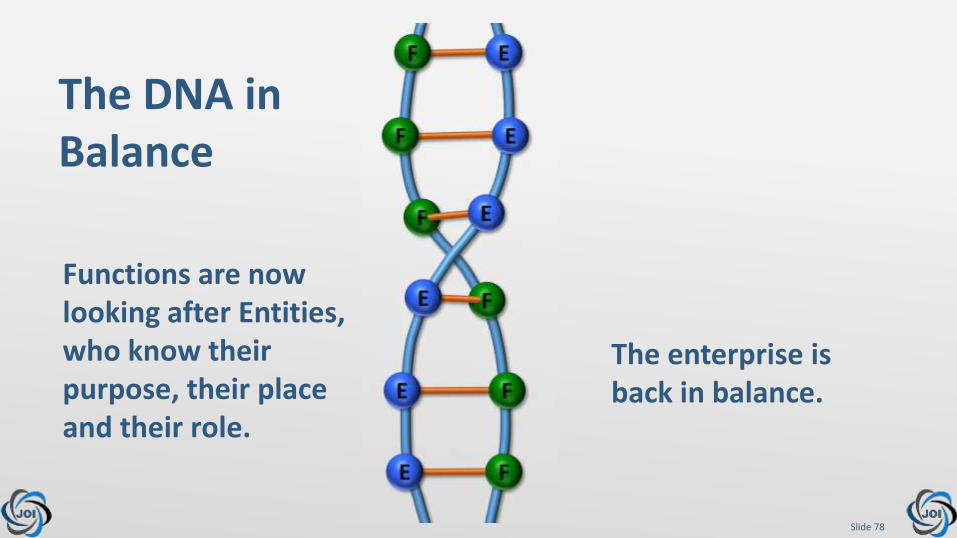
The DNA in Balance
Functions are now looking after Entities, who know their purpose, their place and their role.
The enterprise is back in balance.
Slide 79
So What?
Slide 80
Are There Any Benefits?
1. Data will be created correctly first time, every time.
2. The purpose of every piece of data created will be clearly known.
3. The illusion of ‘data re-use’ will disappear.
4. The required format and structure of all entities will be known by the functions that create them.
5. The functionality and logic to create data correctly first time can be built into applications.

Slide 81
6. The unique identifiers of all entities will be known, preventing duplicates being created.
7. Data will be in the structure required to provide the enterprise with the information it requires.
8. Correct data structures will eliminate the need for complex logic and coding.
9. The use (CRUD) of every item of data will be clearly known across the enterprise.
Are There Any Benefits?
Slide 82
10. The Modelling the ‘what’ of Business Functions will eliminate the ‘illusion of constant change’.
11. The functionality of all applications, 3rd Party and in-house, can be mapped to the Function Genome to establish that they are fit for the enterprise.
12. The data structures of all applications, 3rd Party and in-house, can be compared to the Data Genome to ensure that they will support the information needs of the Business Functions.
Are There Any Benefits?
Slide 83
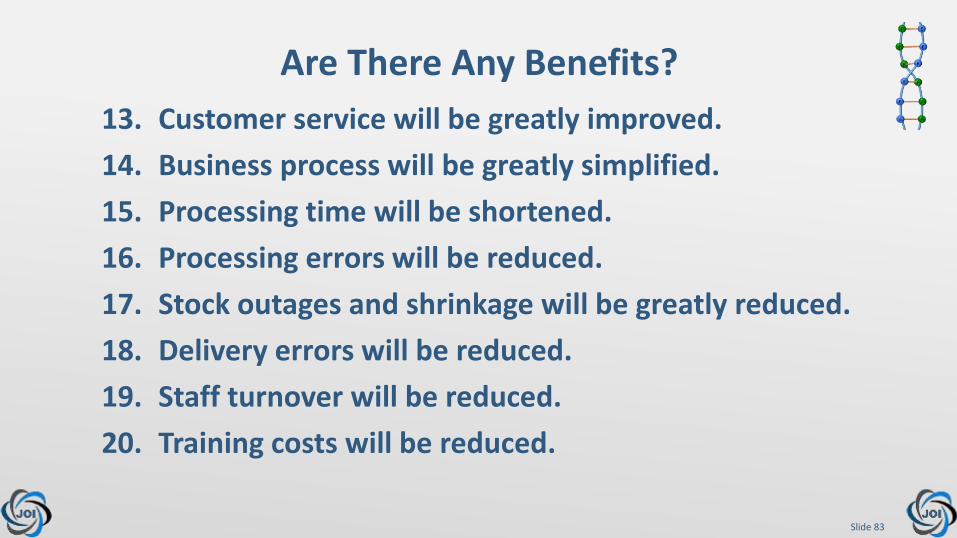
13. Customer service will be greatly improved.
14. Business process will be greatly simplified.
15. Processing time will be shortened.
16. Processing errors will be reduced.
17. Stock outages and shrinkage will be greatly reduced.
18. Delivery errors will be reduced.
19. Staff turnover will be reduced.
20. Training costs will be reduced.
Are There Any Benefits?

Slide 84
21. Time to market for new products will be reduced.
22. New channels to market will be easily added.
23. Compliance in all areas will be higher.
24. Revenues will be increased.
25. Operating costs will be reduced.
26. Profits will be increased.
27. The enterprise will be doing what it ought to have been doing had Business Functions and information remained at the heart of the enterprise.
Are There Any Benefits?
Slide 85
Thank you for your attention
Questions & Answers
Please continue to be
Email: [email protected]: +64 21 774 785Skype: johnowensnz


![Genome-Wide Analysis of the Core DNA Replication ......Genome Analysis Genome-Wide Analysis of the Core DNA Replication Machinery in the Higher Plants Arabidopsis and Rice1[W][OA]](https://img.dokumen.tips/doc/110x75/5f05685d7e708231d412d002/genome-wide-analysis-of-the-core-dna-replication-genome-analysis-genome-wide.jpg)