Embed Size (px)
Citation preview
INTERNAL USE ONLYINTERNAL USE ONLY
Hiroshi Hamasaki Research Fellow, Economic Research Centre, Fujitsu Research Institute
Visiting Fellow, Centre for International Public Policy Studies
Amit Kanudia Partner, KanORS-EMR
Technology Bundle Approach with Parameter
Estimated from Bottom-up Model to Integrate
between Top-down and Bottom-up Model
66th Semi-annual ETSAP meeting, 17-21 November 2014
INTERNAL USE ONLYINTERNAL USE ONLY
Contents
I. Overview of Linkage between CGE and TIMES
II. Top-down Model: CRESH & Tech Bundle Approach in CGE Model
III. Bottom-up Model: JMRT (Japan Multi-Regional Transmission Model)
IV. Test Simulations
V. Lessons
Copyright 2014 FUJITSU RESEACH INSTITUTE 1
INTERNAL USE ONLYINTERNAL USE ONLY
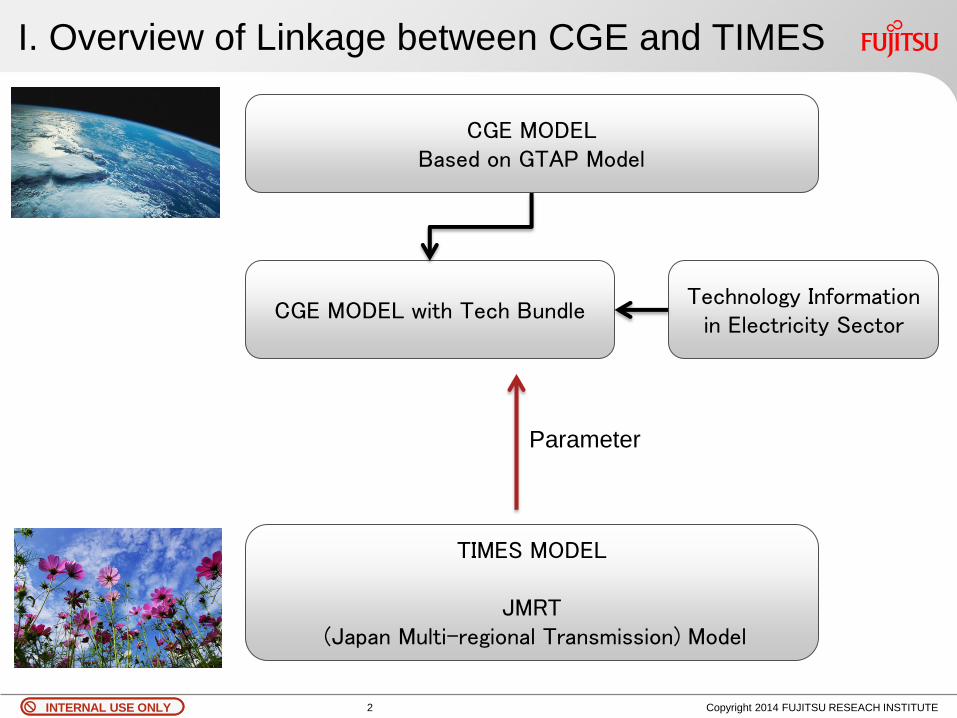
I. Overview of Linkage between CGE and TIMES
Copyright 2014 FUJITSU RESEACH INSTITUTE 2
TIMES MODEL
JMRT (Japan Multi-regional Transmission) Model
CGE MODEL Based on GTAP Model
CGE MODEL with Tech Bundle Technology Information
in Electricity Sector
Parameter

INTERNAL USE ONLYINTERNAL USE ONLY
II. TOP-DOWN MODEL: CRESH & TECH BUNDLE APPROACH IN CGE MODEL
Copyright 2014 FUJITSU RESEACH INSTITUTE 3
INTERNAL USE ONLYINTERNAL USE ONLY
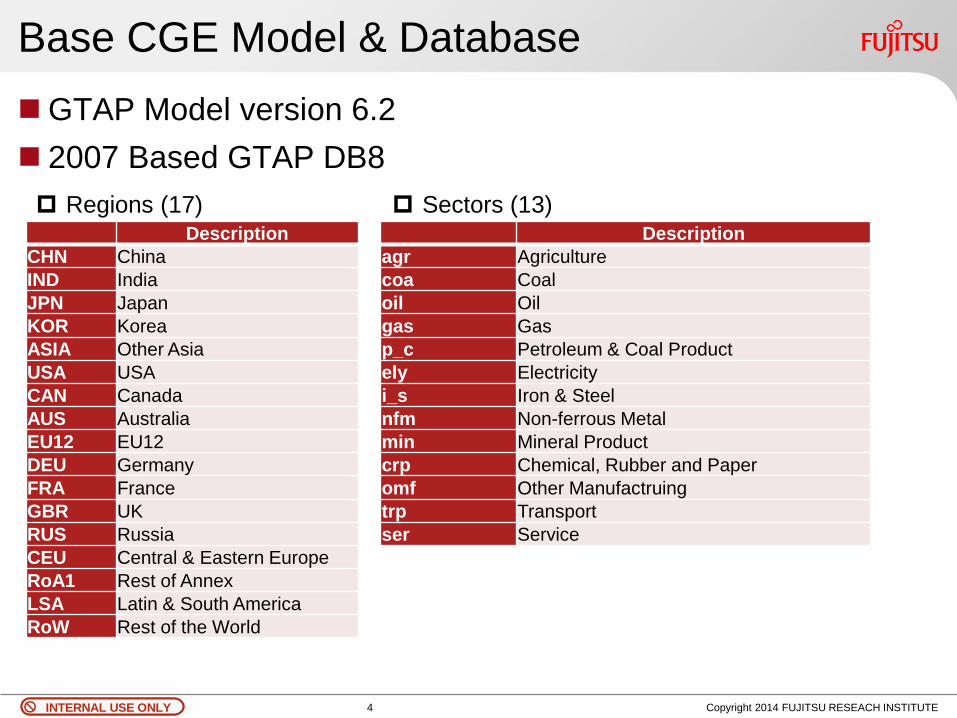
Base CGE Model & Database
GTAP Model version 6.2
2007 Based GTAP DB8
Copyright 2014 FUJITSU RESEACH INSTITUTE 4
Description CHN China IND India JPN Japan KOR Korea ASIA Other Asia USA USA CAN Canada AUS Australia EU12 EU12 DEU Germany FRA France GBR UK RUS Russia CEU Central & Eastern Europe RoA1 Rest of Annex LSA Latin & South America RoW Rest of the World
Description agr Agriculture coa Coal oil Oil gas Gas p_c Petroleum & Coal Product ely Electricity i_s Iron & Steel nfm Non-ferrous Metal min Mineral Product crp Chemical, Rubber and Paper omf Other Manufactruing trp Transport ser Service
Sectors (13) Regions (17)

INTERNAL USE ONLYINTERNAL USE ONLY
Step 1: Include “E” part in Conventional CGE
Copyright 2014 FUJITSU RESEARCH INSTITUTE 5
Output
VA
K L Intermediate
Output
VA
Capital-Energy
Composite
L Intermediate
Electricity Non-Electricity
Coal Non-Coal
Gas Oil Petroleum
Product
Conventional CGE CGE Reflects “E” Part
Capital Energy
• This assumes that there is only one electricity generation technology.
• This reflects just fuel-substitution, but technology substitutions.
• Some of technologies do not use fossil fuels.

INTERNAL USE ONLYINTERNAL USE ONLY
Step 2: Technology Bundle in Japan Ely
Copyright 2014 FUJITSU RESEARCH INSTITUTE
E G H
E
K
L
Nuc Gas Coal PV
Ely_Nuc
Generation
VA
Capital-Energy
Composite
L Intermediate
Electricity Non-Electricity
Coal Non-Coal
Gas Oil Petroleum
Product
Capital Energy
Ely_Nuc Ely_Oil Ely_Gas Ely_Coal
Distribution
+Sales
+
Generation Technology
Distribution & Sales
Electricity 𝝈 = 𝟎 I-O Table
INTERNAL USE ONLYINTERNAL USE ONLY
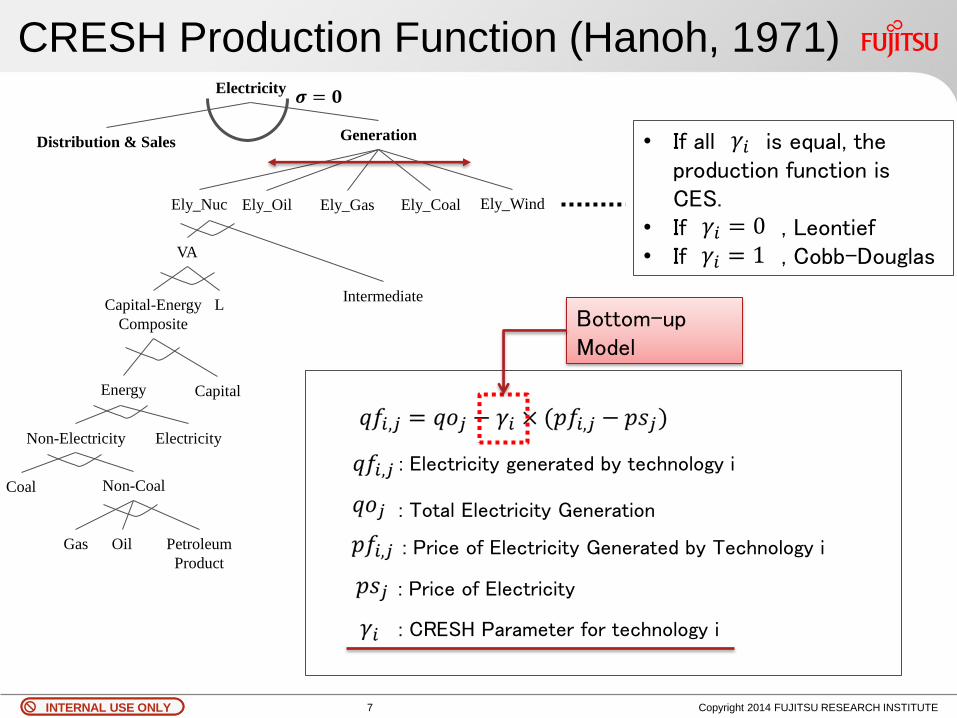
• If all is equal, the production function is CES.
• If , Leontief • If , Cobb-Douglas
CRESH Production Function (Hanoh, 1971)
Copyright 2014 FUJITSU RESEARCH INSTITUTE 7
Ely_Nuc
Generation
Ely_Oil Ely_Gas Ely_Coal Ely_Wind
: Electricity generated by technology i
: Total Electricity Generation
: Price of Electricity Generated by Technology i
: Price of Electricity
: CRESH Parameter for technology i
Bottom-up Model
VA
Capital-Energy
Composite
L Intermediate
Electricity Non-Electricity
Coal Non-Coal
Gas Oil Petroleum
Product
Capital Energy
𝛾𝑖
𝛾𝑖 = 1
𝛾𝑖 = 0
Distribution & Sales
Electricity 𝝈 = 𝟎

INTERNAL USE ONLYINTERNAL USE ONLY
III. BOTTOM-UP MODEL: JAPAN MULTI-REGIONAL TRANSMISSION (JMRT) MODEL
8 Copyright 2014 FUJITSU RESEARCH INSTITUTE
INTERNAL USE ONLYINTERNAL USE ONLY
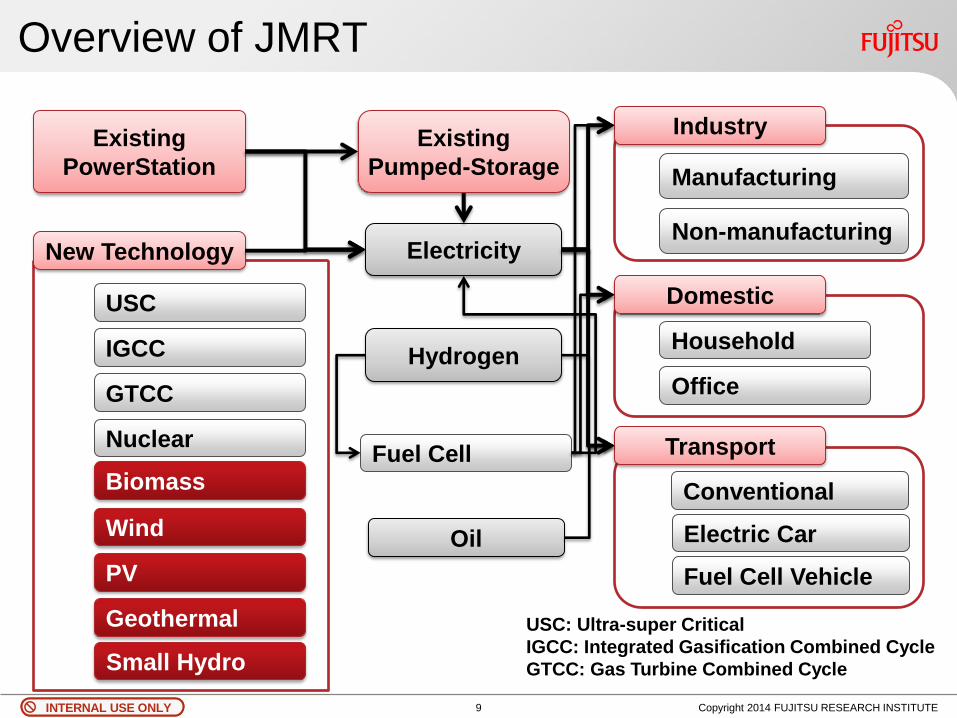
Overview of JMRT
9 Copyright 2014 FUJITSU RESEARCH INSTITUTE
Existing
PowerStation
Electricity New Technology
USC
Industry
Domestic
Transport
IGCC
GTCC
Nuclear
Manufacturing
Non-manufacturing
Household
Office
Small Hydro
Wind
PV
Geothermal
Existing
Pumped-Storage
USC: Ultra-super Critical
IGCC: Integrated Gasification Combined Cycle
GTCC: Gas Turbine Combined Cycle
Biomass
Oil
Conventional
Electric Car
Fuel Cell Vehicle
Hydrogen
Fuel Cell

INTERNAL USE ONLYINTERNAL USE ONLY
10 Grids and Grid Connections
Copyright 2014 FUJITSU RESEACH INSTITUTE 10
0.6GW
6GW
0.9GW
0.3GW
5.57GW
1.4GW
16.66GW
5.57GW
5.57GW
2.4GW

INTERNAL USE ONLYINTERNAL USE ONLY
12 Time Slices
3 Time Periods
Day(8~13、16~23)
Peak(14~15)
Night(0~7)
4 Seasons
Spring(3~6)
Summer(7~9)
Autumn(10~12)
Winter(1~2)
11 Copyright 2014 FUJITSU RESEARCH INSTITUTE
Load Curve in Most Electricity Consumed day
Million kW
Peak Demand in each Year
Million kW
hr
month

INTERNAL USE ONLYINTERNAL USE ONLY
Existing PowerStation Data
12 Copyright 2014 FUJITSU RESEACH INSTITUTE
Existing PowerStation Data include •Type of PowerStation •Latitude, Longitude •Prefecture •Start Year •Life Time •Electricity Generation Capacity •Availability Factor (AF)

INTERNAL USE ONLYINTERNAL USE ONLY
Data of Renewable Potential
13 Copyright 2014 FUJITSU RESEARCH INSTITUTE
No. Prefecture
Code Lati-
tude Long-
itude Wind
Speed
1
2
3
Geothermal
Offshore Wind
Onshore Wind
GIS Data is from MOE Potential Survey
Huge Renewable Potential in Hokkaido Area.
Huge Electricity Consumption in Kanto Area including Tokyo.
1 km
mesh

INTERNAL USE ONLYINTERNAL USE ONLY
Geological Information (e.g. offshore wind)
14 Copyright 2014 FUJITSU RESEARCH INSTITUTE
Wind Speed
Availability Factor
Wind Speed
(m/s) AF
(%)
5.5 15.8%
6 19.7%
6.5 23.5%
7 27.3%
7.5 31.0%
8 34.5%
8.5 37.9%
Distance
from road
Sea Depth
(Offshore)
Distance
from grid
Initial Cost
More than 20,000V
http://www.gsi.go.jp/KIDS/
map-sign-tizukigou-h07-
02-01soudensen.htm
INTERNAL USE ONLYINTERNAL USE ONLY
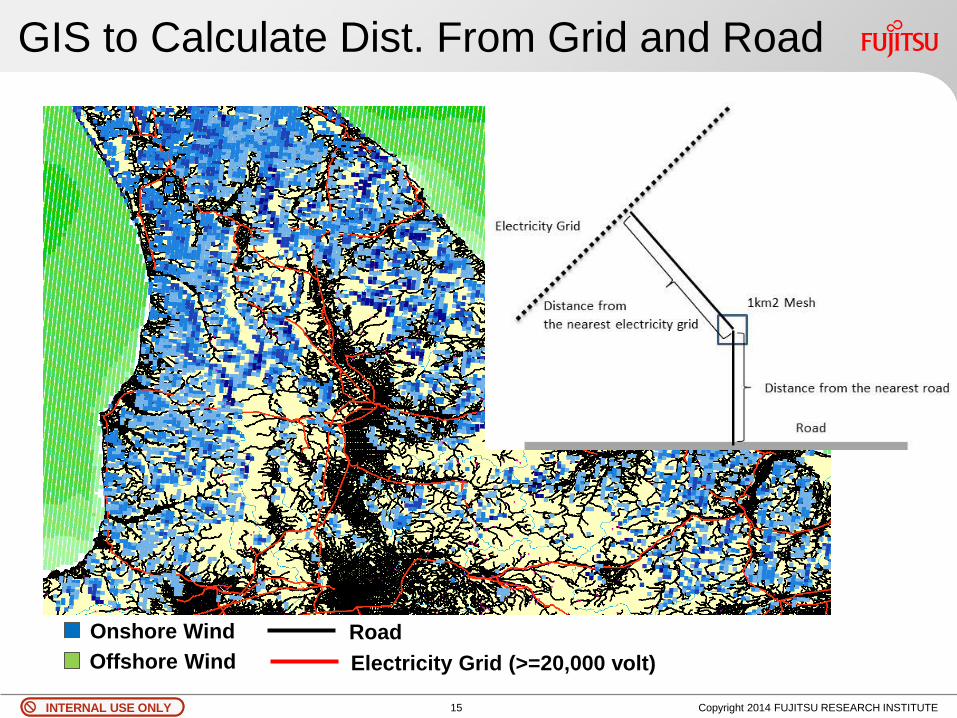
GIS to Calculate Dist. From Grid and Road
15 Copyright 2014 FUJITSU RESEARCH INSTITUTE
Onshore Wind
Offshore Wind
Road
Electricity Grid (>=20,000 volt)
INTERNAL USE ONLYINTERNAL USE ONLY
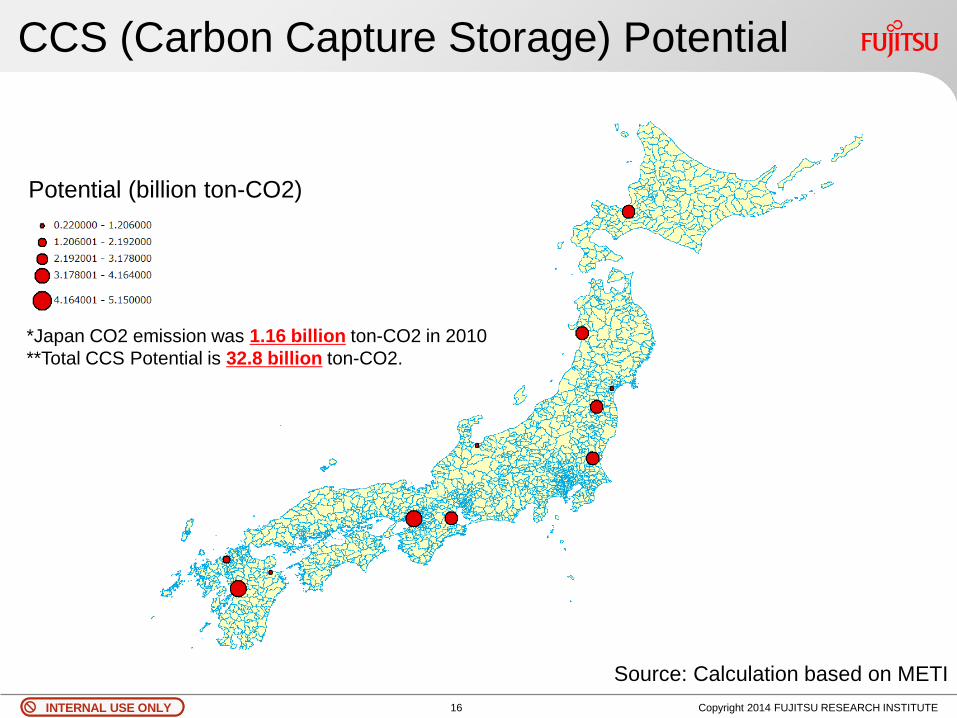
CCS (Carbon Capture Storage) Potential
16 Copyright 2014 FUJITSU RESEARCH INSTITUTE
Source: Calculation based on METI
Potential (billion ton-CO2)
*Japan CO2 emission was 1.16 billion ton-CO2 in 2010
**Total CCS Potential is 32.8 billion ton-CO2.
INTERNAL USE ONLYINTERNAL USE ONLY
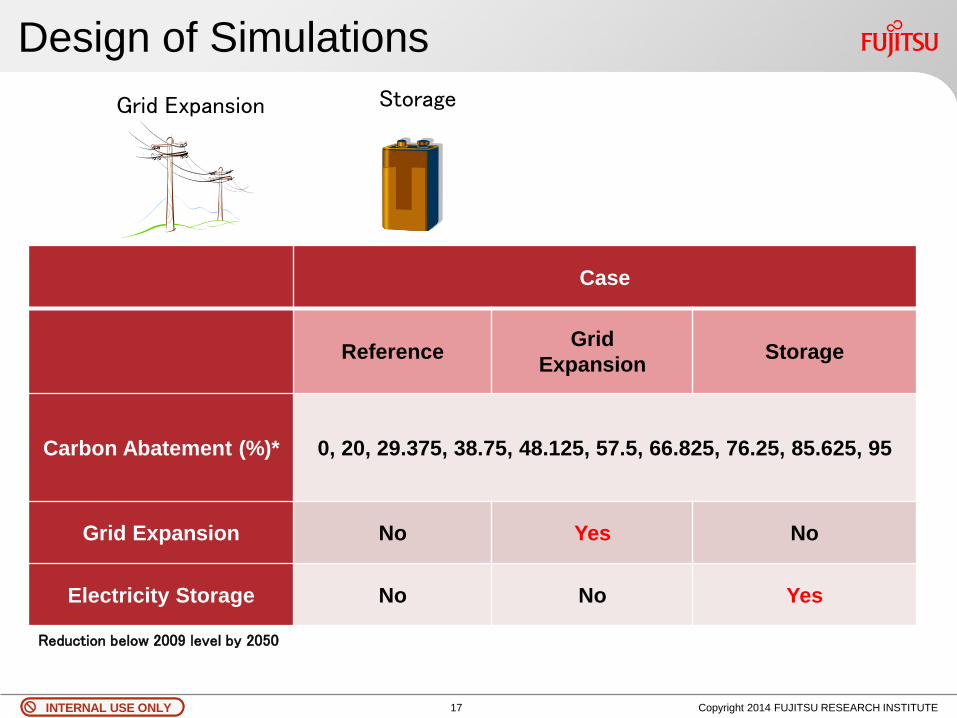
Design of Simulations
17 Copyright 2014 FUJITSU RESEARCH INSTITUTE
Case
Reference Grid
Expansion Storage
Carbon Abatement (%)* 0, 20, 29.375, 38.75, 48.125, 57.5, 66.825, 76.25, 85.625, 95
Grid Expansion No Yes No
Electricity Storage No No Yes
Grid Expansion
Reduction below 2009 level by 2050
Storage

INTERNAL USE ONLYINTERNAL USE ONLY
Parameter Estimation
18 Copyright 2014 FUJITSU RESEARCH INSTITUTE
JMRT Model
CRESH Production Function
i
CRESH Parameter

INTERNAL USE ONLYINTERNAL USE ONLY
Onshore Wind
There are huge onshore wind potentials in north part of Japan, Hokkaido, but electricity demands are done in Tokyo. There is very weak grid connection between Hokkaido and Japan main land and the capacity of grid connection is mere 60GW. Grid expansion make possible to access to Hokkaido on-shore wind potential.
In addition, storage also plays a role to boost onshore wind. Onshore is intermittent generation technology and storage will charge excess generation from onshore wind and discharge when generated electricity is less than demand.
19 Copyright 2014 FUJITSU RESEARCH INSTITUTE
Technology
Onshore
Condition
Reference 1.65***
Storage 5.76***
GE 3.54 ***
***: 0.0001, **:0.001, *:0.01

INTERNAL USE ONLYINTERNAL USE ONLY
Demand & RE Potential
20 Copyright 2014 FUJITSU RESEARCH INSTITUTE
Twh
High Demand Low RE Potential
Low Demand High RE Potential
Weak Connection 0.6GW

INTERNAL USE ONLYINTERNAL USE ONLY
Solar
21 Copyright 2014 FUJITSU RESEARCH INSTITUTE
Elasticity is the biggest in storage scenario and storage will work as back-up battery for solar to match between demand and supply. The potential of solar are geologically equally distributed in Japan and geological un-matching between potential and electricity demands are not big.
Technology
Solar
Condition
Reference 1.24***
Storage 3.59***
GE 1.23***
***: 0.0001, **:0.001, *:0.01
INTERNAL USE ONLYINTERNAL USE ONLY
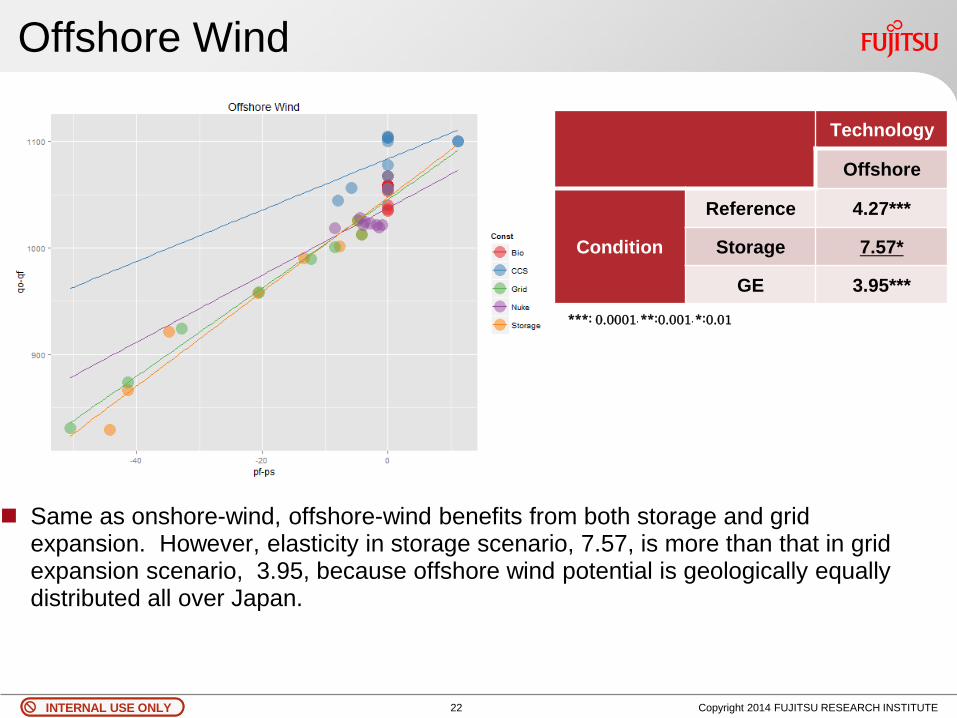
Offshore Wind
22 Copyright 2014 FUJITSU RESEARCH INSTITUTE
Same as onshore-wind, offshore-wind benefits from both storage and grid expansion. However, elasticity in storage scenario, 7.57, is more than that in grid expansion scenario, 3.95, because offshore wind potential is geologically equally distributed all over Japan.
Technology
Offshore
Condition
Reference 4.27***
Storage 7.57*
GE 3.95***
***: 0.0001, **:0.001, *:0.01
INTERNAL USE ONLYINTERNAL USE ONLY
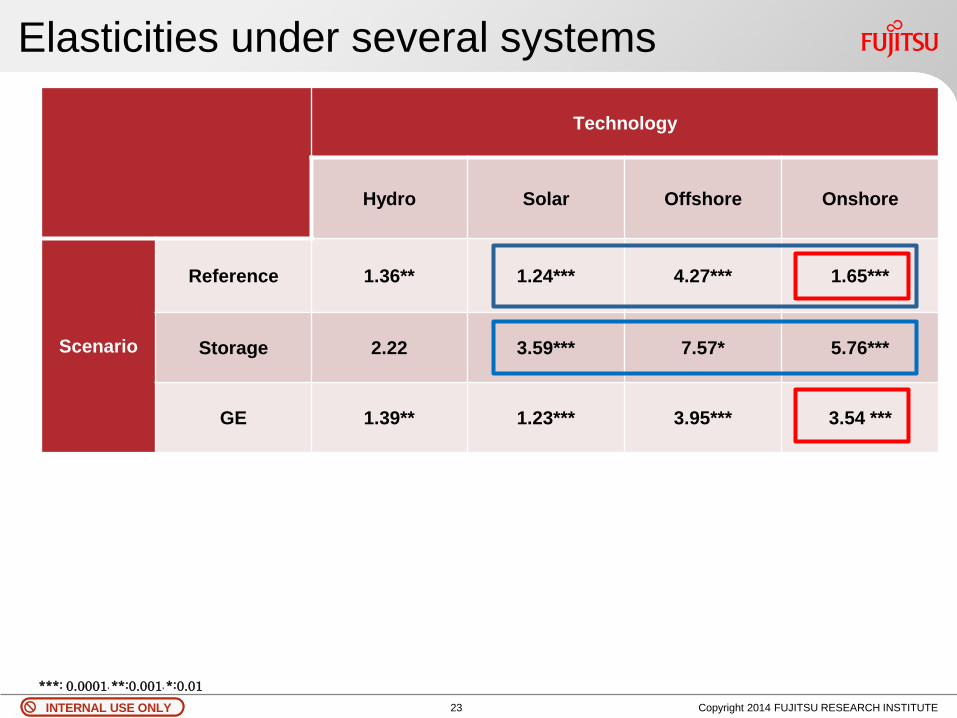
Elasticities under several systems
23 Copyright 2014 FUJITSU RESEARCH INSTITUTE
Technology
Hydro Solar Offshore Onshore
Scenario
Reference 1.36** 1.24*** 4.27*** 1.65***
Storage 2.22 3.59*** 7.57* 5.76***
GE 1.39** 1.23*** 3.95*** 3.54 ***
***: 0.0001, **:0.001, *:0.01

INTERNAL USE ONLYINTERNAL USE ONLY
IV. TEST SIMULATIONS
24 Copyright 2014 FUJITSU RESEARCH INSTITUTE

INTERNAL USE ONLYINTERNAL USE ONLY
Application to the case of JAPAN
Japan’s fulfillment of Kyoto Obligation with no international emission
trade and under various assumptions regarding the electricity sector:
REF: Reference
GE: Grid Expansion Case
STO: Storage Case
Copyright 2014 FUJITSU RESEACH INSTITUTE 25
INTERNAL USE ONLYINTERNAL USE ONLY
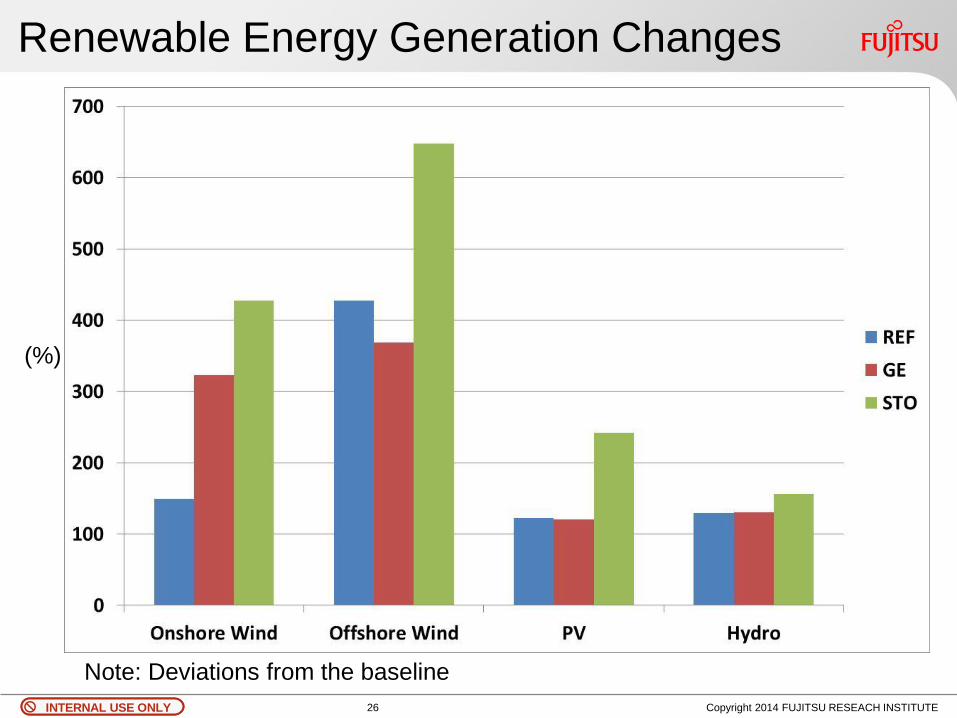
Renewable Energy Generation Changes
Copyright 2014 FUJITSU RESEACH INSTITUTE 26
(%)
Note: Deviations from the baseline
INTERNAL USE ONLYINTERNAL USE ONLY
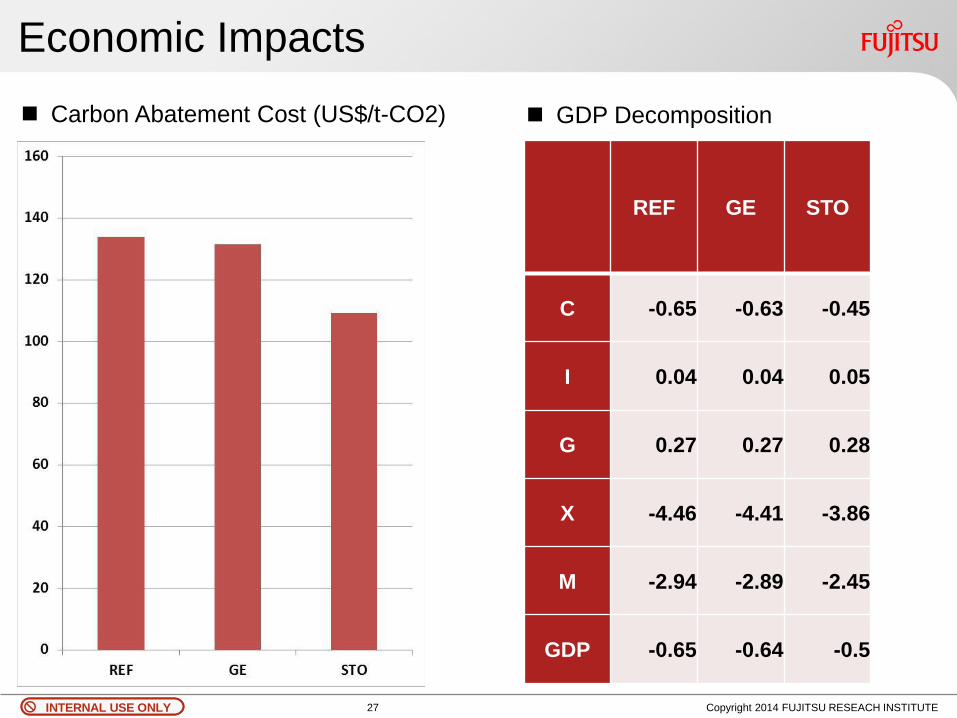
Economic Impacts
Copyright 2014 FUJITSU RESEACH INSTITUTE 27
REF GE STO
C -0.65 -0.63 -0.45
I 0.04 0.04 0.05
G 0.27 0.27 0.28
X -4.46 -4.41 -3.86
M -2.94 -2.89 -2.45
GDP -0.65 -0.64 -0.5
Carbon Abatement Cost (US$/t-CO2) GDP Decomposition

INTERNAL USE ONLYINTERNAL USE ONLY
V. Lessons
Conventional top-down model fails to represent substantially different technological futures.
Common deficiency of tech-bundle CGE is the lack of the real estimates for the model parameters.
Using parameter estimated by detailed bottom-up which is complex enough make top-down model reflect technology completeness.
Reflect the characteristics of each technology
Reflect system changes
Copyright 2014 FUJITSU RESEACH INSTITUTE 28
INTERNAL USE ONLYINTERNAL USE ONLY
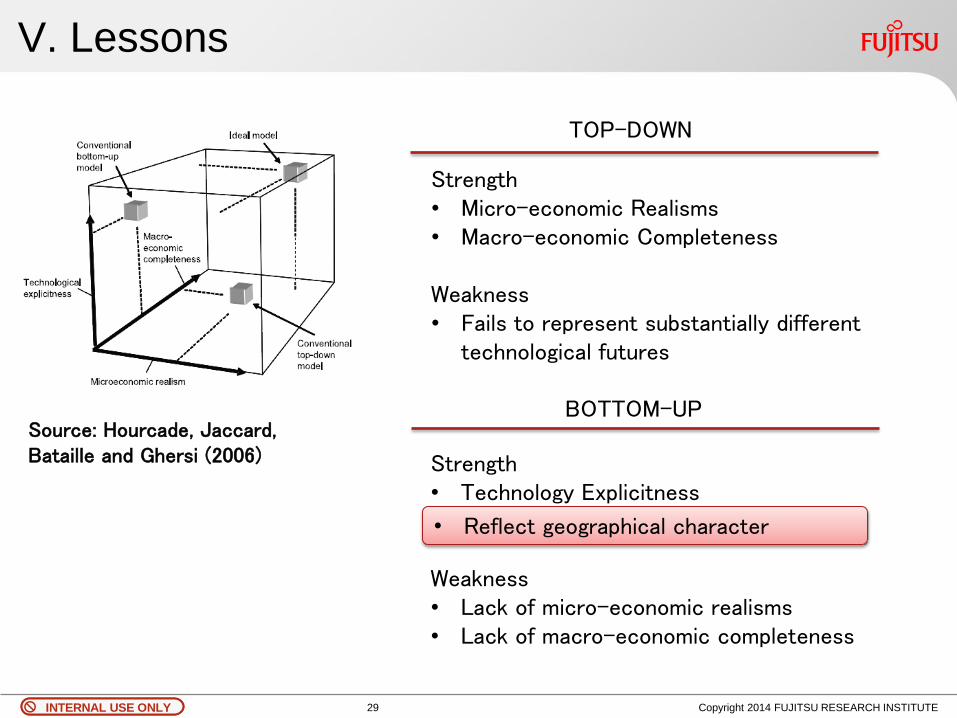
V. Lessons
Copyright 2014 FUJITSU RESEARCH INSTITUTE
Source: Hourcade, Jaccard, Bataille and Ghersi (2006)
29
TOP-DOWN
Strength • Micro-economic Realisms • Macro-economic Completeness Weakness • Fails to represent substantially different
technological futures
BOTTOM-UP
Strength • Technology Explicitness
Weakness • Lack of micro-economic realisms • Lack of macro-economic completeness
• Reflect geographical character

INTERNAL USE ONLYINTERNAL USE ONLY 30
Copyright 2011 FUJITSU RESEARCH
INSTITUTE
INTERNAL USE ONLYINTERNAL USE ONLY
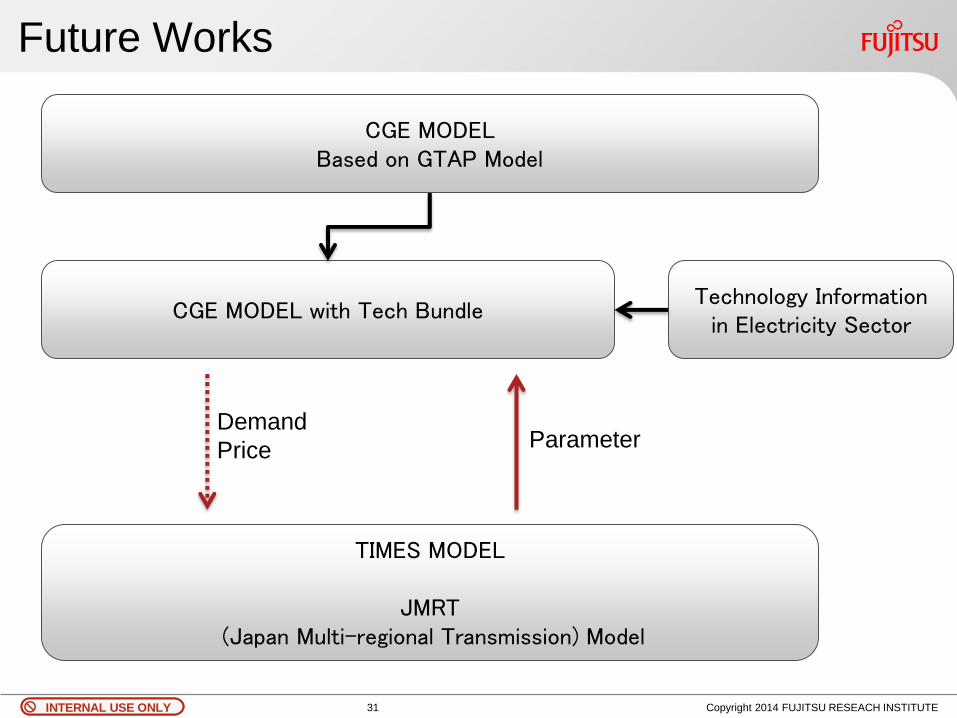
Future Works
Copyright 2014 FUJITSU RESEACH INSTITUTE 31
TIMES MODEL
JMRT (Japan Multi-regional Transmission) Model
CGE MODEL Based on GTAP Model
CGE MODEL with Tech Bundle Technology Information
in Electricity Sector
Parameter Demand
Price

INTERNAL USE ONLYINTERNAL USE ONLY
Hydrogen Cycle
Copyright 2014 FUJITSU RESEARCH
INSTITUTE
H2
H2
Transport
Buildings
Hydrogen Station
Hydrogen
Electricity
Heat
Electricity
INTERNAL USE ONLYINTERNAL USE ONLY
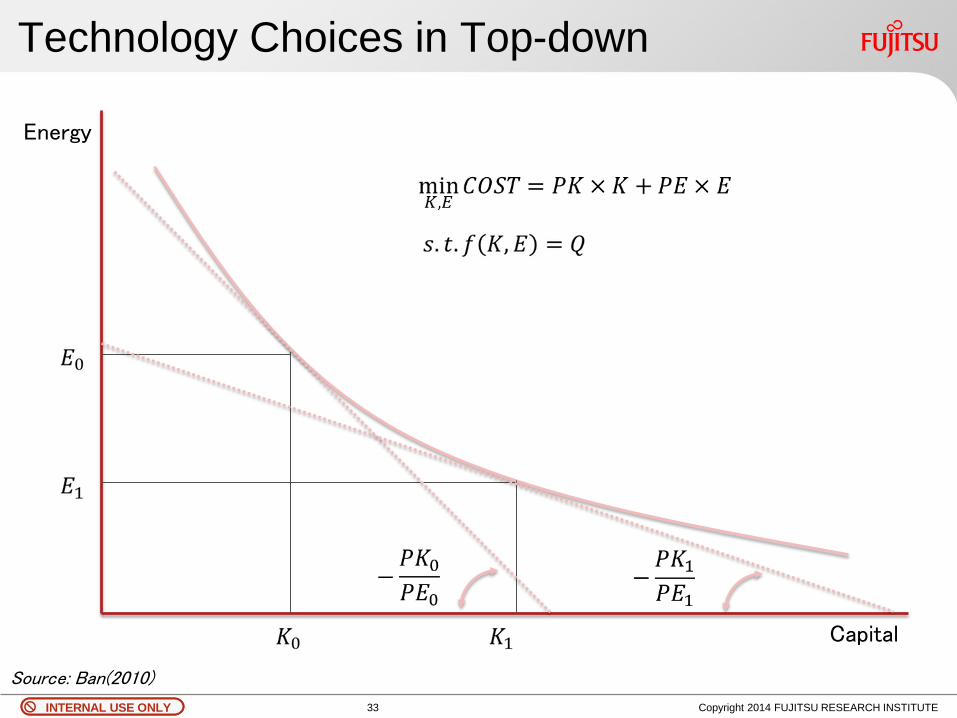
Technology Choices in Top-down
Copyright 2014 FUJITSU RESEARCH INSTITUTE 33
Capital
Energy
Source: Ban(2010)
INTERNAL USE ONLYINTERNAL USE ONLY
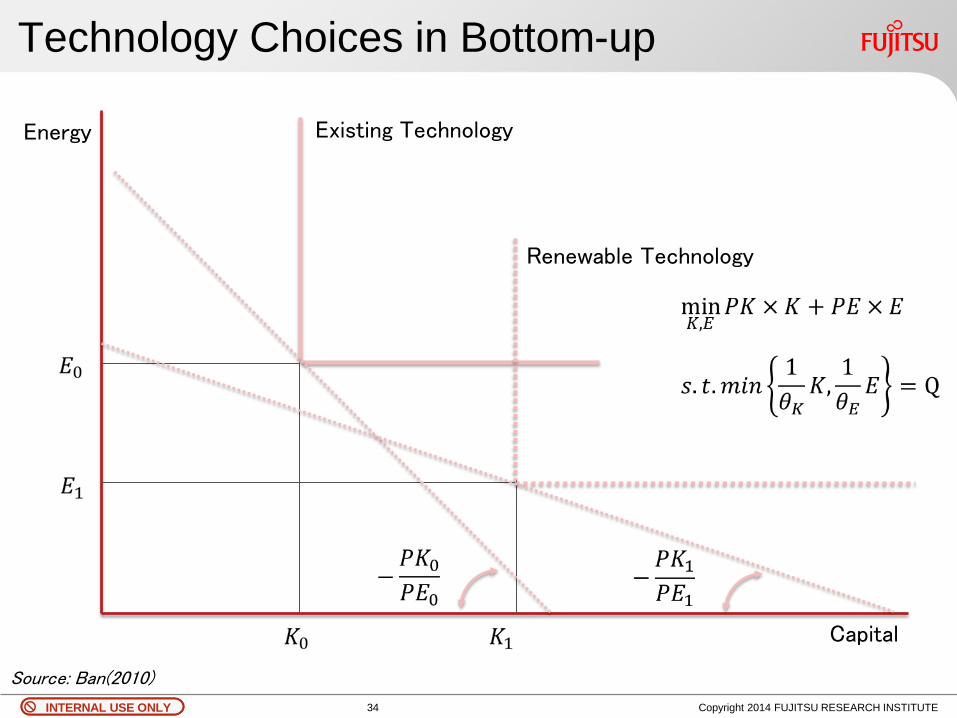
Technology Choices in Bottom-up
Copyright 2014 FUJITSU RESEARCH INSTITUTE 34
Capital
Energy Existing Technology
Renewable Technology
Source: Ban(2010)