Embed Size (px)
Citation preview

Geosocial intelligence: assisting flood
mitigation
Robert Ogie Smart Infrastructure Facility, University of Wollongong
May, 2016

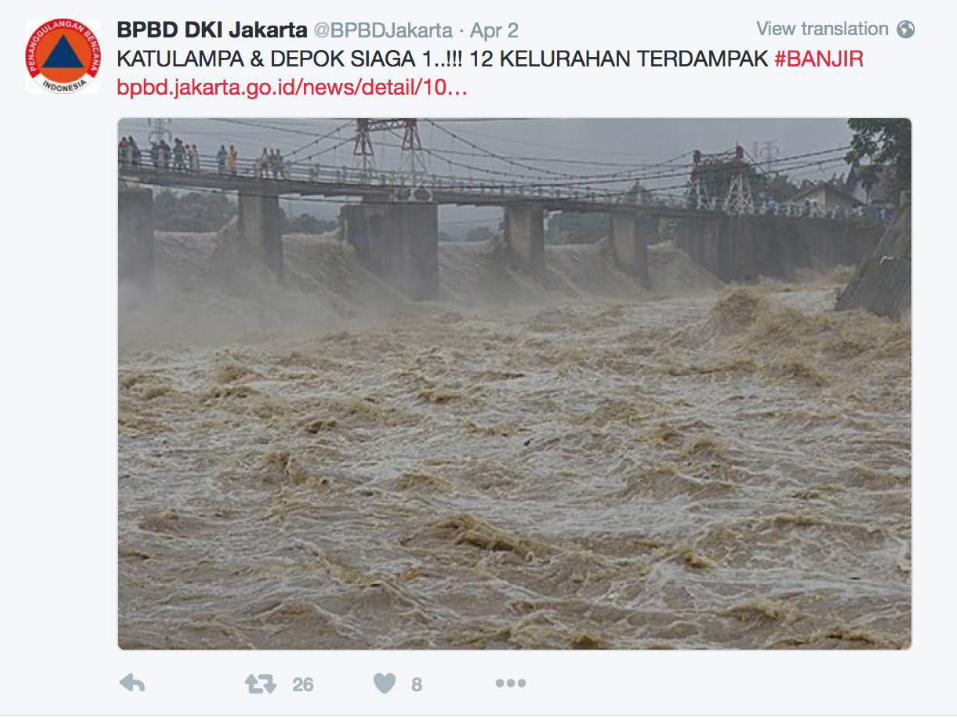
Source: Adi Weda EPA

Source: Twitter @ TMCPoldaMetro


Flood exposure in coastal mega-cities
• 890 million city residents are currently exposed to natural disasters, including
flooding
• Average annual global flood losses: $6 billion (2005) $1 trillion (2050)
• Climate change + subsiding land + population explosion + rapid urbanization = increased exposure to flood hazards The situation is far more complicated in developing nations • Climate change + subsiding land + population explosion + rapid urbanization + infrastructure fragility + human factors (e.g. trash dumps) + data scarcity = increased exposure to flood hazards

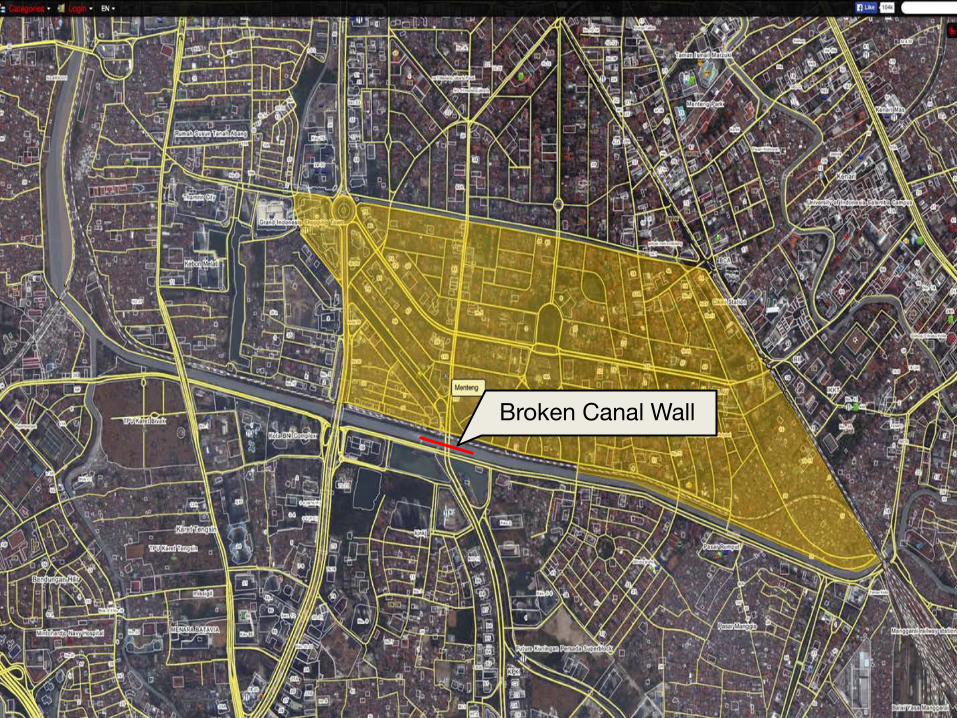
Broken Canal Wall
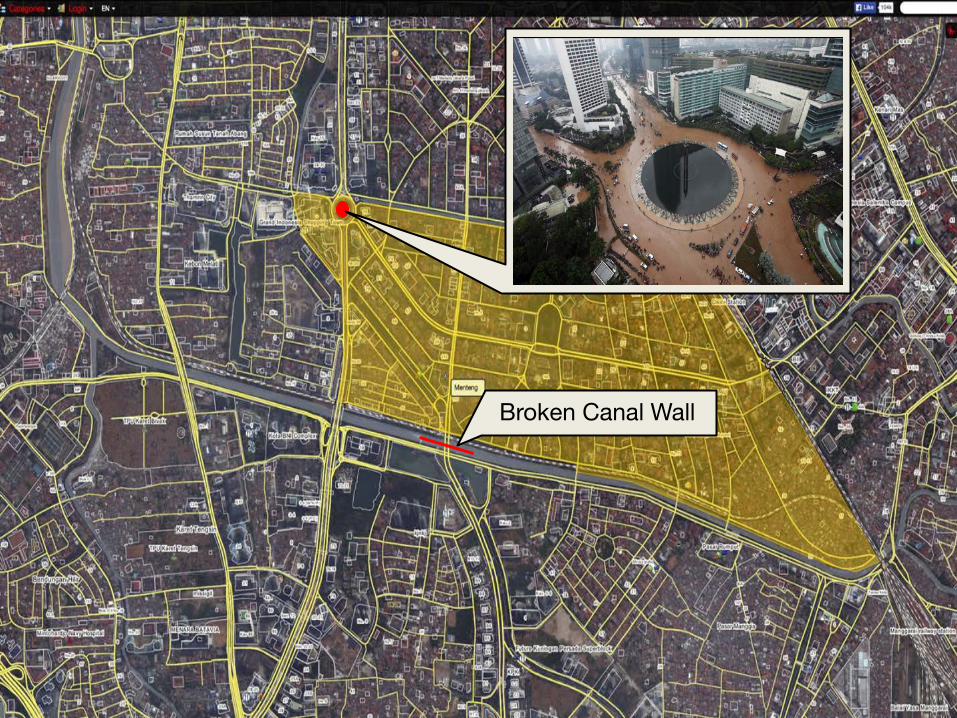
Broken Canal Wall


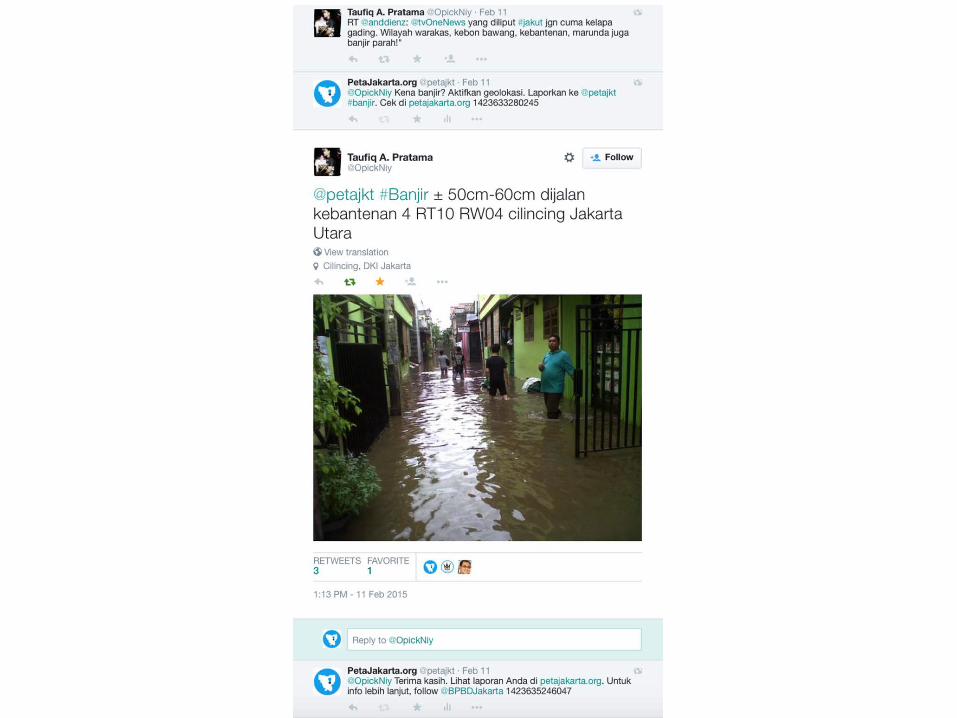
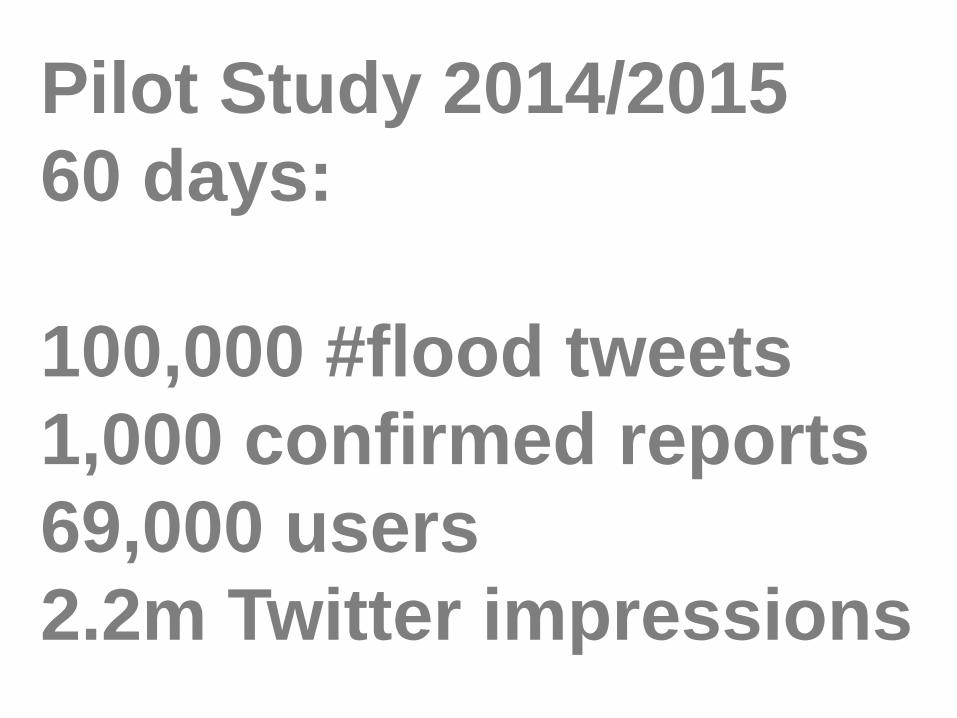
Pilot Study 2014/2015 60 days: 100,000 #flood tweets 1,000 confirmed reports 69,000 users 2.2m Twitter impressions

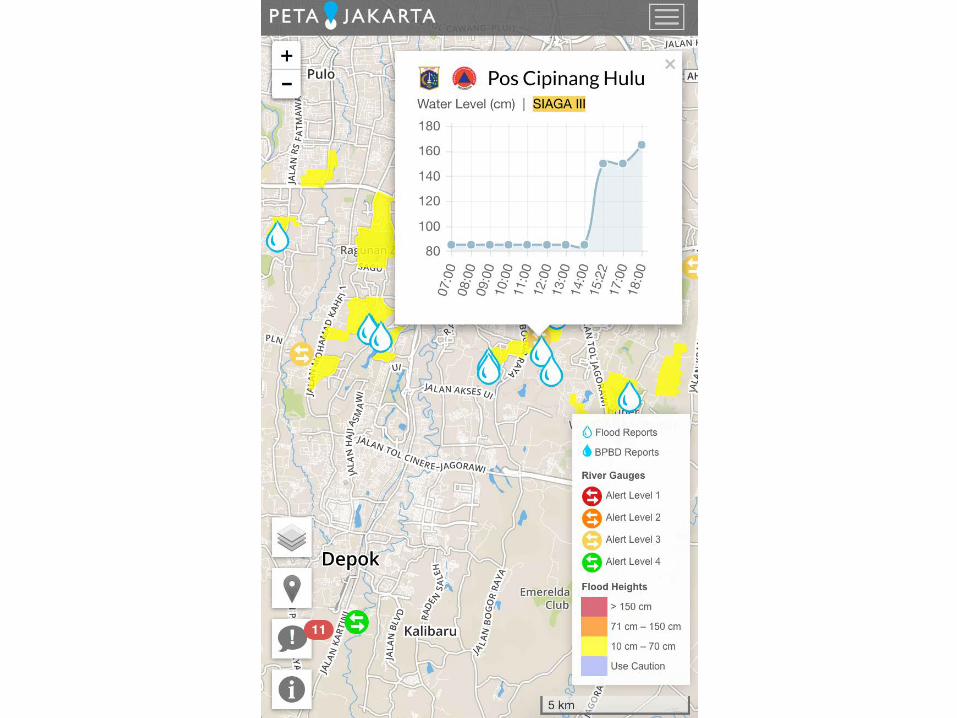
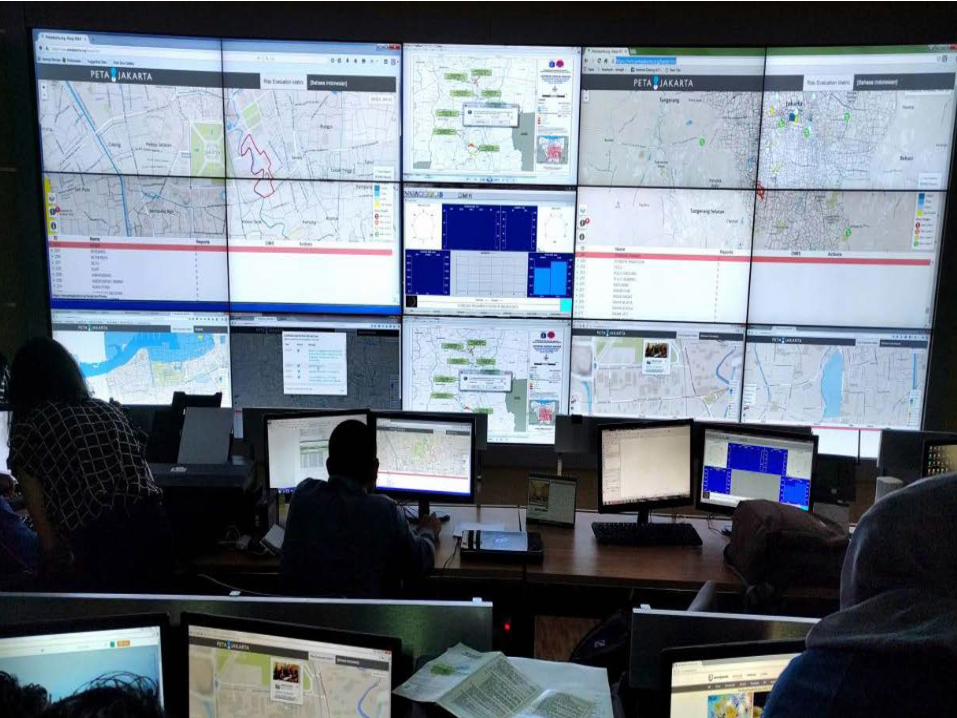
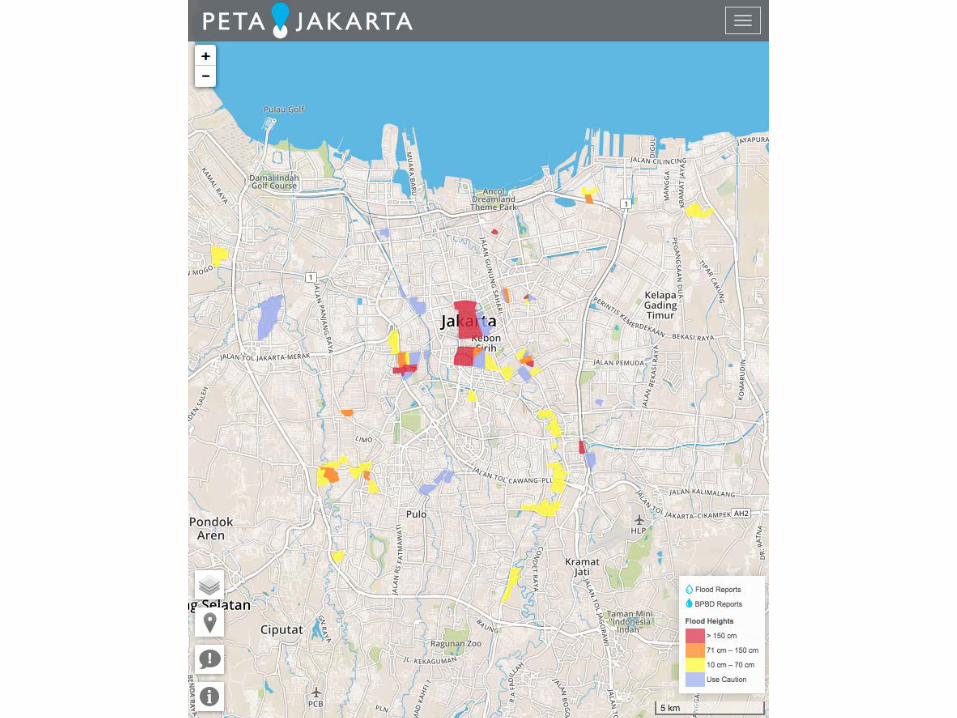
www.petajakarta.org

Proactive response to flood disasters • How can we make more informed decision related to the use of pumps
and floodgates to control floods, such that excessive pressure created by accumulating floodwater does not result in structural failure and flooding due to infrastructure fragility?
• How can we identify the floodgates that are most vulnerable to failure or
damage due the impact of flood waters, so that limited resources can be judiciously allocated for maintenance and flood preparedness?
• How can we identify the pumping stations that are most vulnerable to failure due to trash blockage, so that limited resources can be judiciously allocated for maintenance and flood preparedness?
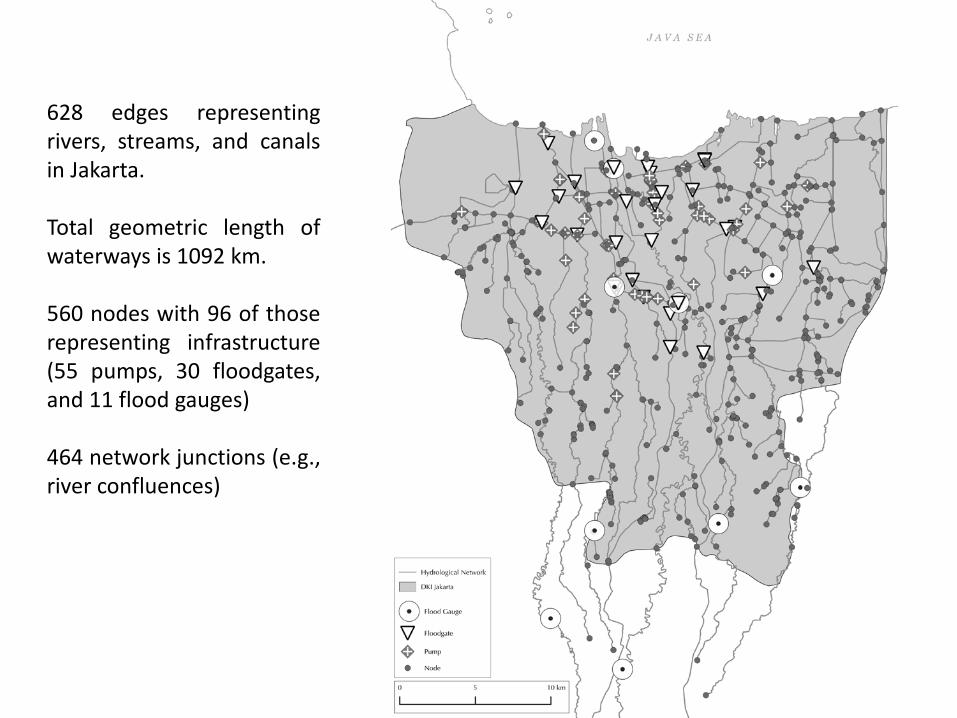
628 edges representing rivers, streams, and canals in Jakarta. Total geometric length of waterways is 1092 km. 560 nodes with 96 of those representing infrastructure (55 pumps, 30 floodgates, and 11 flood gauges) 464 network junctions (e.g., river confluences)
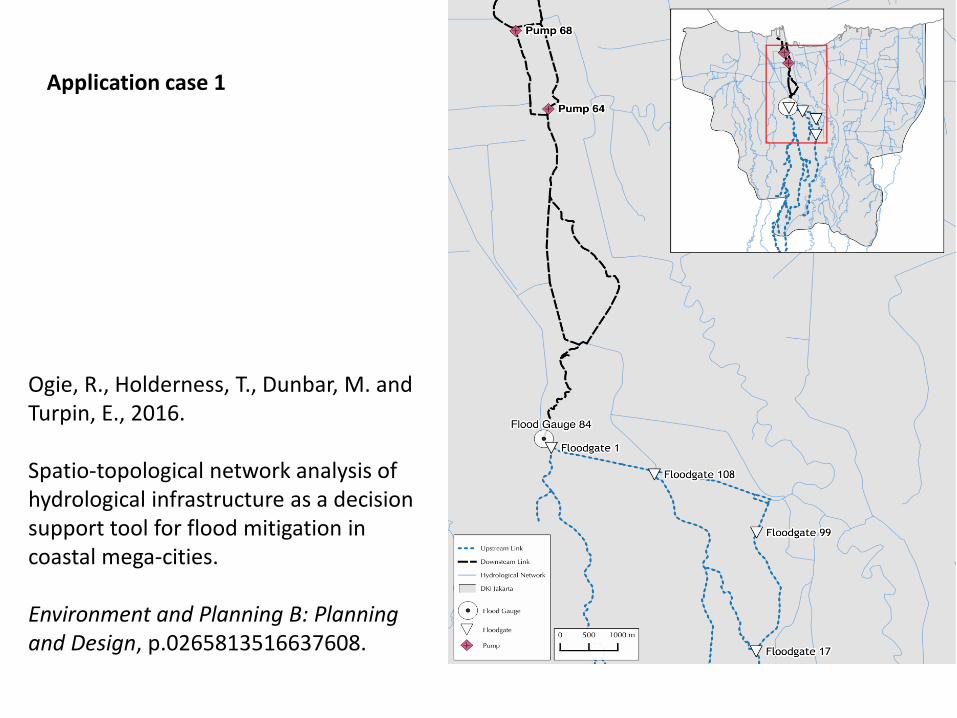
Ogie, R., Holderness, T., Dunbar, M. and Turpin, E., 2016. Spatio-topological network analysis of hydrological infrastructure as a decision support tool for flood mitigation in coastal mega-cities. Environment and Planning B: Planning and Design, p.0265813516637608.
Application case 1

Application case 1 continues……
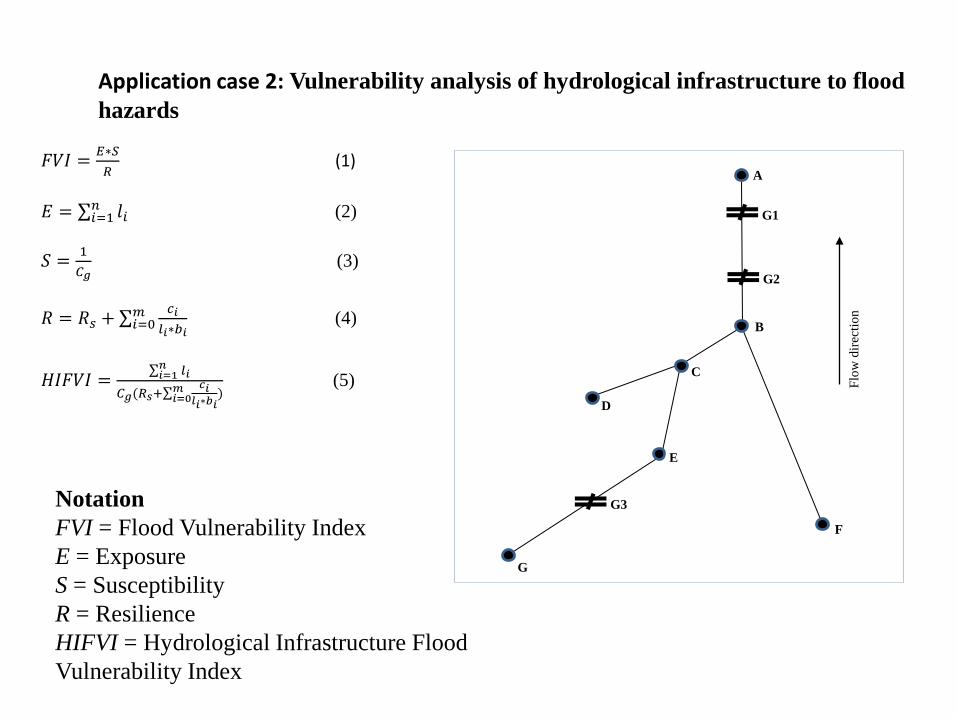
𝐹𝐹𝐼 = 𝐸∗𝑆𝑅
(1) 𝐸 = ∑ 𝑙𝑖𝑛
𝑖=1 (2) 𝑆 = 1
𝐶𝑔 (3)
𝑅 = 𝑅𝑠 + ∑ 𝑐𝑖
𝑙𝑖∗𝑏𝑖𝑚𝑖=0 (4)
𝐻𝐼𝐹𝐹𝐼 = ∑ 𝑙𝑖𝑛𝑖=1
𝐶𝑔(𝑅𝑠+∑𝑐𝑖
𝑙𝑖∗𝑏𝑖𝑚𝑖=0 )
(5)
Application case 2: Vulnerability analysis of hydrological infrastructure to flood hazards
Notation FVI = Flood Vulnerability Index E = Exposure S = Susceptibility R = Resilience HIFVI = Hydrological Infrastructure Flood Vulnerability Index
A
G1
G3
G2
B
G
D
E
C
F
Flow
dire
ctio
n
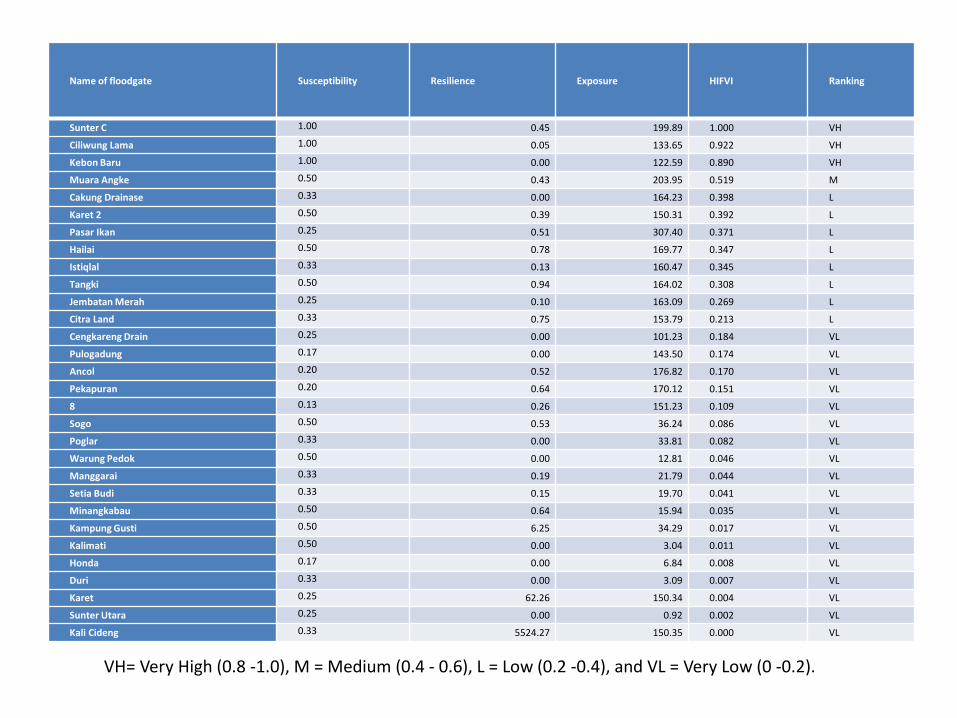
VH= Very High (0.8 -1.0), M = Medium (0.4 - 0.6), L = Low (0.2 -0.4), and VL = Very Low (0 -0.2).
Name of floodgate Susceptibility Resilience Exposure HIFVI Ranking
Sunter C 1.00 0.45 199.89 1.000 VH Ciliwung Lama 1.00 0.05 133.65 0.922 VH Kebon Baru 1.00 0.00 122.59 0.890 VH Muara Angke 0.50 0.43 203.95 0.519 M Cakung Drainase 0.33 0.00 164.23 0.398 L Karet 2 0.50 0.39 150.31 0.392 L Pasar Ikan 0.25 0.51 307.40 0.371 L Hailai 0.50 0.78 169.77 0.347 L Istiqlal 0.33 0.13 160.47 0.345 L Tangki 0.50 0.94 164.02 0.308 L Jembatan Merah 0.25 0.10 163.09 0.269 L Citra Land 0.33 0.75 153.79 0.213 L Cengkareng Drain 0.25 0.00 101.23 0.184 VL Pulogadung 0.17 0.00 143.50 0.174 VL Ancol 0.20 0.52 176.82 0.170 VL Pekapuran 0.20 0.64 170.12 0.151 VL 8 0.13 0.26 151.23 0.109 VL Sogo 0.50 0.53 36.24 0.086 VL Poglar 0.33 0.00 33.81 0.082 VL Warung Pedok 0.50 0.00 12.81 0.046 VL Manggarai 0.33 0.19 21.79 0.044 VL Setia Budi 0.33 0.15 19.70 0.041 VL Minangkabau 0.50 0.64 15.94 0.035 VL Kampung Gusti 0.50 6.25 34.29 0.017 VL Kalimati 0.50 0.00 3.04 0.011 VL Honda 0.17 0.00 6.84 0.008 VL Duri 0.33 0.00 3.09 0.007 VL Karet 0.25 62.26 150.34 0.004 VL Sunter Utara 0.25 0.00 0.92 0.002 VL Kali Cideng 0.33 5524.27 150.35 0.000 VL
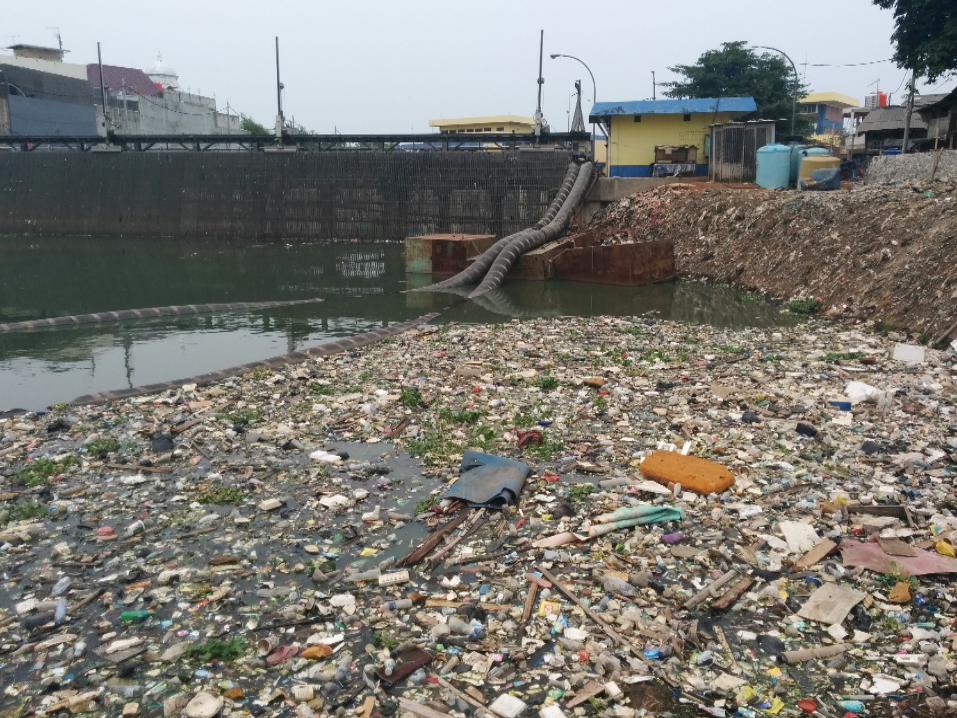
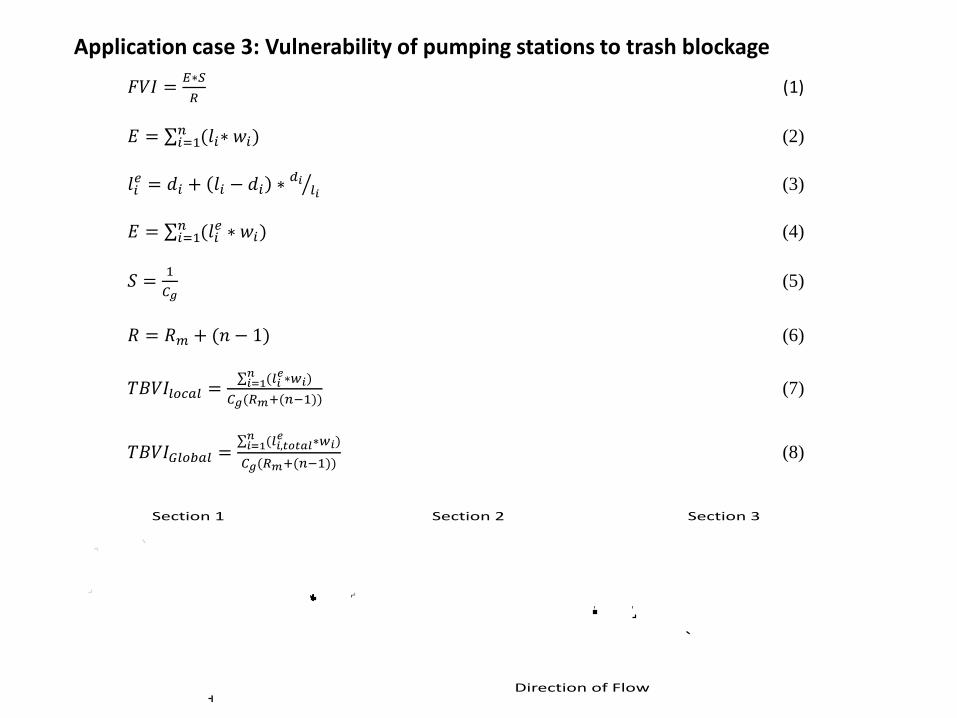
Application case 3: Vulnerability of pumping stations to trash blockage
𝐹𝐹𝐼 = 𝐸∗𝑆𝑅
(1) 𝐸 = ∑ (𝑙𝑖∗ 𝑤𝑖)𝑛
𝑖=1 (2) 𝑙𝑖𝑒 = 𝑑𝑖 + 𝑙𝑖 − 𝑑𝑖 ∗ 𝑑𝑖 𝑙𝑖� (3) 𝐸 = ∑ (𝑙𝑖𝑒 ∗ 𝑤𝑖)𝑛
𝑖=1 (4) 𝑆 = 1
𝐶𝑔 (5)
𝑅 = 𝑅𝑚 + (𝑛 − 1) (6) 𝑇𝑇𝐹𝐼𝑙𝑙𝑐𝑙𝑙 = ∑ (𝑙𝑖
𝑒∗𝑤𝑖)𝑛𝑖=1
𝐶𝑔(𝑅𝑚+(𝑛−1)) (7)
𝑇𝑇𝐹𝐼𝐺𝑙𝑙𝑏𝑙𝑙 =∑ (𝑙𝑖,𝑡𝑡𝑡𝑡𝑙
𝑒 ∗𝑤𝑖)𝑛𝑖=1𝐶𝑔(𝑅𝑚+(𝑛−1))
(8)
Direction of Flow
P2P1
Section 1 Section 2 Section 3

356511401
57453438445437672869201533466
614318589
42411471305329101950313673
2752258
47635666136251173955264
6848166470602
2412225
2159324923
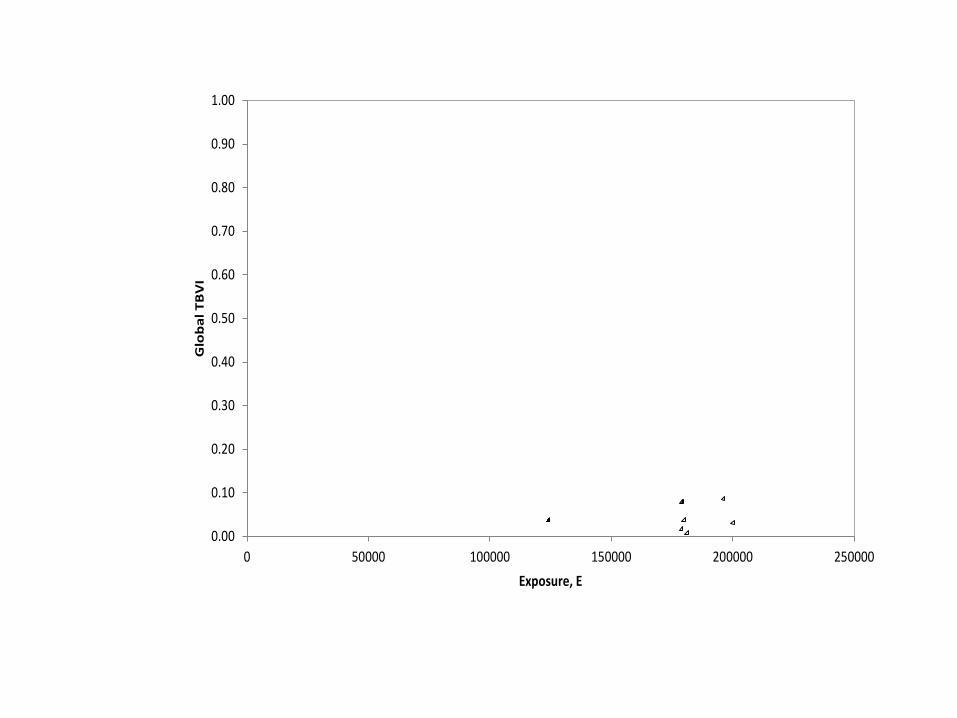
Local TBVI Global TBVI
0.00
0.10
0.20
0.30
0.40
0.50
0.60
0.70
0.80
0.90
1.00
0 50000 100000 150000 200000 250000
Glo
bal
TB
VI
Exposure, E


Way forward
• Move network analysis from local to global flood condition
• Develop flood inundation model (DATA?)
Key research questions?
• How does one foster “odd time” sensing?
• How can manipulative effect and truthfulness be checked?
• How many human sensors can cover the city? How can one ensure area coverage requirement is always met?
• Standardisation of crowdsensed flood height
• How can citizens be motivated to participate proactively in sensing flood?
• Does absence of tweets always indicate no floods; what is the check?
• Should participants be given incentives?
• What type of incentives?
Conclusion
Q& A