Embed Size (px)
Citation preview
28/03/20161
Identifying Potential Causes Xs
S No. Potential Cause Operational Definition Data Type Test of be performed
1 Team LeaderThe process owner, who is responsible for managing the performance of a set of associates in a given shift
Discrete General Linear Model
2 AssociateThe individual whose performance in a given shift contributes to the performance of that set of people & the overall process
Discrete General Linear Model
3 Process Complexity The level of reasoning & decision making involved in the process Discrete Moods Median
4 TrainerA person responsible for taking the new hires through the training module of the process & also responsible for downloading new updates to the existing process members
Discrete Moods Median
5 Process KnowledgeThe level of knowledge held by an individual associate about the process, gauged through the scores in the process test conducted
Discrete Moods Median
6 Typing SpeedThe individual skill possessed by each associate of typing gauged by the numberof words typed by the individual per second
Continuous Correlation Regression
7 Shift Timing A set of hours required to be logged in by an associate in a day Discrete General Linear Model
8 Gender The sex of the individual associate logged in to take calls Discrete Moods Median
9 Centre wise The place where the operations is set up & function from Discrete Mann Whitney
10 Age The number of years an individual associate is old in his / her span of life Discrete Correlation Regression
11 Marital Status Married or un married Discrete Moods Median
12 Mode of Communication Language or Dialect. The medium used by an associate to converse Discrete Moods Median
13 TenureThe time in months / years which an individual associate has spent in the particular process
Continuous Correlation Regression
Analyze
28/03/20162
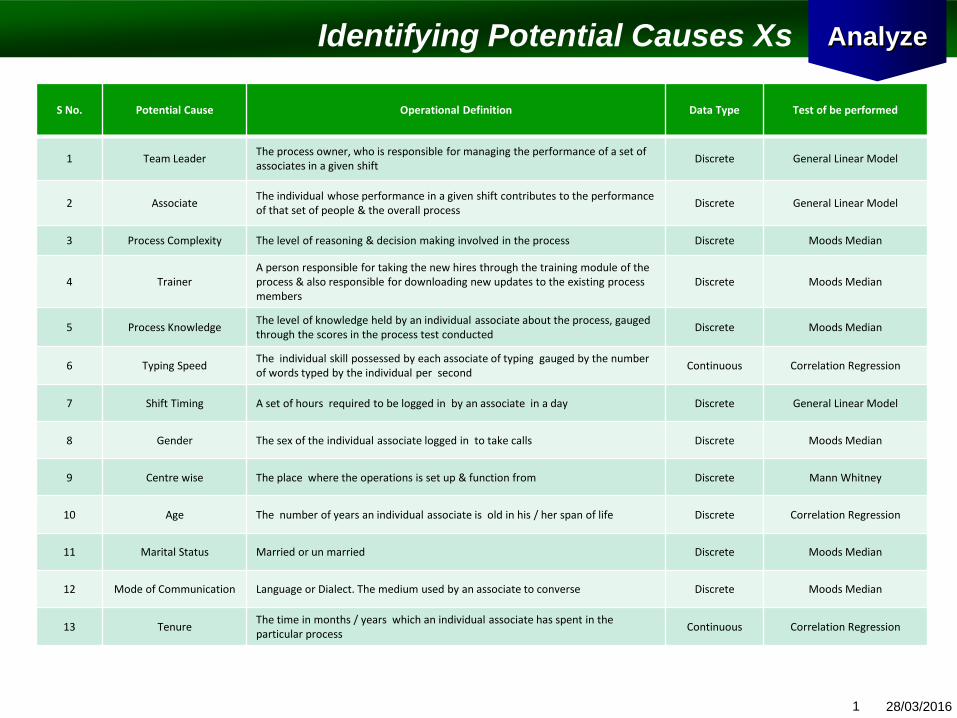
General Linear Model: AHT versus Team Leader
Factor Type Levels Values
Team Leader fixed 5 Binny, Jai, Ravi, Shishir, Sunny
Analysis of Variance for AHT, using Adjusted SS for Tests
Source DF Seq SS Adj SS Adj MS F P
Team Leader 4 460303 460303 115076 1.55 0.188
Error 540 40207340 40207340 74458
Total 544 40667643
S = 272.870 R-Sq = 1.13% R-Sq(adj) = 0.40%
Mood median test for AHTChi-Square = 3.30 DF = 4 P = 0.508
Individual 95.0% CIs
Team Leader N<= N> Median Q3-Q1 ---------+---------+---------+-------
Binny 49 61 391 516 (--------*----------)
Jai 58 50 315 401 (----*-------)
Ravi 61 51 325 400 (------*---)
Shishir 48 55 369 544 (-----------*-------------)
Sunny 57 55 292 507 (-------*-------------)
---------+---------+---------+-------
300 400 500
Team Leader Impact on AHT Analyze

28/03/20163
Associate Impact on AHT
General Linear Model: AHT versus
Associate Name
Factor Type Levels Values
Associate Name fixed 69 Aasim, Abhinav, Aftab, Ajit, Akhlaq,
Akhtar, Akshay, Ali, Alka, Aman, Amit, Anas, Ankit, Ankita, Anukriti,
Anupama, Arpita, Arti, Arun, Babita, Balbeer, Bapan, Bharti,
Bhushan, Bhuvan, Bipin, Daniel, Divya, Fahim, Faisal, Garima,
Himesh, Husain, Kanchan, Kavita, Kirti, Komal, Kritika, Nidhi,
Nilesh, Nitin, Partho, Preeti, Priya, Qasim, Ragini, Rahul, Ram,
Raman, Ramesh, Rita, Rohini, Rohit, Roopali, Roshan, Sheeba,
Shefali, Shoaib, Sita, Sobha, Sunny, Suzainne, Tanay, Tanya, Tariq,
Vaibhav, Vinit, Vinita, Vishi
Analysis of Variance for AHT, using Adjusted SS for Tests
Source DF Seq SS Adj SS Adj MS F P
Associate Name 68 4498154 4498154 66149 0.87 0.757
Error 476 36169489 36169489 75986
Total 544 40667643
S = 275.656 R-Sq = 11.06% R-Sq(adj) = 0.00%
Analyze

28/03/20164
Process Complexity Impact on AHT
Mood Median Test: AHT versus Process Complexity
Mood median test for AHT
Chi-Square = 0.41 DF = 1 P = 0.521
Process Individual 95.0% CIs
Complexity N<= N> Median Q3-Q1 --+---------+---------+---------+----
L1 117 124 355 406 (---------------*------)
L2 156 148 319 524 (------------*---------------------)
--+---------+---------+---------+----
280 315 350 385
Overall median = 336
A 95.0% CI for median(L1) - median(L2): (-59,78)
Analyze

28/03/20165
Trainer Impact on AHT
Mood Median Test: AHT versus Trainer
Mood median test for AHT
Chi-Square = 53.57 DF = 5 P = 0.000
Individual 95.0% CIs
Trainer N<= N> Median Q3-Q1 +---------+---------+---------+------
Amit 56 32 247 367 (--*-----)
Atul 56 20 194 247 (--*-)
Daniel 69 49 270 459 (---*----)
Rashid 21 43 535 517 (-------*------)
Ruby 42 91 494 454 (------*------)
Sonia 29 37 435 359 (--------*----)
+---------+---------+---------+------
150 300 450 600
Overall median = 336
Analyze

28/03/20166
Process Knowledge Impact on AHT
Mood Median Test: AHT versus Process Knowledge
Mood median test for AHT
Chi-Square = 16.62 DF = 31 P = 0.984
Process Individual 95.0% CIs
Knowledge N<= N> Median Q3-Q1 -----+---------+---------+---------+-
0.1222 7 8 337 601 (---------*----------------)
0.1300 9 6 192 611 (----*------------------------)
0.3100 6 9 499 515 (------------*---------)
0.3300 6 10 598 460 (---------------*---)
0.4000 9 7 297 276 (------*-----)
0.4566 10 6 278 429 (-----*----------)
0.4800 10 6 261 459 (----*----------)
0.5500 10 6 226 289 (---*-------)
0.5579 8 7 326 336 (--*-------------)
0.5700 9 7 309 497 (-----*------------------)
0.6332 7 8 373 425 (----------*---------)
0.6455 8 7 310 615 (-------*------------------)
0.6500 9 7 277 521 (----*--------------------)
0.6569 6 9 435 536 (------------*----------)
0.6600 15 17 370 465 (---------*-------)
0.7500 9 7 235 619 (----*-----------------------)
0.7543 8 8 330 528 (------*----------------)
0.7700 6 10 491 474 (-----------*---------)
0.8200 6 10 399 257 (-----*----)
0.8413 7 8 426 626 (--------------*--------------)
0.8500 12 11 335 546 (-------*------------)
0.8700 7 9 382 380 (-------*--------)
0.8900 11 5 233 299 (----*------)
0.9000 11 12 366 467 (-------*--------)
0.9100 7 9 386 530 (-------*---------------)
0.9311 7 8 430 392 (---------*------)
0.9354 5 10 496 479 (------------*--------)
0.9534 9 7 272 444 (------*--------------)
0.9644 8 7 297 470 (--------*-----------)
0.9700 5 10 432 416 (---------*--------)
0.9900 18 13 298 456 (------*------)
1.0000 8 8 297 459 (-------*--------------)
-----+---------+---------+---------+-
200 400 600 800
Overall median = 336
Analyze
28/03/20167
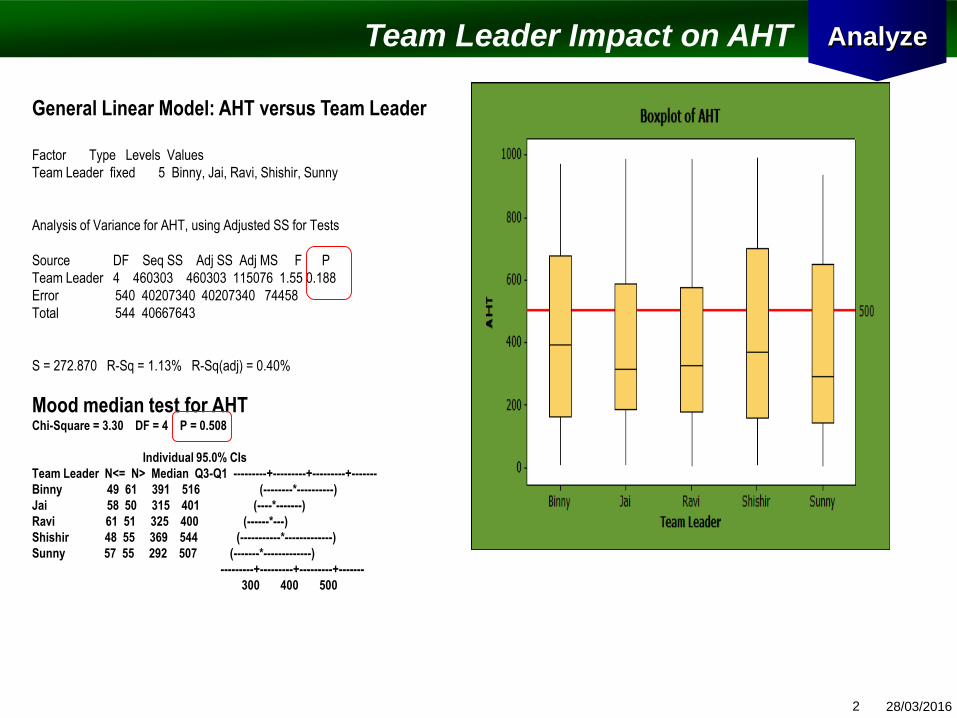
Shift Timing Impact on AHT
General Linear Model: AHT versus Shift
Factor Type Levels Values
Shift fixed 3 Evening, Morning, Night
Analysis of Variance for AHT, using Adjusted SS for Tests
Source DF Seq SS Adj SS Adj MS F P
Shift 2 393119 393119 196559 2.65 0.072
Error 542 40274525 40274525 74307
Total 544 40667643
S = 272.594 R-Sq = 0.97% R-Sq(adj) = 0.60%
Unusual Observations for AHT
Obs AHT Fit SE Fit Residual St Resid
11 988.000 388.490 22.038 599.510 2.21 R
59 987.000 389.121 17.633 597.879 2.20 R
127 941.000 388.490 22.038 552.510 2.03 R
139 953.000 388.490 22.038 564.510 2.08 R
147 974.000 389.121 17.633 584.879 2.15 R
149 956.000 389.121 17.633 566.879 2.08 R
156 935.000 389.121 17.633 545.879 2.01 R
177 992.000 389.121 17.633 602.879 2.22 R
202 973.000 389.121 17.633 583.879 2.15 R
211 978.000 389.121 17.633 588.879 2.16 R
276 938.000 389.121 17.633 548.879 2.02 R
298 972.000 389.121 17.633 582.879 2.14 R
483 939.000 389.121 17.633 549.879 2.02 R
499 953.000 388.490 22.038 564.510 2.08 R
501 963.000 388.490 22.038 574.510 2.11 R
517 965.000 389.121 17.633 575.879 2.12 R
R denotes an observation with a large standardized residual.
Analyze

28/03/20168
Impact of typing speed on AHTRegression Analysis: AHT versus Typing Speed
The regression equation is
AHT = 578 - 5.45 Typing Speed
Predictor Coef SE Coef T P
Constant 578.27 51.21 11.29 0.000
Typing Speed -5.449 1.575 -3.46 0.001
S = 270.700 R-Sq = 2.2% R-Sq(adj) = 2.0%
Analysis of Variance
Source DF SS MS F P
Regression 1 877472 877472 11.97 0.001
Residual Error 543 39790171 73278
Total 544 40667643
Unusual Observations
Typing
Obs Speed AHT Fit SE Fit Residual St Resid
11 24.0 988.0 447.5 16.8 540.5 2.00R
40 56.0 44.0 273.1 40.0 -229.1 -0.86 X
47 56.0 296.0 273.1 40.0 22.9 0.09 X
59 25.0 987.0 442.1 15.7 544.9 2.02R
110 56.0 657.0 273.1 40.0 383.9 1.43 X
117 56.0 677.0 273.1 40.0 403.9 1.51 X
162 31.0 988.0 409.4 11.6 578.6 2.14R
177 45.0 992.0 333.1 24.0 658.9 2.44R
180 56.0 111.0 273.1 40.0 -162.1 -0.61 X
187 56.0 141.0 273.1 40.0 -132.1 -0.49 X
250 56.0 191.0 273.1 40.0 -82.1 -0.31 X
257 56.0 133.0 273.1 40.0 -140.1 -0.52 X
298 30.0 972.0 414.8 11.9 557.2 2.06R
320 56.0 782.0 273.1 40.0 508.9 1.90 X
327 56.0 169.0 273.1 40.0 -104.1 -0.39 X
390 56.0 237.0 273.1 40.0 -36.1 -0.14 X
397 56.0 371.0 273.1 40.0 97.9 0.37 X
460 56.0 124.0 273.1 40.0 -149.1 -0.56 X
467 56.0 160.0 273.1 40.0 -113.1 -0.42 X
476 27.0 974.0 431.2 13.7 542.8 2.01R
517 37.0 965.0 376.7 14.3 588.3 2.18R
530 56.0 195.0 273.1 40.0 -78.1 -0.29 X
537 56.0 113.0 273.1 40.0 -160.1 -0.60 X
R denotes an observation with a large standardized residual.
X denotes an observation whose X value gives it large leverage.
Analyze
28/03/20169
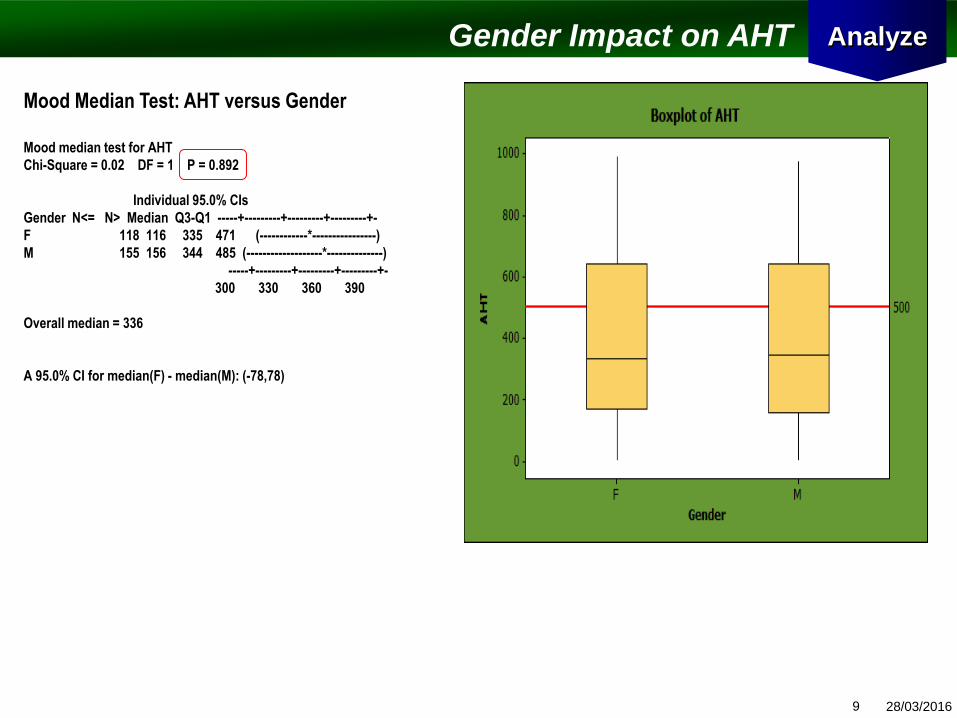
Gender Impact on AHT
Mood Median Test: AHT versus Gender
Mood median test for AHT
Chi-Square = 0.02 DF = 1 P = 0.892
Individual 95.0% CIs
Gender N<= N> Median Q3-Q1 -----+---------+---------+---------+-
F 118 116 335 471 (------------*----------------)
M 155 156 344 485 (-------------------*--------------)
-----+---------+---------+---------+-
300 330 360 390
Overall median = 336
A 95.0% CI for median(F) - median(M): (-78,78)
Analyze

28/03/201610
Center wise Impact on AHT
Mann-Whitney Test and CI: AHT_C5, AHT_C6
N Median
AHT_C5 303 363.00
AHT_C6 242 299.00
Point estimate for ETA1-ETA2 is 8.00
95.0 Percent CI for ETA1-ETA2 is (-30.01,49.02)
W = 83501.0
Test of ETA1 = ETA2 vs ETA1 not = ETA2 is significant at 0.6688
The test is significant at 0.6688 (adjusted for ties)
Analyze

28/03/201611
Age Impact on AHT
Regression Analysis: AHT versus AgeThe regression equation is
AHT = 377 + 1.03 Age
Predictor Coef SE Coef T P
Constant 377.02 75.94 4.96 0.000
Age 1.025 2.686 0.38 0.703
S = 273.632 R-Sq = 0.0% R-Sq(adj) = 0.0%
Analysis of Variance
Source DF SS MS F P
Regression 1 10905 10905 0.15 0.703
Residual Error 543 40656738 74874
Total 544 40667643Unusual Observations
Obs Age AHT Fit SE Fit Residual St Resid
11 27.0 988.0 404.7 12.0 583.3 2.13R
21 39.0 336.0 417.0 31.9 -81.0 -0.30 X
50 39.0 262.0 417.0 31.9 -155.0 -0.57 X
59 25.0 987.0 402.6 14.1 584.4 2.14R
91 39.0 678.0 417.0 31.9 261.0 0.96 X
120 39.0 576.0 417.0 31.9 159.0 0.59 X
139 27.0 953.0 404.7 12.0 548.3 2.01R
147 36.0 974.0 413.9 24.6 560.1 2.06R
161 39.0 905.0 417.0 31.9 488.0 1.80 X
162 36.0 988.0 413.9 24.6 574.1 2.11R
177 32.0 992.0 409.8 16.0 582.2 2.13R
190 39.0 806.0 417.0 31.9 389.0 1.43 X
202 22.0 973.0 399.6 19.8 573.4 2.10R
211 25.0 978.0 402.6 14.1 575.4 2.11R
231 39.0 832.0 417.0 31.9 415.0 1.53 X
260 39.0 144.0 417.0 31.9 -273.0 -1.00 X
298 27.0 972.0 404.7 12.0 567.3 2.08R
301 39.0 555.0 417.0 31.9 138.0 0.51 X
330 39.0 619.0 417.0 31.9 202.0 0.74 X
352 27.0 962.0 404.7 12.0 557.3 2.04R
371 39.0 296.0 417.0 31.9 -121.0 -0.45 X
400 39.0 642.0 417.0 31.9 225.0 0.83 X
441 39.0 229.0 417.0 31.9 -188.0 -0.69 X
470 39.0 429.0 417.0 31.9 12.0 0.04 X
476 27.0 974.0 404.7 12.0 569.3 2.08R
501 27.0 963.0 404.7 12.0 558.3 2.04R
511 39.0 181.0 417.0 31.9 -236.0 -0.87 X
517 27.0 965.0 404.7 12.0 560.3 2.05R
540 39.0 666.0 417.0 31.9 249.0 0.92 X
R denotes an observation with a large standardized residual.
X denotes an observation whose X value gives it large leverage.
Analyze
28/03/201612
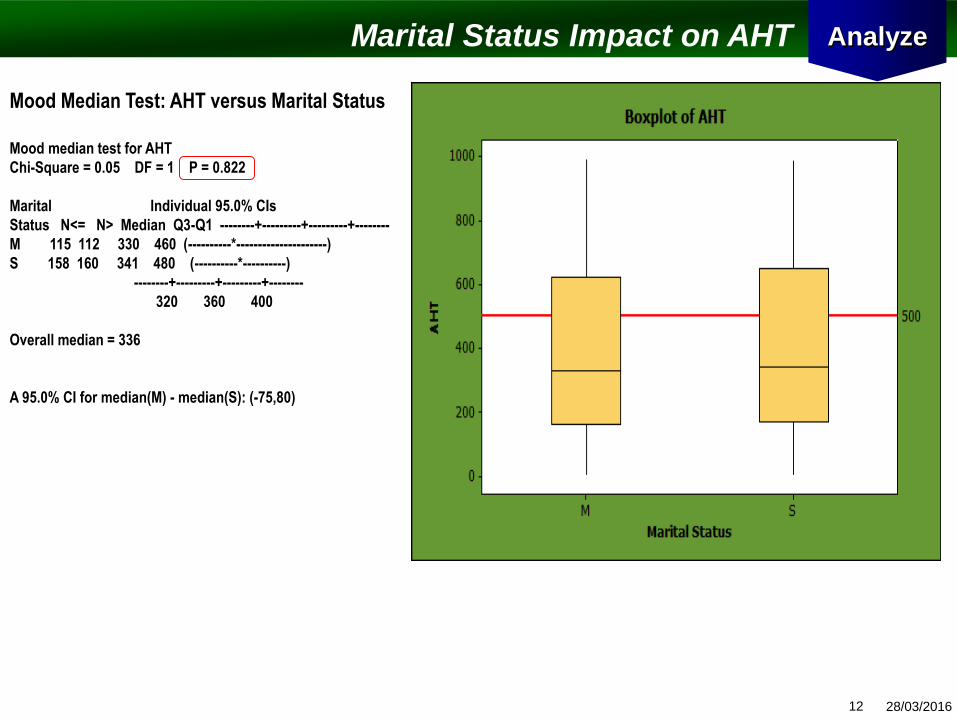
Marital Status Impact on AHT
Mood Median Test: AHT versus Marital Status
Mood median test for AHT
Chi-Square = 0.05 DF = 1 P = 0.822
Marital Individual 95.0% CIs
Status N<= N> Median Q3-Q1 --------+---------+---------+--------
M 115 112 330 460 (----------*---------------------)
S 158 160 341 480 (----------*----------)
--------+---------+---------+--------
320 360 400
Overall median = 336
A 95.0% CI for median(M) - median(S): (-75,80)
Analyze
28/03/201613
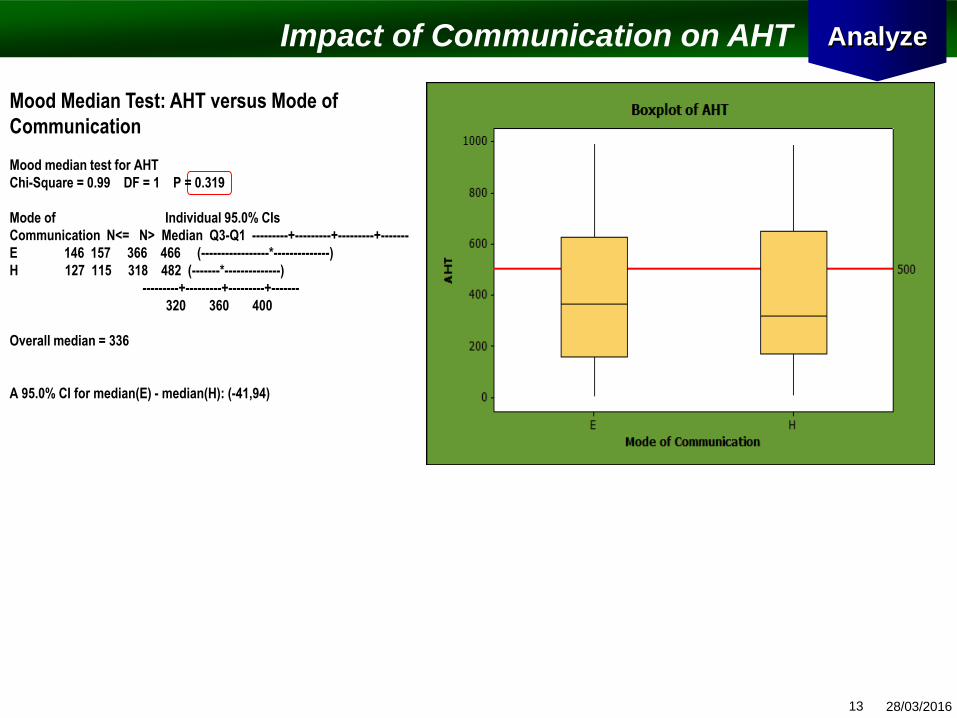
Impact of Communication on AHT
Mood Median Test: AHT versus Mode of
Communication
Mood median test for AHT
Chi-Square = 0.99 DF = 1 P = 0.319
Mode of Individual 95.0% CIs
Communication N<= N> Median Q3-Q1 ---------+---------+---------+-------
E 146 157 366 466 (-----------------*--------------)
H 127 115 318 482 (-------*--------------)
---------+---------+---------+-------
320 360 400
Overall median = 336
A 95.0% CI for median(E) - median(H): (-41,94)
Analyze

28/03/201614
Impact of Tenure on AHT
Regression Analysis: AHT versus Tenure
The regression equation is
AHT = 405 + 0.06 Tenure
Predictor Coef SE Coef T P
Constant 405.39 31.59 12.83 0.000
Tenure 0.058 6.381 0.01 0.993
S = 273.668 R-Sq = 0.0% R-Sq(adj) = 0.0%
Analysis of Variance
Source DF SS MS F P
Regression 1 6 6 0.00 0.993
Residual Error 543 40667637 74894
Total 544 40667643
Unusual Observations
Obs Tenure AHT Fit SE Fit Residual St Resid
11 8.0 988.0 405.9 24.7 582.1 2.14R
12 9.0 204.0 405.9 30.4 -201.9 -0.74 X
13 10.0 355.0 406.0 36.4 -51.0 -0.19 X
59 4.0 987.0 405.6 12.3 581.4 2.13R
82 9.0 475.0 405.9 30.4 69.1 0.25 X
83 10.0 135.0 406.0 36.4 -271.0 -1.00 X
139 5.0 953.0 405.7 12.0 547.3 2.00R
147 1.0 974.0 405.4 25.8 568.6 2.09R
149 5.0 956.0 405.7 12.0 550.3 2.01R
152 9.0 847.0 405.9 30.4 441.1 1.62 X
153 10.0 116.0 406.0 36.4 -290.0 -1.07 X
162 2.0 988.0 405.5 20.3 582.5 2.13R
177 5.0 992.0 405.7 12.0 586.3 2.14R
202 3.0 973.0 405.6 15.5 567.4 2.08R
211 2.0 978.0 405.5 20.3 572.5 2.10R
222 9.0 929.0 405.9 30.4 523.1 1.92 X
223 10.0 768.0 406.0 36.4 362.0 1.33 X
292 9.0 766.0 405.9 30.4 360.1 1.32 X
293 10.0 5.0 406.0 36.4 -401.0 -1.48 X
298 3.0 972.0 405.6 15.5 566.4 2.07R
352 3.0 962.0 405.6 15.5 556.4 2.04R
362 9.0 268.0 405.9 30.4 -137.9 -0.51 X
363 10.0 699.0 406.0 36.4 293.0 1.08 X
432 9.0 386.0 405.9 30.4 -19.9 -0.07 X
433 10.0 282.0 406.0 36.4 -124.0 -0.46 X
476 7.0 974.0 405.8 19.3 568.2 2.08R
499 5.0 953.0 405.7 12.0 547.3 2.00R
501 8.0 963.0 405.9 24.7 557.1 2.04R
502 9.0 667.0 405.9 30.4 261.1 0.96 X
503 10.0 439.0 406.0 36.4 33.0 0.12 X
517 2.0 965.0 405.5 20.3 559.5 2.05R
R denotes an observation with a large standardized residual.
X denotes an observation whose X value gives it large leverage.
Analyze

28/03/201615
S No. Potential Cause Data Type Test performed P value
1 Team Leader Discrete General Linear Model 0.188
2 Associate Discrete General Linear Model 0.757
3 Process Complexity Discrete Moods Median 0.521
4 Trainer Discrete Moods Median 0.000
5 Process Knowledge Discrete Moods Median 0.984
6 Typing Speed Continuous Correlation Regression 0.000
7 Shift Timing Discrete General Linear Model 0.072
8 Gender Discrete Moods Median 0.892
9 Centre wise Discrete Mann Whitney 0.6688
10 Age Discrete Correlation Regression 0.703
11 Marital Status Discrete Moods Median 0.822
12 Mode of Communication Discrete Moods Median 0.319
13 Tenure Continuous Correlation Regression 0.000
Evaluation for X’s impacting AHT Analyze