Embed Size (px)
Citation preview

Exploring Learning Analyticsand Learning Dashboards
from a HCI Perspective
Jose Luis Santos
PUBLIC PHD DEFENSE
1http://bit.do/santos_scholar http://www.slideshare.net/jlsantoso

Learning analytics is the measurement, collection, analysis and reporting of data about learners and their contexts, for purposes of understanding and optimising learning and the environments in which it occurs” - George Siemens [1]
[1] G. Siemens. “Learning analytics: envisioning a research discipline and a domain of practice”. Proceedings of the 2nd International Conference on Learning Analytics and Knowledge . ACM. 2012, pp. 4–8.
DEFINITION
page 1 of the thesis text
2

IMPACT
MACRO-LEVEL
3

IMPACT
MESO - LEVEL
https://www.flickr.com/photos/jaysantiago/7523644862
4

IMPACT
MICRO-LEVEL
https://www.flickr.com/photos/fortworthpubliclibrary/5202801554
5

IMPACT
MICRO-LEVEL
https://www.flickr.com/photos/fortworthpubliclibrary/5202801554
https://www.flickr.com/photos/mklapper/5812224468
6

IMPACT
MICRO-LEVEL
https://www.flickr.com/photos/fortworthpubliclibrary/5202801554
https://www.flickr.com/photos/mklapper/5812224468
https://www.flickr.com/people/francisco_osorio/
7

Classrooms and learning communities
SCOPE
see background section (pg.3) of the thesis text
8

9

10

11

12

13

LEA
RN
ING
DA
SHB
OA
RD
S
14

Classrooms and learning communities
Learning Dashboards as Personal Informatics Tools
see background section (pg.3) of the thesis text
15 SCOPE

https://www.flickr.com/photos/pere/523019984
The Iceberg - Abelardo Pardo’s metaphorLMS
The Open
16

17
LD in
the
Ope
n

18

19
LD in
the
Ope
n

20
LD in
the
Ope
n

Classrooms and learning communities
Learning Dashboards as Personal Informatics Tools
Open Learning Environments
see background section (pg.3) of the thesis text
21 SCOPE

MOTIVATIONability
mot
ivat
ion
triggers fail here
triggers succeed here
BJ Fogg’s model
http://www.behaviormodel.org/22

Classrooms and learning communities
Learning Dashboards as Personal Informatics Tools
Open Learning Environments
Motivation
see background section (pg.3) of the thesis text
23 SCOPE

EVALUATION INSTRUMENTS24
• Google Analytics • Own tracking systems

EVALUATION INSTRUMENTS25
• Google Analytics • Own tracking systems • SUS questionnaire

EVALUATION INSTRUMENTS26
• Google Analytics • Own tracking systems • SUS questionnaire • Customised questionnaires

EVALUATION INSTRUMENTS27
• Google Analytics • Own tracking systems • SUS questionnaire • Customised questionnaires • Interviews

METHODOLOGY
Iterative
Real environments
No controlled variables
leads to knowledge that can be used by
practitioners
Design-based research
28

METHODOLOGY
Iterative
Real environments
No controlled variables
leads to knowledge that can be used by
practitioners
Design-based research
29

METHODOLOGY
Iterative
Real environments
No controlled variables
leads to knowledge that can be used by
practitioners
Design-based research
30

METHODOLOGY
Iterative
Real environments
No controlled variables
leads to knowledge that can be used by
practitioners
Design-based research
31

32
CASE STUDIES

OPEN LEARNING - CASE STUDY 133
CASE STUDY 134

CASE STUDY 135

CASE STUDY 136

CASE STUDY 137
CASE STUDY 138

CASE STUDY 139

40
What did we learn?

41
What did we learn?
What came next?

OPEN LEARNING - CASE STUDY 242

OPEN LEARNING - CASE STUDY 243

OPEN LEARNING - CASE STUDY 244

45
What did we learn?

46
What did we learn?
47
What did we learn?
What came next?

48
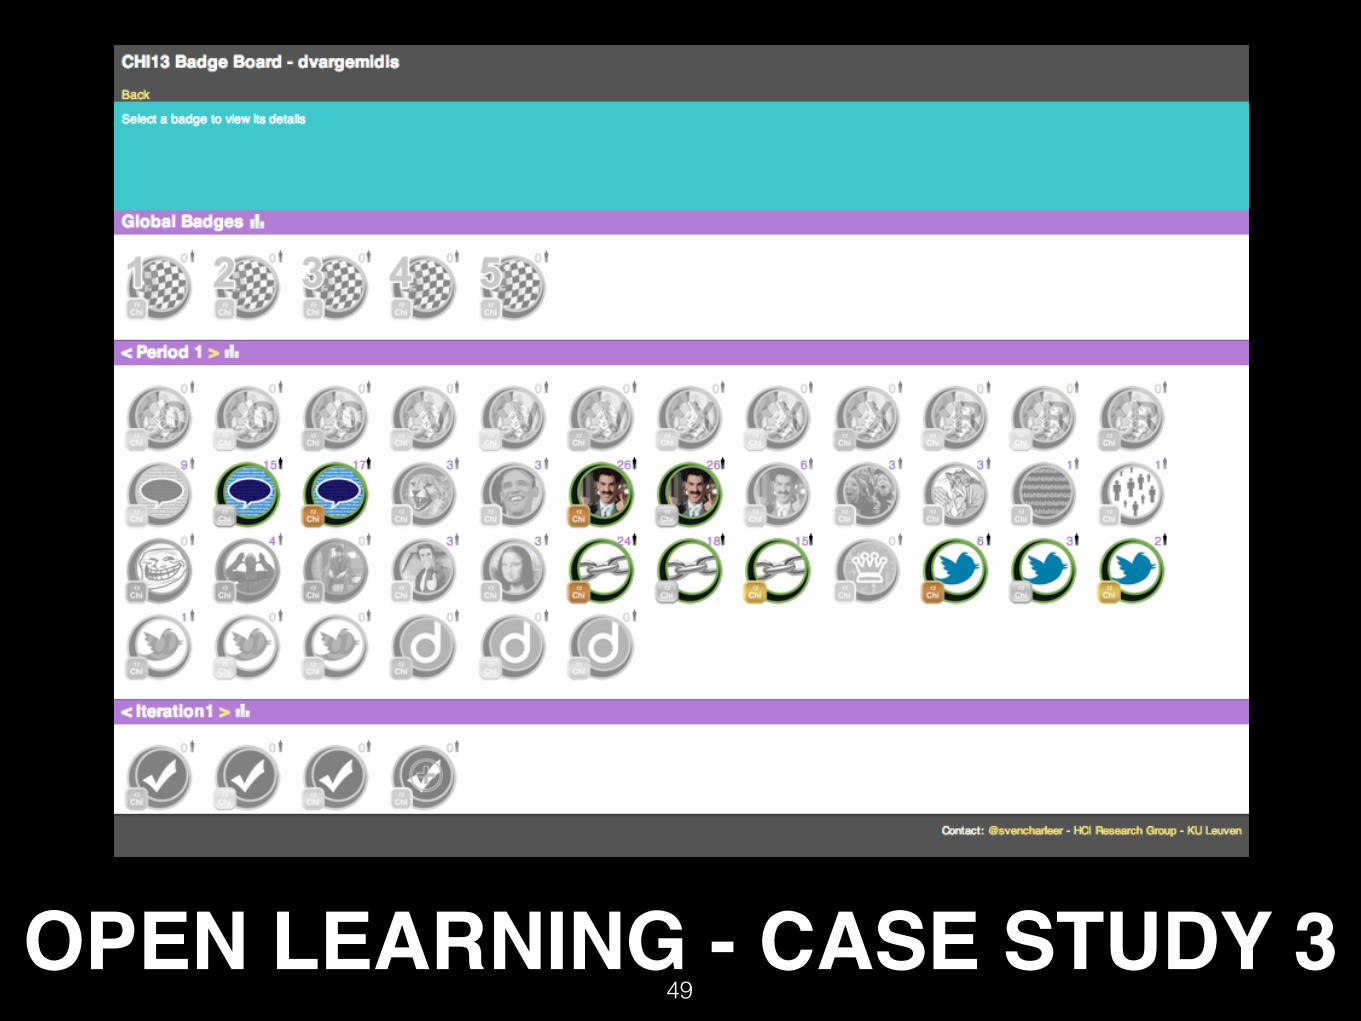
OPEN LEARNING - CASE STUDY 349

50
What did we learn?

MOOCs51https://coma.uned.es/

52MOOCs

EBL - Enquiry Based Learning53

RESEARCH QUESTIONS
RQ1: What characteristics of learning activities can be visualised usefully for learners?RQ2: What characteristics of learning activities can be visualised usefully for teachers?RQ3: What are the affordances of and user problems with tracking data automatically and manually?RQ4: What are the key components of a simple and flexible architecture to collect, store and manage learning activity? 54

RESEARCH QUESTIONS
RQ1: What characteristics of learning activities can be visualised usefully for learners?RQ2: What characteristics of learning activities can be visualised usefully for teachers?RQ3: What are the affordances of and user problems with tracking data automatically and manually?RQ4: What are the key components of a simple and flexible architecture to collect, store and manage learning activity? 55

Approach56
128 students3 learning analytics dashboards
5 case studies
real settingsusability
perceived usefulness

Publications57
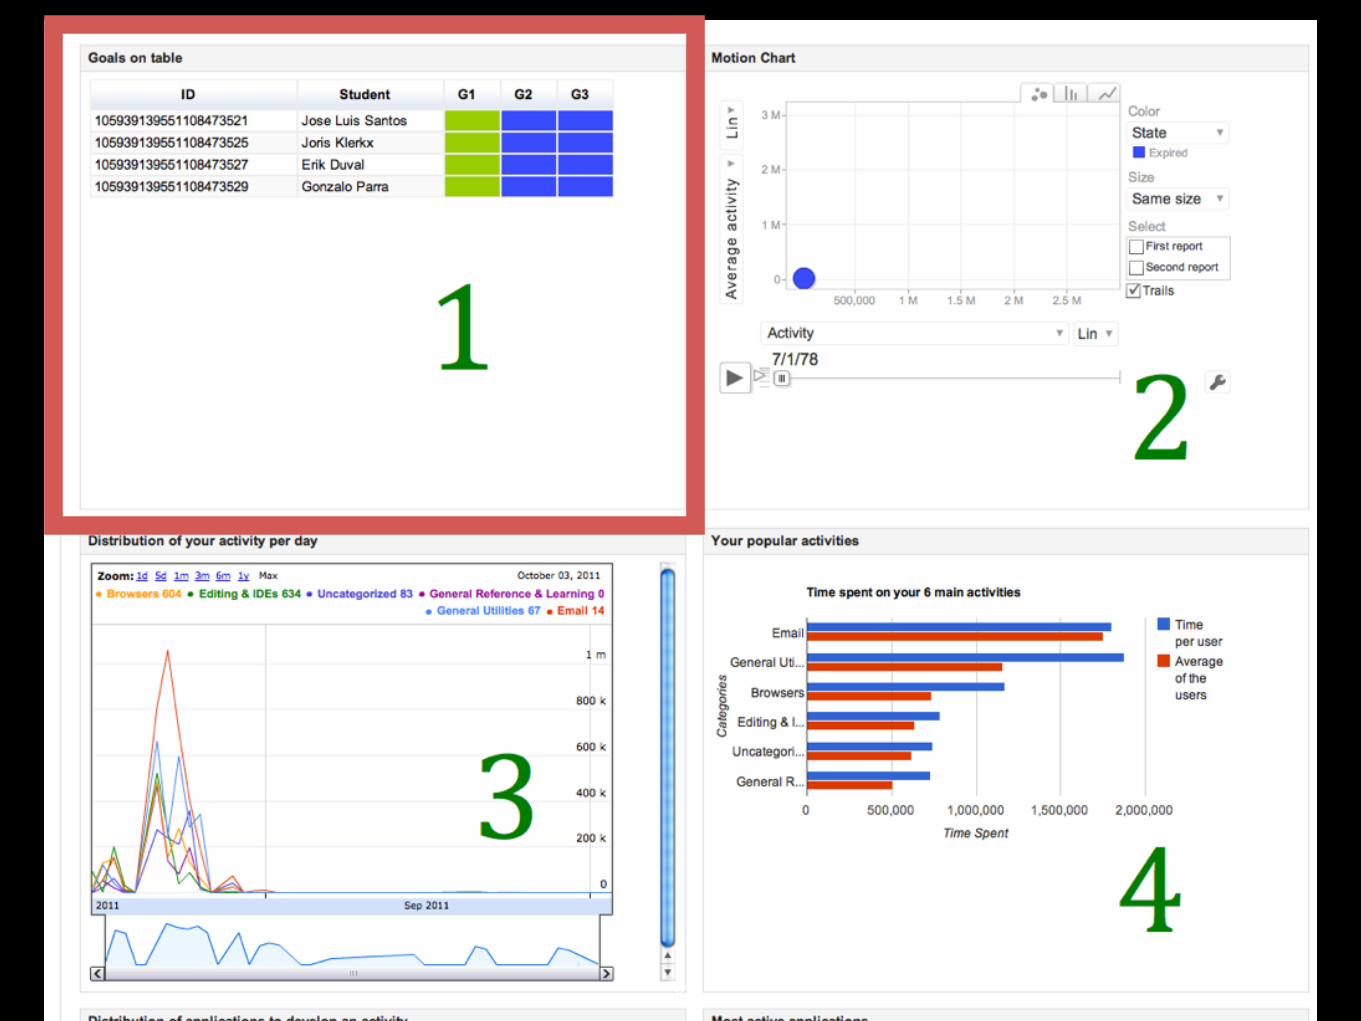
Santos et al. 2012. “Goal-oriented visualizations of activity tracking: a case study with engineering students”, In Proceedings of the 2nd International Conference on Learning Analytics and Knowledge (LAK ’12). ACM, New York, NY, USA, 143-152.
Santos et al. 2013a. “Addressing learner issues with StepUp!: an evaluation”, In Proceedings of the Third International Conference on Learning Analytics and Knowledge (LAK ’13). ACM, New York, NY, USA, 14-22.
Santos et al. 2013b. “Evaluating the use of open badges in an open learning environment” , In proceedings of of the Eight European Conference on Technology Enhanced Learning, Scaling up Learning for Sustained Impact, Springer Berlin Heidelberg, Berlin, Germany. 314-327.
Santos et al. 2015 “Tracking Data in Open Learning Environments" Journal of Universal Computer Science, Vol. 21, No. 7, pp. 976-996
Santos et al. 2014. “Success, activity and drop-outs in MOOCs an exploratory study on the UNED COMA courses”. In Proceedings of the Fourth International Conference on Learning Analytics And Knowledge (LAK’14). ACM, New York, NY, USA, 98-102

“As described in section 1.1, learning dashboards visualise learning traces, actions that students perform while they learn. In this context, RQ1 explores the usefulness of such traces in five different open learning courses.”
Problem58
rq1 problem statement - see page 14 of the thesis text

[3,4] Time spent
Artefacts Produced
Social Interaction
Resource use
Exercise/ Test
results
Ch. 2
Ch. 3
Ch. 4
[3] K. Verbert, E. Duval, J. Klerkx, S. Govaerts, and J. L. Santos. “Learning Analytics Dashboard Applications”. In: American Behavioral Scientist 57.10 (2013), pp. 1500–1509. [4] K. Verbert, S. Govaerts, E. Duval, J. L. Santos, F. Van Assche, G. Parra, and J. Klerkx. “Learning dashboards: an overview and future research opportunities”. In: Personal and Ubiquitous Computing 18.6 (2014), pp. 1499–1514.
Approach
page 15 of the thesis text
59

Time spent
Artefacts Produced
Social Interaction
Resource use
Exercise/ Test
results
Ch. 2
Ch. 3 Comparison
Ch. 4
Outcomes
page 16 of the thesis text
60

[3,4] Time spent
Artefacts Produced
Social Interaction
Resource use
Exercise/ Test
results
Ch. 2
Ch. 3Social activity
Ch. 4
Outcomes
page 16 of the thesis text
61

Time spent
Artefacts Produced
Social Interaction
Resource use
Exercise/ Test
results
Ch. 2
Ch. 3 individual vs group work
Ch. 4
Outcomes
page 16 of the thesis text
62

RESEARCH QUESTIONS
RQ1: What characteristics of learning activities can be visualised usefully for learners?RQ2: What characteristics of learning activities can be visualised usefully for teachers?RQ3: What are the affordances of and user problems with tracking data automatically and manually?RQ4: What are the key components of a simple and flexible architecture to collect, store and manage learning activity? 63
Approach64
exploratory study2 language learning MOOCs
56876 students enrolled

Publications65
Santos et al. 2012. “Goal-oriented visualizations of activity tracking: a case study with engineering students”, In Proceedings of the 2nd International Conference on Learning Analytics and Knowledge (LAK ’12). ACM, New York, NY, USA, 143-152.
Santos et al. 2013a. “Addressing learner issues with StepUp!: an evaluation”, In Proceedings of the Third International Conference on Learning Analytics and Knowledge (LAK ’13). ACM, New York, NY, USA, 14-22.
Santos et al. 2013b. “Evaluating the use of open badges in an open learning environment” , In proceedings of of the Eight European Conference on Technology Enhanced Learning, Scaling up Learning for Sustained Impact, Springer Berlin Heidelberg, Berlin, Germany. 314-327.
Santos et al. 2014. “Success, activity and drop-outs in MOOCs an exploratory study on the UNED COMA courses”. In Proceedings of the Fourth International Conference on Learning Analytics And Knowledge (LAK’14). ACM, New York, NY, USA, 98-102
Santos et al. 2015 “Tracking Data in Open Learning Environments" Journal of Universal Computer Science, Vol. 21, No. 7, pp. 976-996
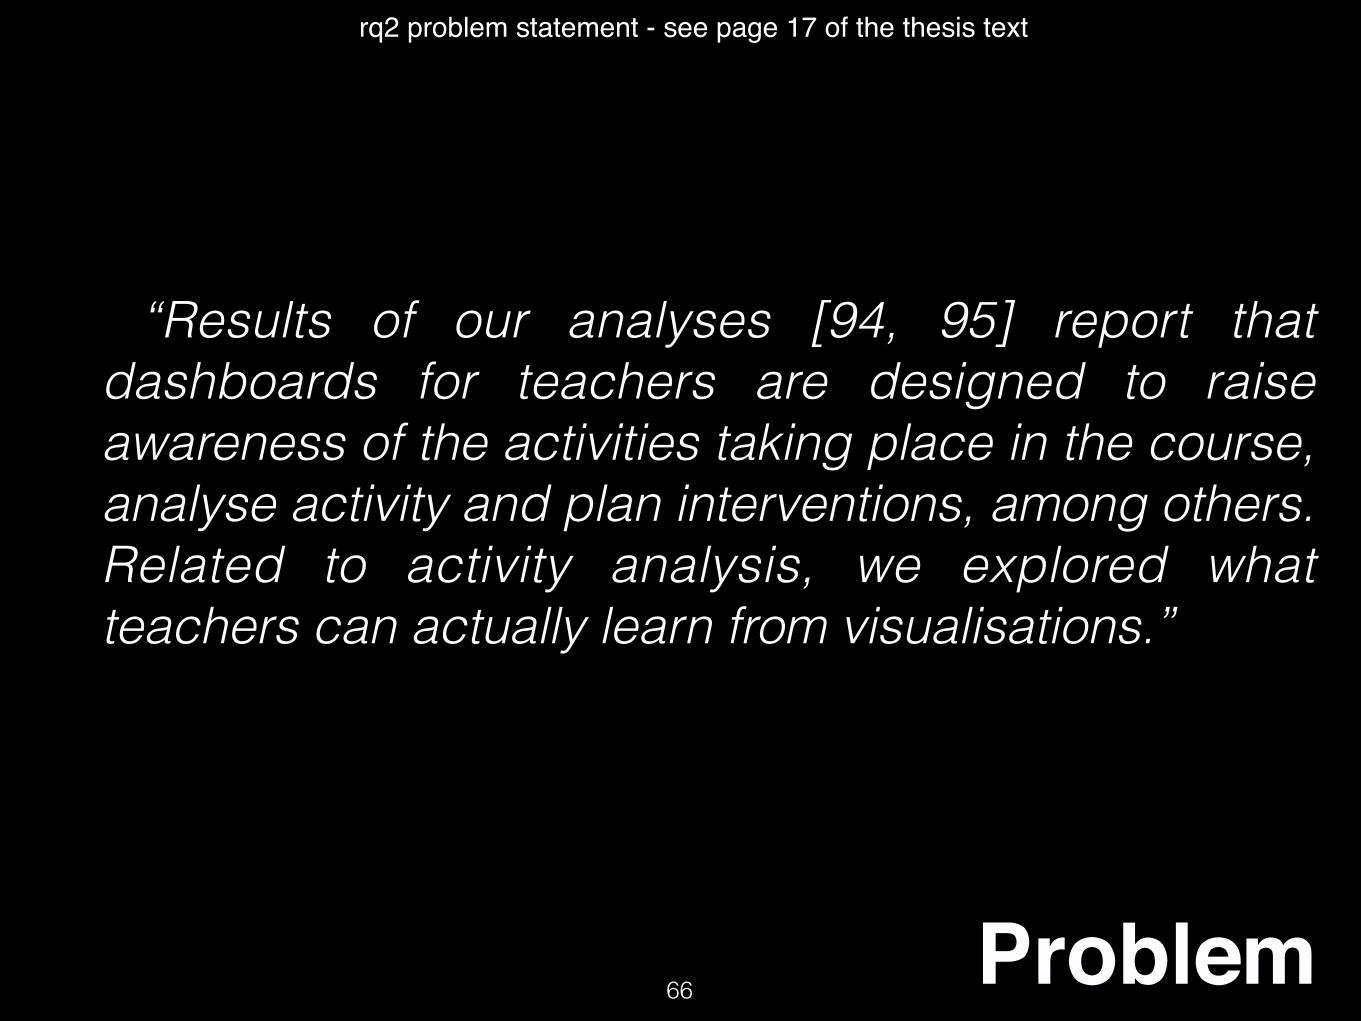
“Results of our analyses [94, 95] report that dashboards for teachers are designed to raise awareness of the activities taking place in the course, analyse activity and plan interventions, among others. Related to activity analysis, we explored what teachers can actually learn from visualisations.”
Problem66
rq2 problem statement - see page 17 of the thesis text

Time spent
Artefacts Produced
Social Interaction
Resource use
Exercise/ Test
resultsDrop-outs
[5,6,7]
Language use [8]
Social interaction [9]
[5] C. Alario-Hoyos et al. “Analysing the Impact of Built-In and External Social Tools in a MOOC on Educational Technologies”. In: ECTEL’13 . Vol. 8095. LNCS. Springer, 2013, pp. 5–18. [6] D. Clow. “MOOCs and the funnel of participation”. In: Proceedings of the Third International Conference on Learning Analytics and Knowledge. LAK ’13. ACM, 2013, pp. 185–189. [7] H. Spoelstra et al. “Team formation instruments to enhance learner interactions in open learning environments”. In: Computers in Human Behavior 45 (2015), pp. 11–20. [8] P. Levy. “Technology-Supported Design for Inquiry-Based Learning”. In: Exploring Learning & Teaching in Higher Education . Springer, 2015, pp. 289–304. [9] N. Michinov et al. “Procrastination, participation, and performance in online learning environments”. In: Computers & Education 56.1 (Jan. 2011), pp. 243–252.
67 Approach
table with data from page 17 and chapter 5 of the thesis text

Time spent
Artefacts Produced
Social Interaction
Resource use
Exercise/ Test
resultsDrop-outs
[5,6,7] attention to the first units of the lessons
Language use [8]
Social interaction [9]
68 Outcome
table with data from page 18 of the thesis text

Time spent
Artefacts Produced
Social Interaction
Resource use
Exercise/ Test
resultsDrop-outs
[5,6,7] attention to the first units of the lessons
Language use [8] ? ?
Social interaction [9]
69 Outcome
table with data from page 18 of the thesis text

Time spent
Artefacts Produced
Social Interaction
Resource use
Exercise/ Test
resultsDrop-outs
[5,6,7] attention to the first units of the lessons
Language use [8] ? ?
Social interaction [9]
70 Outcome
table with data from page 18 of the thesis text
thresholds thresholds

RESEARCH QUESTIONS
RQ1: What characteristics of learning activities can be visualised usefully for learners?RQ2: What characteristics of learning activities can be visualised usefully for teachers?RQ3: What are the affordances of and user problems with tracking data automatically and manually?RQ4: What are the key components of a simple and flexible architecture to collect, store and manage learning activity? 71

“Therefore, we consider relevant to evaluate how students perceived automatic and manual trackers.”
Problem72
rq3 problem statement - see page 19 of the thesis text
Manual Automatic
PROS Privacy tracking fatigue [10]
CONTRAS tracking fatigue [10] Privacy
[10] E. K. Choe, N. B. Lee, B. Lee, W. Pratt, and J. A. Kientz. “Understanding quantified-selfers’ practices in collecting and exploring personal data”. In: Proceedings of the 32nd annual ACM conference on Human factors in computing systems . ACM. 2014, pp. 1143–1152.

73 Approach
table with data from page 20 of the thesis text
Lab sessions Blended learningcourses
no learning activity outside of the classroom
big part of the learning activity outside of the
classroom
automatic trackers manual trackers
Rabbit Eclipse plug-in *
* https://marketplace.eclipse.org/content/rabbit

Outcome
Lab sessions Blended learning courses
Approach Automatic trackers Manual trackers
No privacy concerns No tracking fatigue
lack of tracking Over reporting
74

RESEARCH QUESTIONS
RQ1: What characteristics of learning activities can be visualised usefully for learners?RQ2: What characteristics of learning activities can be visualised usefully for teachers?RQ3: What are the affordances of and user problems with tracking data automatically and manually?RQ4: What are the key components of a simple and flexible architecture to collect, store and manage learning activity? 75

Publications76
Santos et al. 2015 “Tracking Data in Open Learning Environments" Journal of Universal Computer Science, Vol. 21, No. 7, pp. 976-996
Santos et al. 2012. “Goal-oriented visualizations of activity tracking: a case study with engineering students”, In Proceedings of the 2nd International Conference on Learning Analytics and Knowledge (LAK ’12). ACM, New York, NY, USA, 143-152.
Santos et al. 2013a. “Addressing learner issues with StepUp!: an evaluation”, In Proceedings of the Third International Conference on Learning Analytics and Knowledge (LAK ’13). ACM, New York, NY, USA, 14-22.
Santos et al. 2013b. “Evaluating the use of open badges in an open learning environment” , In proceedings of of the Eight European Conference on Technology Enhanced Learning, Scaling up Learning for Sustained Impact, Springer Berlin Heidelberg, Berlin, Germany. 314-327.
Santos et al. 2014. “Success, activity and drop-outs in MOOCs an exploratory study on the UNED COMA courses”. In Proceedings of the Fourth International Conference on Learning Analytics And Knowledge (LAK’14). ACM, New York, NY, USA, 98-102

77
image at page 21 of the thesis text
Approach
Experience report two environments

78
Rabbit Eclipse plugin
RescueTime
Wordpress API
Blogspot API
Medium / RSS
Toggl
Trackers REST services
dashboard
badge system
Internethosted in the cloud Google App Engine
1. Common data schema
2 3
three elements described in page 22 of the thesis text
Outcome

Wrap-up
79

image at page 137 of the thesis text
128 students actually used the learning dashboards
56876 students enrolled in the MOOC courses
the architecture was deployed in more than 10 case studies
3 learning analytics dashboards
80

Publications and RQs
C - Conference, J - Journal
RQ1Chapter 2: Santos et al. 2012 (C)
Chapter 3: Santos et al. 2013a (C) Chapter 4: Santos et al. 2013b (C)
RQ2 Chapter 5: Santos et al. 2014 (C)
RQ3 Chapter 2: Santos et al. 2012 (C) Chapter 3: Santos et al. 2013a (C)
RQ4 Chapter 6: Santos et al. 2015 (J)
81

External citations Own citations
chapter 2 28 7
chapter 3 14 5
chapter 4 9 4
chapter 5 10 0
chapter 6 0 0
other co-authored publications 199 48
82

83

84

85

86

87

http://jlsantoso.blogspot.be/2013/05/reveal-it-applied-in-educational-context.html88

8 May 2013 | @svencharleer | svencharleer.comhttp://ceur-ws.org/Vol-1103/paper5.pdf89

“What is research but a blind date with knowledge?”
Will Harvey
91

Thank you for your attention!
Looking forward to answer your questions.
92