Embed Size (px)
Citation preview

1
Economic drivers and emerging retail trends
PCA Retail Forum 15 May 2015
Tony DimasiManaging DirectorT 03 9600 0500M 0409 216 [email protected]
2
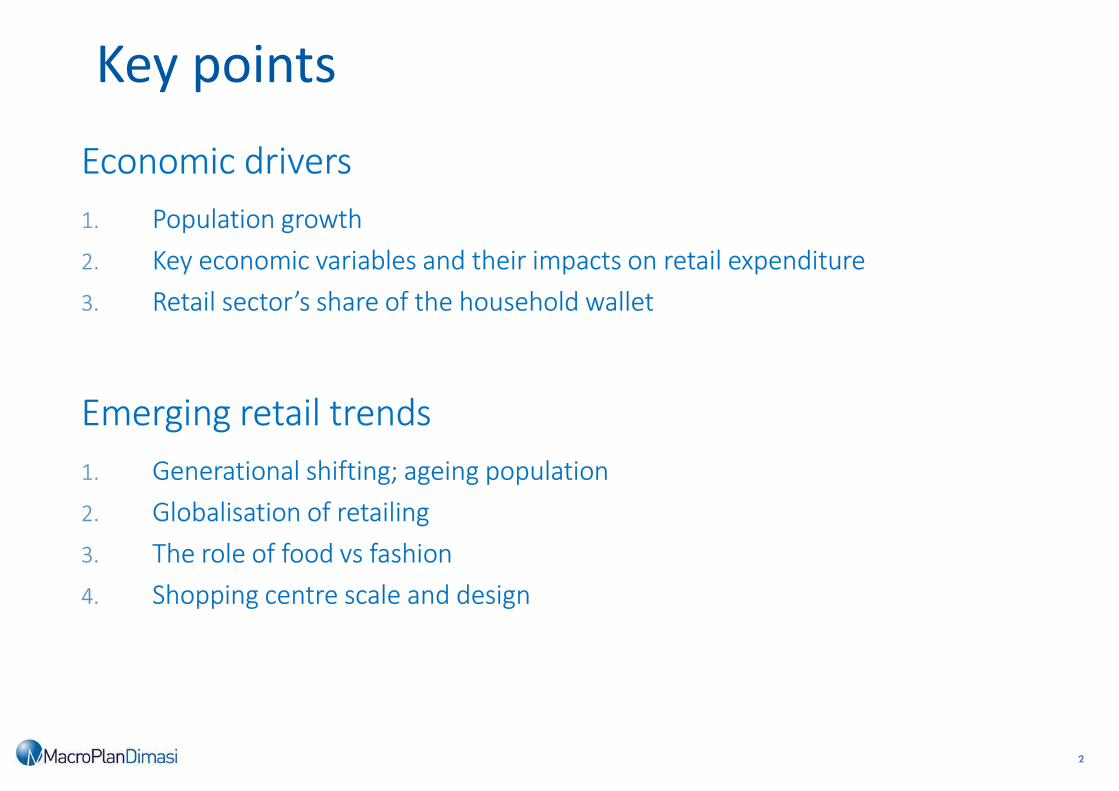
Key points
Economic drivers
1. Population growth
2. Key economic variables and their impacts on retail expenditure
3. Retail sector’s share of the household wallet
Emerging retail trends
1. Generational shifting; ageing population
2. Globalisation of retailing
3. The role of food vs fashion
4. Shopping centre scale and design

3
Economic drivers

4
Retail expenditure growth
*Other Food includes – Specialised food retailing, cafes, restaurants and other takeaway food
**All other retailing includes furniture/floor coverings, electrical/electronics, hardware/garden, newspaper/books, other recreational goods, pharmaceuticals and other retailing
FY2015- from April 2014 to March 2015
Source ABS Retail Trade Cat. 8501.0, May 2015

5
Retail food expenditure
*Other Food includes – Specialised food retailing, cafes, restaurants and other takeaway food
- FY2015- from April 2014 to March 2015
Source ABS Retail Trade Cat. 8501.0, May 2015

6
Retail expenditure growth
• Pre-GFC, retail exp. per capita was the driver of total retail growth
• Post GFC, in most years pop growth has been the key driver of retail sales growth
– exp. per cap. growth has not even kept up with inflation
Source: ABS Retail Trade Cat. 8501.0
0.0%
1.0%
2.0%
3.0%
4.0%
5.0%
6.0%
7.0%
8.0%
9.0%
10.0%
2000 2001 2002 2003 2004 2005 2006 2007 2008 2009 2010 2011 2012 2013 2014 2020 2025
retail
population
Australian retail sales - growth per annum (ABS)

7
Population growth : Australia
Source: ABS ERP publications

8
Population growth – YOY change
Source: ABS Population Projections cat. 3332.0

9
Key economic variables, and implications for retail exp.
• House prices – nexus appearing to break down.
• Wages growth has fallen away over the past 2 years
• Deflation in key (non-food) retail categories
• Non-retail essentials gobbling up the household budget (education, health,
housing)

10
House prices and confidence to spend
Source: ABS Consumer Price Index cat. 6401.0; REIA Median House Price Index

11
Wages growth falling away
Source: ABS Wage Price Index cat. 6345.0

12
“Essentials” vs. Retail goods inflation
Source: ABS Consumer Price Index Cat. 6401.0
0
20
40
60
80
100
120
140
160
180
200
220
2000 2001 2002 2003 2004 2005 2006 2007 2008 2009 2010 2011 2012 2013 2014
Food and non-alcoholic beverages Alcohol and tobacco
Clothing and footwear Furnishings, household equipment and services
Housing Health
Education Transport
Consumer price index (by group - FY2000-FY2014)
Retail/ tradeables
= low inflation
Non-retail/non-tradeables
= high inflation
FY

13
Retail sector’s share of the household wallet
Source: ABS House and Expenditure Survey and Survey of Income and Housing cat.6503
0%
10%
20%
30%
40%
50%
60%
70%
80%
90%
100%
1984 1988–89 1993–94 1998–99 2003–04 2009–10 2020?
Household furnishings and
equipment
Clothing and footwear
Personal care
Alcoholic beverages
Food and non-alcoholic beverages
Tobacco products
Miscellaneous goods and services
Household services and operation
Medical care and health expenses
Recreation
Transport
Domestic fuel and power
Current housing costs (selected
dwelling)
Re
tail
No
n-r
eta
il
Retail
Re
tail
No
n-r
eta
il
Non-
Retail

14
What will happen to retail expenditure growth?
• Food spending will continue to grow strongly.
• Non-food spending growth should improve, but remain below long-term trend.
• Overall, retail spend will have to fight hard to maintain share of household
budget.

15
Emerging retail trends
16
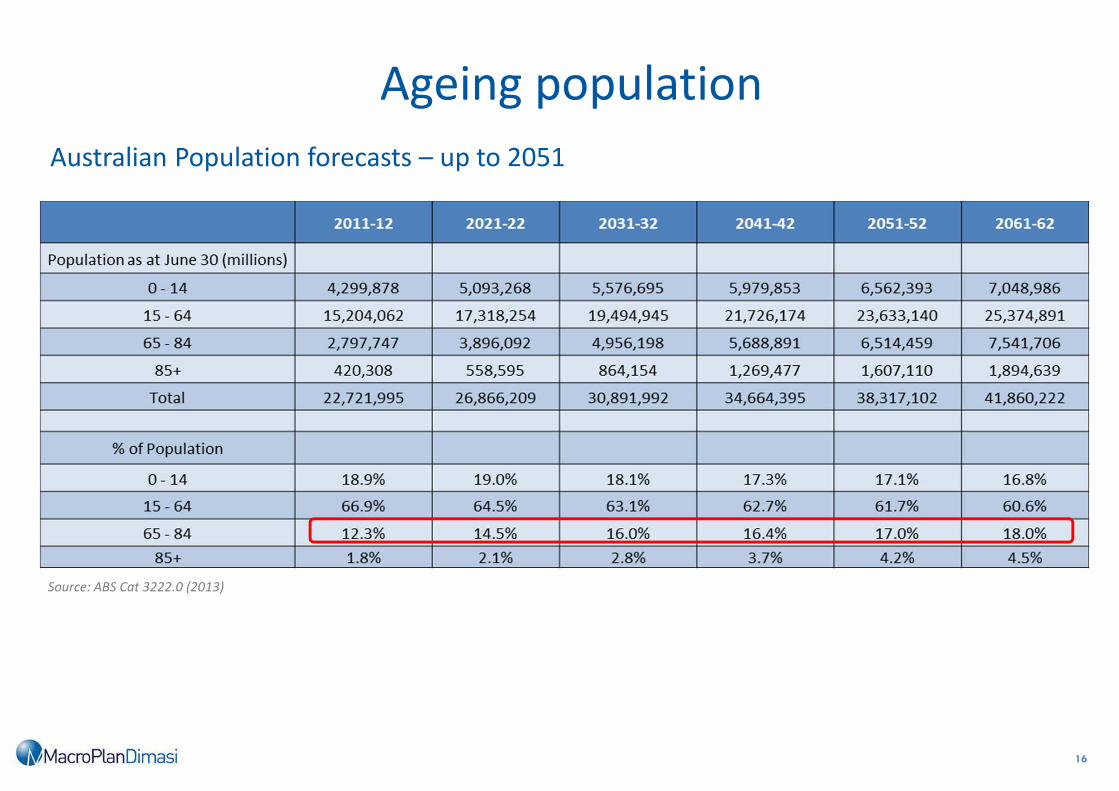
Ageing population
Source: ABS Cat 3222.0 (2013)
Australian Population forecasts – up to 2051

17
Retail expenditure profile by age of household head

18
Generational shifting – well underway
• Baby boomers : born 1946 – 64: Defined by their careers.
• Gen X : b. 1965 – 79: Seeking more “balance” in their lives.
• Gen Y : b. 1980 – 94: Millenials; KIPPERS.
• Gen Z : b. 1995 – 2009: Digital natives; Social media junkies; marketing savvy.
• Gen Alpha : b. 2010 - : Will live to 90+

19
Generational shifting

20
Generational shifting

21
Transition of (spending) power
• Baby boomers have largely driven the Australian retail market to this point
• They have given retailers loyalty and consistency, once won over
• But their influence will wane measurably over the next twenty years
• Gen Y’s and Gen Z’s combined influence will increase enormously
• Both these cohorts are much less conformist, more demanding, less loyal to “brand”
• Both are generally harder to keep as regular customers
• They are very comfortable with online shopping, but at the same time looking for more
“experiential”, more social interaction – i.e. equally open to the right bricks and mortar
offer

22

23
Globalisation of retailing
• Potentially, the recent arrivals could open in the order of 100 – 120 stores.
• These stores could attract sales of $1.5 - $2 billion, generally out of the Apparel category,
which is worth about $30 billion.
• The category has been hit hard post-GFC, compounded by a combination of consumer
disinterest and long term deflation; the new globals have added a much needed element
of excitement.
• The discount department stores in particular have suffered as a consequence of these
factors, but stand to be further hit by the new entrants.
• Not all new internationals will succeed – we have seen international failures before in
Australia.

24
Foreign invasion – how much more?
Key questions
• Which of the recent arrivals will make a big impact – and last the distance ?
• History has shown patchy results for many previous entrants.
• What happens if some of the recent (key) entrants fall over ?
Possible upside
• What about more Asian retailers, given proximity, growth of Asian economies, and
increasing proportions of Asian origin population in Australia.
• Can the recent entrants exceed expectations, and will they roll out more stores ?
• Can the recent entrants expand the category e.g. fashion, winning back household
budget share ?
Generally, though, I expect to see more and more global retailers in this country.

25

26
The role of food – retail sales Australia
Source: ABS Retail Trade Cat. 8501.0
0
20,000
40,000
60,000
80,000
100,000
120,000
140,000
Mar-85 Mar-95 Mar-05 Mar-15
Food (take-home) Catered food (cafés, restaurants, take-away food)
Household goods Clothing, footwear, personal accessories
Department stores Other
$ (millions)
Food (take-
home): 41%
of total retail
turnover
Food (take-
home): 36%
of total retail
turnover

27
The role of food – regional shopping centres

28
29
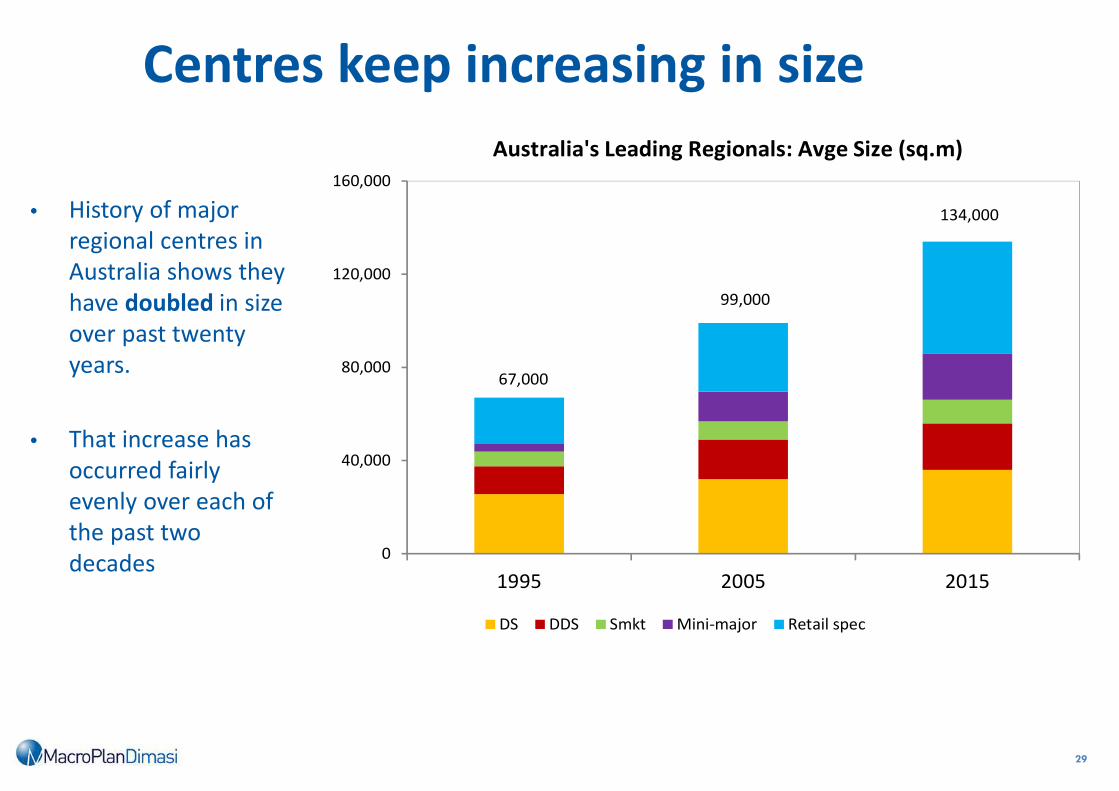
Centres keep increasing in size
67,000
99,000
134,000
0
40,000
80,000
120,000
160,000
1995 2005 2015
DS DDS Smkt Mini-major Retail spec Total
Australia's Leading Regionals: Avge Size (sq.m)
• History of major
regional centres in
Australia shows they
have doubled in size
over past twenty
years.
• That increase has
occurred fairly
evenly over each of
the past two
decades
30
Shopping centre design
• Continual increases in size enable continual improvement – which is essential.
• Design has moved/is moving from functionality to creating “sense of place” (plus
functionality).
• Incorporating F&B as a main purpose – and using F&B to help create that sense of place.
• Making centres more attractive/beautiful spaces for people.
• But we remain somewhat confused, even conflicted, about main street/open air.
• A real commitment to open air design requires more creativity – and involves more
cost/greater risk (at least in the short term).
• However, the agenda can’t be dictated solely by the planning fraternity/approval
authorities – the industry needs a well thought out position.

31
www.macroplan.com.au
Melbourne
Level 4, 356 Collins Street
Melbourne VIC 3000
PH: (03) 9600 0500
Sydney
Level 4, 39 Martin Place
Sydney NSW 2000
PH: (02) 9221 5211
Brisbane
Level 15, 111 Eagle Street
Brisbane QLD 4000
PH: (07) 3221 8166
Gold Coast
Level 2 The Wave
89-91 Surf Parade
Broadbeach QLD 4218
PH: (07) 3221 8166
Perth
Ground Floor
12 St Georges Terrace
Perth WA 6000
PH: (08) 9225 7200
Adelaide
Ground Floor
89 King William Street
Adelaide SA 5000
PH: (08) 8221 6332