Embed Size (px)
Citation preview
© 2016 Continuum Analytics - Confidential & Proprietary© 2016 Continuum Analytics - Confidential & Proprietary
Interactive Visual Statistics on Massive Datasets
Peter Wang CTO, Co-founder Continuum Analytics @pwang
© 2016 Continuum Analytics - Confidential & Proprietary 2
• Introductions
• Company Overview
• Goals of Analytics and IT teams
• Why Python for Data Science
• Anaconda - Making Python Better for Data Science
• Package Management
• Cluster Environment Management
• Notebook Computing
• Demonstrations
• Q&A / Next steps
AGENDA
© 2016 Continuum Analytics - Confidential & Proprietary© 2016 Continuum Analytics - Confidential & Proprietary
What’s the Problem?
© 2016 Continuum Analytics - Confidential & Proprietary
Big data magnifies small problems
4
• Of course, big data presents storage and computation problems • More importantly, standard plotting tools have problems that are
magnified by big data: • Overdrawing/Overplotting • Saturation • Undersaturation • Binning issues
• We’ll first explain these problems, and then present a new technique called datashading to address them head-on.

© 2016 Continuum Analytics - Confidential & Proprietary
Overdrawing
5
• For a scatterplot, the order in which points are drawn is very important
• The same distribution can look entirely different depending on plotting order
• Last data plotted overplots
© 2016 Continuum Analytics - Confidential & Proprietary
Overdrawing
6
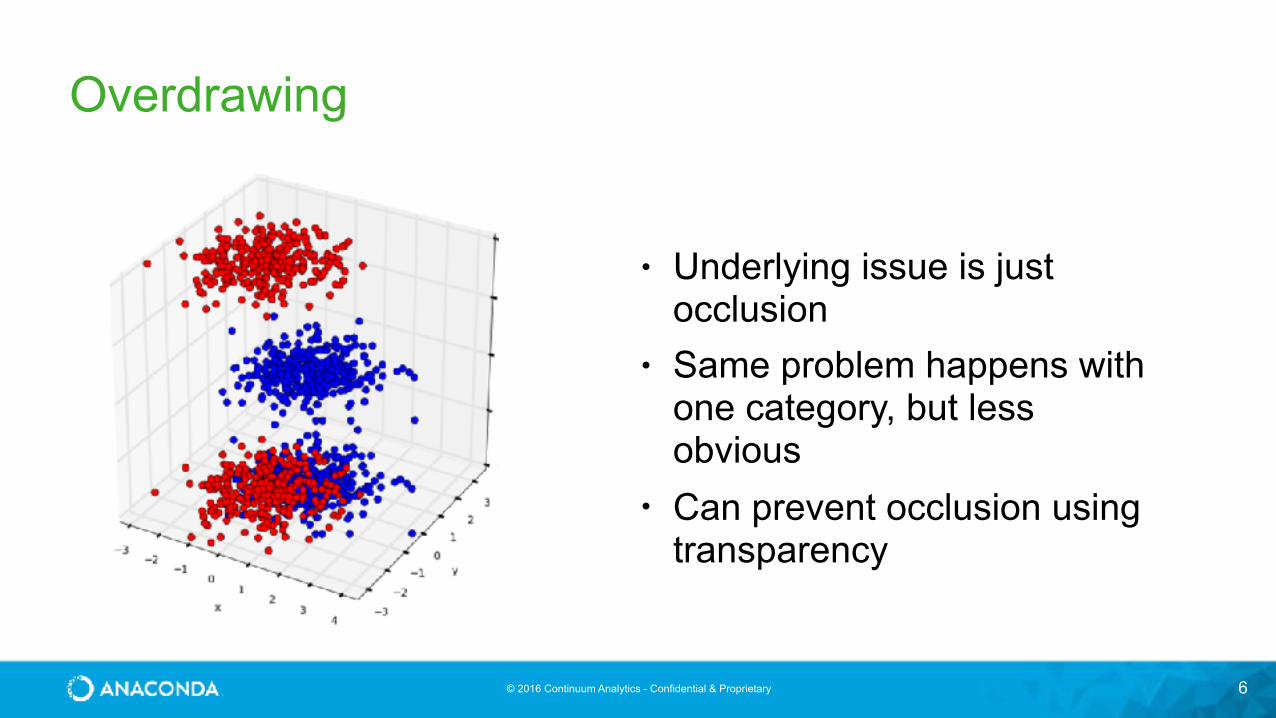
• Underlying issue is just occlusion
• Same problem happens with one category, but less obvious
• Can prevent occlusion using transparency
© 2016 Continuum Analytics - Confidential & Proprietary
Saturation
7
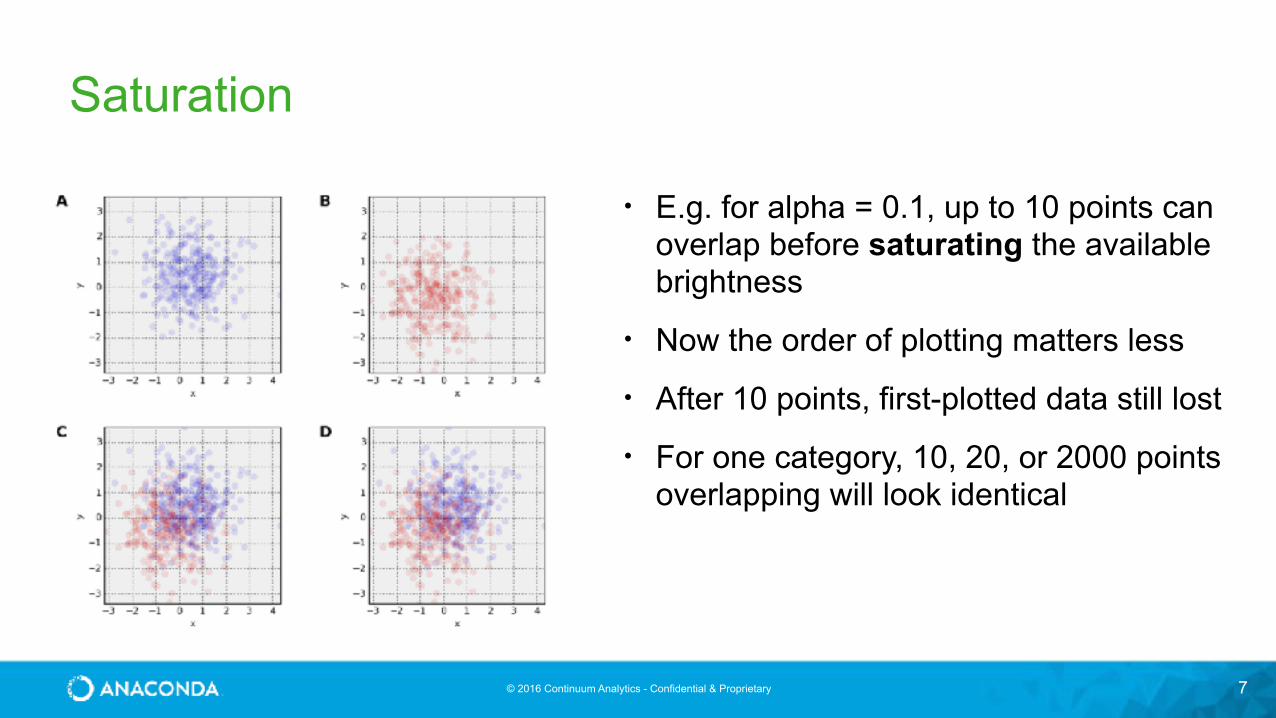
• E.g. for alpha = 0.1, up to 10 points can overlap before saturating the available brightness
• Now the order of plotting matters less
• After 10 points, first-plotted data still lost
• For one category, 10, 20, or 2000 points overlapping will look identical
© 2016 Continuum Analytics - Confidential & Proprietary
Saturation
8
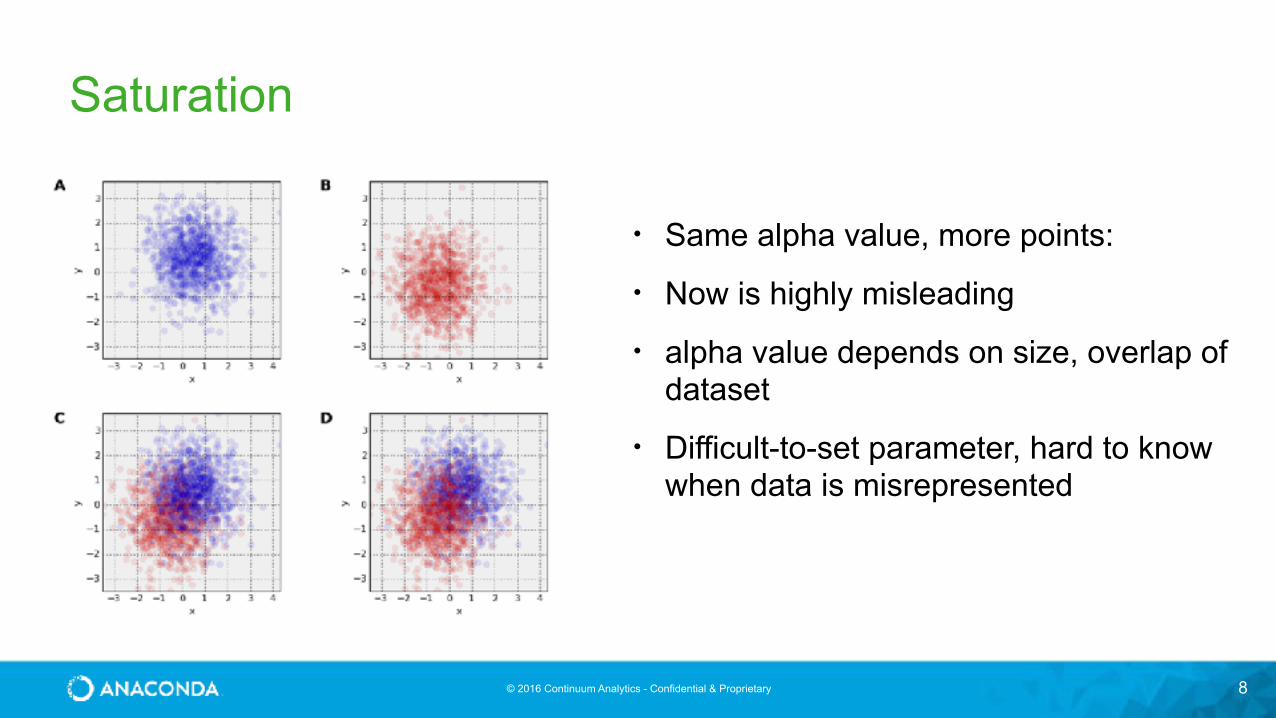
• Same alpha value, more points:
• Now is highly misleading
• alpha value depends on size, overlap of dataset
• Difficult-to-set parameter, hard to know when data is misrepresented
© 2016 Continuum Analytics - Confidential & Proprietary
Saturation
9
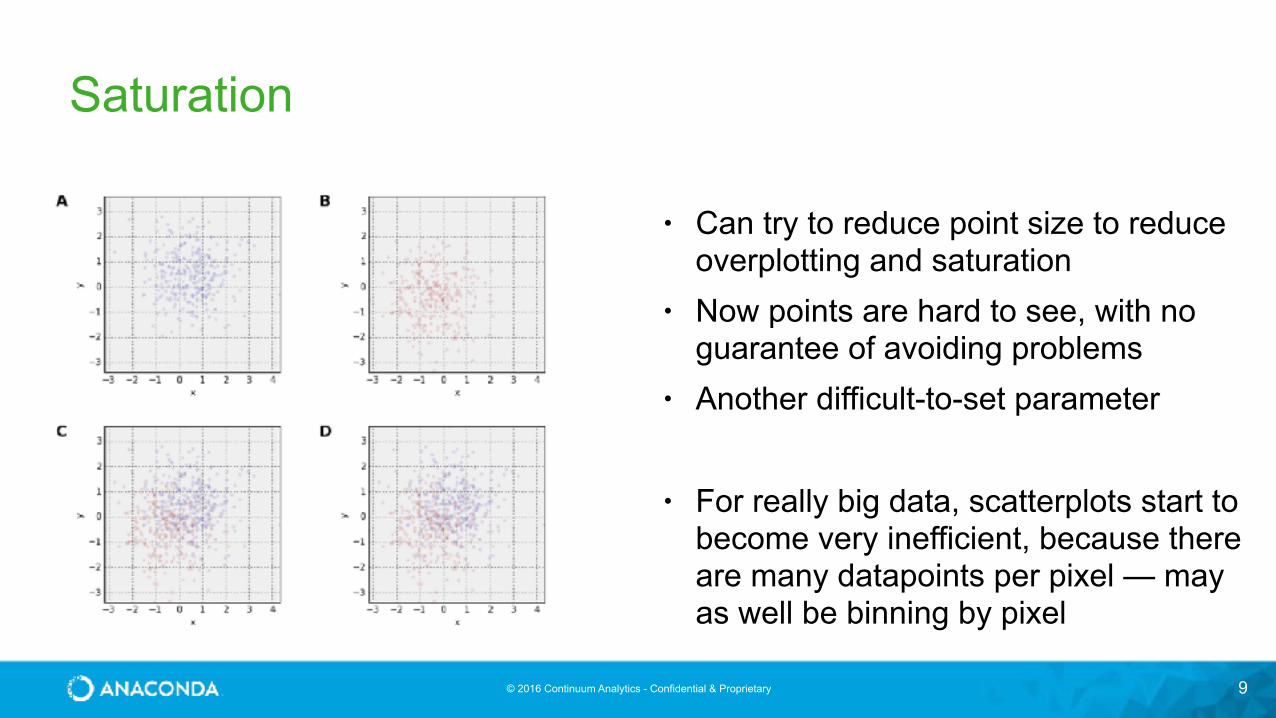
• Can try to reduce point size to reduce overplotting and saturation
• Now points are hard to see, with no guarantee of avoiding problems
• Another difficult-to-set parameter
• For really big data, scatterplots start to become very inefficient, because there are many datapoints per pixel — may as well be binning by pixel
© 2016 Continuum Analytics - Confidential & Proprietary
Binning issues
10
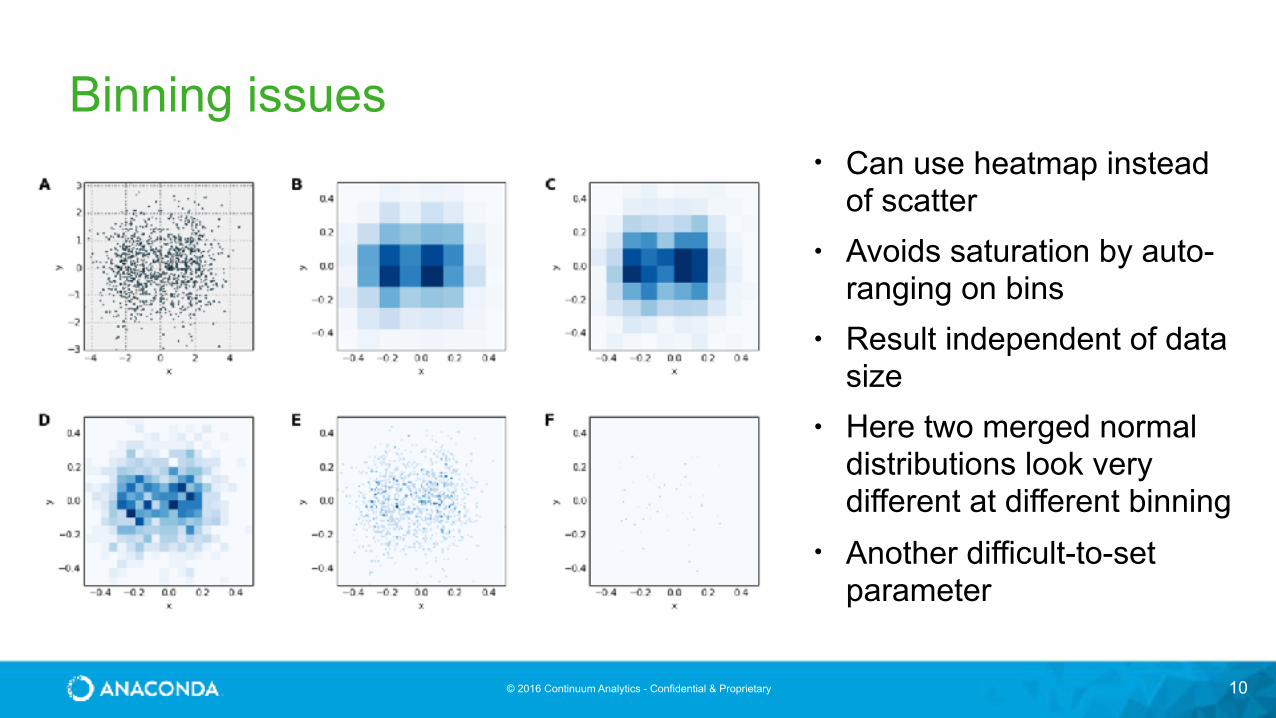
• Can use heatmap instead of scatter
• Avoids saturation by auto-ranging on bins
• Result independent of data size
• Here two merged normal distributions look very different at different binning
• Another difficult-to-set parameter
© 2016 Continuum Analytics - Confidential & Proprietary
Plotting big data
11
• When exploring really big data, the visualization is all you have — there’s no way to look at each of the individual data points
• Common plotting problems can lead to completely incorrect conclusions based on misleading visualizations
• Slow processing makes trial and error approach ineffective
When data is large, you don’t know when the viz is lying.

© 2016 Continuum Analytics - Confidential & Proprietary© 2016 Continuum Analytics - Confidential & Proprietary
Datashading

© 2016 Continuum Analytics - Confidential & Proprietary
Datashading
13
• Flexible, configurable pipeline for automatic plotting • Provides flexible plugins for viz stages, like in graphics shaders • Completely prevents overplotting, saturation, and undersaturation • Mitigates binning issues by providing fully interactive exploration in web
browsers, even of very large datasets on ordinary machines • Statistical transformations of data are a first-class aspect of the
visualization • Allows rapid iteration of visual styles & configs, interactive selections and
filtering, to support data exploration
© 2016 Continuum Analytics - Confidential & Proprietary
Datashading Pipeline: Projection
14
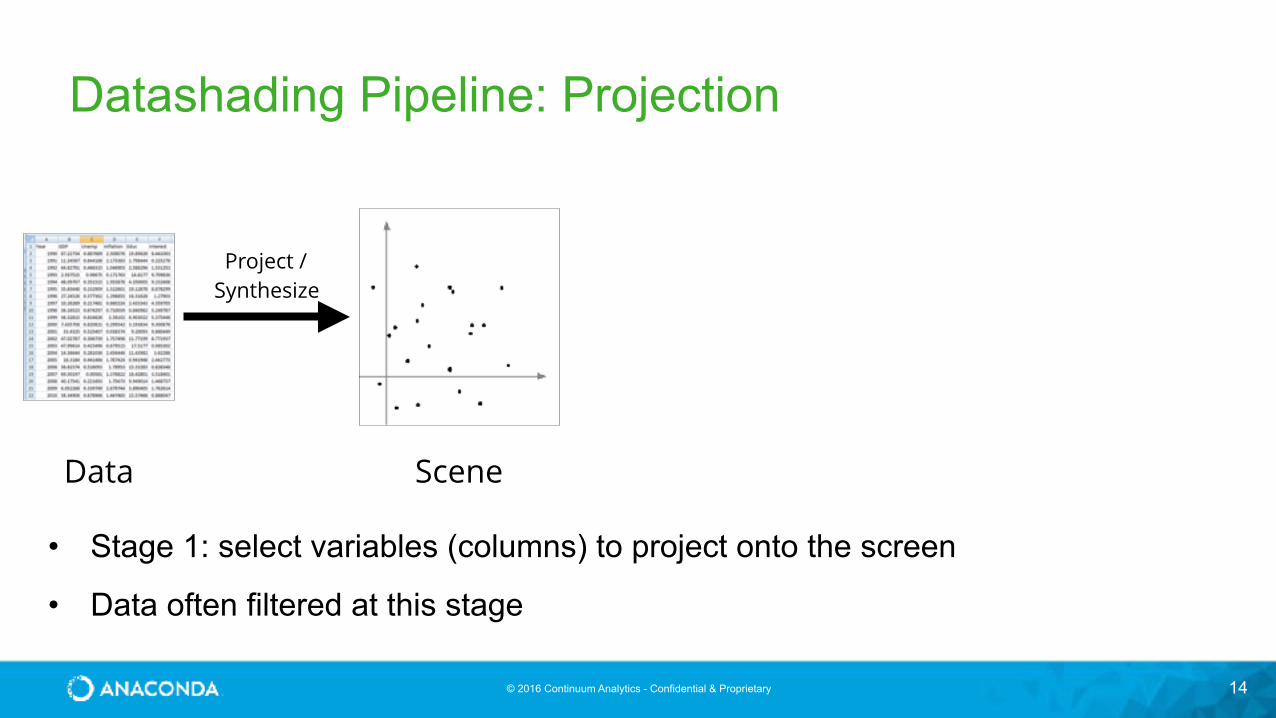
Data
Project / Synthesize
Scene
• Stage 1: select variables (columns) to project onto the screen
• Data often filtered at this stage
© 2016 Continuum Analytics - Confidential & Proprietary
Datashading Pipeline: Aggregation
15
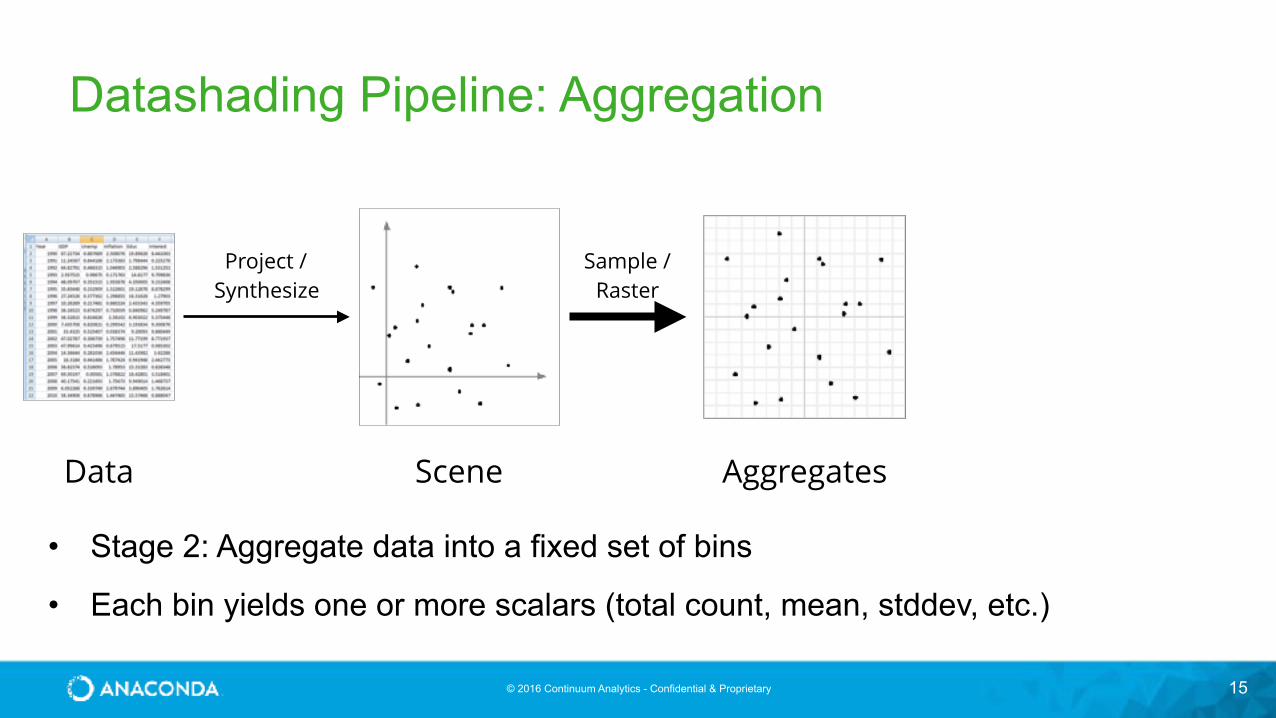
Data
Project / Synthesize
Scene Aggregates
Sample / Raster
• Stage 2: Aggregate data into a fixed set of bins
• Each bin yields one or more scalars (total count, mean, stddev, etc.)
© 2016 Continuum Analytics - Confidential & Proprietary
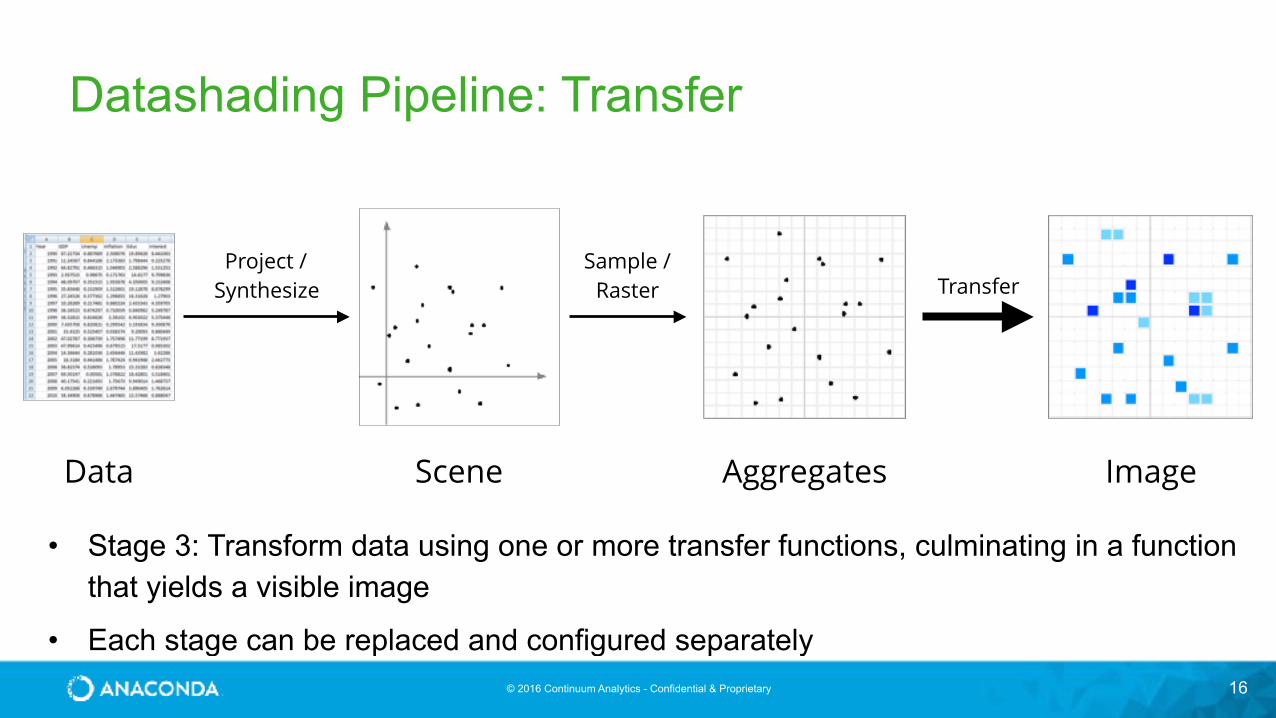
Datashading Pipeline: Transfer
16
Data
Project / Synthesize
Scene Aggregates
Sample / Raster Transfer
Image
• Stage 3: Transform data using one or more transfer functions, culminating in a function that yields a visible image
• Each stage can be replaced and configured separately
© 2016 Continuum Analytics - Confidential & Proprietary© 2016 Continuum Analytics - Confidential & Proprietary
Demos
© 2016 Continuum Analytics - Confidential & Proprietary© 2016 Continuum Analytics - Confidential & Proprietary
New Developments
© 2016 Continuum Analytics - Confidential & Proprietary
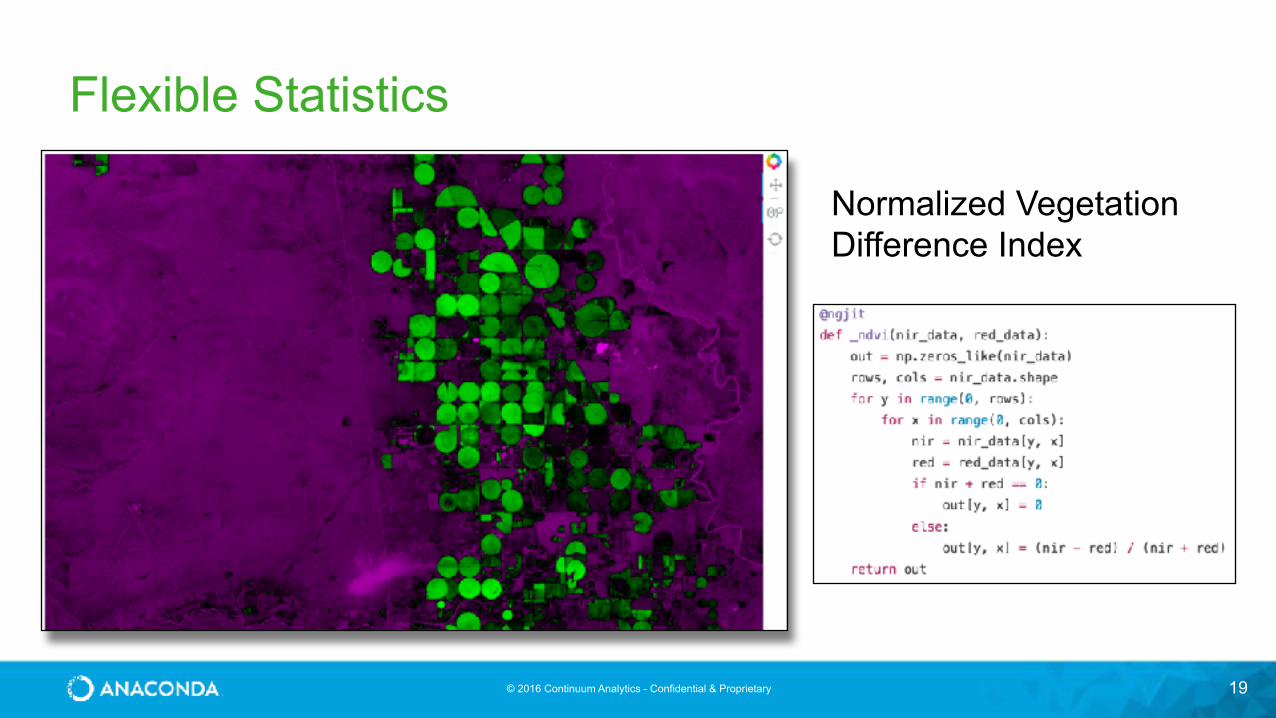
Flexible Statistics
19
Normalized Vegetation Difference Index
© 2016 Continuum Analytics - Confidential & Proprietary
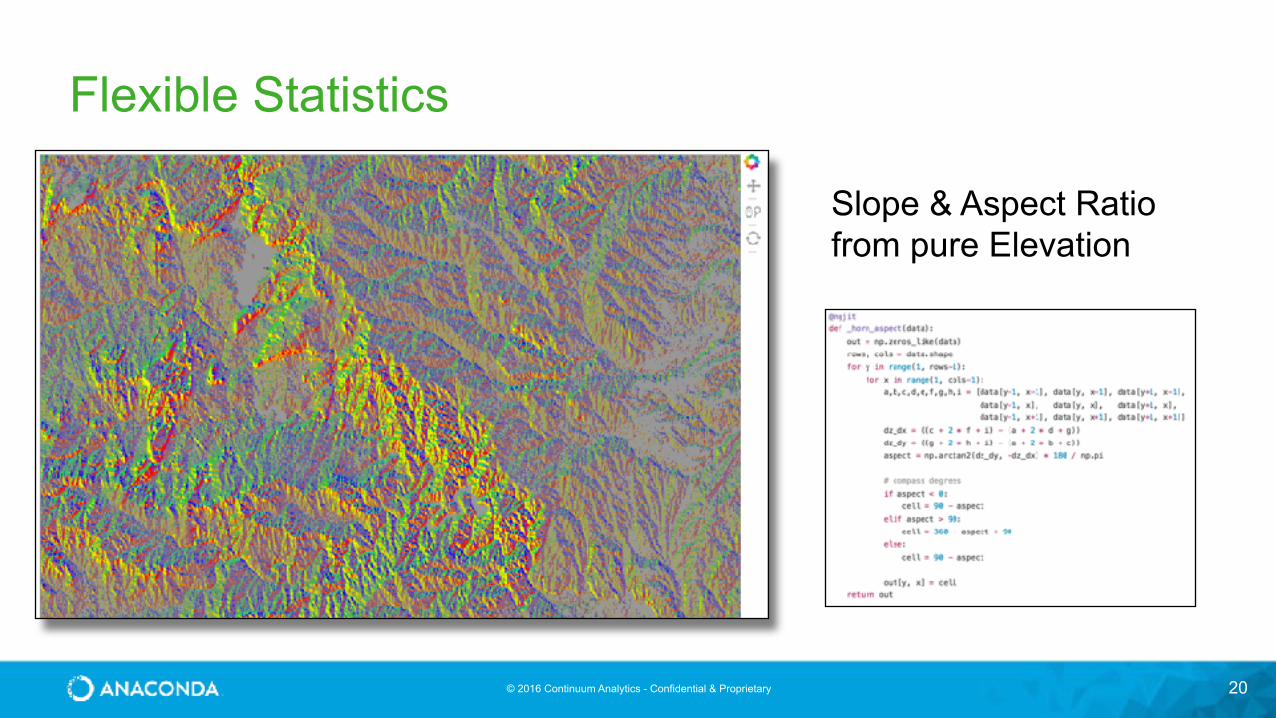
Flexible Statistics
20
Slope & Aspect Ratio from pure Elevation
© 2016 Continuum Analytics - Confidential & Proprietary© 2016 Continuum Analytics - Confidential & Proprietary
Anaconda
© 2016 Continuum Analytics - Confidential & Proprietary 22
• Simplify setup for non-engineers
• Enable easy development on and deployment to multiple platforms.
• Enable data scientists to experiment and iterate even more rapidly
• Eliminate the pains associated with package and dependency management
Why Did We Create Anaconda?To Enhance Python and Enable Data Scientist to Quickly Engage with Their Data
© 2016 Continuum Analytics - Confidential & Proprietary 23
Anaconda
Modern, Open-Source Analytics Platform powered by Python
Quickly Engage w/ Your Data
• 500+ Popular Python Packages
• Optimized & Compiled
• Free for Everyone
• Extensible via Conda Package Manager
• Sandbox Packages & Libraries
• Cross-Platform – Windows, Linux, Mac
• Not just Python - over 230 R packages
• Foundation of our Enterprise Products

© 2016 Continuum Analytics - Confidential & Proprietary 24
On-premises package repository and sharing platform • Governance for your analytics environment - maintain
control of the packages used by your analysts
• Easily replicate and share analysts’ environments
• Centrally store proprietary libraries and manage versioning
Cluster environment management • Manages Python, R, Java, Scala packages
across the cluster
• Easily replicate analysts’ environments for different jobs/users/groups
• Strong support for Hadoop & Spark
Anaconda Enterprise

© 2016 Continuum Analytics - Confidential & Proprietary 25
Anaconda EnterpriseScalable Computing and Collaboration
• Multi-user notebook deployments
• Scalable notebook deployment model • Project-based management • Notebook versioning and locking
• Extended support for Hadoop Stack (Storm, Spark Streaming, Kafka)
• Single sign-on support(PKI, Kerberos etc.) • Burst Compute support

© 2016 Continuum Analytics - Confidential & Proprietary 26
Consulting
Customers include: • JPL • DARPA • Sandia National Labs • AMD • Bank of America • Bloomberg
We Will Help Design, Architect, and Build the Right Analytics For You
Leverage our Open-Source Projects