Embed Size (px)
Citation preview

Click to edit Master subtitle style
Multicultural Populations in NSW.id briefing – 2016 Census population trends update
November 2017

2
understand your industry and working population
economic profile4 economy.id
plan for the futurepopulation forecast3 forecast.id
allocate your resourcessocial atlas2 atlas.id
understand your communitycommunity profile1 profile.id
Evidence base

National population and dwelling growth
3
-
50,000
100,000
150,000
200,000
250,000
300,000
350,000
400,000
450,000
500,000
1997 1998 1999 2000 2001 2002 2003 2004 2005 2006 2007 2008 2009 2010 2011 2012 2013 2014 2015 2016
Building Approvals Population Growth

Comparative growth among the states – 5 year
4
0.0%
2.0%
4.0%
6.0%
8.0%
10.0%
12.0%
14.0%
NSW Vic Qld SA WA Tas NT ACT
State % growth 2011-2016 5 year growth %

Population by 5 year age groups over 40 years, NSW
5
0
100,000
200,000
300,000
400,000
500,000
600,000Pe
rson
s
Age group
1976
1986
1996
2006
2016

National fertility rate, 1934 to 2014
6

Historical migration - national
7
0
50,000
100,000
150,000
200,000
250,000
300,000
350,000
Annual net migration

Net overseas migration
8
New South Wales, 1972-2016
0
10,000
20,000
30,000
40,000
50,000
60,000
70,000
80,000
90,000
100,000
Pers
ons
Year

Net interstate migration
9
New South Wales, 1972-2016
-40,000
-35,000
-30,000
-25,000
-20,000
-15,000
-10,000
-5,000
0
5,000
Pers
ons
Year

NSW LGA population growth, 2011 to 2016
10

NSW SA2 population growth, 2011 to 2016
11

12
• Online information tool, for council staff, and for the public.• Available for over 100 LGAs across NSW• 1991, 1996, 2001, 2006, 2011 and 2016 Census data.• A range of demographic topics for telling the changing story of each area.• Multicultural data on Ancestry, Birthplace, Language, Religion, Proficiency in English.• Broken into suburb/district areas• A range of benchmarks.• Detailed migration and SEIFA datasets.• Reporting and data export options designed to integrate with other output tools.• 2016 Census update now being rolled out (2nd release to come).• http://profile.id.com.au
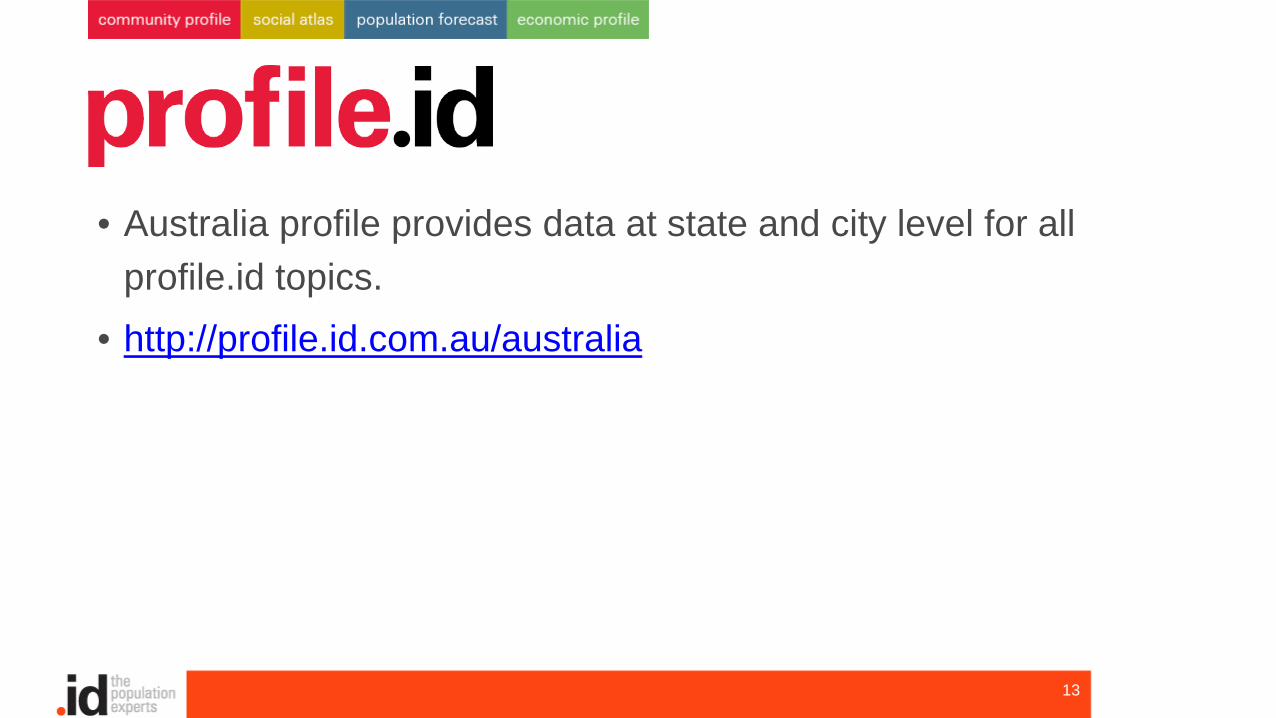
13
• Australia profile provides data at state and city level for all profile.id topics.
• http://profile.id.com.au/australia

2016 Census - update
14
• We are still updating the Census data.
• Currently, all first release data is in the main Area profiles section, for all areas.
• Indigenous profile will be updated by mid-November.
• Second release data will also go into the site by the end of November.
• atlas.id is now complete for 1st release data, with 2nd release by the end of the year.
• 2nd release data released October 23rd. Available to .id from November 10th.
• economy.id – NIEIR dataset for 2015/16 already released. Census data for 2016 with 2011 comparisons all updated by end January 2018.

Top 10 birthplaces in NSW
15
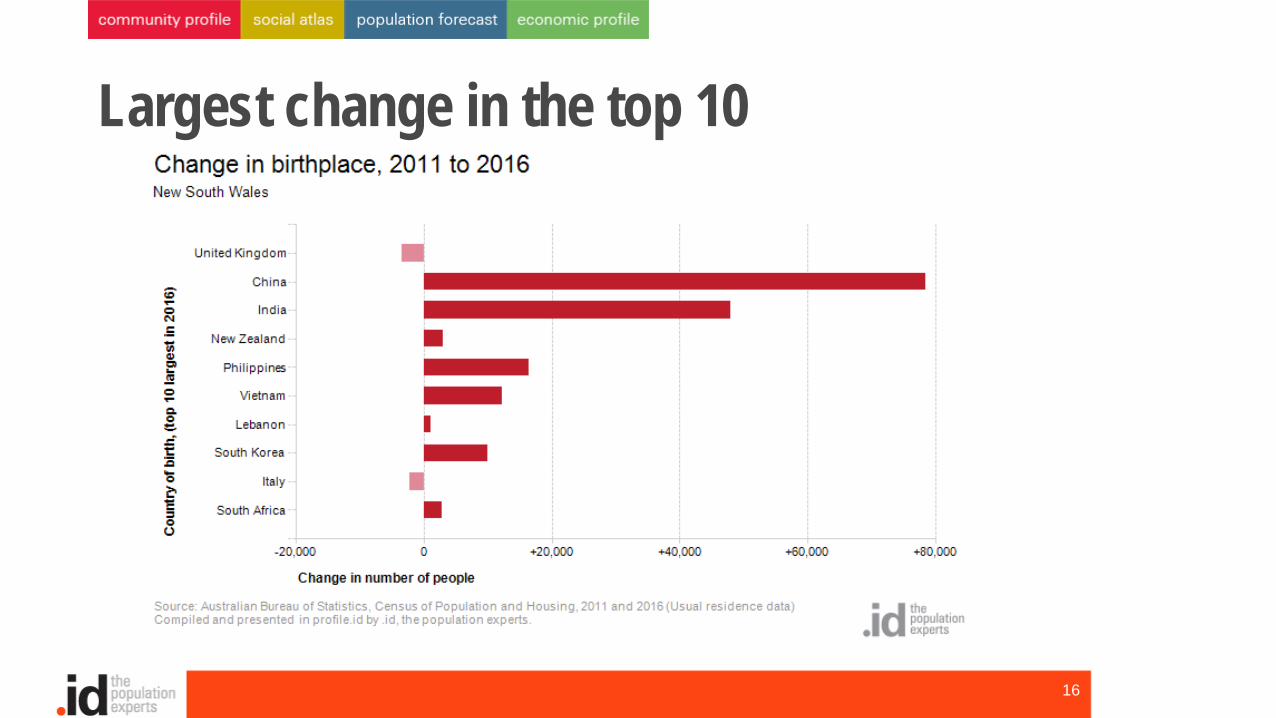
Largest change in the top 10
16

Changes outside the top 10
17
• Iraq + 10,962• Nepal + 16,860• Pakistan + 11,203• Bangladesh + 7,219• Iran + 7,583• Syria +4,179
• Croatia – 2,130• Malta – 1,313• Greece – 2,113• Netherlands – 1,262

Top 10 languages in NSW
18

Largest change in the top 10
19

Top 10 countries of origin in the past 5 years (No.)NSW, 2016
20
Country of Birth Arrived last 5 years Total persons% arrived last 5 years
China 73,446 234,506 31.3%
India 51,424 143,459 35.8%
United Kingdom 29,677 268,995 11.0%
Philippines 18,459 86,752 21.3%
New Zealand 17,036 117,138 14.5%
Nepal 15,764 32,122 49.1%
Iraq 12,276 40,276 30.5%
Korea (South) 12,138 51,817 23.4%
Vietnam 11,900 84,129 14.1%
Pakistan 11,485 24,523 46.8%

Top 10 countries of origin in the past 5 years (%)NSW, 2016
21
Country of Birth Arrived last 5 years Total persons % arrived last 5 years
Mongolia 1,249 1,560 80.1%
Saudi Arabia 2,012 3,570 56.4%
Brazil 6,297 12,317 51.1%
Nepal 15,764 32,122 49.1%
Nigeria 1,288 2,713 47.5%
United Arab Emirates 1,219 2,597 46.9%
Pakistan 11,485 24,523 46.8%
Mexico 740 1,697 43.6%
Syria 3,904 9,294 42.0%

Top 10 languages with poor English proficiency (NSW, 2016 and 2011)
22
Language 2016 2011 ChangeMandarin 68,161 36,601 31,560
Cantonese 38,768 36,278 2,490
Vietnamese 33,344 29,086 4,258
Arabic 31,939 28,478 3,461
Korean 19,949 15,806 4,143
Greek 12,576 13,802 - 1,226
Italian 9,588 11,078 - 1,490
Non-verbal, so described 9,091 5,727 3,364
Spanish 7,517 7,182 335
Thai 6,406 3,247 3,159
Macedonian 4,750 5,062 - 312

Top languages for those aged 55-74
23
Language Persons aged 55-74% of total 55-74 popEnglish 1,142,170 72.9%Cantonese 36,865 2.4%Mandarin 33,869 2.2%Arabic 30,375 1.9%Italian 21,632 1.4%Greek 19,391 1.2%Vietnamese 17,761 1.1%Tagalog/Filipino 15,977 1.0%Spanish 14,517 0.9%Macedonian 8,081 0.5%Korean 8,019 0.5%Hindi 7,814 0.5%Croatian 6,136 0.4%Maltese 5,676 0.4%

Top 10 Local Government Areas for % non-English speaking
24
LGA Language OTE Total Pop % Language OTE
Fairfield (C) 140,621 198,816 70.7%
Cumberland (A) 141,724 216,077 65.6%
Strathfield (A) 25,859 40,313 64.1%
Burwood (A) 23,397 36,810 63.6%
Canterbury-Bankstown (A) 208,187 346,300 60.1%
Bayside (A) 82,275 156,053 52.7%
Georges River (A) 78,578 146,834 53.5%
Parramatta (C) 117,540 226,153 52.0%
Liverpool (C) 106,018 204,330 51.9%
Ryde (C) 55,863 116,304 48.0%
Blacktown (C) 138,146 336,965 41.0%
Multicultural NSW site
25
• A resource for understanding diverse communities across the state of NSW• Geographic locations• Age structure• Birthplace, Language, Ancestry and Religion for each group.• Education, Occupation and Employment outcomes• 2016, 2011 and 2006 comparisons
• Free, public resource• http://multiculturalnsw.id.com.au

26
A Census tool for analysts and researchers• Complements profile.id,
with more data, including outside LGA.
• Login – subscription only service.
• Robust Census data• Presented in an easy-to-
use, interactive map • National coverage, local
detail.• Custom geography, for
any area.
• Explore spatially
Placemaker.id – 2016 Census explorer edition

27
Including the latest 2016 Census data
All the topics you know from community
profile, including;• Sex• Age• Ancestry• Religion• Housing• Education• Income• Employment• Industry
Complete list of Census topics
Census explorer tool also offers• Reliable change over time data from the last 3 Census periods (2006-2016)
• Custom catchments
• Custom schemes and formatting

28
Built-in reporting including
• Mini reports
• Full reports
• Export to Word, Excel or
preformatted PDF reports
• Export maps and raw data.
Report and export
http://home.id.com.au/census-explorer
Or ask after this presentation for more information
Single and multi-user licenses available.
Useful for Local Government and non-government users.