Embed Size (px)
Citation preview

Making the Most of Tweet-Inherent Features forSocial Spam Detection on Twitter
Bo Wang, Arkaitz Zubiaga, Maria Liakata and Rob Procter
Department of Computer ScienceUniversity of Warwick
18th May 2015
Social Spam on TwitterMotivation
• Social spam is an important issue in social media servicessuch as Twitter, e.g.:
• Users inject tweets in trending topics.• Users reply with promotional messages providing a link.
• We want to be able to identify these spam tweets in aTwitter stream.
Social Spam on TwitterHow Did we Feel the Need to Identify Spam?
• We started tracking events via streaming API.• They were often riddled with noisy tweets.
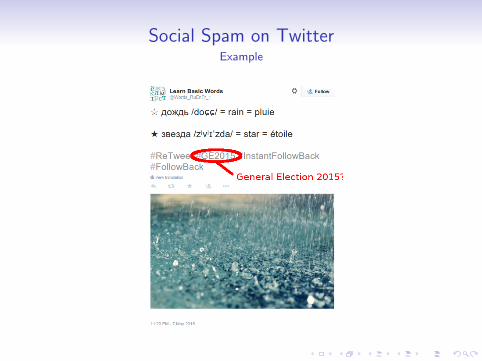
Social Spam on TwitterExample
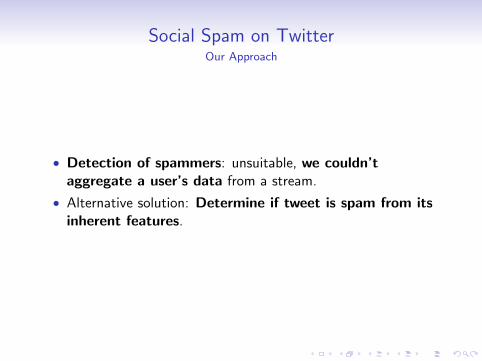
Social Spam on TwitterOur Approach
• Detection of spammers: unsuitable, we couldn’taggregate a user’s data from a stream.
• Alternative solution: Determine if tweet is spam from itsinherent features.
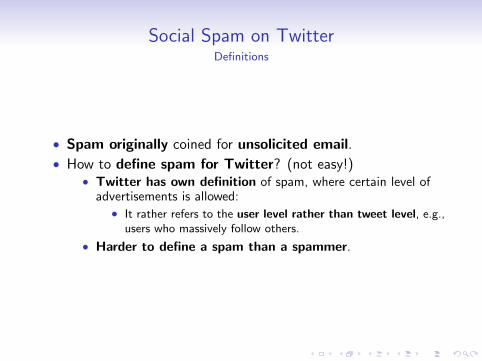
Social Spam on TwitterDefinitions
• Spam originally coined for unsolicited email.
• How to define spam for Twitter? (not easy!)• Twitter has own definition of spam, where certain level of
advertisements is allowed:• It rather refers to the user level rather than tweet level, e.g.,
users who massively follow others.
• Harder to define a spam than a spammer.
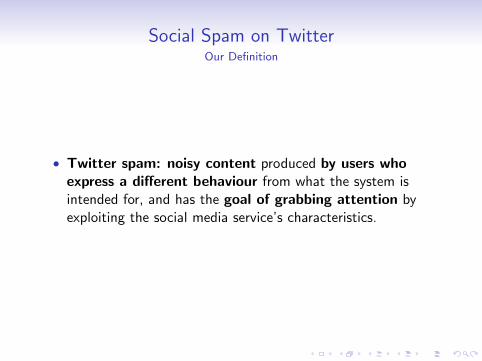
Social Spam on TwitterOur Definition
• Twitter spam: noisy content produced by users whoexpress a different behaviour from what the system isintended for, and has the goal of grabbing attention byexploiting the social media service’s characteristics.
Spammer vs. Spam DetectionWhat Did Others Do?
• Most previous work focused on spammer detection (users).
• They used features which are not readily available in atweet:
• For example, historical user behaviour and networkfeatures.
• Not feasible for our use.
Spammer vs. Spam DetectionWhat Do We Want To Do Instead?
• (Near) Real-time spam detection, limited to featuresreadily available in a stream of tweets.
• Contributions:• Test on two existing datasets, adapted to our purposes.• Definition of different feature sets.• Compare different classification algorithms.• Investigate the use of different tweet-inherent features.
Datasets
• We relied on two (spammer vs non-spammer) datasets:• Social Honeypot (Lee et al., 2011 [1]): used social honeypots
to attract spammers.• 1KS-10KN (Yang et al., 2011 [2]): harvested tweets
containing certain malicious URLs.
• Spammer dataset to our spam dataset: Randomly selectone tweet from each spammer or legitimate user.
• Social Honeypot: 20,707 spam vs 19,249 non-spam (∼1:1).• 1KS-10KN: 1,000 spam vs 9,828 non-spam (∼1:10).
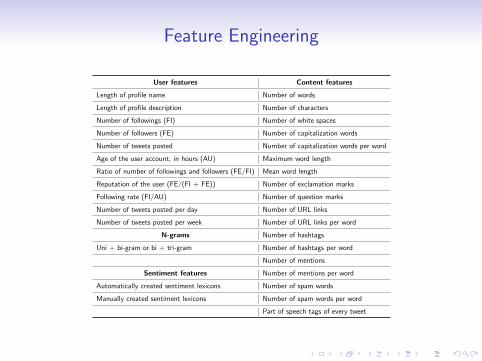
Feature Engineering
User features Content features
Length of profile name Number of words
Length of profile description Number of characters
Number of followings (FI) Number of white spaces
Number of followers (FE) Number of capitalization words
Number of tweets posted Number of capitalization words per word
Age of the user account, in hours (AU) Maximum word length
Ratio of number of followings and followers (FE/FI) Mean word length
Reputation of the user (FE/(FI + FE)) Number of exclamation marks
Following rate (FI/AU) Number of question marks
Number of tweets posted per day Number of URL links
Number of tweets posted per week Number of URL links per word
N-grams Number of hashtags
Uni + bi-gram or bi + tri-gram Number of hashtags per word
Number of mentions
Sentiment features Number of mentions per word
Automatically created sentiment lexicons Number of spam words
Manually created sentiment lexicons Number of spam words per word
Part of speech tags of every tweet
EvaluationExperiment Settings
• 5 widely-used classification algorithms: Bernoulli NaiveBayes, KNN, SVM, Decision Tree and Random Forests.
• Hyperparameters optimised from a subset of the datasetseparate from train/test sets.
• All 4 feature sets were combined.
• 10-fold cross-validation.
EvaluationSelection of Classifier
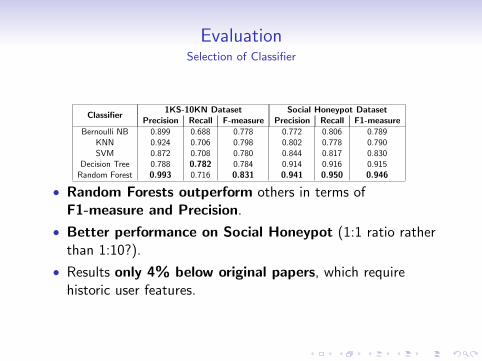
Classifier1KS-10KN Dataset Social Honeypot Dataset
Precision Recall F-measure Precision Recall F1-measureBernoulli NB 0.899 0.688 0.778 0.772 0.806 0.789
KNN 0.924 0.706 0.798 0.802 0.778 0.790SVM 0.872 0.708 0.780 0.844 0.817 0.830
Decision Tree 0.788 0.782 0.784 0.914 0.916 0.915Random Forest 0.993 0.716 0.831 0.941 0.950 0.946
• Random Forests outperform others in terms ofF1-measure and Precision.
• Better performance on Social Honeypot (1:1 ratio ratherthan 1:10?).
• Results only 4% below original papers, which requirehistoric user features.
EvaluationEvaluation of Features (w/ Random Forests)
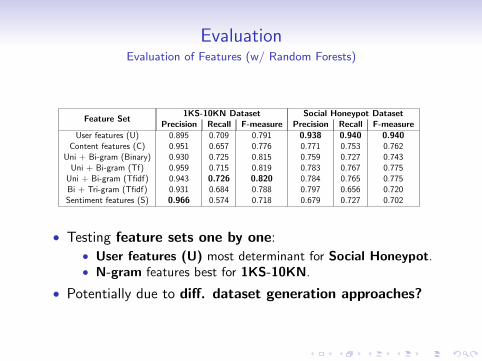
Feature Set1KS-10KN Dataset Social Honeypot Dataset
Precision Recall F-measure Precision Recall F-measureUser features (U) 0.895 0.709 0.791 0.938 0.940 0.940
Content features (C) 0.951 0.657 0.776 0.771 0.753 0.762Uni + Bi-gram (Binary) 0.930 0.725 0.815 0.759 0.727 0.743
Uni + Bi-gram (Tf) 0.959 0.715 0.819 0.783 0.767 0.775Uni + Bi-gram (Tfidf) 0.943 0.726 0.820 0.784 0.765 0.775Bi + Tri-gram (Tfidf) 0.931 0.684 0.788 0.797 0.656 0.720Sentiment features (S) 0.966 0.574 0.718 0.679 0.727 0.702
• Testing feature sets one by one:• User features (U) most determinant for Social Honeypot.• N-gram features best for 1KS-10KN.
• Potentially due to diff. dataset generation approaches?
EvaluationEvaluation of Features (w/ Random Forests)
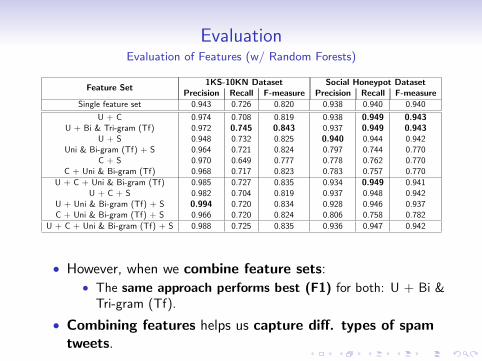
Feature Set1KS-10KN Dataset Social Honeypot Dataset
Precision Recall F-measure Precision Recall F-measureSingle feature set 0.943 0.726 0.820 0.938 0.940 0.940
U + C 0.974 0.708 0.819 0.938 0.949 0.943U + Bi & Tri-gram (Tf) 0.972 0.745 0.843 0.937 0.949 0.943
U + S 0.948 0.732 0.825 0.940 0.944 0.942Uni & Bi-gram (Tf) + S 0.964 0.721 0.824 0.797 0.744 0.770
C + S 0.970 0.649 0.777 0.778 0.762 0.770C + Uni & Bi-gram (Tf) 0.968 0.717 0.823 0.783 0.757 0.770
U + C + Uni & Bi-gram (Tf) 0.985 0.727 0.835 0.934 0.949 0.941U + C + S 0.982 0.704 0.819 0.937 0.948 0.942
U + Uni & Bi-gram (Tf) + S 0.994 0.720 0.834 0.928 0.946 0.937C + Uni & Bi-gram (Tf) + S 0.966 0.720 0.824 0.806 0.758 0.782
U + C + Uni & Bi-gram (Tf) + S 0.988 0.725 0.835 0.936 0.947 0.942
• However, when we combine feature sets:• The same approach performs best (F1) for both: U + Bi &
Tri-gram (Tf).
• Combining features helps us capture diff. types of spamtweets.
EvaluationComputational Efficiency
• Beyond accuracy, how can all these features be appliedefficiently in a stream?
EvaluationComputational Efficiency
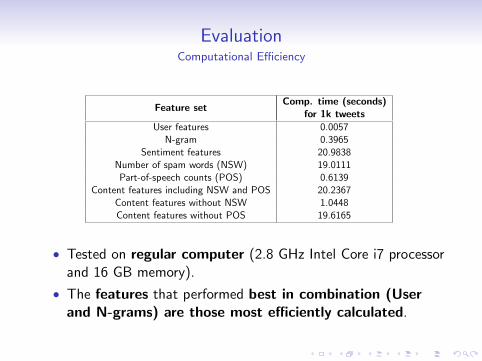
Feature setComp. time (seconds)
for 1k tweetsUser features 0.0057
N-gram 0.3965Sentiment features 20.9838
Number of spam words (NSW) 19.0111Part-of-speech counts (POS) 0.6139
Content features including NSW and POS 20.2367Content features without NSW 1.0448Content features without POS 19.6165
• Tested on regular computer (2.8 GHz Intel Core i7 processorand 16 GB memory).
• The features that performed best in combination (Userand N-grams) are those most efficiently calculated.
Conclusion
• Random Forests were found to be the most accurateclassifier.
• Comparable performance to previous work (-4%) whilelimiting features to those in a tweet.
• The use of multiple feature sets increases the possibilityto capture different spam types, and makes it moredifficult for spammers to evade.
• Diff. features perform better when used separately, butsame features are useful when combined.
Future Work
• Spam corpus constructed by picking tweets fromspammers.
• Need to study if legitimate users also likely to post spamtweets, and how it could affect the results.
• A more recent, manually labelled spam/non-spamdataset.
• Feasibility of cross-dataset spam classification?
That’s it!
• Any Questions?

K. Lee, B. D. Eoff, and J. Caverlee.Seven months with the devils: A long-term study of contentpolluters on twitter.In L. A. Adamic, R. A. Baeza-Yates, and S. Counts, editors,ICWSM. The AAAI Press, 2011.
C. Yang, R. C. Harkreader, and G. Gu.Die free or live hard? empirical evaluation and new design forfighting evolving twitter spammers.In Proceedings of the 14th International Conference on RecentAdvances in Intrusion Detection, RAID’11, pages 318–337,Berlin, Heidelberg, 2011. Springer-Verlag.