Embed Size (px)
Citation preview
TV: TRADITIONAL VS. ONLINE How and why viewers subscribe to traditional and online video services
Kyle Hamm, Erin LaRocque, Nima Moinpour, Steve Sietos Market Research for Media Managers
Professor Paul Lindstrom
Please note: Some source data is proprietary / confidential. All data in this study is intended solely for internal use in The New School’s Market Research course.
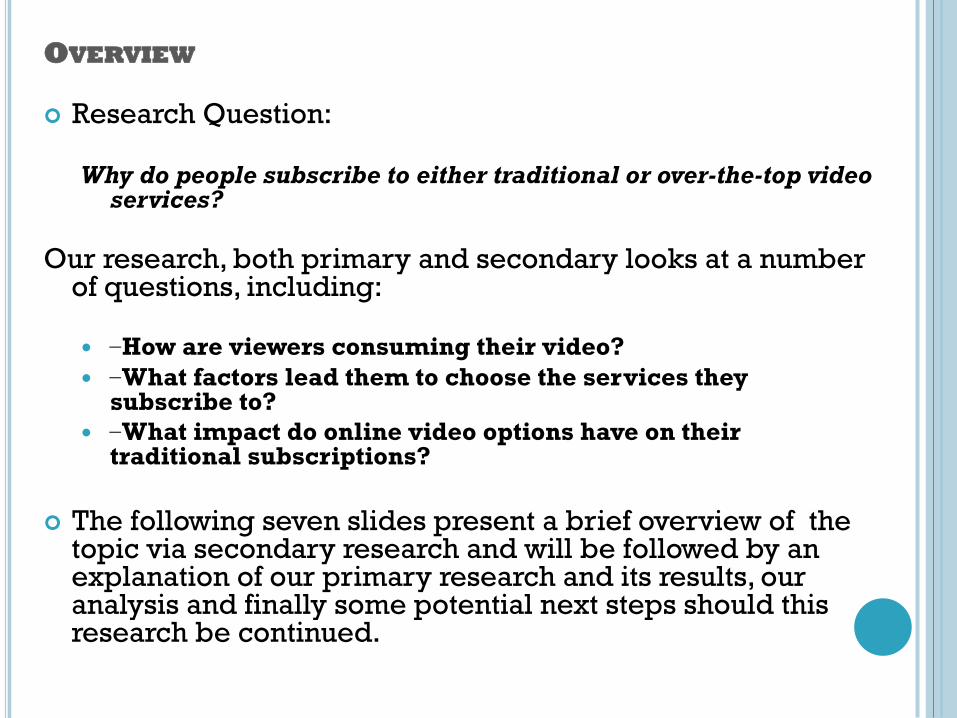
OVERVIEW
¢ Research Question: Why do people subscribe to either traditional or over-the-top video
services?
Our research, both primary and secondary looks at a number of questions, including: � �How are viewers consuming their video? � �What factors lead them to choose the services they
subscribe to? � �What impact do online video options have on their
traditional subscriptions?
¢ The following seven slides present a brief overview of the topic via secondary research and will be followed by an explanation of our primary research and its results, our analysis and finally some potential next steps should this research be continued.

IS VIDEO VIEWING CHANGING?
Yes, Exploding:
Expansion of Choices
Continues to Accelerate
VCR Cable & Satellite TV
Broadcast TV
The first 50 years DVR
VOD
DVD
The last 10 years
Early mobile video
Internet connected TV
Internet enabled TV
iPad TV apps
The last 5 years
Online video for PC
Cloud DVR
Source: Nielsen.

AMERICANS HAVE AN INSATIABLE HUNGER FOR VIDEO
It is NOT a Zero Sum Game
Total time spent with media is up and most consumption is still on the TV
In fact, TV viewing outpaces ALL internet
usage, not just video on the internet
The average American watches over 5 hours of video each day
94% of which is on traditional TV
Source: Nielsen, Cross-Platform Data, Quarter 1, 2012
Spring/Fall 2008 Distribution of Average Daily Minutes
But Screen Shifting is Taking Place
1st Quarter 2012 Distribution of Average Daily Minutes
SOURCE: NIELSEN VEMC 2008, CROSS-PLATFORM DATA, QUARTER 1, 2012

MVPDS TO FACE CONTINUED GROWTH FROM ONLINE
Source: SNL Kagan estimates. Subject to further qualifications available upon request.
• Nearly 90% of U.S. Households (HH) currently subscribe to a multichannel video programming distributor (MVPD) • Some analysts forecast that online will replace multichannel subscriptions at a steady pace
• Yet, even those analysts note that well over 80% of HHs that regularly watch online video still subscribe to an MVPD and will continue to do so

MORE AND MORE PEOPLE WATCHING VIDEO ONLINE…
Source: Leichtman Research Group - Emerging Video Services and Broadband Study 4/12. Subject to further qualifications available upon request.
Adults Watching Video Online: 18% in 2011 vs. 38% in 2012
2011 2012
Watch Type of Video Online at Home at Least Weekly Of all Adults- Including those not online

… VIA MULTIPLE DEVICES AND SERVICES
Source: Leichtman Research Group - Emerging Video Services and Broadband Study 4/12. Subject to further qualifications available upon request.
Devices Connected To The Internet
0.00% 10.00% 20.00% 30.00% 40.00% 50.00% 60.00%
Video game system connected to the internet
Blue-ray player connected to the internet
TV sets connected to the internet
Apple TV or Roku
Devices connect to Internet Projected to all households
Devices connect to Internet Of those with product

NOTABLE DIFFERENCES BETWEEN GENERATIONS
Source: Nielsen, The State of The Media: The Cross-Platform Report Qtr 2, 2012
...But TV still dominates among every age group
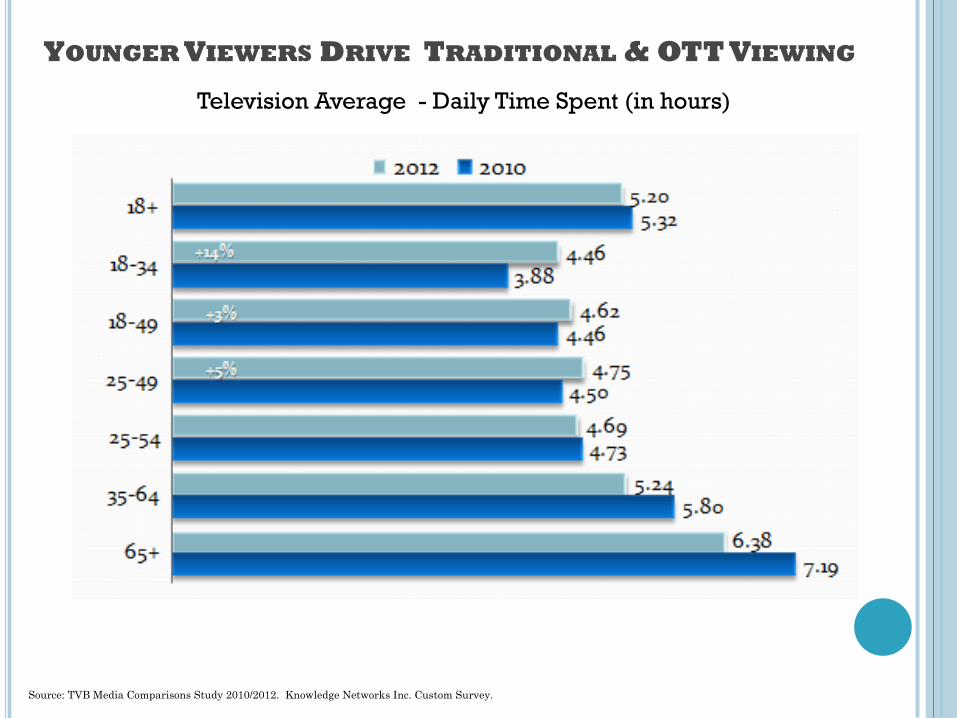
YOUNGER VIEWERS DRIVE TRADITIONAL & OTT VIEWING
Television Average - Daily Time Spent (in hours)
Source: TVB Media Comparisons Study 2010/2012. Knowledge Networks Inc. Custom Survey.

RESEARCH METHOD
¢ Primary Research � Short 20 Item Online Questionnaire via KwikSurveys.com � Distributed through Social Media
¢ Facebook ¢ LinkedIn ¢ Email
¢ Other Sources � Syndicated data:
¢ Multiple Nielsen Media Research reports - including custom studies, SNL Kagan, and ComScore
¢ Trade data: TVB study
¢ Primary research reports: Leichtman Research Group's: 1. Emerging Video Services and Broadband Study and 2. Trends in Multi-Channel Video Market Study

POPULATION & SAMPLING
You can call this "Convenient Non-Probability Online Sampling" Random or Non-Random, we can expect some Non-Sampling Errors: A) Non-Response B) Interpretation Error C) Data Analysis
It's not random and but ideally we would have spent to work with a Sample Provider to: 1) Define target population 2) Obtain some list 3) Design size/method 4) Draw the sample 5) Validate the sample To control for this a bit more we implemented instructions and but were not able to implement prompters. Since the survey was primarily circulated among our fellow students and colleagues in media industries, people working in media were likely over-sampled in our survey.
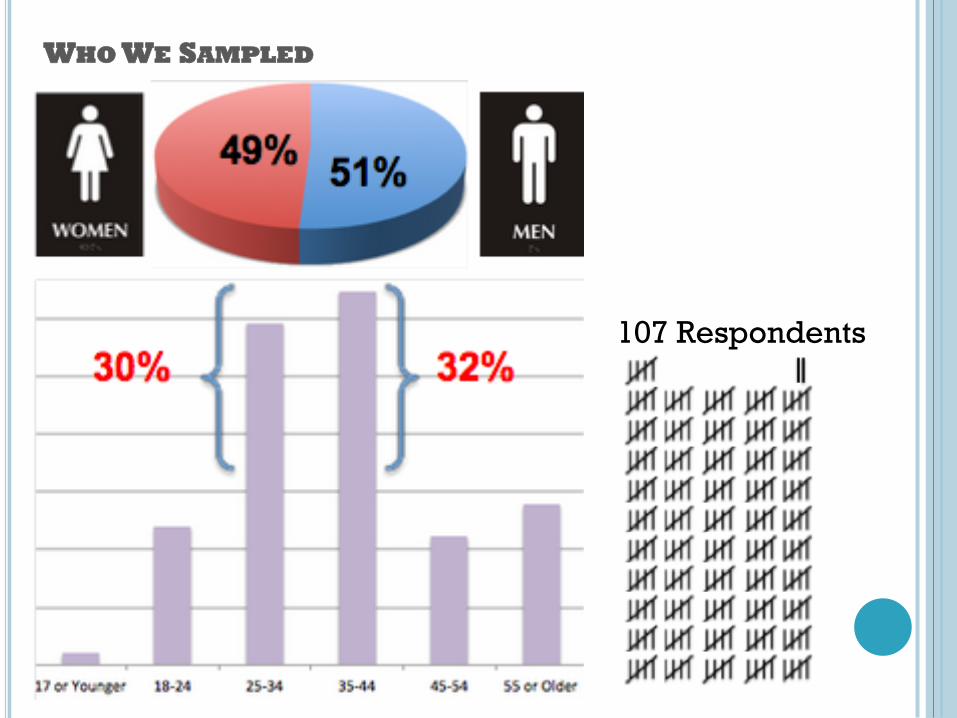
WHO WE SAMPLED
107 Respondents

Multichannel Video Subscriptions Nationwide
(Secondary Research)
Source: Leichtman Research Group - Trends in Multi-Channel Video Market 4/12. Subject to further qualifications available upon request.
Results from Primary Research: How would you classify your TV service?
(Can select >1)
Satellite (29%)
Cable (47%)
Telco TV (10%)
No multi-channel video service (12%)
No TV set (1%)
Both Cable and DBS (1%)
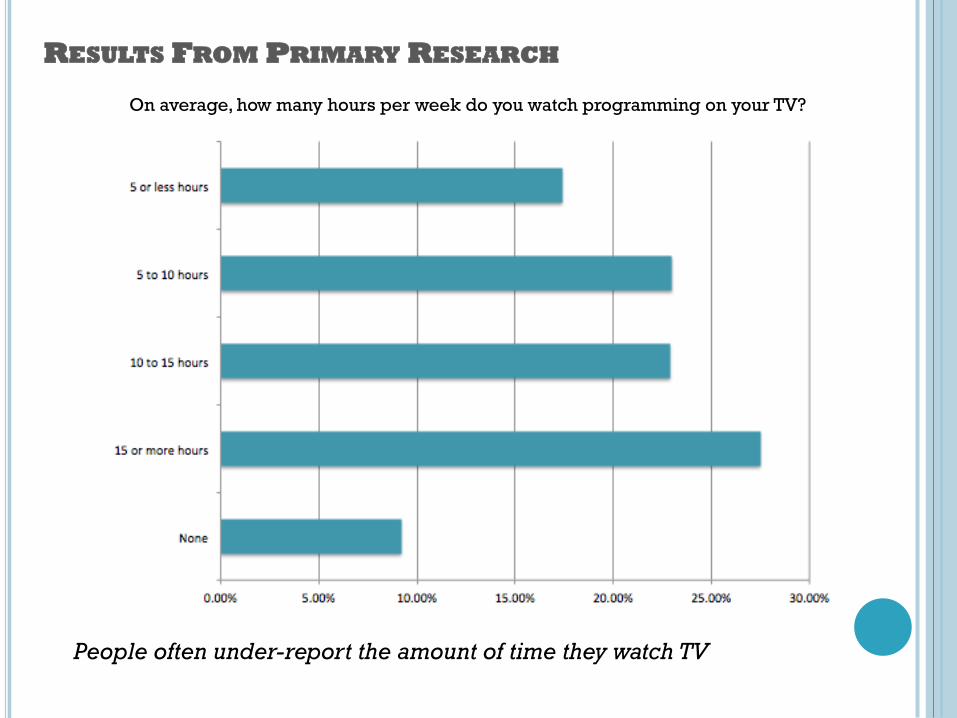
On average, how many hours per week do you watch programming on your TV?
RESULTS FROM PRIMARY RESEARCH
People often under-report the amount of time they watch TV

RESULTS OF PRIMARY RESEARCH
If you are not subscribed to a cable/satellite multi-channel TV service, do you plan to subscribe to in 2013?

RESULTS OF PRIMARY RESEARCH
On average, how many hours per week do you spend watching video online, on a personal computer, laptop, or a mobile device Vs. video on TV?
0.00% 10.00% 20.00% 30.00% 40.00% 50.00% 60.00%
None
5 or less hours
5 to 10 hours
10 to 15 hours
15 or more hours
TV
Online
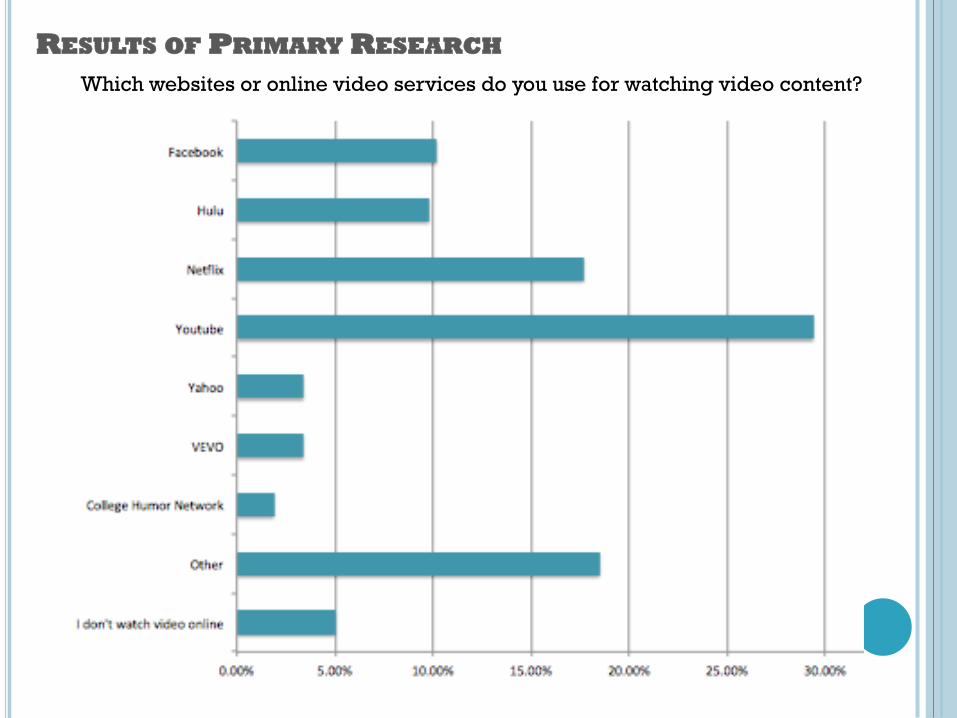
RESULTS OF PRIMARY RESEARCH Which websites or online video services do you use for watching video content?

RESULTS OF PRIMARY RESEARCH What types or genres of video do you watch online?
0 10 20 30 40 50 60
I don't watch video online
Other
Webinars & Presentations
Educational Programing
Music Videos
Movies
Archived TV shows
Current TV Shows
Sport Highlights/Analysis
Live Sports
News Highlights
Live News
Number of Respondents
Number of Respondents

RESULTS OF PRIMARY RESEARCH
In the past month, how often have you watched a full length TV show or movie online?
15%
23%
10%
2%
19%
31%

ANALYSIS & COMPARISON
¢ The Leichtman Research Group’s “Trends in Multi-Channel Video Market 4/12” found that nearly 90% of the U.S. households subscribe to a multichannel video programming distributor (MVPD).
¢ 70% of our survey respondents subscribe to a multichannel video programming distributor (MVPD), much less than the 90% in the Leichtman Research Group’s findings, but it was still a significant majority among our respondents that subscribe.
¢ The same Leichtman Research Group research found that those who view video online are slightly less likely than other to subscribe to a multi-channel video service: “83% who watch TV shows online weekly subscribe to a multi-channel video service – compared to 89% of all others.”
¢ 18% of our respondents indicated that they only watch video online and nearly 54% respondents said they had watched a full-length TV show or movie online either every day or several times per week in the past month.

RESULTS OF PRIMARY RESEARCH
In 2013, do you plan to cancel cable/satellite and use only the Internet for video content?

RESULTS OF PRIMARY RESEARCH
I plan on canceling my subscription due to:

SECONDARY RESEARCH
Switching from MVPD to Online Only Only a Few % of MVPD HHs Would Consider Disconnecting Their TV Service to Only
Watch Video Online
Source: Leichtman Research Group - Trends in Multi-Channel Video Market 4/12. Subject to further qualifications available upon request.
Yes (16%)
No (84%)

Results from Primary Research: Do you agree or disagree: Due to online video I now watch less programming on TV
Source: Nielsen Custom Study, February 2012, including Streaming Devices (Apple TV, Roku, Boxee), Total Day, P2+
When a Household Adds a Streaming Device Usage Continues to be Small -
but Not Insignificant
Almost 1% of households use a streaming device
0.00% 5.00% 10.00% 15.00% 20.00% 25.00% 30.00%
Strongly Agree
Somewhat Agree
Somewhat Disagree
Strongly Disagree
Neither Agree or Disagree
Strongly Agree
Somewhat Agree
Somewhat Disagree
Strongly Disagree
Neither Agree or Disagree
Secondary Research

RESULTS OF PRIMARY RESEARCH
Do you spend less money on your cable/satellite subscription due to the availability of online video?
0.00%
10.00%
20.00%
30.00%
40.00%
50.00%
60.00%
70.00%
80.00%
Yes, Because SOME of what I want is available
online
Yes, Because ALL of what I want is available online
No, I spend the same regardless of availability online
Yes, Because SOME of what I want is available online
Yes, Because ALL of what I want is available online
No, I spend the same regardless of availability online

SECONDARY RESEARCH: WATCHING TV LESS DUE TO ONLINE
Source: Leichtman Research Group - Emerging Video Services and Broadband Study 4/12. Subject to further qualifications available upon request.
Strongly Agree (11%)
Strongly Disagree (71%)
Somewhat Agree (18%)
Watch TV Less Often Since Watching Video Online (1-10) (Watched Video Online in the Past Month)

SECONDARY RESEARCH: TV DOMINANT
Source: Nielsen, The State of The Media: The Cross-Platform Report Qtr 2, 2012

ANALYSIS & COMPARISON
¢ The Leichtman Research Group’s “Trends in Multi-Channel Video Market 4/12” found that 5% of households subscribing to an MPVD would consider unsubscribing from them to watch video only online.
¢ Our survey results are mostly in line with these findings as well. Nearly 4% of our respondents said that they plan to cancel their cable or satellite subscriptions in 2013 and switch to online-only viewing.
¢ Reasons were cost of cable/satellite was too high or infrequent use.
¢ Nearly 80% of our survey respondents indicated that they spend the same amount of money on their cable/satellite service, regardless of online viewing.
¢ The Leichtman Research Group’s findings show that 75% of subscribers disagree that they are watching less TV since watching online video.
¢ Our survey also found that while 42% of respondents agreed that they watch less TV due to online video, only 26% of respondents indicated that they spend less money on their cable/satellite subscriptions due to online video.

RESULTS OF PRIMARY RESEARCH
Please mark which of these devices you own.
0.00%
10.00%
20.00%
30.00%
40.00%
50.00%
60.00%
None 5 or less hours 5 to 10 hours 10 to 15 hours 15 or more hours
Online

SECONDARY RESEARCH: DEVICES OWNED
Source: Nielsen Mobile Connected Devices report, Tablet/IPTV Nielsen NPOWER/Custom *IPTV (Capable/Enabled)
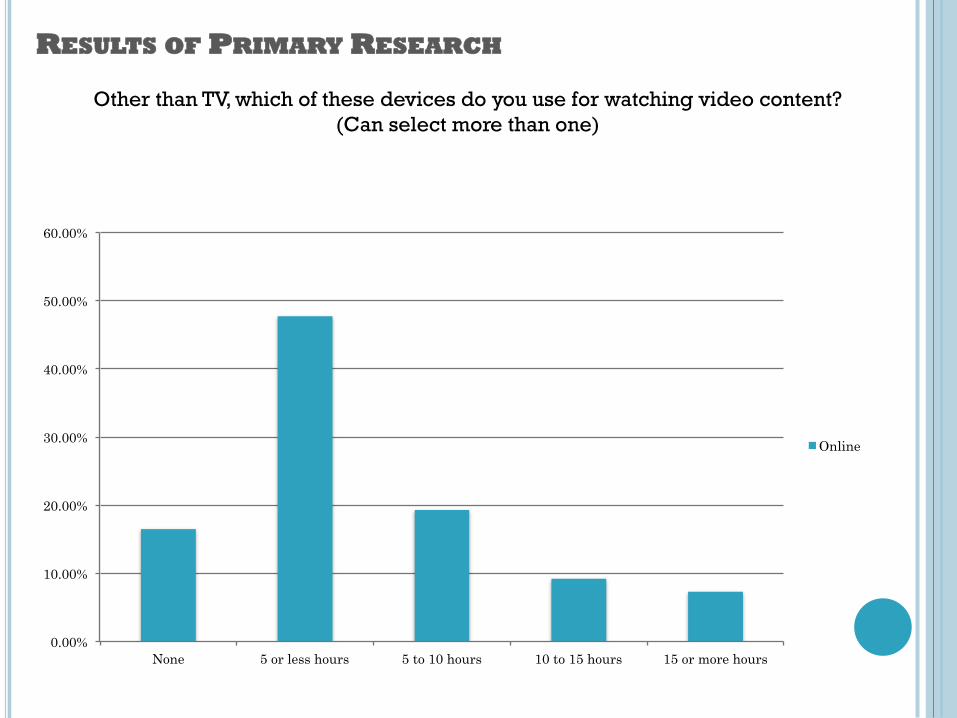
RESULTS OF PRIMARY RESEARCH
Other than TV, which of these devices do you use for watching video content? (Can select more than one)
0.00%
10.00%
20.00%
30.00%
40.00%
50.00%
60.00%
None 5 or less hours 5 to 10 hours 10 to 15 hours 15 or more hours
Online
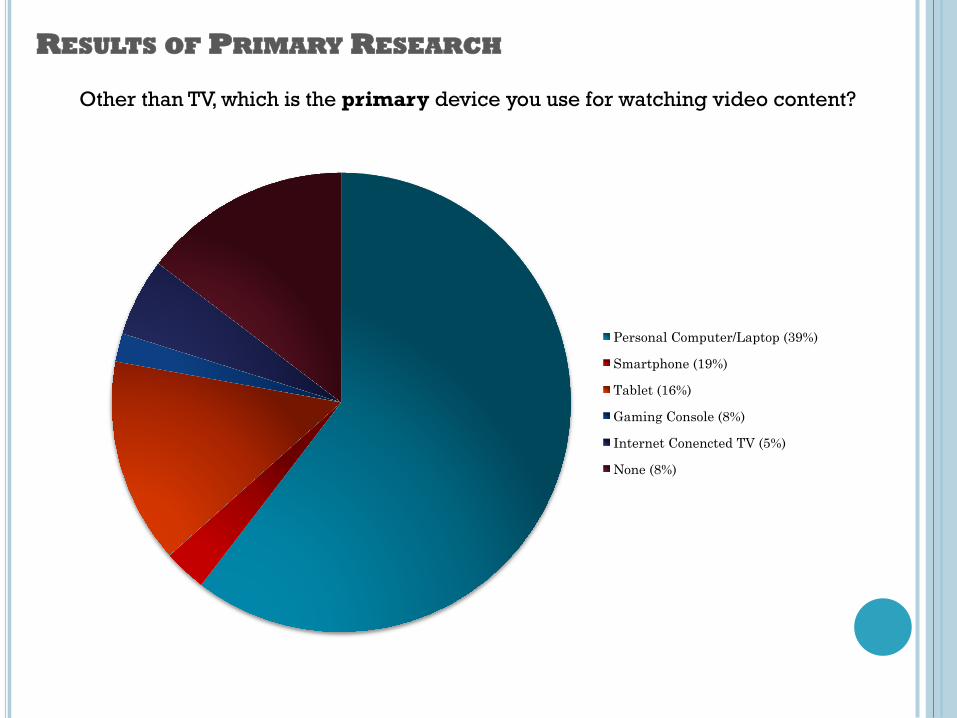
RESULTS OF PRIMARY RESEARCH
Other than TV, which is the primary device you use for watching video content?
Personal Computer/Laptop (39%)
Smartphone (19%)
Tablet (16%)
Gaming Console (8%)
Internet Conencted TV (5%)
None (8%)

SECONDARY RESEARCH: INTEREST IN WATCHING ON VARIOUS DEVICES
0.00% 10.00% 20.00% 30.00% 40.00% 50.00% 60.00%
Watch anything, anytime, anywhere
Watch video from Internet on TV
Watch TV shows and movies on a computer
Watch TV shows and movies on a tablet
Watch TV shows and movies on a smartphone
Interest in Watching on Various Devices 55+
Interest in Watching on Various Devices 35-54
Interest in Watching on Various Devices 18-34
Source: Leichtman Research Group - Emerging Video Services and Broadband Study 4/12. Subject to further qualifications available upon request.

ANALYSIS & COMPARISON ¢ Now, more than ever, there are more and more choices for viewers as to what
devices they use to watch video and video providers are finding ways to distribute their products across those platforms.
¢ As the Nielsen Mobile Connected Devices report shows, ownership of Video Game consoles, DVRs, smartphones, tablets and IPTVs are continually growing and trending upwards.
¢ In our own findings, only one survey respondent indicated that they did not own at least one of the following: personal computer/laptop, smartphone, tablet, personal media device (ex. iPod), gaming console, or Internet connected TV and many respondents own more than one of these devices.
¢ In our follow-up question, only 17 respondents (of the 107 total respondents)
indicated that they do not use one of these devices that they own for watching video.. The rest of our respondents, 84%, indicated that they use at least one of or more than one of these alternate devices for watching video, with personal computers being the primary device, other than TV, used for watching video.
¢ In the Leichtman Research Group ‘s Emerging Video Services and Broadband Study,
there is consistency among those aged 18-34 who wish to be able to watch video content across various devices, more so than those aged 35-54 or 55+.
POSSIBLE NEXT STEPS
¢ 62/107 (48%) said they have cable. ¢ Next step: Which service and what are the pros and cons? (Question #1) ¢ 1 out 3 people said the cost of service associated with the service is a
determining factor.
¢ Next Step: Developing a questionnaire with much more depth into economics.
¢ 1 out of 10 people said ease of use and customer service is a determining factor.
¢ Next Step: Explore and define "easy use," and "good customer service." ¢ 50% of the people who plan to subscribe in 2013 said because it is the
most convenient option. Next Step: Thoroughly examine "convenience."

NEXT STEPS
Question 9 asks: Do you agree or disagree with the following statement: Due to online video, I now watch less programming on Television.
This is the core of this study. Next step: It would be interesting to find out if this translates over in a random sample.

NEXT STEPS
Question 10 asks: Do you spend less money on your cable/satellite service due to the availability of online video?
42% of our respondents strongly agreed or somewhat agreed that due to access to online video, they now watch less TV. However, as shown in the table to the left, only 26% of our respondents said that their TV spending has decreased. Next Step: Find out how come the majority have done nothing to lower their subscriptions costs.