Embed Size (px)
Citation preview

Overview of FOPL's Ontario Public Library Statistics and
Measurements Report
Dr. Robert Molyneux, MLIS, PhDStephen Abram, MLA , FOPL Executive Director
August 14, 2015
Today’s Webinar
August 14th, 2015 Noon-1 pm
Overview of FOPL's Ontario Public Library Statistics and Measurements Report

Future Webinars in this series
August 17th Noon-1 pm Overview of FOPL's Market Probe Canada Public Opinion
Poll of Ontarians and Public Libraries Speaker: Carol French, Senior Vice President, Research &
Client Services, Market Probe Canada
August 28th Noon-1 pm Strategic Use and Insights from FOPL's Ontario Public
Library Statistics, Polls, and Measurements Speakers: Robert Molyneux, MSLS, PhD Stephen Abram, MLS, executive director FOPL
3

Introductions
Today’s Speakers
Dr. Robert Molyneux, MLIS, PhDStephen Abram, MLA , FOPL Executive Director
4

Context of FOPL Stats and Measurements
Statistics and Measurements Strategies– Participate in CLA task force on national statistics– Host 2 iSchool symposia on measurements for libraries– Lobby for open data for public libraries– Publish analysis of Ministry data collection for 2001-2013.– Publish Market Probe opinion polls for 2015 (building on 2001,
2006, 2010 polls)– Host and record these webinars– Coming Soon: FOPL Index of Community Engagement
Thank you to the Ministry of Tourism Culture and Sport for some support
5

Limits of Library Statistics
Library statistics are very complicated and complex. Most libraries do not have a strong culture of
measurement. What is the difference between statistics, measurements,
polls, etc. All numbers have inherent risk when communicated and
interpreted. Data - Information - Knowledge - Action/Decisions
6

Potential Comparisons
Compare by size of population (or any other data point (expenditures per capita, etc.)
North – South (e.g. SOLS vs. OLS North Libraries) Rural, Remote, Town, County, Suburban, Urban
Libraries Special Groups – Francophone, First Nations, etc. Regional comparisons (e.g. libraries around Ajax or
libraries around Waterloo) Handpick a peer cohort
7

What do we normally use our data for?
Strategic Planning Program Analysis Budget justifications and comparisons Tracking success, growth, decline Decision support Finding libraries like ours to compare our experience to
theirs– Which means they can be a directory to libraries like
mine for benchmarking and cohort analysis– Comparing like with like is important
And more . . . We will add trying to get a sense of the health and trends in
Ontario’s public libraries
8

If you’re not collecting the data to inform an action, then why are you expending the effort?
Making Decisions and Choices

Library data have a long history
10
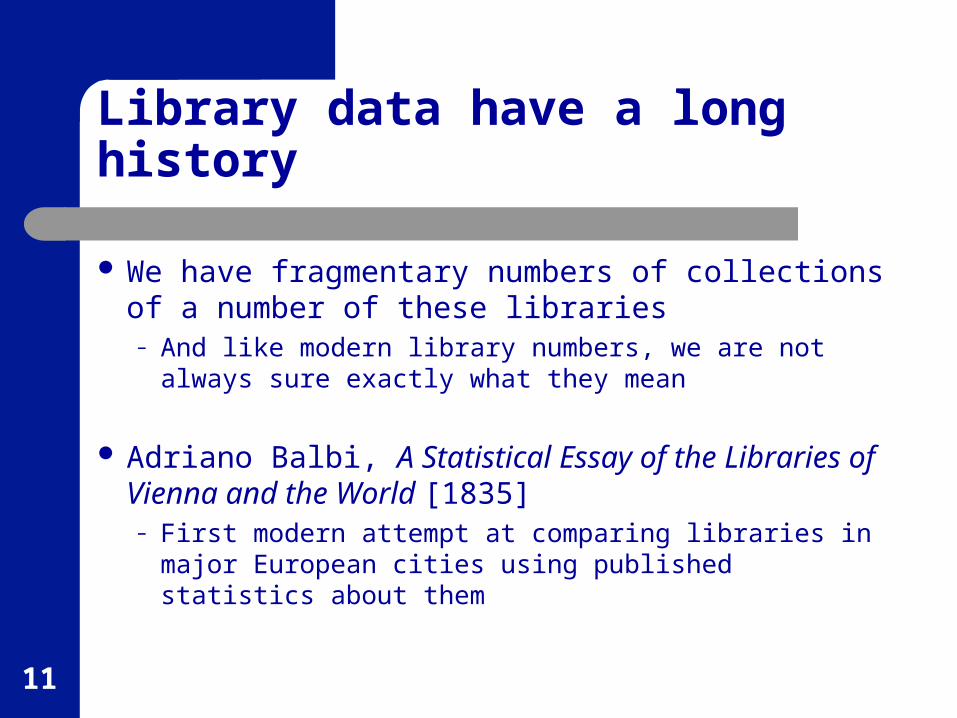
Library data have a long history
We have fragmentary numbers of collections of a number of these libraries– And like modern library numbers, we are not always
sure exactly what they mean
Adriano Balbi, A Statistical Essay of the Libraries of Vienna and the World [1835]– First modern attempt at comparing libraries in major
European cities using published statistics about them
11

Balbi’s observations
“disheartened by a disparity of opinion…” “only approximate data” “exaggerated” numbers in pursuit of prestige
Then a wonderful discussion of the problems of comparative library data
12

Types of library data
Balbi was dealing with reports by visitors to various libraries at different times who recorded estimates they heard from a variety of people– One-time studies done by different methods
Episodic surveys– Attitudinal surveys—particularly users and
non-users– Data collection on fugitive or new subjects
13

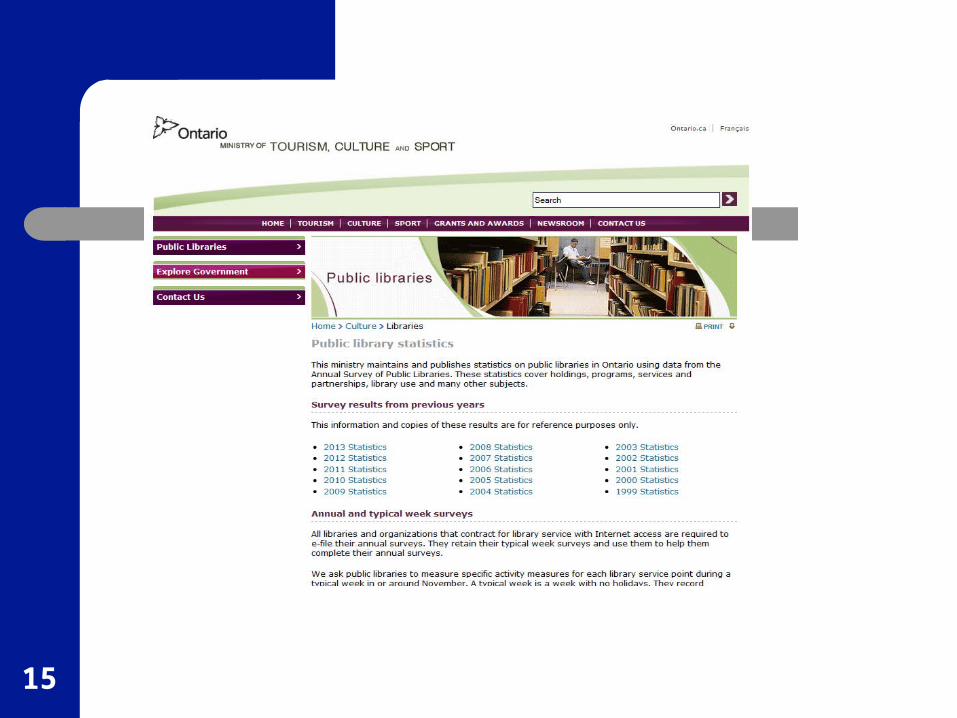
The data we are going to discuss are systematically collected, annual data, professionally compiled from surveys of Ontario public libraries by the Ministry of Tourism, Culture, and Sport
Available from 1999-2013 in pdf
14
15

16

17

Now converted to csv files
The Ministry has reissued these data in csv (“comma-separated values”) which means they can be read into a spreadsheet program such as Excel or LibreOffice Calc readily.
In other words, there is not a chance of introducing error when you rekey data.
This is a tremendous boon to studying our libraries using these data.
18

19

20

21

22

What can we do with these data?
We can look at any variables we choose for individual libraries in one year or all libraries in one year. – For example: How big were the budgets of Ontario
libraries in 2013? With a good bit of work, we can rearrange the
data and look at the select variables through time—that is, trends.– Say: What happened to their budgets from 2001-2013?
23

We did a bit of both and more
The report is a sampler of what can be done with these kinds of data with the focus on a province-wide view, not individual libraries
24

We did not use all data from this series for our report
Small number of variables In order to analyze trends properly, we only used
data from libraries which reported each year. For this study, that number is 301 libraries
Years 2001-2013 We separated them into 9 “Bands”—8 by size plus
the First Nations’ Libraries in a 9th Band. – The Ministry did the same thing– This is common practice in this kind of analysis
25

LET’S TAKE A TOUR THROUGH THE REPORT
26

First the Primer
The big story is the consistent characteristic of the library world that affects about everything:– Skewed distribution: a few large libraries and many
small ones In 2013, the 10 largest libraries (of 300+) had 60% of the
total circulations and 54% of the total expenditures.
We must take these characteristics into account in analyzing data– Hence, our size “Bands” which follow Ministry practice
27
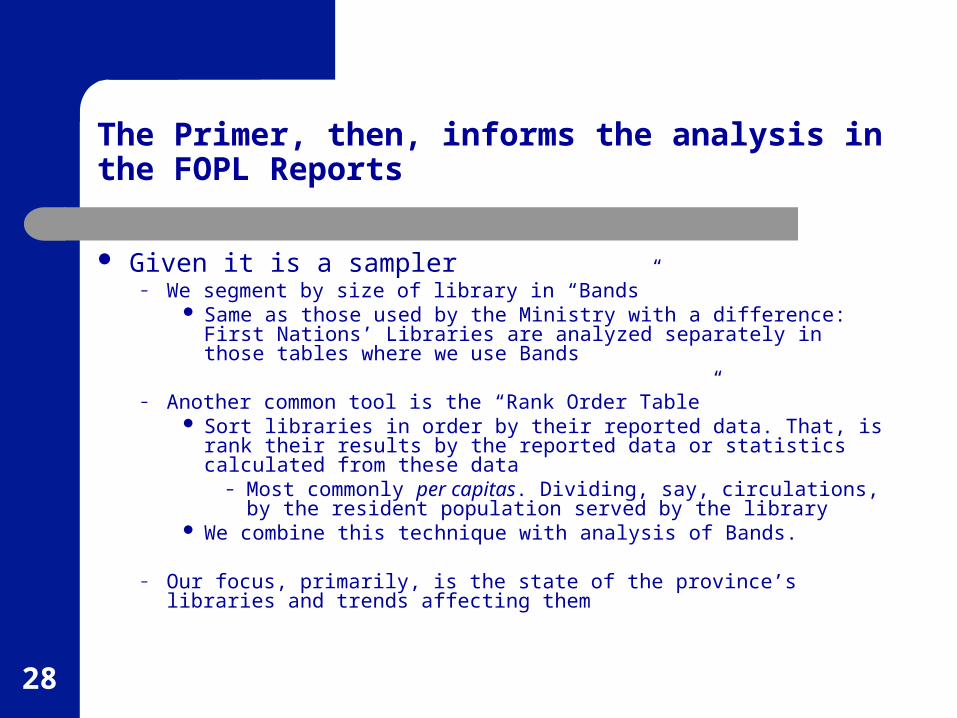
The Primer, then, informs the analysis in the FOPL Reports
Given it is a sampler– We segment by size of library in “Bands”
Same as those used by the Ministry with a difference: First Nations’ Libraries are analyzed separately in those tables where we use Bands
– Another common tool is the “Rank Order Table” Sort libraries in order by their reported data. That, is rank their results
by the reported data or statistics calculated from these data– Most commonly per capitas. Dividing, say, circulations, by the
resident population served by the library We combine this technique with analysis of Bands.
– Our focus, primarily, is the state of the province’s libraries and trends affecting them
28

There are many other things you could do with these data
This is a rich series
29

ONWARD! 2013 KEY RATIOS!
30
2013 data per capita and per cardholder
Thirteen ratios, all libraries The ratios are largely those we focus on in
the rest of the report. As the Primer showed, per capitas allow
apples to apples comparisons of libraries of vastly different sizes– You may be small, but you may be doing a better
job with what you have than bigger libraries.
31
Using the Spreadsheet Versions
You have pre-crafted tables in the report(s) You could take the spreadsheet and mosey
around in it a bit. Sort by this or that—it is a very busy table and one hard to show in slides
FOPL can make the spreadsheet available to the members on request.
We are also happy to do custom analysis for you on request for a quoted fee.
32

A bit of caution if you work with spreadsheets
Save a copy of the original spreadsheet Did I mention saving a copy of the original and
don’t change it Make another copy for analysis. If you make a
mistake, you always can go back to the safe copy
Working with spreadsheets requires caution– You think you did something but you can’t audit what
you have done
33

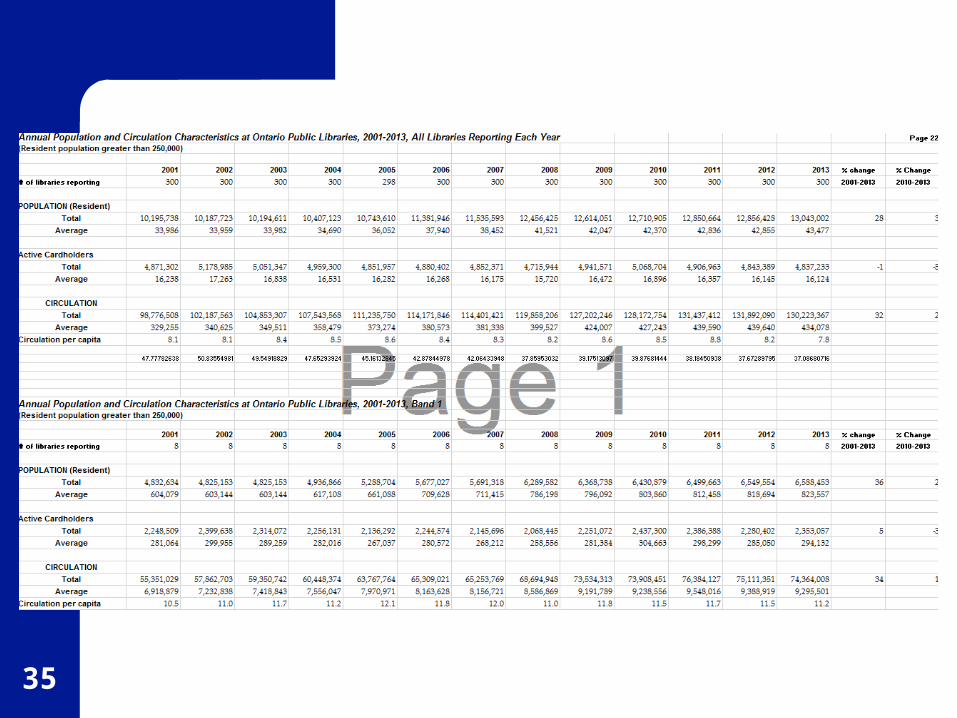
Annual Population and Circulation, 2001-2013
Trend analysis is a bit different Of all libraries which reported in any year,
301 reported in each year These tables are complex
– We will see them again, so let’s take a look
34
35

36

Traditional library measures are steady
OTOH: New things are growing
37

38

39

40

41

42

43

44

Rank Order Tables
Circulation per capita and per active cardholder, 2013, by Bands
45

46

47

48

Rank Order Tables
Expenditures per capita and per active cardholders
49

50

51

52

53

54

55

56

Conclusions
This is the beginning. A first shot based on best guesses of where to look.
There are other ways of studying libraries such as qualitative surveys of a library’s users and their non-users. – Given the rapidly changing information
environment in libraries, quicker surveys likely will be a part of the future of data gathering to support decision making.
57

Next Step
Develop a NEW FOPL Index of Community Engagement for testing and discussion.
Can we combine in various ratios the hard copy and digital transactions and attendance of our library members to compare libraries on a more fulsome basis than ‘circulation’?
58

Future Webinars in this series
August 17th Noon-1 pm Overview of FOPL's Market Probe Canada Public Opinion
Poll of Ontarians and Public Libraries Speaker: Carol French, Senior Vice President, Research &
Client Services, Market Probe Canada
August 28th Noon-1 pm Strategic Use and Insights from FOPL's Ontario Public
Library Statistics, Polls, and Measurements Speakers: Robert Molyneux, MSLS, PhD Stephen Abram, MLS, executive director FOPL
60