Embed Size (px)
Citation preview

NEAR-RANDOM WALK AND MARKET ANOMALIES IN
FINANCIAL ASSET PRICE SERIES
THEORETICAL CONSIDERATIONS AND APPLICATION TO
THE CAC-240 STOCK INDEX SERIES
S. BOLGOT, J.-P. LACHARME and J.-B. LESOURD
October, 1996
G.R.E.Q.A.M.
Centre de la Vieille Charit�e
2, rue de la Charit�e
F-13002 MARSEILLE FRANCE
Tel.: 04.91.14.07.48 Fax: 04.91.90.02.27
Abstract
In this paper, we develop AR-GARCH models with day-of-the-week dummies applied todaily returns.
An econometric application to the CAC 240 Paris Stock Exchange Index daily returns be-tween 1968 and 1993 (i.e. 6580 data points) is carried out, using AR(2)-GARCH(1,1) modelswith day-of-the-week dummies. We also calculate a �nite Fourier transform for that daily re-turns series. Finally, we apply the Weibull test to apparent cycle derived from the returns data.All this leads to some evidence of signi�cant day-of-the-week and weekend e�ects, in additionto strongly damped harmonic behaviour arising from the AR dependence.
JEL Classi�cation Number: C22, C41, E32, G12, G14
1 INTRODUCTION
The concept of market e�ciency, as applied to �nancial asset markets, is encountered in the earlywork of Bachelier (1900)[3] on speculation. It has been de�ned more precisely in the works of Fama(1970[18], 1991[19]) in terms of informational e�ciency, which implies that market prices take intoaccount all available information, including previous prices (weak e�ciency), all publicly availableinformation (semi-strong e�ciency), and all available information, whether public or private (stronge�ciency).
This, under some pertinent conditions, implies that the series of returns per unit of time (forinstance, daily returns) follows a random walk.
There exists a comprehensive litterature on market anomalies, which are departures from thee�ciency hypothesis, including, in particular, day-of-the week or weekend e�ects, turn of the monthe�ects, January or July e�ects, and other seasonal holiday e�ects (French, 1980[20]; Gibbons andHess, 1991[21]; Ja�e and Wester�eld, 1985[27]; Hamon, 1986 [22]; Thaler, 1987a[36], 1987b[37];Hamon and Jacquillat, 1991 [23]; Hawawini and Keim, 1993 [24]; Fama, 1991[19];Agrawal andTandon, 1994[1]).
1

Other authors, such as Osler (1995a[32], 1995b[33]), have examined departures from e�ciencyand random-walk behaviour in terms of "near-random walk". In some of these models, speculationcauses damping of time shocks, (whether fundamental or not), as noticed in the case of foreignexchange markets by Baillie and Bollerslev (1989[4], 1991[5]), among others.
Another empirical feature of �nancial asset market prices is that their stochastic componentstrongly departs from normality and homoskedasticity. Because of this apparent heteroskedasticity,models of the ARCH or GARCH family, which account for heteroskedasticity (Engle, 1982a [16],Bollerslev, 1986[7]), have been extensively applied to various cases, such as foreign exchange rates(Baillie and Bollerslev, 1989[4], 1991[5]; Diebold and Nerlove, 1989[15]; Hsieh, 1989a[26] and stockprices or indexes (such as Hsieh, 1989b[25], and our previous work, e.g. Bolgot, Lacharme andLesourd, 1994[6]); for a general review, see also Bollerslev, Chou and Kroner, 1992 [9]).
In this paper, we intend to model the short-term dynamics of �nancial asset markets. Our model,which share many aspects of the models derived by C.Osler (1995a[32] and 1995b[33]), includes bothlong-term rational investors who behave according to long-term fundamentals, and speculation withvarious time horizons; the model concludes that the behaviour of these two categories of operatorsalone, together with stochastic supply or demand shocks that represent a white noise, would leadto either exponential smoothing, or damped oscillatory behaviour with no possibility, in general,for market anomalies such as weekend e�ects. The latter may be encountered if one introduces intothe model some particular trading practices such as o�setting one's position (whether "long" or"short") at the end of the trading week, and re-opening one's position early in the trading week.Introducing such practices through dummies leads to the possibility of market anomalies, whichare smoothed by the e�ect of speculation.
Finally, we also take into account GARCH behaviour of the residuals in our models, whichare applied to the daily returns of the French stock exchange (CAC{240) index between Septem-ber, 1968 and December, 1993 (after December, 1993, the calculation of the CAC{240 index wasdiscontinued), under several speci�cations of the GARCH dependence of the variance, models aredeveloped, and conclusions are drawn with respect to the most pertinent model.
We also give an original characterization of apparent short-term cycles observed on the CAC{240daily returns on the basis of the Weibull test.
2 THEORY
Our model is an AR model with dummies for day-of-the-week or weekend e�ects, and a GARCH be-haviour of variance. It is similar to the model applied to foreign-exchange rates by Hsieh(1989a[26]),and provides a novel interpretation of the latter model. It is also in line with several of the featuresof the more recent models derived by C.Osler (1995a[32], 1995b[33]).
Assume that prices have increased between some past times t��� > 0 with �� 2 A � f1; 2; ::; Tg,so that pt � pt��� > 0 and t; t being present time, and, consequentely, in logarithm form ln pt �ln pt��� > 0
From the knowledge of these prices increases, either bearish anticipations (whereby these priceincreases are assumed to reverse in the future) or bullish anticipation (whereby these price increasesare assumed to continue in the future) may occur. We further assume that bearish behaviourprompts operators to either selling o� at a pro�t pt � pt��� > 0 previous long positions, or tospeculative short sales, so that bearish anticipations shift the supply curve upwards by a log-linearterm X
��2A
c��(ln pt � ln pt���)
2

with c�� > 0. Let us now assume that prices have decreased with respect to some past prices p��� 0�with � 0� 2 A0 � f1; 2; ::Tg (where A[A0 = f1; 2; ::Tg) such that pt�pt�� 0� � 0, or ln pt�ln pt�� 0� � 0.
In this case, there might be bearish behaviour which assumes that these price decreases willcontinue in the future, leading to short sales or to arbitrage sales, so that these bearish anticipationsagain shift the supply curve by a positive log-linear term which is
�X
� 0�2A0
d� 0� (ln pt � ln pt�� 0�)
Consider, now, the case of bullish anticipations, on the basis of this price set pt�� 0� (� 0� 2 A0)such that pt � pt�� 0� � 0 or ln pt � ln pt�� 0� � 0 ; these bullish operations assume that these pricedecreases will reverse in the future, giving rise to speculative demand that will shift the demandcurve upwards by a log-linear term
�X
� 0�2A0
c� 0� (ln pt � ln pt�� 0�)
We also may have bullish operators who interprete the set of prices pt��� such that pt�pt��� > 0 orln pt � ln pt�� 0� > 0 as announcing further increases, giving rise to speculative demand and shiftingupwards the demand curve by
X��2A
d�� (ln pt � ln pt���)
The logarithm speci�cation enables one to interprete the various coe�cients as elasticities. Wealso take into account fundamental demand and supply, described by linear equations a1t � b1 ln ptand a2t+b2 ln pt, respectively, with a1t and a2t describing through unspeci�ed exogenous variables,their time variation.
Trading practices, leading to day-of-the-week, or weekend e�ects, may be taken into accountthrough suitable day-of-the-week dummies dit (where dit = 1 if, and only if, the day of the weekcorresponding to observation t is day i; i = 1 : : :5, monday through friday), so that additionaldemand and supply derived from these practices may be written , respectivelyX
�1idit for demand
and: X�2idit for supply
Finally, we take into account some stochastic residual demand "1t , and some stochastic residualsupply "2t, with E("1t) = E("2t) = 0, so that we express demand and supply by the followingequations:
Dt = a1t � b1 ln pt �X
� 0�2A0
c� 0� ln (pt=pt�� 0�) +X��2A
d�� ln (pt=pt���) +X
�1idit + "1t (1)
St = a2t + b2 ln pt +X��2A
c�� ln (pt=pt���)�X
� 0�2A0
d� 0� ln (pt=pt�� 0�) +X
�2idit + "2t (2)
3

Let us solve this system so that the market is cleared (Dt = St), we �nally obtain:
"(b1 + b2) +
TX�=1
(c� � d�)
#ln pt �
TX�=1
(c� � d�) ln pt�� = a1t � a2t +5X
i=1
�idit + "t (3)
where �i = �1i � �2i (i = 1 : : :5), and "t = "1t � "2t .Let us assume that �0 = a1t � a1t�1
� (a2t � a2t�1) is a constant; this is equivalent to assuming
that the fundamental price, de�ned as ln p?t =a1t�a2tb1+b2
follows a linear trend. Di�erencing (4) , wethus obtain:
"(b1 + b2) +
TX�=1
(c� � d�)
#st +
TX�=1
(c� � d� ) st�� = �0 +5X
i=1
�idit + �t (4)
where �i = �i � �ip (ip being the day-of-the-week preceding i), and �t = "t � "t�1.However, the day-of-the-week dummies are such that
P5i=1 dit = 1 for any t, so that there is
a linear relationship that may lead to a colinearity problem if (4) leads to an econometric model.This problem may be removed by eliminating one of the dummies, corresponding to some day-of-the-week j (for instance, j = 1 or 2 if either monday our tuesday is singled out , so that theweekend e�ect will appear) and eliminating djt = 1�
Pi6=j dit, which leads to:
"(b1 + b2) +
TX�=1
(c� � d�)
#st +
TX�=1
(c� � d� ) st�� = �0j +Xi6=j
�ijdit + �t (5)
where �ij = �i � �j, and �0j = �0 � �j .The solution of (5) is the sum of the general solution of the corresponding homogeneous equation,
and some particular solution of the complete equation.Let r1 : : : r� : : : rT be the T complex roots of the characteristic polynomial of the homogeneous
equation, the general solution of which is, if p� is the order of multiplicity of root r� :
TX�=1
p�Xq=1
�� tqrt� (6)
where the �� are constants, determined through the initial conditions. A particular solution of(5) may be shown to be:
st =1Xv=0
TX�=1
p�Xq=1
��vqrv�
24�t�v +X
i6=j
�ijdjt�v
35 (7)
The general solution of (5) is the sum of (6) and (7):
st =1Xv=0
TX�=1
p�Xq=1
��vqrv�
24�t�u +X
i6=j
�ijdit�v + �0j
35 +
TX�=1
p�Xq=1
�� tqrt� (8)
We assume here that the daily returns st are stationary, so that jr� j < 1 for all � . If such is thecase, the second term quickly vanishes. There exists a periodical day-of-the-week e�ect if, and onlyif , the average value of st for day of the week i is nonzero. In general, if there is no trading practicesleading to
P�i1dit and
P�2idit terms, so that �ij = 0, clearly, there is no day-of-the-week mean
e�ect, and:Ei(st) = 0
4

where Ei is the mean of st for day of the week i.Otherwise, �ij 6= 0 for all i implies a day-of-the-week j e�ect. According to our model, two
types of cyclical e�ects may be observed:{ First, some kind of day-of-the-week , or weekend e�ect;{ Second, if there are complex or negative roots of characteristic equation (5), we will observe
(since any of the roots is such that jr� j < 1) damped cyclical e�ects after each stochastic shock�t�v on day t � v , and after each day-of-the-week e�ect �ij .
All those e�ects are market anomalies, since they are predictible, in contradiction with Fama'sde�nition of (even weak) market e�ciency. However, these e�ects may be small and of the sameorder of magnitude as transaction costs, so that it may be di�cult to make signi�cant arbitragepro�ts by taking advantage of them, so that one may talk about "near-random walk".
We have so far made no speci�c hypotheses with respect to the residuals of (5), except thatE(�t) = 0. One may assume that, for instance, these residuals are heteroskedastic and followsan ARCH or GARCH process. With such an assumption, our model is similar to the previousmodel of Hsieh (1989a). We give, however, an explanation of that model in terms of heterogeneousspeculator's anticipations that has not - at least to our knowledge - been provided so far, but isin line with previous works by C.Osler (1995a and b[32][33]). This approach has been attemptedrecently by Chauveau and Topol (1996)[10].
3 APPLICATION
Our application concerns the daily values of the French Stock Market CAC 240 index daily returns,between September, 1968 and December, 1993, inclusive (�gure 1), consisting in 6581 points, ex-cluding weekends.
These are are de�ned by:
st = ln (pt=pt�1) (9)
where pt is the price index at time t.We corrected the series for missing points, which were (still excluding weekends) replaced by
previous values (pt�1).Applying to the ln pt series stationarity tests, we conclude that, with an augmented Dickey-
Fuller statistics (Dickey and Fuller, 1979 [13]) of 0:2723, and a Phillips-Perron statistics (Phillipsand Perron, 1988 [34]) of 0:40964 the series is nonstationary. The same conclusion is true of thept series, which leads to an augmented Dickey-Fuller statistics of 1:0438 and a Phillips-Perronstatistics of 1:4292. Finally, taking the series of daily returns st = ln (pt=pt�1), we veri�ed that it isstationary on the basis of both the augmented Dickey-Fuller and Phillips-Perron statistics, whichare, respectively, �37:013, and �5391:96 , concluding without ambiguity to stationarity. However,the general aspect of the series (�gure 2) shows that, apparently, a constant-variance model suchas an AR model will be unable to describe this series.
This is con�rmed by performing normality and heteroskedasticity tests on the st series. Thestatistics of the st series are given in Table 1 below.
The null hypothesis that the skewness and kurtosis correspond to a normal distribution may berejected. Performing, in addition, the Jarque-Bera normality test also leads to rejection of normal-ity. Applying, now, the Lagrangian Multiplier (LM) heteroskedasticity test (Engle, 1982b[17]) tothe series of daily returns with a lag of 4, we �nally reject the null hypothesis of no ARCH e�ect.
5

Figure 1:
1968 1972 1976 1980 1984 1988 1992 19940
100
200
300
400
500
600
700
Time
Daily CAC−240 Index
We are thus led to adjusting model (5) with �t following a GARCH(1,1) e�ect. The Akaike(1973[2]) and Schwarz (1978[35]) optimal lag tests, and the observation of the autocorrelation func-tions do not lead to any clear-cut conclusion with respect to the optimal AR lag. Furthermore,given the comparatively large number of coe�cients to be estimated, we have chosen the mostparcimonious, or the simplest, AR(T) dependence compatible with the possibility of damped cycli-cal behaviour resulting from the existence of complex roots for the characteristic equation of (5).This model is an AR(2)-GARCH(1,1) model, in which either the monday or the tuesday coe�cientwas omitted, which means that the constant coe�cient of the regression is equivalent to the meanvalue of the omitted daily return. Thus, our AR(2)-GARCH(1,1) model may be speci�ed as:
st =2X
�=1
c�st�� +Xi6=2
�i2 dit + �02 + �t (10)
with �t being such that E(�t) = 0 and conditional variance �2t satisfying the following equation:
�2t = 0 + 1 �2t�1 + � �2t�1 (11)
Estimates of that AR(2)-GARCH(1,1) were performed under di�erent error density hypothesesfor the residuals, including normal density, and Student-t density, as proposed by Bollerslev(1987[8]),and as an exponential GARCH (AR(2)-EGARCH) speci�cation. The introduction of a Student-tdistribution is due to Bollerslev (1987[8]); in that case, the density function of the standardizedresiduals zt = �t=�t may be written as a Student distribution with n degrees of freedom, it is well
6
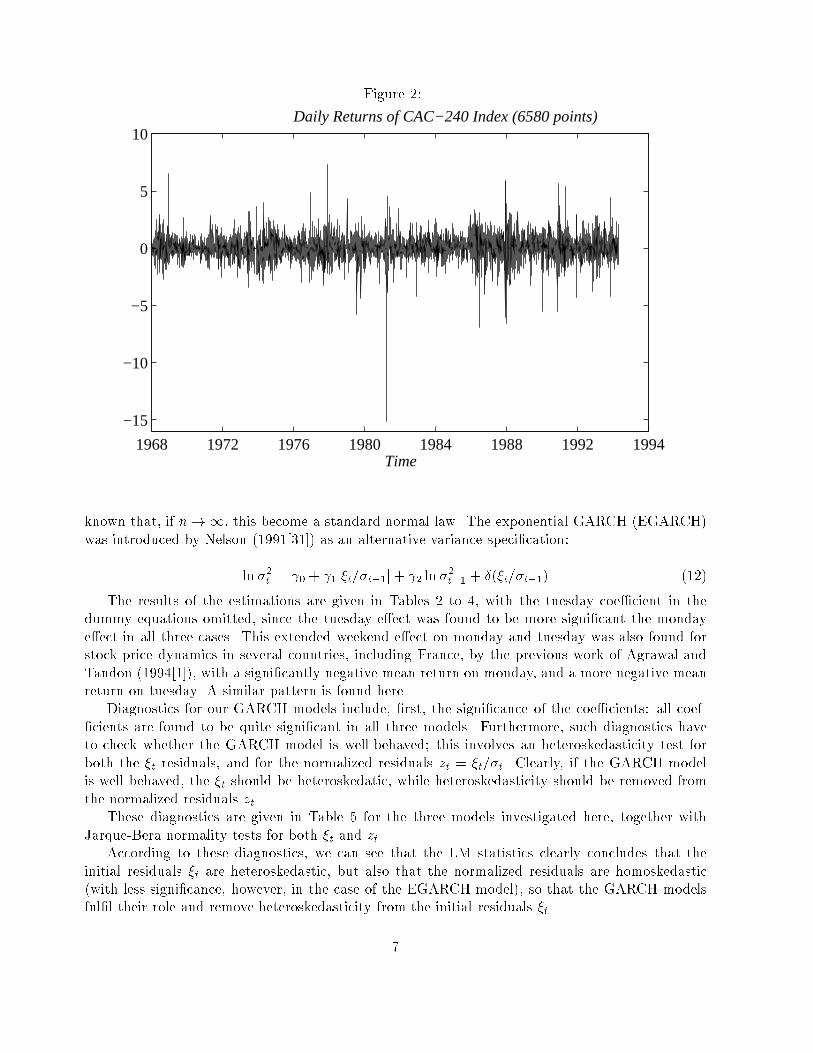
Figure 2:
1968 1972 1976 1980 1984 1988 1992 1994
−15
−10
−5
0
5
10
Time
Daily Returns of CAC−240 Index (6580 points)
known that, if n! 1, this become a standard normal law. The exponential GARCH (EGARCH)was introduced by Nelson (1991[31]) as an alternative variance speci�cation:
ln �2t = 0 + 1j�t=�t�1j+ 2 ln �2t�1 + �(�t=�t�1) (12)
The results of the estimations are given in Tables 2 to 4, with the tuesday coe�cient in thedummy equations omitted, since the tuesday e�ect was found to be more signi�cant the mondaye�ect in all three cases. This extended weekend e�ect on monday and tuesday was also found forstock price dynamics in several countries, including France, by the previous work of Agrawal andTandon (1994[1]), with a signi�cantly negative mean return on monday, and a more negative meanreturn on tuesday. A similar pattern is found here.
Diagnostics for our GARCH models include, �rst, the signi�cance of the coe�cients: all coef-�cients are found to be quite signi�cant in all three models. Furthermore, such diagnostics haveto check whether the GARCH model is well-behaved; this involves an heteroskedasticity test forboth the �t residuals, and for the normalized residuals zt = �t=�t. Clearly, if the GARCH modelis well behaved, the �t should be heteroskedatic, while heteroskedasticity should be removed fromthe normalized residuals zt.
These diagnostics are given in Table 5 for the three models investigated here, together withJarque-Bera normality tests for both �t and zt.
According to these diagnostics, we can see that the LM statistics clearly concludes that theinitial residuals �t are heteroskedastic, but also that the normalized residuals are homoskedastic(with less signi�cance, however, in the case of the EGARCH model), so that the GARCH modelsful�l their role and remove heteroskedasticity from the initial residuals �t.
7

Table 1: Statistics and tests for the st series. Number of observations: 6580
Statistics Value
Mean 0.0334Standard error 0.91506Variance 0.83733S.E. of Sample Mean 0.011281t{statistic 2.96420Signi�cance level for Mean=0 0.00304
Skewness -0.2662Signi�cance level for Sk = 0 0.00000000
Kurtosis 6.26238Signi�cance level for Ku = 3 0.00000000
Jarque-Bera statistics 66129.74Signi�cance level 0.00000000
LM Statistics for ARCH test 239.3Signi�cance level 0.00000000
Table 2: AR(2){GARCH(1,1) model of the CAC 240 daily returns (with normal density).
Variable Coe�cient value standard t-statistics signi�canceerror
{ �02 -0.08154 0.020228 -4.03113 0.00005551st�1 c1 0.260582 0.0127797 20.39065 0.00000000st�2 c2 -0.097731 0.012234 -7.98872 0.00000000d1t �12 0.07003 0.0299 2.34082 0.01924160d3t �32 0.171533 0.0281 6.10857 0.00000000d4t �42 0.188997 0.027897 6.77489 0.00000000d5t �52 0.1627313 0.026669 6.10182 0.00000000{ 0 0.026157 0.001673 15.63162 0.00000000
�2t�1 1 0.106273 0.00438155 24.25293 0.00000000�2t�1 � 0.868129 0.0055266 157.0817 0.00000000
8

Table 3: AR(2){GARCH(1,1) model of the CAC 240 daily returns (with Student density).
Variable Coe�cient value standard t-statistics signi�canceerror
{ �02 -0.074658 0.0180229 -4.14241 0.0003437st�1 c1 0.2430558 0.122184 19.89274 0.00000000st�2 c2 -0.100386 0.0123045 -8.15848 0.00000000d1t �12 0.073440 0.025879 2.83771 0.00454304d3t �32 0.359898 0.024978 6.40168 0.00000000d4t �42 0.154613 0.025022 6.17909 0.00000000d5t �52 0.154193 0.024872 6.19944 0.00000000{ 0 0.0217010 0.0033904 6.40067 0.00000000
�2t�1 1 0.124462 0.011251 11.06258 0.00000000�2t�1 � 0.8601878 0.010707 80.33982 0.00000000{ n 4.5322 0.24449 18.53730 0.00000000
Table 4: AR(2){EGARCH(1,1) model of the CAC 240 daily returns (with normal density).
Variable Coe�cient value standard t-statistics signi�canceerror
{ �02 -0.112390 0.020383 -5.51383 0.00000000st�1 c1 0.26028117 0.0114413 22.74919 0.00000000st�2 c2 -0.0984261 0.0115666 -8.5096 0.00000000d1t �12 0.06506015 0.0298557 2.17908 0.02932584d3t �32 0.2151745 0.0255867 8.40965 0.00000000d4t �42 0.2267836 0.0269616 8.41134 0.00000000d5t �52 0.2112559 0.0255682 8.26245 0.00000000{ 0 0.00200296 0.00106811 1.87523 0.06076072
j�t=�t�1j 1 0.1749963 0.005072947 34.49597 0.00000000ln �2t�1 2 0.9668869 0.0025892 373.4323 0.00000000�t=�t�1 � 0.20351459 0.0255942 7.9515158 0.00000000
9

Table 5: Diagnostics for our AR(2)-GARCH(1,1) models
MODEL LM statistics LM statistics Jarque-Bera Jarque-Bera(�t)
? (zt)? statistics (�t)
? statistics (zt)?
(1) 400.43 0.235719 77028.4 26772.30.00000000 0.99357 0.00000 0.00000
(2) 390.10 0.341325 77355.6 28263.00.00000000 0.9869927 0.00000 0.00000
(3) 400.83 2.91234 77217.3 42232.70.00000000 0.5760069 0.0000000 0.00000
(1) AR(2)-GARCH(1,1) with normal distribution(2) AR(2)-GARCH(1,1) with t-Student distribution(3) AR(2)-EGARCH(1,1)(?) Signi�cance on bottom line
With respect to the probability distribution, the Jarque-Bera tests conclude to rejection ofnormal distribution in all three models, for both �t and zt, so that the AR(2)-GARCH(1,1) modelwith normal distribution can be rejected. The heteroskedasticity LM test appears to conclude with alower signi�cance level to homoskedasticity of the zt in the case of the AR(2)-EGARCH(1,1) model,so that the "best" model seems to be the AR(2)-GARCH(1,1) model with Student-t distribution.
It is interesting to calculate the characteristic frequencies corresponding to the AR(2) depen-dence of st, and to compare then to the frequencies arising from a Fourier transform method appliedto the daily return series st.
Table 6 below gives the results of our calculation, which are very similar for all three models.The characteristic equation all have complex roots, with one characteristic period of a little morethan 5 days and another of a little more than 1.22 days. However, with a modulus of about 0:31 inall three cases, this dampens very quickly and becomes negligible in much less than a trading week,so that the 5-day period cannot enhance the deterministic week e�ect found otherwise throughdummies. Fourier analysis, con�rms the existence of a periodic e�ect with a period of 5 tradingdays, corresponding to a 0.4 normalized frequency which is in line with the e�ect described byday-of-the week dummies in an e�ect (Figure 3).
Other periodical e�ects do not clearly appear from the Fourier spectrum. Our economic modelsand the Fourier transform may be completed by a statistical analysis of the apparent cycles derivedfrom the series of daily returns, using a method derived from the NBER method (Moore, 1980[30])for the determination of apparent cycle durations by Davutyan and Roberts (1994[14]) and Labys,Badillo and Lesourd, 1995[29]).
This method will be described later. It gives some sequence of apparent cycles (a sequence ofnegative returns followed by a sequence of positive returns de�ning such a cycle), whose durationfollows some statistical distribution which may be analyzed in terms of standard duration. Dura-tion series may be analyzed (Mc Cullouch, 1975[12]); Cox and Oakes, 1984[11]; Kiefer, 1988[28];Davutyan and Roberts (1994[14]); Labys, Badillo and Lesourd, 1995[29]) in terms of the Weibullstatistical distribution with the following probability density function
f(t) = t(��1) exp(� t�) (13)
where t is the statistical variable denoting cycle duration, and where � and are parameters
10

Table 6: Characteristic frequences for st
MODEL Complex roots Modulus Frequencies ? Periods ??
(1) 0:13029� 0:28417 i 0.31262 0.1817 5.500.8183 1.22
(2) 0:13014� 0:28545 i 0.31373 0.1819 5.500.8181 1.22
(3) 0:12153� 0:292602 i 0.31684 0.18735 5.340.81265 1.23
(1) AR(2)-GARCH(1,1) with normal distribution(2) AR(2)-GARCH(1,1) with t-Student distribution(3) AR(2)-EGARCH(1,1)(?) in days�1; (??) in days
Table 7: Cycles duration (full apparent cycles), and parameters of the Weibull distribution.
Parameters/Quantities Value S.D. t-statistics Signi�cance
Duration (days) 4.94 0.0052 95.0 < 10�8
0.011 0.0103 1.708 0.087
� 1.893 0.241 7.848 < 10�8
11

Figure 3:
0 0.2 0.4 0.6 0.8 1−4
−3.5
−3
−2.5
−2
−1.5
−1
−0.5
0
Frequencies
Spectral Density of Returns
(� > 0; > 0). When � = 1, the Weibull distribution degenerates into an exponential distributionwith density function:
f(t) = exp(� t) (14)
If t stands for the duration of apparent cycles, as shown by Davutyan and Roberts (1994[14]),one may analyze these cycles through a double nested test. First, one may, through a maximumlikehood method, evaluate the parameters of the Weibull distribution governing the statistics ofapparent cycle durations. If � = 0, this degenerates into an exponential distribution, which, asshown by Kiefer(1988[28]) and Davutyan and Roberts (1994[14]), is a memoryless distributiongoverning a random walk process. Rejecting the null hypothesis of an exponential distributionamounts to rejecting � = 1 through the Wald test; this enables one to reject this random-walkprocess. Then, if the exponential distribution is rejected, meaningful cycles that have a �nite meanduration occur if, and only if, � > 1 (whereas � < 1 refers to a trend). The second part of thistest therefore consists in assessing the signi�cance of � > 1, through a Student-t statistics appliedto �� 1.
In our case, we de�ne a full apparent cycle, following Davutyan and Roberts (1994[14]) asa sequence of negative returns (contraction half-cycle) beginning at a peak (local maximum) andending at a trough (local minimum), and followed by a sequence of positive returns (begining at thetrough ending the previous half-cycle, and ending at a peak). We can thus divide unambiguouslyour series of returns into apparent cycles and calculate the durations of all these cycles. This was
12

performed through some suitable software deviced by one of us (J.B Lesourd).Having done this , one can see that the mean duration of our cycles is 4.94 days; with a
standard deviation of 0.052 days, this does not di�er signi�cantly from 5 days, which is in linewith previous �ndings on day-of-the-week e�ects. Furthermore, the restriction that the Weibulldistribution degenerates into an exponential distribution may be rejected, with a test statisticsof 13.706 (which, following a �2 distribution with one degree of freedom, yields a signi�cance of0.000214). The second part of the test leads to a t-statistics of 3.705, which also leads to acceptingthe hypothesis that � > 1 with some good signi�cance.
We can therefore conclude that there exists some sort of irregular cycles with an average durationof 5 days in our daily return data, which, again is in line with our econometric model with day-of-the-week dummies.
4 CONCLUSION
Our models with day-of-the-week dummies and GARCH e�ect provides a theoretical background forsome previous models such as the model of Hsieh (1989a[26]) which have been applied to �nancialdata; it is also in line with the theoretical models developed by C.Osler (1995a[32], 1995b[33]) .
Our application to the French CAC 240 stock index series consists in several AR(2)-GARCH(1,1)models with day-of-the-week dummies for the series of the daily returns. These models appear todescribe the data satisfactorily, and reveals the existence of a signi�cant day-of-the-week e�ect, and,in particular, of a signi�cant tuesday e�ect, which con�rms previous works (such as, in particular,the work of Agrawal and Tandon (1994 [1]) which concludes to a signi�cant tuesday e�ect for theFrench stock market).
An analysis of the apparent cycles, and of the statistical distribution of the series of apparentcycle duration, which , at least to our knowledge, has not been carried out previously in daily stockprice returns data, is also given here; it hints at a Weibull law for the description of these cyclesrather than at an exponential one.
In the future, it might be interesting to investigate further the theoretical implication of ourmodel, and the theoretical and practical implications of our results.
Our approach in terms of statistical properties of the apparent cycles also seems promising fromboth the theoretical and practical standpoints.
5 ACKNOWLEDGEMENTS
The authors wish to thank Christopher Adcock, Pierre Batteau, Michel Terraza, two anonymousreferees of this Journal, and other colleagues participating in seminars or conferences in Geneva,London and Luxembourg, for useful and valuable comments on previous versions of this work.
References
[1] A.Agrawal and K. Tandon. Anomalies or illusions ? Evidence from stock markets in eighteencountries. Journal of International Money and Finance, 13:83{106, 1994.
[2] H. Akaike. Information theory and the extension of the maximum likehood principle. In B.N.Petrov and F. Csaki, editors, 2nd International Symposium on Information Theory, 1973.
13

[3] L. Bachelier. Th�eorie de la sp�eculation. Annales de l'Ecole Normale Sup�erieure, S�erie 3,17:21{88, 1900.
[4] R.J. Baillie and T. Bollerslev. The message in daily exchange rates: A conditional variancetale. Journal of Business and Economic Statistics, 7, 1989.
[5] R.J. Baillie and T. Bollerslev. Intraday and intermarket volatility in foreign exchange rates.Review of Economic Studies, 58:565{585, 1991.
[6] S. Bolgot, J.-P. Lacharme, and J.-B. Lesourd. Chaos and stock price series application to theCAC 240 index. Document de travail GREQAM No 94B09, Marseille, 1994.
[7] T. Bollerslev. Generalized autoregressive conditional heteroskedasticity. Journal of Economet-rics, 31:307{327, 1986.
[8] T. Bollerslev. A conditionally heteroskedastic time series model for speculative prices andrates of returns. Review of Economics and Statistics, 9:542{547, 1987.
[9] T. Bollerslev, R.Y. Chou, and K.F. Kroner. ARCH modeling in �nance. A review of theoryand empirical evidence. Journal of Econometrics, 52:5{59, 1992.
[10] T. Chauveau and R. Topol. Non-observable noises as a possible cause of conditional het-eroskedasticity. The case of intraday exchange rates. Working Paper 96-01, OFCE, Paris,1996.
[11] D.R. Cox and D. Oakes. Analysis of Survival data. Chapman and Hall, London, 1984.
[12] J.H. Mc Cullouch. The Monte Carlo cycle in business activity. Economic Inquiry, 13:303{321,1975.
[13] D.A.Dickey and W.A. Fuller. Distribution of the estimators for autoregressive time series witha unit root. Journal of America Statistical Association, 74:427{431, 1979.
[14] N. Davutyan and M.C. Roberts. Cyclicality in metal prices. Resources Policy, 20(1):49{57,1994.
[15] F.X. Diebold and M. Nerlove. The dynamics of exchange volatility: A multivariate latentfactor ARCH model. Journal of Applied Economics, 4:1{21, 1989.
[16] R.F. Engle. Autoregressive conditional heteroskedasticity with estimates of the variance ofU.K. in ation. Econometrica, 50:987{1008, 1982.
[17] R.F. Engle. A General Approach to Lagrange Multiplier Model Diagnostics. Journal ofEconometrics, 20:83{104, 1982.
[18] E. Fama. E�cient capital markets: A review of theory and empirical work. Journal of Finance,25:383{417, 1970.
[19] E. Fama. E�cient capital markets, II. Journal of Finance, XLVI:1575{1617, 5 1991.
[20] K.R. French. Stock returns , and the week-end e�ect. Journal of Financial Economics, March1980.
14

[21] M.R. Gibbons and P. Hess. Day of the week e�ects and asset returns. Journal of Business,54:579{596, October 1991.
[22] J. Hamon. The seasonal character of monthly returns in the Paris bourse. Finance, 7:57{74,1986.
[23] J. Hamon and B. Jacquillat. Weekly and daily return seasonalities on the Paris stock exchange.Finance, 12:103{126, 1991.
[24] G. Hawawini and D.B. Keim. On the predictability of common stock returns: World-wideevidence. In Handbook of Finance, Amsterdam, North-Holland, 1993. R.A. Jarrow, W.T.Ziemba and V. Maksimovich.
[25] D.A. Hsieh. Modeling heteroskedasticity in daily foreign exchange rates. Journal of Businessand Economics Statistics, 7:307{317, 1989.
[26] D.A. Hsieh. Testing for nonlinear dependence in daily foreign exchange rates. Journal ofBusiness, G 2:339{368, 1989.
[27] J. Ja�e and R. Wester�eld. The weekend e�ect in common stock returns. Journal of Finance,40:433{454, June 1985.
[28] N.M. Kiefer. Economic duration data and hazard functions. Journal of Economic Literature,26:649{679, 1988.
[29] W. Labys, D. Badillo, and J.-B. Lesourd. Cyclical behaviour of individual commodity priceseries. Working Paper, No95B03, GREQAM, Marseille, France, 1995.
[30] G.H. Moore. Business cycles, in ation and forecasting. NBER, Cambridge, USA, 1980.
[31] D.B. Nelson. Conditional heteroskedasticity in asset returns: A new approach. Econometrica,59:347{370, 1991.
[32] C. Osler. Exchange rate dynamics and speculations, horizons. Forthcoming. Journal of Inter-national Money and Finance, 1995.
[33] C. Osler. Short term speculators and the origins of near-random walk exchange rate behavior.Working Paper, Federal Reserve, Bank of New-York, March 1995.
[34] P.C.B. Phillips and P. Perron. Testing for a Unit Root in Time Series Regression. Biometrica,65:335{346, 1988.
[35] G. Schwarz. Estimating the dimension of a model. Annals of Statistics, 6:461{464, 1978.
[36] R.H. Thaler. Anomalies: the January E�ect. Journal of Economy Perspectives, 1(1):197{201,Summer 1987.
[37] R.H. Thaler. Anomalies: Weekend, Holiday, Turn of the month, and intraday e�ects. Journalof Economy Perspectives, 1(1):169{177, Fall 1987.
15