Embed Size (px)
Citation preview

IMPACT OF TRNA NEWS SENTIMENT ON PRICE
MOVEMENT
Tongli Zhang
Kimi Yang
IMPACT OF TRNA NEWS SENTIMENT ON PRICE
MOVEMENT
Tongli Zhang Kimi Yang
IMPACT OF TRNA NEWS SENTIMENT ON PRICE
MOVEMENT
Tongli Zhang Kimi Yang
IMPACT OF TRNA NEWS SENTIMENT ON PRICE
MOVEMENT
Tongli Zhang Kimi Yang

INDEX1. Data Structure and Preliminary Research
2. Introduction of Our Research Method about Relationship of News Sentiment and Daily Return
3. Analysis and Optimization of this Relationship
4. Trading Strategy Based on this Relationship
5. Analysis in Long Period of Time and on Intraday Basis
6. Rational behind the Empirical Relationship

DATA STRUCTURE AND PRELIMINARY RESEARCH
DATA STRUCTURE AND PRELIMINARY RESEARCH

DATA STRUCTURETRNA News Sentiment Database
Time of Record: Accuracy to ms
Relevance: From 0 to 1
Sentiment Score:
Positive, Neutral Negative, from 0 to 1
Time Period: Jan 2003- Nov 2011
Asset: Natural Gas, Coffee, Cotton etc.
Story type, Item general, etc.
94 background labels
Price Data
Daily Price Intraday Price
Origin Bloomberg Origin Pi-Trading
Time of Price
Date Time of Price
Minute by Minute
Asset Availableon Terminal
Asset Commodities,Stocks, FXs, ETFs
Time Period
Availableon Terminal
Time Period
VariousApril 2007 –August 2014 (Natural Gas)
Relation

IMPACT OF NEWS SENTIMENT ON PRICE
1. Aggregated Daily News Sentiment
Relevance weighted aggregated
2. Extreme News Sentiment on Daily Basis
The criteria for extreme news is the certain quantile of news sentiment score
For example (Extreme Positive News are news items with positive scoreshigher than 80% of the total news)

NATURAL GAS:NEXT DAY RETURN TO DAILY POSITIVE SENTIMENT VALUE
Correlation:0.0091Insignificant
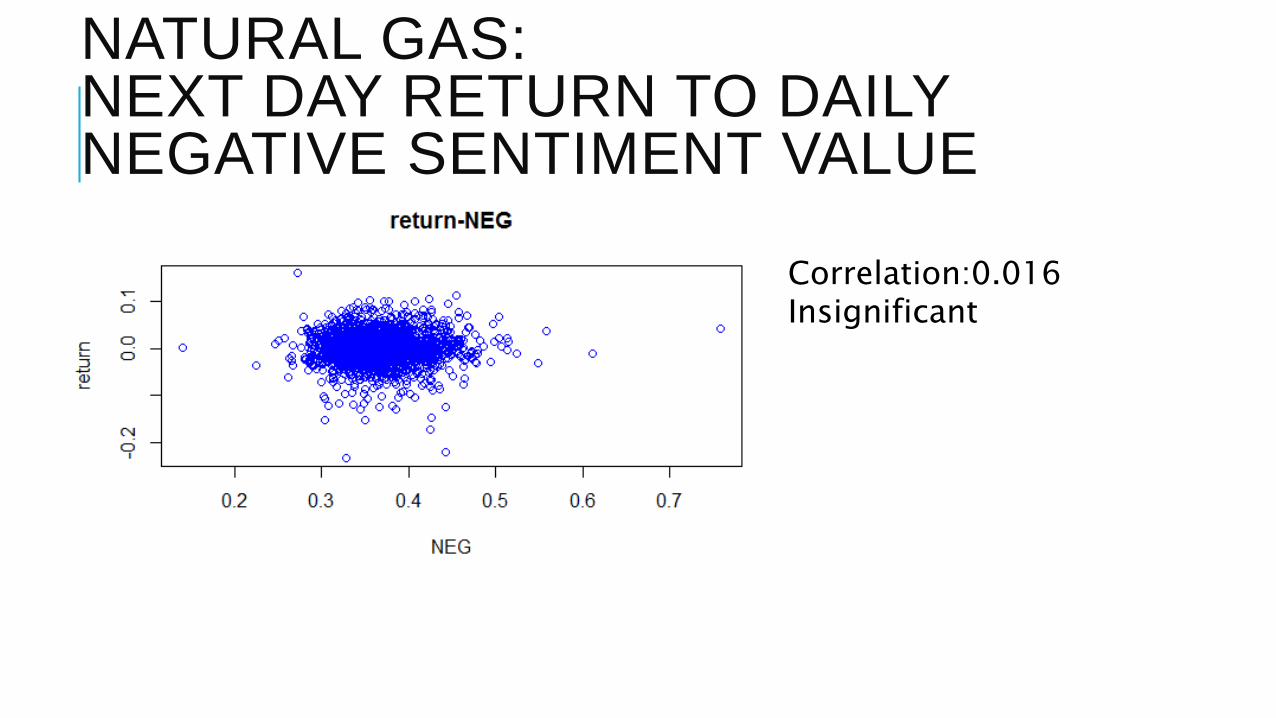
NATURAL GAS:NEXT DAY RETURN TO DAILY NEGATIVE SENTIMENT VALUE
Correlation:0.016Insignificant

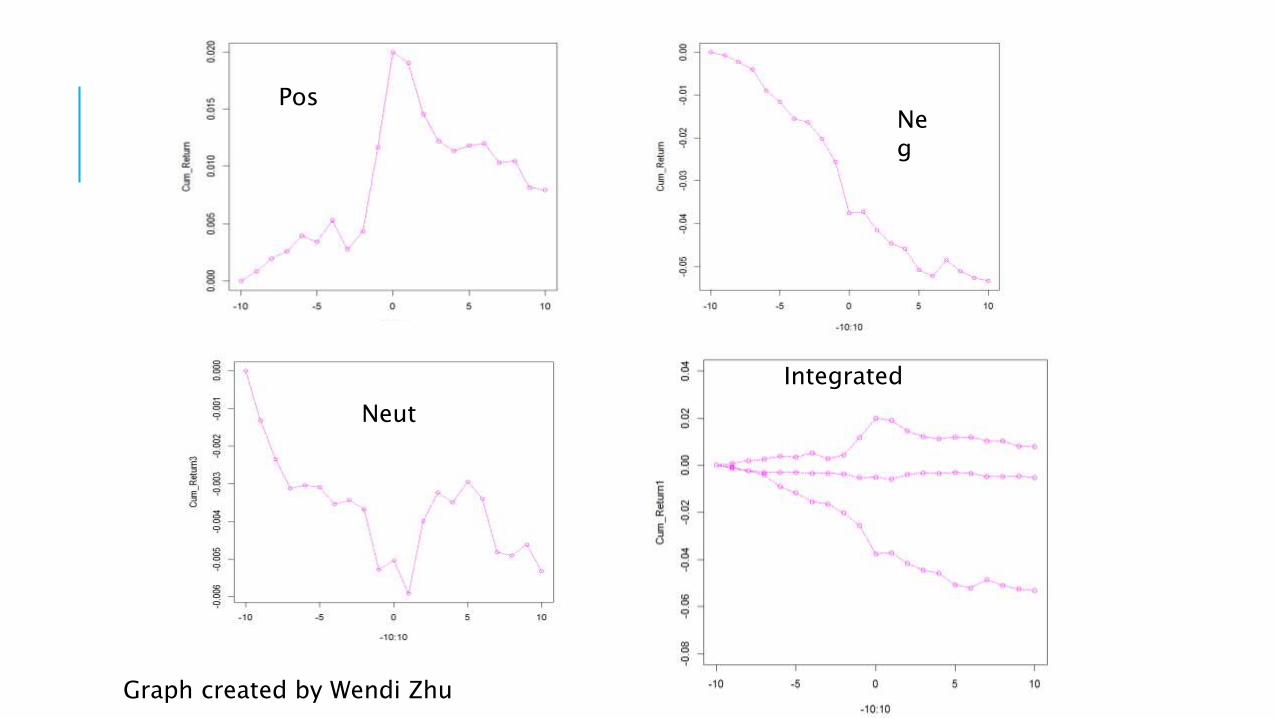
IMPACT OF SINGLE EXTREME NEWS
PosNeg
Neut
Integrated
Graph created by Wendi Zhu

ACCUMULATIVE IMPACT OF NEWS SENTIMENT &
RELATIONSHIP WITH PRICE
ACCUMULATIVE IMPACT OF NEWS SENTIMENT
& RELATIONSHIP WITH PRICE
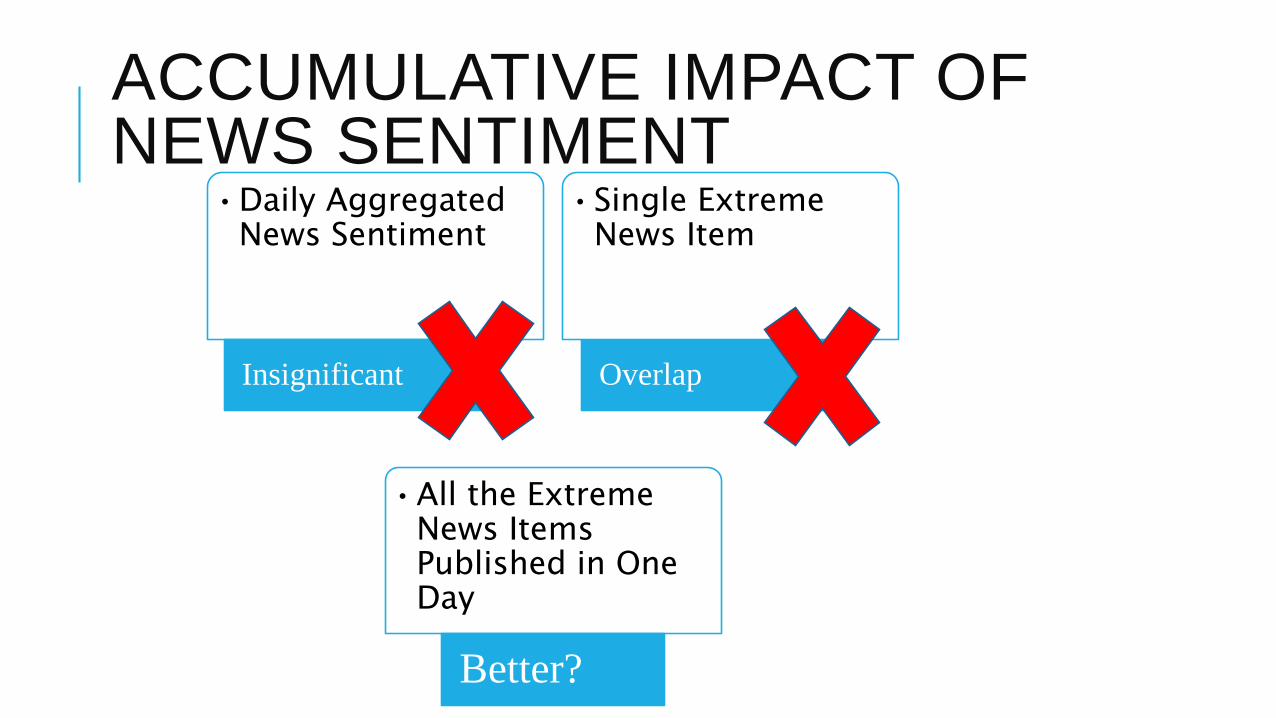
ACCUMULATIVE IMPACT OF NEWS SENTIMENT
Overlap
•Daily Aggregated News Sentiment
Insignificant
•Single Extreme News Item
•All the Extreme News Items Published in One Day
Better?

ACCUMULATIVE IMPACT OF NEWS SENTIMENT
Number of Extreme News (Positive or Negative) and its relationship with price
1. Daily Basis: Daily Return Vs Daily Number of Extreme News
2. Use Year 2009 daily price data and sentiment data as training data set
3. Criteria for extreme news, sentiment score larger than 80% of news items
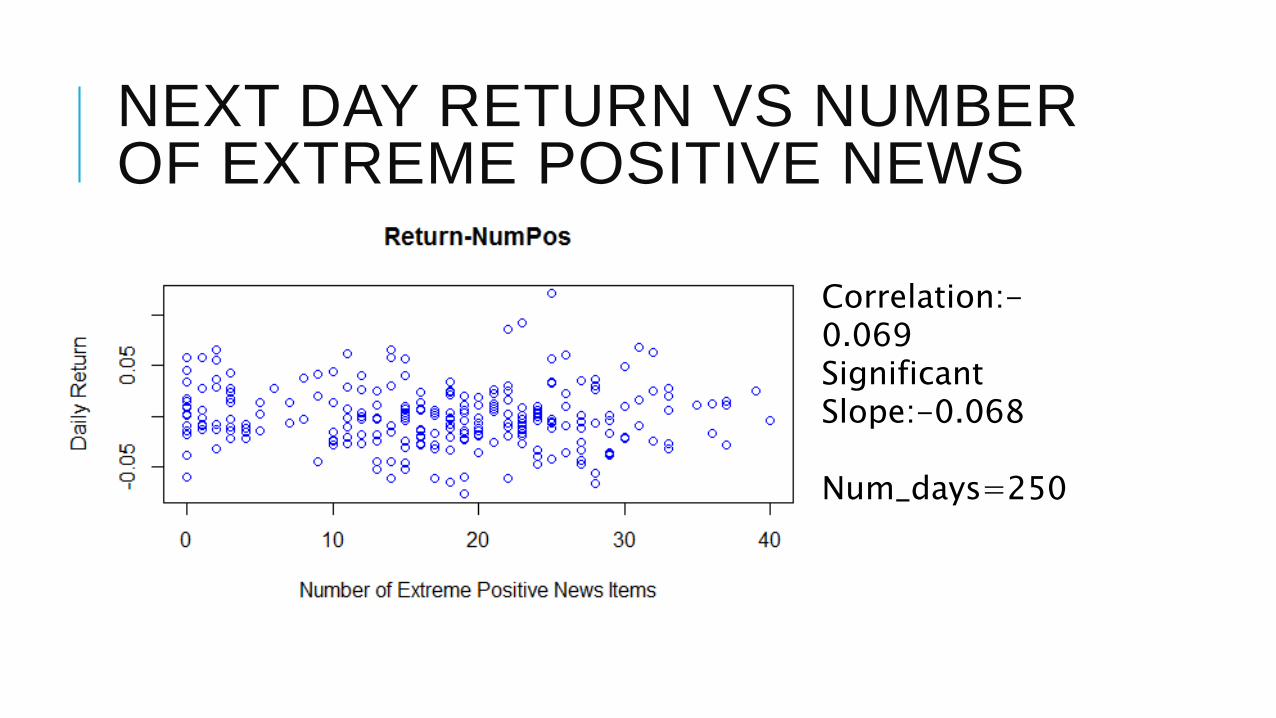
NEXT DAY RETURN VS NUMBER OF EXTREME POSITIVE NEWS
Correlation:-0.069SignificantSlope:-0.068
Num_days=250

NEXT DAY RETURN VS NUMBER OF EXTREME NEGATIVE NEWS
Correlation:-0.113SignificantSlope:-0.111
Num_days=250

OPTIMIZATION OF THE RELATIONSHIP
OPTIMIZATION OF THE RELATIONSHIP

OPTIMIZATION OF THE COEFFICIENT
1. Exclude abnormal points (Number>99%-tile)
2. Optimize criteria of extreme news(0.5~0.99)
3. Choose the prediction lag(0~5days)

EXCLUDE ABNORMAL POINTS

OPTIMIZE THRESHOLD FOR INCLUSION: POSITIVE
Best quantile:0.96Correlation: -0.20
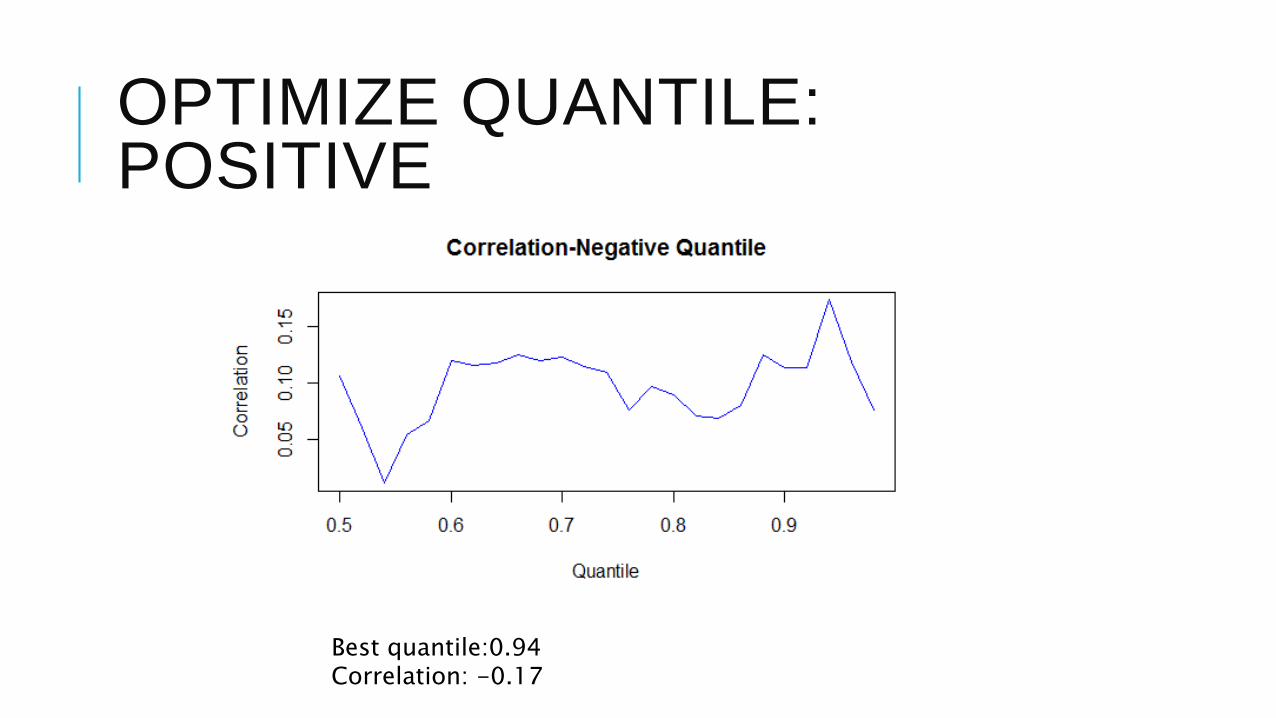
OPTIMIZE QUANTILE: POSITIVE
Best quantile:0.94Correlation: -0.17

CHOOSE LAG

CHOOSE LAG
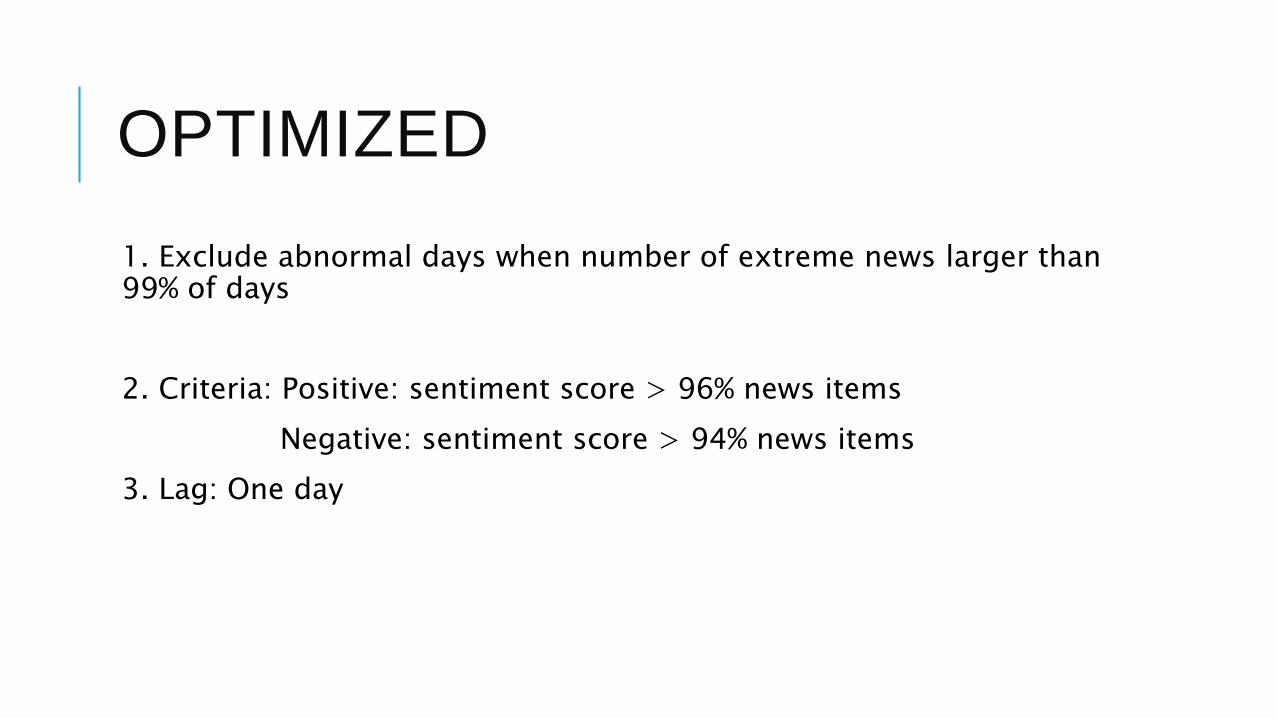
OPTIMIZED
1. Exclude abnormal days when number of extreme news larger than 99% of days
2. Criteria: Positive: sentiment score > 96% news items
Negative: sentiment score > 94% news items
3. Lag: One day
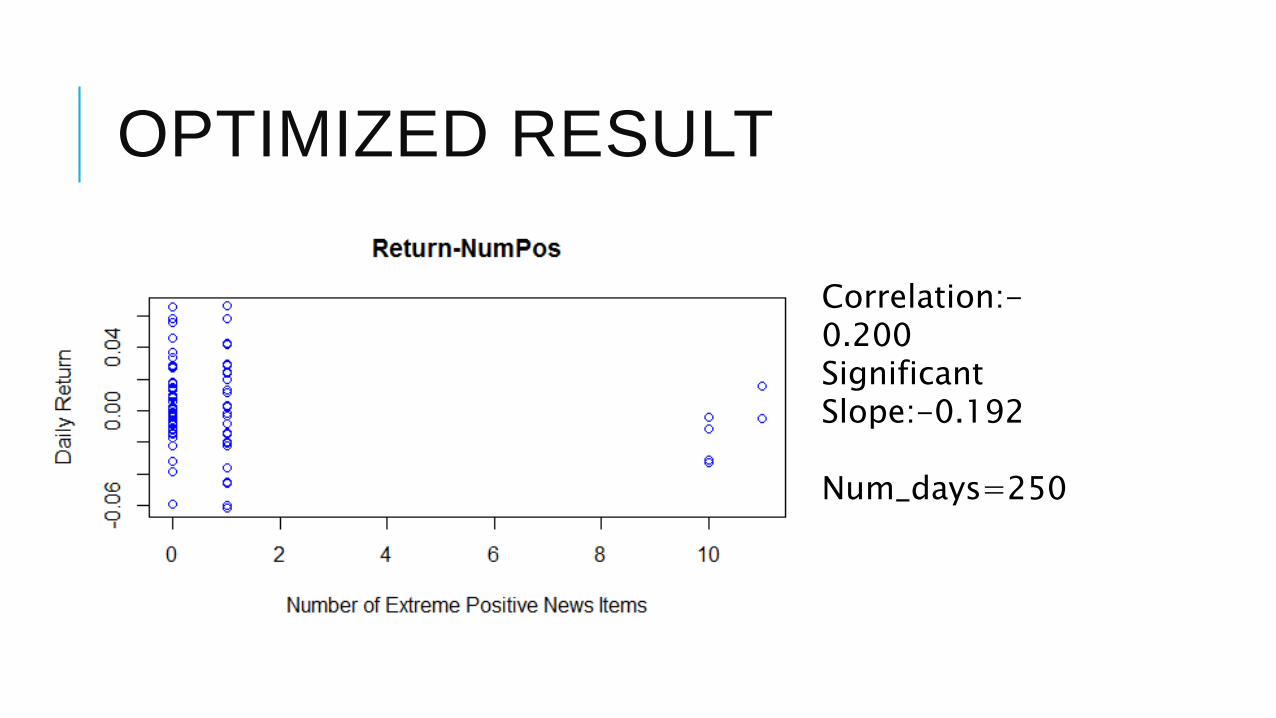
OPTIMIZED RESULT
Correlation:-0.200SignificantSlope:-0.192
Num_days=250

OPTIMIZED RESULT
Correlation:-0.173SignificantSlope:-0.167
Num_days=250

TRADING STRATEGY
TRADING STRATEGY

TRADING STRATEGY
Trigger of the Trade: Num_pos>11or Num_neg>9 or Num_pos+Num_neg>17
Type of Trading: short NG1 or United States Natural Gas ETF next day, positions settled daily
2003-01-022003-01-01 2003-01-042003-01-03
Next Return
Number of Extreme News Items

CUMULATIVE RETURN-UNG (2007/04 -2011/11)
0
50
100
150
200
250
300
10/10/2006 2/22/2008 7/6/2009 11/18/2010 4/1/2012 8/14/2013
Retu
rnCumulative Return of Three Strategies
Trading Strategy Buy&Hold Constantly Short
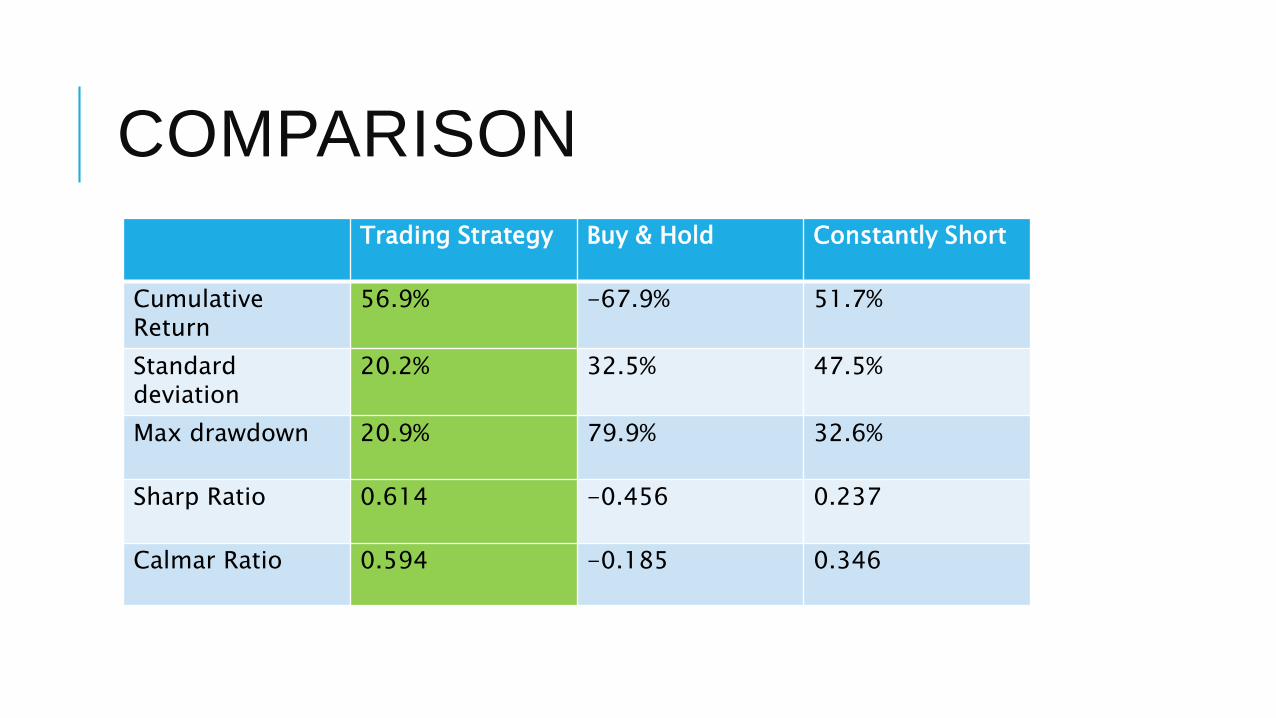
COMPARISON
Trading Strategy Buy & Hold Constantly Short
Cumulative Return
56.9% -67.9% 51.7%
Standarddeviation
20.2% 32.5% 47.5%
Max drawdown 20.9% 79.9% 32.6%
Sharp Ratio 0.614 -0.456 0.237
Calmar Ratio 0.594 -0.185 0.346

COST OF TRADING
Number of Trades: 235
-1
-0.8
-0.6
-0.4
-0.2
0
0.2
0.4
0.6
0.8
0.00% 0.20% 0.40% 0.60% 0.80% 1.00% 1.20%
Sharp
Rati
o
Transaction Cost Per Trade
Sharp Ratio-Transaction Cost

CUMULATIVE RETURN-NG1 (2003/01 -2011/11)
0
50
100
150
200
250
300
350
4/19/2001 9/1/2002 1/14/2004 5/28/2005 10/10/2006 2/22/2008 7/6/2009 11/18/2010 4/1/2012 8/14/2013
Retu
rn
Cumulative Return of Three Strategies
Trading Strategy Buy&Hold Constantly Short

COMPARISON
Trading Strategy Buy & Hold Constantly Short
Cumulative Return
92.6% -32.2% -94.1%
Standarddeviation
27.2% 45.3% 20.8%
Max drawdown 27.1% 63.7% 94.6%
Sharp Ratio 0.382 -0.080 -0.507
Calmar Ratio 0.383 -0.057 -0.112
Number of Trades: 370

INTRADAY DATA & RELATIONSHIP IN LONG
PERIOD OF TIME
INTRADAY DATA & RELATIONSHIP IN LONG
PERIOD OF TIME

RETURN VS NUMBER
Time point: 10:30, 11:30, 12:30, 13:30, 14:30, 15:30
Intraday Basis: Return of half hour after the time points Vs Number of Extreme News one hour before time point
10:309:30 12:3011:30
Number of Extreme News
Return
11:0010:00 12:00

RETURN VS NUMBER OF POSITIVE NEWS ITEMS
Insignificant
Num_items=1500

RETURN VS NUMBER OF NEGATIVE NEWS ITEMS
Insignificant
Num_items=1500
PosNeg
Neut
Integrated
Graph created by Wendi Zhu

INTRADAY PRICE MOVEMENT AROUND EXTREME NEWS ITEMS
A small number of extreme news happened in an hour, relatively low overlap
Price Movement
Extreme News Items
-30:00 30:00

NATURAL GAS90 QUANTILE POSITIVE
99.85
99.9
99.95
100
100.05
100.1
-40 -30 -20 -10 0 10 20 30 40
Retu
rn
Minutes After News Published
Return-Minute Number of Trades
127
Stand Deviation 0.47%
Max Return 1.07%
Min Return -1.56%
Positive Ratio 34.65%
Negative Ratio 57.48%
Zero Ratio 7.87%
P-value 6.84e-4
Return<0 Significant (99.9%)

NATURAL GAS90 QUANTILE NEGATIVE
99.95
99.97
99.99
100.01
100.03
100.05
100.07
100.09
-40 -30 -20 -10 0 10 20 30 40
Retu
rn
Minutes After News Published
Return-Minutes Number of Trades
165
Stand Deviation 0.74%
Max Return 4.97%
Min Return -2.22%
Positive Ratio 49.09%
Negative Ratio 44.24%
Zero Ratio 6.67%
P-value 1.37e-1
Return>0 86.3%significance

LONG PERIOD OF TIME
Regression between Monthly Return and Monthly Aggregated news sentiment
2003-02-012003-01-02 2003-04-012003-03-01
Aggregated News Sentiment
Next ReturnPre-Return Same-Return

LONG PERIOD OF TIME
Regression between Monthly Return and Monthly Aggregated news sentiment
Time of Return Correlation Significance
Positive Negative Positive Negative
Same Month 0.199 -0.263 Significant Significant
Previous Month 0.087 -0.113 Significant Significant
Next Month 0.034 -0.050 Insignificant
Insignificant

CONCLUSION & RATIONALE OF EMPIRICAL RESULTS
CONCLUSION & RATIONALE OF EMPIRICAL RESULTS

CONCLUSION
1. Aggregate news sentiment has general normal impact on return on a long time basis
2. A large portion of the news items may be about the past price movement, expectation, possible leak of information
Time of Return Correlation 95% Significance
Positive Negative Positive Negative
Same Month 0.199 -0.263 Significant Significant
Previous Month 0.087 -0.113 Significant Significant
Next Month 0.034 -0.050 Insignificant
Insignificant
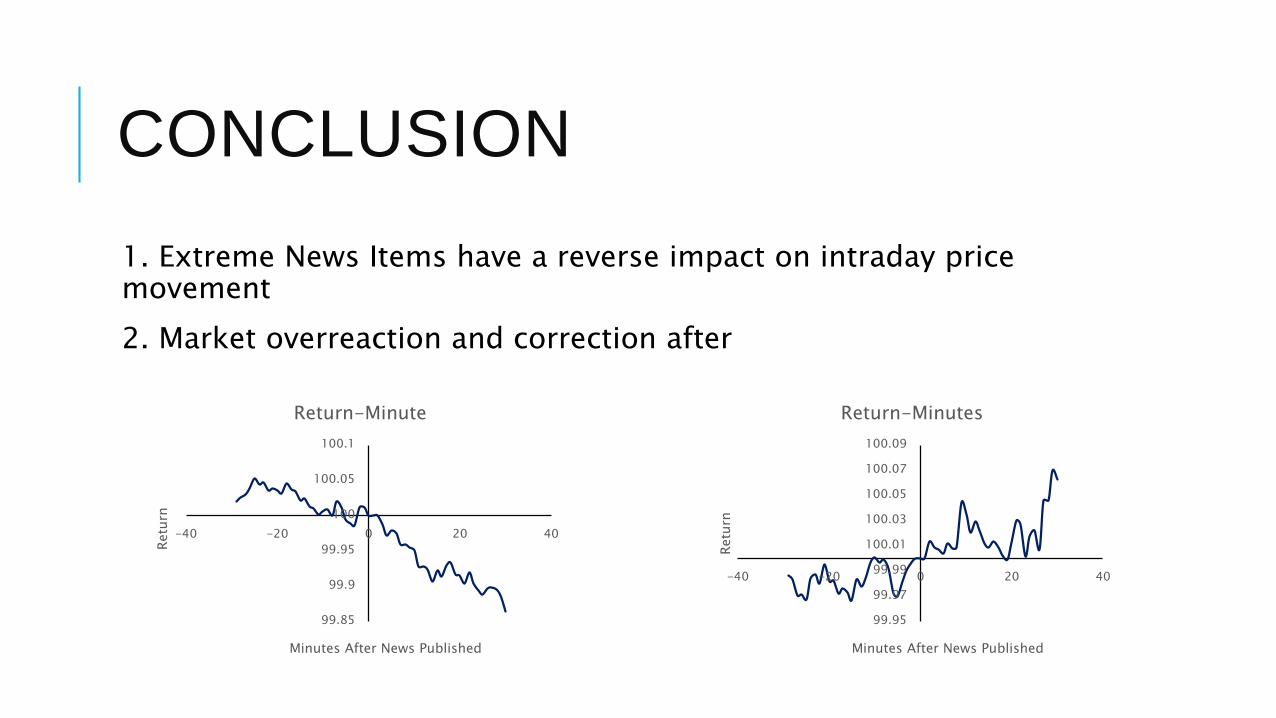
CONCLUSION
1. Extreme News Items have a reverse impact on intraday price movement
2. Market overreaction and correction after
99.85
99.9
99.95
100
100.05
100.1
-40 -20 0 20 40
Retu
rn
Minutes After News Published
Return-Minute
99.95
99.97
99.99
100.01
100.03
100.05
100.07
100.09
-40 -20 0 20 40
Retu
rn
Minutes After News Published
Return-Minutes

CONCLUSION
1. Aggregated news sentiment does not affect daily return
2. Market overreaction and correction settled before next day
3. Number of extreme news items negatively impact next day return
4. Reflect the increase of uncertainty, increase of discount rate, thus lower price
Trading Strategy Buy & Hold Constantly Short
Cumulative Return
92.6% -32.2% -94.1%
Standarddeviation
27.2% 45.3% 20.8%
Max drawdown 27.1% 63.7% 94.6%
Sharp Ratio 0.382 -0.080 -0.507
Calmar Ratio 0.383 -0.057 -0.112

Thank You Q&A
TongliZhang/KimiYang,MasterofFinance,CareyBusinessSchool


![bAcids Nucleosides, Nucleotides and Nucleic - UMEXPERT · Role of Initiator tRNA i met in Fidelity of Initiation of Protein Synthesis 727 (aa-tRNA) ternary complex.[1] The tRNA binding](https://img.dokumen.tips/doc/110x75/5c25d16309d3f28d198c11f7/bacids-nucleosides-nucleotides-and-nucleic-umexpert-role-of-initiator-trna.jpg)