Embed Size (px)
Citation preview

Vazi Okhandiar, MCT, PMP, MSCS, BSEE
www.nrclc.com. (714) 505-3475
Build a Dashboard in an Hour
Using Microsoft Excel & PowerPivot
Executive Dashboard for Small Business

Vazi Okhandiar, MCT, PMP, MSCS
Consultant & Trainer
25+ years - Software development
15+ years – Teaching
Worked for General Motors, Toyota, EDS/HP, Computer Science Corp
as Application Developer, Database designer, project manager, Web AnalyticsSpecialize in Application Migration
Education:
Microsoft Certified Training
PMP, Project Management Institute
Masters in Computer Science, IIT, Chicago
MBA, University of California, Irvine(UCI)
BS Electrical Engineering, UCI

Agenda
Introduction to dashboard
Importing Raw Data
Using PowerPivot
Demo
Q & A

A dashboard
In Information technology, a dashboard is a visualization tool that is similar to a panel for a driver of a vehicle that has data organized and presented in such a way that is easy to read and understand.

Benefit of Digital Dashboards• Visual presentation of performance measures
• Ability to identify efficiencies/inefficiencies
• Ability to identify and correct negative trends
• Ability to identify new trends.
• Ability to make more informed decision
• Align strategies and organizational goals
• Increase overall revenue

Executive Dashboard
• An Executive Dashboard is a visual representation that gives executives a quick and easy way to view their company’s performance in real-time.
• The Executive Dashboard pulls the information from various data sources into one place for data analysis.

PowerPivot is a FREE add-on tool for Microsoft Excel that enables a user to:
• Import millions of row of data sources into a single Excel workbook
• Create relationships between heterogeneous data
• Create calculated columns and measures using formulas
• Supports Visualize Tool – PivotTable, PivotChart, Slicers
PowerPivot

PowerPivot Minimum Requirement
• Excel 2010 Professional (32 bit or 64 bit) or higher
• Windows 7 (32-bit) or higher

A Pivot table is a powerful feature in Excel that allows users to quickly
summarize and analyze large amounts of data in the form of a table.
PivotTable
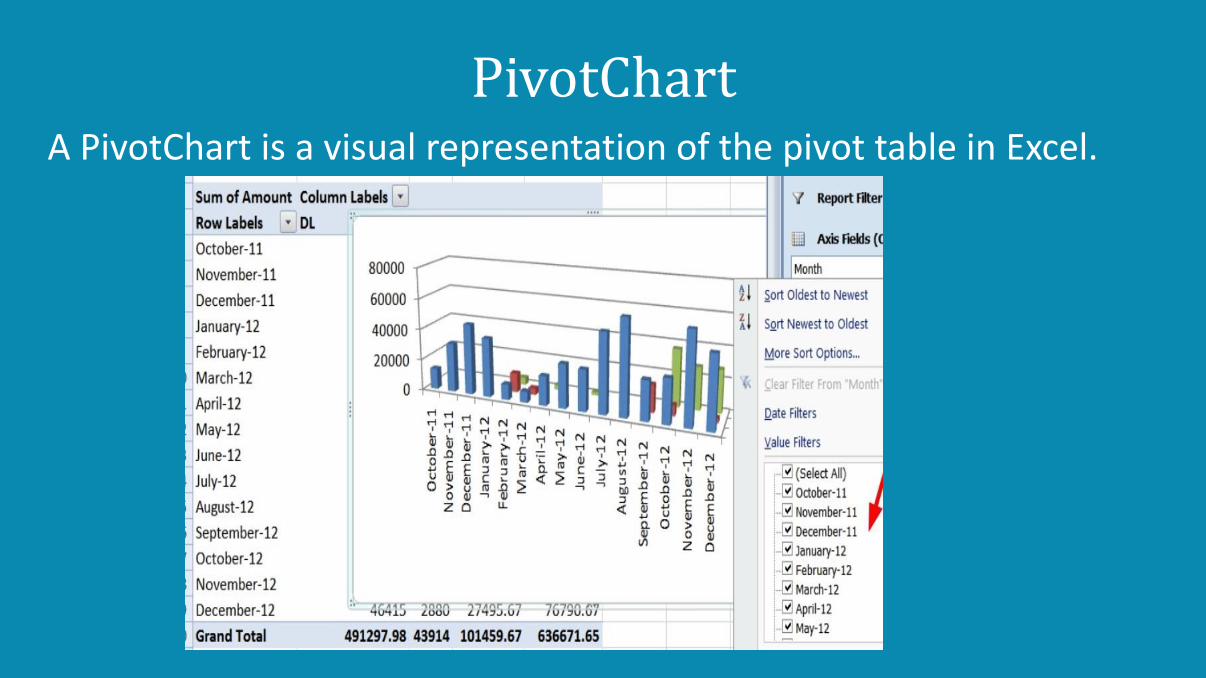
A PivotChart is a visual representation of the pivot table in Excel.
PivotChart

Slicer
A Slicer is an interactive control used for filtering data in a pivot table.

Launching PowerPivot
Launch PowerPivot tab on the Excel ribbon
Activate PowerPivot (File > Option > COM Add-in> Microsoft Office PowerPivot for Excel)

Steps for Using PowerPivot• Start Excel
• Launch PowerPivot
• Load Data
• Prepare Data
• Build dashboard with PivotChart, PivotTable and Slicer
DatabaseFile
PowerPivot
PivotTable PivotChart
Dashboard

Sample Data Superstore - Order Table (2009 – 2012)
• Order ID
• Order Date
• Order Priority
• Order Quantity
• Sale
• Discount
• Shipping Method
• Profit
• Unit Price
• Shipping cost
• Customer Name
• State
• Region
• Business Size
• Product Category
• Product Sub Category
• Product Name
• Product Container
• Product Base Margin
• Ship Date

Question?What was the revenue in 2009, 2010, 2011, 2012?
What was the breakdown of Revenue by state for year 2012?
What are the top 5 products sold in 2012?
Who were the top 5 customers in 2012 ?
How well the company did during the month of November 2011 compared to same time in 2010?


Summary
Topic covered:
• Importing data
• Developing Dashboard with PowerPivot• Adding PivotTable/PivotChart
• Using Slicer to link PivotTable and PivotChart

Vazi Okhandiarwww.nrclc.com
714-505-3475
Facebook.com/nrclc
Twitter.com/nrclc
https://orangecounty.score.org/