Embed Size (px)
Citation preview

Escaping Flatland: interactive high-dimensional data analysis in drug discovery using Spark
Josh Snyder, Victor Hong, Laurent GalafassiNovartis Institutes for BioMedical Research (NIBR)

Overview
• Use case– High-dimensional screening data
• Goals– Production data pipelines for scientists– Reusable analysis platform for informaticians
• High level architecture– Spark and other components
• Outcome– Achievements & impact– Future work

Screening is scale-out for bench science1
2
3
4
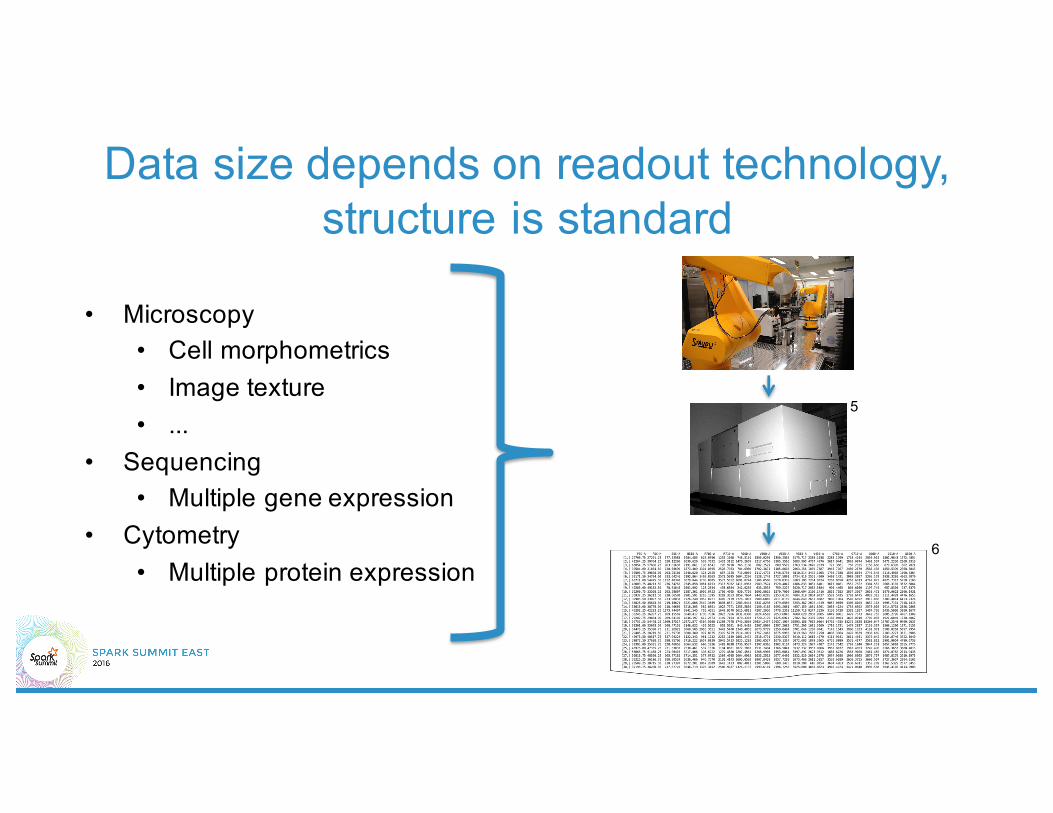
Data size depends on readout technology, structure is standard
• Microscopy• Cell morphometrics• Image texture• ...
• Sequencing• Multiple gene expression
• Cytometry• Multiple protein expression
5
6

Datasets can be large1000 plates 1536 wells/plate 1k to 5k cells/well
50 to 2000 features/cell
1 to 10 billion observations10 to 2000 features10b to 20 trillion data points10 GB to 20 TB+ time points (x10 = 200TB)+ ??
1 screen

Many features can be used to quantify activity
ActiveControl
NeutralControl
Nucleus/Cytoplasm IntensityCell Texture Variance (3 pixel)…n = 1000’s
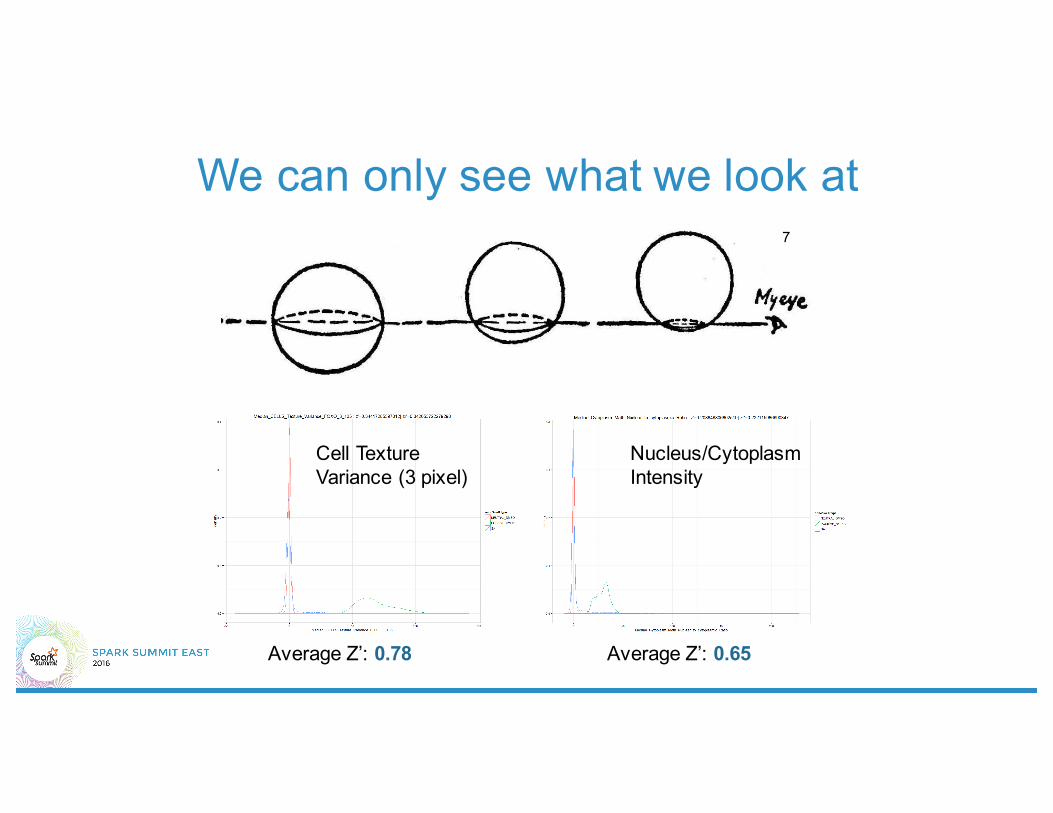
We can only see what we look at
Cell TextureVariance (3 pixel)
Nucleus/CytoplasmIntensity
Average Z’: 0.65Average Z’: 0.78
7

So we need to look at everything
Input
• All observations, all features
QC
• Mask problem observations
• Mask problem features
• Calculate aggregate measures for review• Per feature• Per observation
group
Normalization
• Pattern correction and scoring for each feature
• Eliminate uninformative features
Classification
• Use full feature vectors to find cases showing desired activity/phenotype
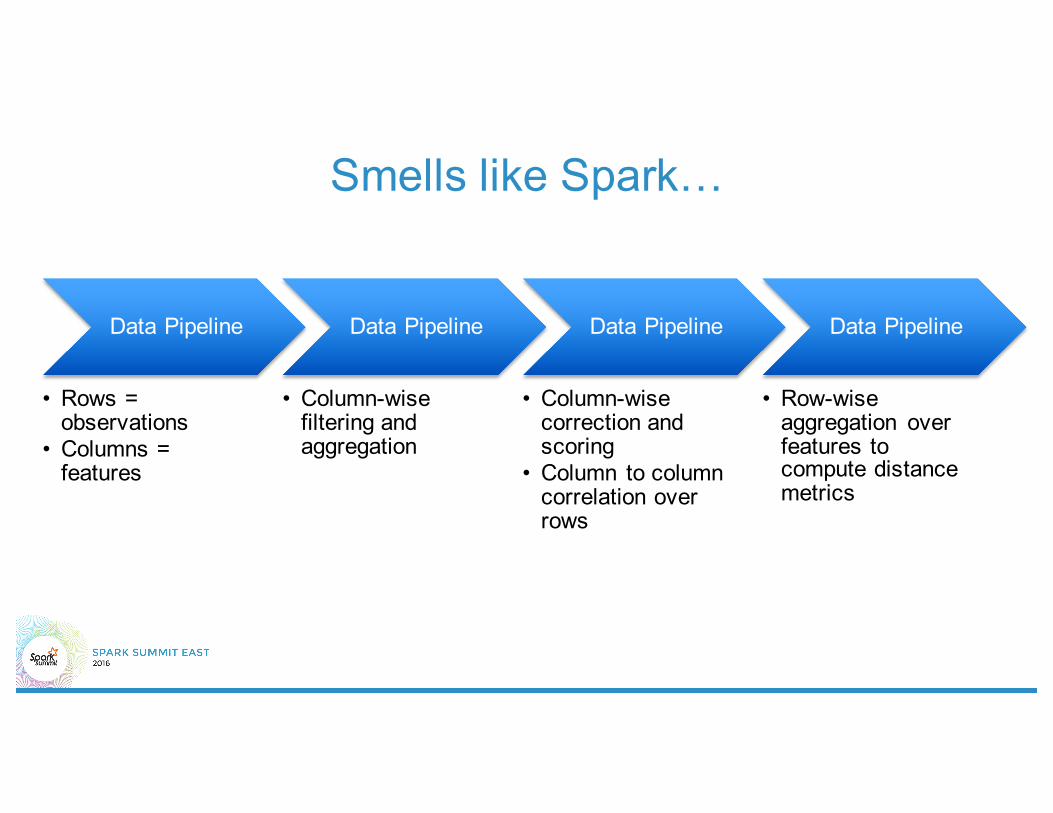
Smells like Spark…
Data Pipeline
• Rows = observations
• Columns = features
Data Pipeline
• Column-wise filtering and aggregation
Data Pipeline
• Column-wise correction and scoring
• Column to column correlation over rows
Data Pipeline
• Row-wise aggregation over features to compute distance metrics

Spark is not a tool for bench scientists
Data Pipeline Data Pipeline Data Pipeline Data Pipeline
Visualization & Control
Visualization & Control
Visualization & Control
Visualization & Control
Algorithms
Workflow

High-dimensional data-driven architecture
• Pipelines for large data àSpark
– Distribute computation– Minimize IO for intermediate
results– Declarative API– Support for popular data analysis
languages– Ecosystem: MLlib, Spark Job
Server, etc.
• Visualization & control àWebGL
– Web UI flexibility– Render millions of data points
• Query à Cassandra– Spark Connector– Distributed, fast, mature, key-value
/ column family store
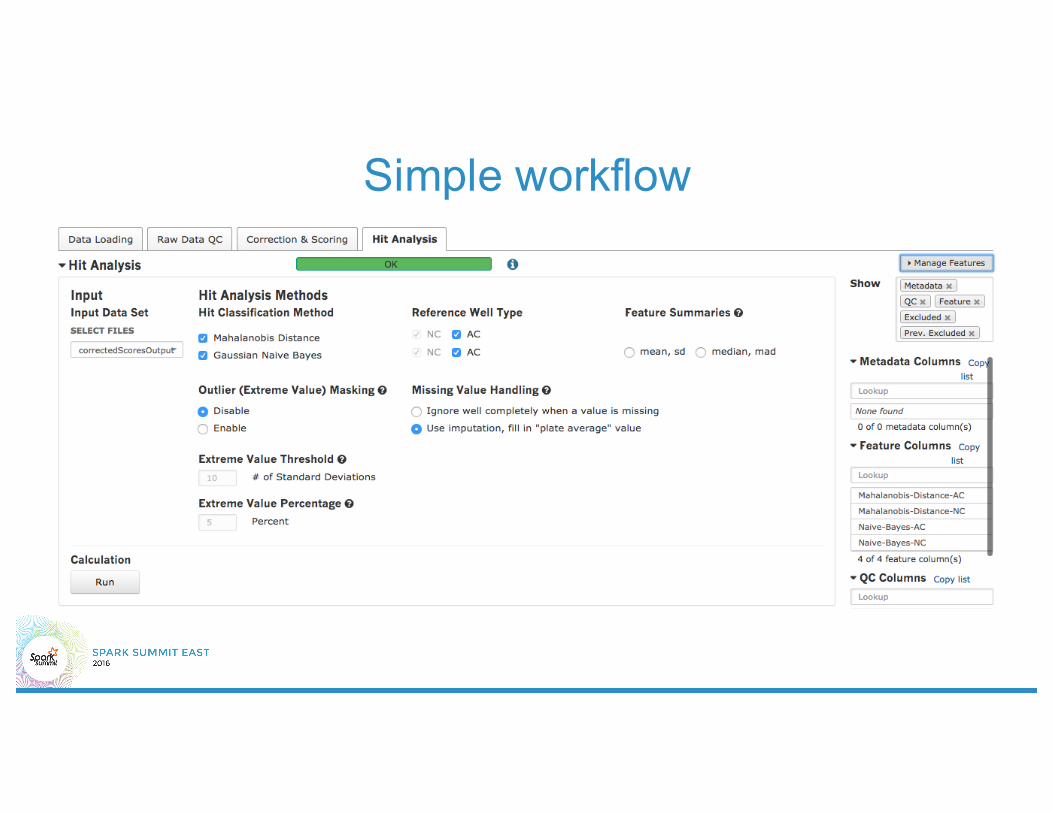
Simple workflow
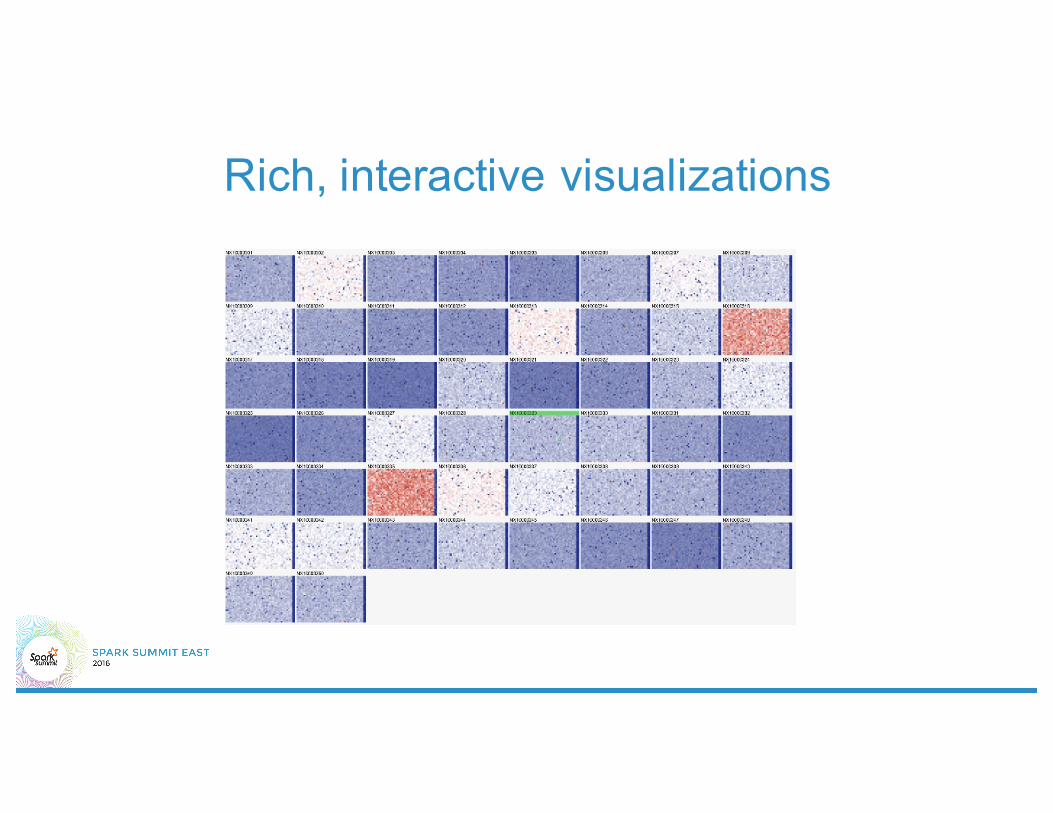
Rich, interactive visualizations
Methods implementations
• Classification– Mahalanobis Distance– Gaussian Naïve Bayes
• Coarse-grained utilities– findNearLinearCombos– findCorrelation
• Fine-grained utilities– Streaming models for incrementally integrating data (pairwise
correlation, Greenwald-Khanna quantile estimations, et al.)– Robust statistical measures (MAD, IQR, et al.)– Data masking, missing values handlers (casewise, pairwise, imputation)
The big picture
• Achievements– Multi-day batch jobs à multi-hour jobs– Unified data format & workflow across readout technologies– End user application for bench scientists
• Future work– Elastic infrastructure– Supervised learning of cell phenotypes– Methods APIs for informaticians– Contributions back to open source

The really big picture
Discovery of therapeutics for patients in need
Informatics applications
Distributed complex analytics
Spark

AcknowledgmentsNabil HachemFred Harbinski
Ioannis MoutsatsosHanspeter GublerSergey KokorinLeonid VolobuevMarat Gazimullin
Evgeniya CondrashinaAlexey GirinDavid Wilson
and the entire NIBR project team, stakeholders, & sponsors

Attributions1. "1905 Otto Folin in biochemistry lab at McLean Hospital byAHFolsom Harvard" by A H Folsom -
http://preserve.harvard.edu/photographs/McLean.html. Licensed under Public Domain via Commons -https://commons.wikimedia.org/wiki/File:1905_Otto_Folin_in_biochemistry_lab_at_McLean_Hospital_byAHFolsom_Harvard.png#/media/File:1905_Otto_Folin_in_biochemistry_lab_at_McLean_Hospital_byAHFolsom_Harvard.png
2. "Petri dish at the Pacific Northwest National Laboratory" by Pacific Northwest National Laboratory, US Department of Energy -http://picturethis.pnl.gov/picturet.nsf/by+id/DRAE-8DBTWP. Licensed under Public Domain via Commons -https://commons.wikimedia.org/wiki/File:Petri_dish_at_the_Pacific_Northwest_National_Laboratory.jpg#/media/File:Petri_dish_at_the_Pacific_Northwest_National_Laboratory.jpg
3. "Chemical Genomics Robot" by Maggie Bartlett, National Human Genome Research Institute -http://www.genome.gov/dmd/img.cfm?node=Photos/Technology/Research%20laboratory&id=79299. Licensed under Public Domain via Commons - https://commons.wikimedia.org/wiki/File:Chemical_Genomics_Robot.jpg#/media/File:Chemical_Genomics_Robot.jpg
4. "385 multiwell plate 1" by real name: Nadina Wiórkiewiczpl.wiki: Nadine90commons: Nadine90 - Own work(dzięki współpracy ze szkołąfotograficzną - Fotoedukacja /in cooperation with the school of photography - Fotoedukacja). Licensed under CC BY-SA 3.0 via Wikimedia Commons - https://commons.wikimedia.org/wiki/File:385_multiwell_plate_1.jpg#/media/File:385_multiwell_plate_1.jpg
5. "Automated confocal image reader" by Neil Emans IPK - self-made. Original image cropped in this usage. Licensed under CC BY-SA 3.0 via Wikipedia - https://en.wikipedia.org/wiki/File:Automated_confocal_image_reader.jpg#/media/File:Automated_confocal_image_reader.jpg
6. By Kierano - Own work. Original image cropped and resized in this usage. CC BY-SA 3.0, https://commons.wikimedia.org/w/index.php?curid=25180061
7. "Flatland sphere". Licensed under Public Domain via Wikimedia Commons -https://commons.wikimedia.org/wiki/File:Flatland_sphere.JPEG#/media/File:Flatland_sphere.JPEG
THANK [email protected] Presentation and project [email protected]@novartis.com
[email protected] NIBR Data Engineering


![[the annotated] flatLAND](https://img.dokumen.tips/doc/110x75/568bd8311a28ab2034a2788f/the-annotated-flatland.jpg)


