Embed Size (px)
Citation preview

Sébastien POSTIC, Sandrine SELOSSE, Nadia MAÏZI
MINES ParisTech, PSL Research University Centre de Mathématiques Appliquées MINES ParisTech
Energy sector contribution to climateaction
-The case of Latin America
October 22nd, 2015 ETSAP Workshop, Sophia-Antipolis

ETSAP Workshop – Sophia-Antipolis, France2/16
O c t o b e r 2 2 n d , 2 0 1 5 – S é b a s t i e n P O S T I C , S a n d r i n e S E L O S S E , N a d i a M a ï z i
Latin America: small yet growing emissions
450 Millionshab.
GDP 2012: 5,000 G$
6%
8%
9% gobal GHG emissions
+57% in 40 years
CC cost : 1.5% to 5%
of GDP
(Sources : CIA World Factbook, GIEC, CEPAL)

ETSAP Workshop – Sophia-Antipolis, France3/16
O c t o b e r 2 2 n d , 2 0 1 5 – S é b a s t i e n P O S T I C , S a n d r i n e S E L O S S E , N a d i a M a ï z i
Latin America: small yet growing emissions
450 Millionshab.
GDP 2012: 5,000 G$
6%
8%
9% gobal GHG emissions
+57% in 40 years
CC cost : 1.5% to 5%
of GDP
(Sources : CIA World Factbook, GIEC, CEPAL)

ETSAP Workshop – Sophia-Antipolis, France4/16
O c t o b e r 2 2 n d , 2 0 1 5 – S é b a s t i e n P O S T I C , S a n d r i n e S E L O S S E , N a d i a M a ï z i
Energy sector is transforming fast
Global average: 14%
5% of world’sconsumption
2009 : 30 millions w/o
electricity
2001-2010:+32% TPES
(Sources : AIE, European Commission, CIER, GIEC)
UE: 80%
X 2 in 40 years
Final consumption2012:
460Mtoe
Average hydroshare: 60%
Energy share in regional emisisons:
20%

ETSAP Workshop – Sophia-Antipolis, France5/16
O c t o b e r 2 2 n d , 2 0 1 5 – S é b a s t i e n P O S T I C , S a n d r i n e S E L O S S E , N a d i a M a ï z i
Prospective tool: TIMES-ALyC (1)

ETSAP Workshop – Sophia-Antipolis, France6/16
O c t o b e r 2 2 n d , 2 0 1 5 – S é b a s t i e n P O S T I C , S a n d r i n e S E L O S S E , N a d i a M a ï z i
- Cumulative potentials 2010-2050- Including (right) or not (left) oil/solar/biomass
Porspective tool: TIMES-ALyC (2)
T-ALyC’s primary energy potentials (EJ)
ETSAP Workshop – Sophia-Antipolis, France7/16
O c t o b e r 2 2 n d , 2 0 1 5 – S é b a s t i e n P O S T I C , S a n d r i n e S E L O S S E , N a d i a M a ï z i
National climate pledges: NAMAs
-38 % GHG in 2020 compared to BAU
-20 % GHG in 2020 compared to 2007
BAUBiofuel support, energy
efficiency, wastereduction, windenergy, national
parks...
77 % renewable electricity in 2020
20 % biofuels in 2020
Afforestation minimum 44 MtCO2eq
82 % oil in primary energy
80 % hydroelectricity
90 % de renewable electricity
0 % net deforestation by 2021
33 % renewables in final energy15 % renewable electricity
30 % Waste-to-Energy
Non-exhaustive review based on NationalCommunications to the UNFCCC

ETSAP Workshop – Sophia-Antipolis, France8/16
O c t o b e r 2 2 n d , 2 0 1 5 – S é b a s t i e n P O S T I C , S a n d r i n e S E L O S S E , N a d i a M a ï z i
National climate pledges: INDCs
-43 % GHG in 2020 below 2005 levels
Reductions below BAUNon AFOLU: -30%/-45% CO2 intens.
AFOLU: 1.5 MtCO2eq removal
Non-exhaustive review based on NationalINDC submissions to the UNFCCC
Reductions below BAUUnilateral: -15% GHG
Conditional: -30% GHG
Forestry: store 13-19 PGCO2/yrEnergy: -25%/-40% CO2 intensityAgric.:-33%/-40% N2O,CH4 intens.
Reductions below BAUUnilateral: -20% GHG
Conditional: -30% GHG
Reductions below BAUUnilateral: -20% GHG
Conditional: -30% GHG
Reductions below BAUEnergy: -25%/-45.8% GHG
Forestry: reforestation of 1,300,000 ha

ETSAP Workshop – Sophia-Antipolis, France9/16
O c t o b e r 2 2 n d , 2 0 1 5 – S é b a s t i e n P O S T I C , S a n d r i n e S E L O S S E , N a d i a M a ï z i
National committments: scenarios
-38 % GHG in 2020 compared to BAU
-20 % in 2020 compared to 2007
BAU
77 % Renewable electricity in 2020
20 % biofuels in 2020
Minimal afforestation 44 MtCO2eq
82 % oil in primary energy
80% hydroelectricity
90 % electricity from RNW sources
0 % net deforestation in 2021
33 % Renewables in final energy
15 % renewable electricity
30 % Waste-to-Energy
333 MtCO2eq
570 MtCO2eq
310 MtCO2eq
1,200 MtCO2eq
158 MtCO2eq
268 MtCO2eq
304 MtCO2eq
235 MtCO2eq
270 MtCO2eq
283 MtCO2eq
293 MtCO2eq
276 MtCO2eq
1,200 MtCO2eq
84 MtCO2eq
214 MtCO2eq
270 MtCO2eq
277 MtCO2eq
469 MtCO2eq
276 MtCO2eq
1,200 MtCO2eq
124 MtCO2eq

ETSAP Workshop – Sophia-Antipolis, France10/16
O c t o b e r 2 2 n d , 2 0 1 5 – S é b a s t i e n P O S T I C , S a n d r i n e S E L O S S E , N a d i a M a ï z i
National committments: scenarios
-38 % GHG in 2020 compared to BAU
-20 % in 2020 compared to 2007
BAU
77 % Renewable electricity in 2020
20 % biofuels in 2020
Minimal afforestation 44 MtCO2eq
82 % oil in primary energy
80% hydroelectricity
90 % electricity from RNW sources
0 % net deforestation in 2021
33 % Renewables in final energy
15 % renewable electricity
30 % Waste-to-Energy
NAMAs Uni_Nat Cond_Nat Cond_TALyC
333 MtCO2eq
570 MtCO2eq
310 MtCO2eq
1,200 MtCO2eq
158 MtCO2eq
268 MtCO2eq
304 MtCO2eq
235 MtCO2eq
270 MtCO2eq
283 MtCO2eq
293 MtCO2eq
276 MtCO2eq
1,200 MtCO2eq
84 MtCO2eq
214 MtCO2eq
270 MtCO2eq
277 MtCO2eq
469 MtCO2eq
276 MtCO2eq
1,200 MtCO2eq
124 MtCO2eq
ETSAP Workshop – Sophia-Antipolis, France11/16
O c t o b e r 2 2 n d , 2 0 1 5 – S é b a s t i e n P O S T I C , S a n d r i n e S E L O S S E , N a d i a M a ï z i
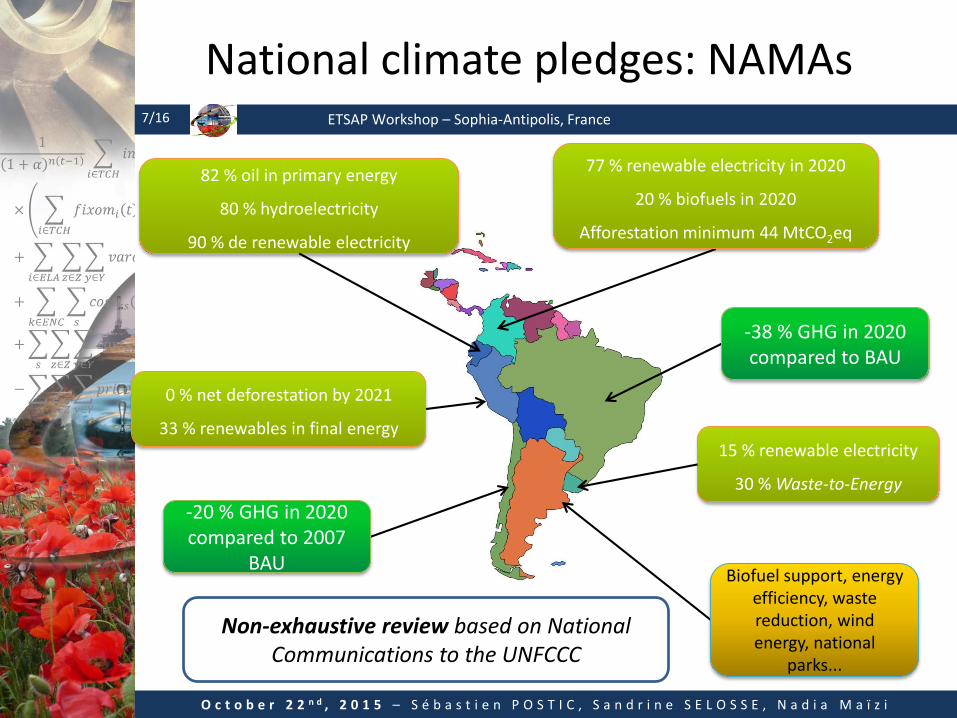
INDCs vs. NAMAs: overall impacts
2
3
4
5
6
7
2010 2012 2015 2020 2030 2040 2050
Emis
sio
ns
(GtC
O2e
q)
BAU
NAMAs
Uni_Nat
Cond_Nat
Cond_TALyC
• NAMAs emissions are 21% below BAU in 2030
• INDCs emissions range from 24% to 32% below BAU
• Stringent past-2030 bound in INDCs.

ETSAP Workshop – Sophia-Antipolis, France12/16
O c t o b e r 2 2 n d , 2 0 1 5 – S é b a s t i e n P O S T I C , S a n d r i n e S E L O S S E , N a d i a M a ï z i
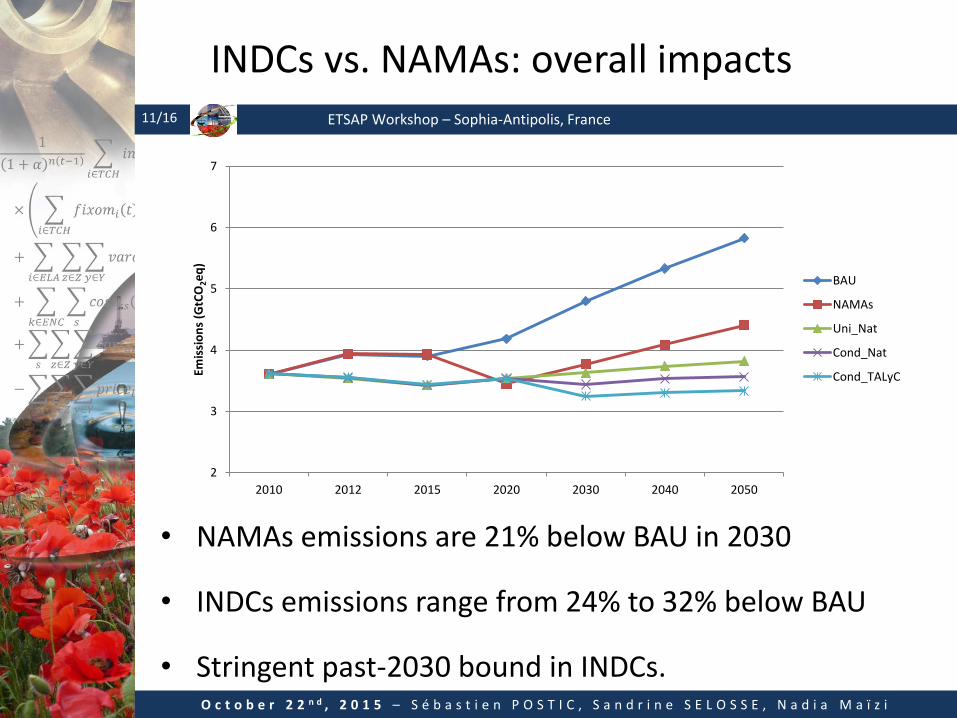
Impact on ELC – a virtuous BAU
0
500
1,000
1,500
2,000
2,500
2010 2015 2020 2030 2040 2050
Ele
ctri
city
pro
du
ctio
n (
TWh
/yr)
Waste-to-energy
Wind
Solar
Geothermal
Biomass
Hydro
Nuclear
Gas
Oil
Coal
2030 2050
ETSAP Workshop – Sophia-Antipolis, France13/16
O c t o b e r 2 2 n d , 2 0 1 5 – S é b a s t i e n P O S T I C , S a n d r i n e S E L O S S E , N a d i a M a ï z i
Impact on ELC – a virtuous BAU
0
500
1,000
1,500
2,000
2,500
2010 2015 2020 2030 2040 2050
Ele
ctri
city
pro
du
ctio
n (
TWh
/yr)
Waste-to-energy
Wind
Solar
Geothermal
Biomass
Hydro
Nuclear
Gas
Oil
Coal
2030 2050

ETSAP Workshop – Sophia-Antipolis, France14/16
O c t o b e r 2 2 n d , 2 0 1 5 – S é b a s t i e n P O S T I C , S a n d r i n e S E L O S S E , N a d i a M a ï z i
Impacts on ELC: Electrification, decarbonization
-500
0
500
1,000
1,500
2,000
2,500
3,000
20
15
20
20
20
30
20
40
20
50
20
15
2020
20
30
20
40
20
50
2015
20
20
20
30
20
40
20
50
20
15
20
20
20
30
20
40
20
50
NAMAs Uni_Nat Cond_Nat Cond_TALyC
Var
iati
on
in e
lect
rici
ty p
rod
uct
ion
(TW
h/y
r)
Waste-to-energy
Wind
Solar
Geothermal
Biomass
Hydro
Nuclear
Gas
Oil
Coal
-400
-200
0
200
400
600
800
1,000
1,2002
010
20
20
20
30
20
40
20
50
20
10
20
20
20
30
20
40
20
50
20
10
20
20
20
30
20
40
20
50
20
10
20
20
20
30
20
40
20
50
20
10
20
20
20
30
20
40
20
50
20
10
20
20
20
30
20
40
20
50
BSE BWC ARG CHL COL/CYC AND/BPU/SUG/VEN
Var
iati
on
in e
lect
rici
ty p
rod
uct
ion
(TW
h/y
r)
ETSAP Workshop – Sophia-Antipolis, France15/16
O c t o b e r 2 2 n d , 2 0 1 5 – S é b a s t i e n P O S T I C , S a n d r i n e S E L O S S E , N a d i a M a ï z i
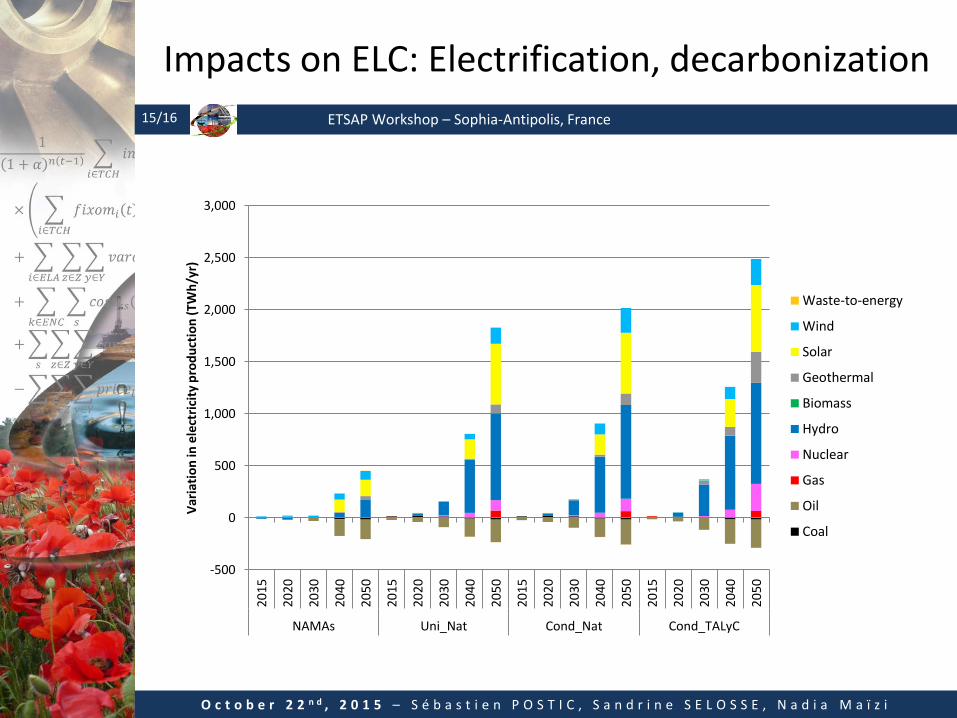
Impacts on ELC: Electrification, decarbonization
-500
0
500
1,000
1,500
2,000
2,500
3,000
20
15
20
20
20
30
20
40
20
50
20
15
2020
20
30
20
40
20
50
2015
20
20
20
30
20
40
20
50
20
15
20
20
20
30
20
40
20
50
NAMAs Uni_Nat Cond_Nat Cond_TALyC
Var
iati
on
in e
lect
rici
ty p
rod
uct
ion
(TW
h/y
r)
Waste-to-energy
Wind
Solar
Geothermal
Biomass
Hydro
Nuclear
Gas
Oil
Coal

ETSAP Workshop – Sophia-Antipolis, France16/16
O c t o b e r 2 2 n d , 2 0 1 5 – S é b a s t i e n P O S T I C , S a n d r i n e S E L O S S E , N a d i a M a ï z i
BAU Primary energy: room for improvement
0
200
400
600
800
1,000
1,200
1,400
1,600
2010 2015 2020 2030 2040 2050
Pri
mar
y e
ne
rgy
pro
du
ctio
n (
Mto
e/y
r)
Wind
Solar
Geothermal
Biomass
Hydro
Nuclear
Gas
Oil
Coal
2030 2050
ETSAP Workshop – Sophia-Antipolis, France17/16
O c t o b e r 2 2 n d , 2 0 1 5 – S é b a s t i e n P O S T I C , S a n d r i n e S E L O S S E , N a d i a M a ï z i
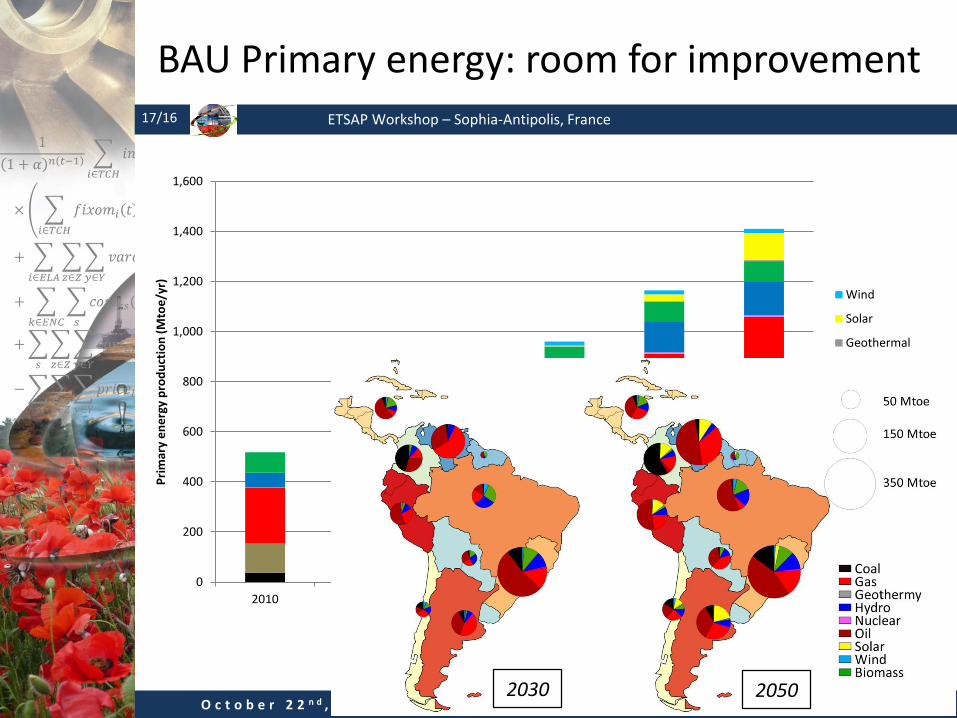
BAU Primary energy: room for improvement
0
200
400
600
800
1,000
1,200
1,400
1,600
2010 2015 2020 2030 2040 2050
Pri
mar
y e
ne
rgy
pro
du
ctio
n (
Mto
e/y
r)
Wind
Solar
Geothermal
Biomass
Hydro
Nuclear
Gas
Oil
Coal
2030 2050

ETSAP Workshop – Sophia-Antipolis, France18/16
O c t o b e r 2 2 n d , 2 0 1 5 – S é b a s t i e n P O S T I C , S a n d r i n e S E L O S S E , N a d i a M a ï z i
Impact on TPES: BSE drives decarbonization
-400
-300
-200
-100
0
100
200
300
400
500
600
2015 2020 2030 2040 2050 2015 2020 2030 2040 2050 2015 2020 2030 2040 2050 2015 2020 2030 2040 2050
NAMAs Uni_Nat Cond_Nat Cond_TALyC
Var
iati
on
in p
rim
ary
en
erg
y co
nsu
mp
tio
n (
Mto
e/y
r)(N
.B.:
incl
ud
es
ext
ern
al t
rad
e o
nly
)
Elc
Wind
Solar
Geothermal
Biomass
Hydro
Nuclear
Gas
Oil
Coal
ETSAP Workshop – Sophia-Antipolis, France19/16
O c t o b e r 2 2 n d , 2 0 1 5 – S é b a s t i e n P O S T I C , S a n d r i n e S E L O S S E , N a d i a M a ï z i
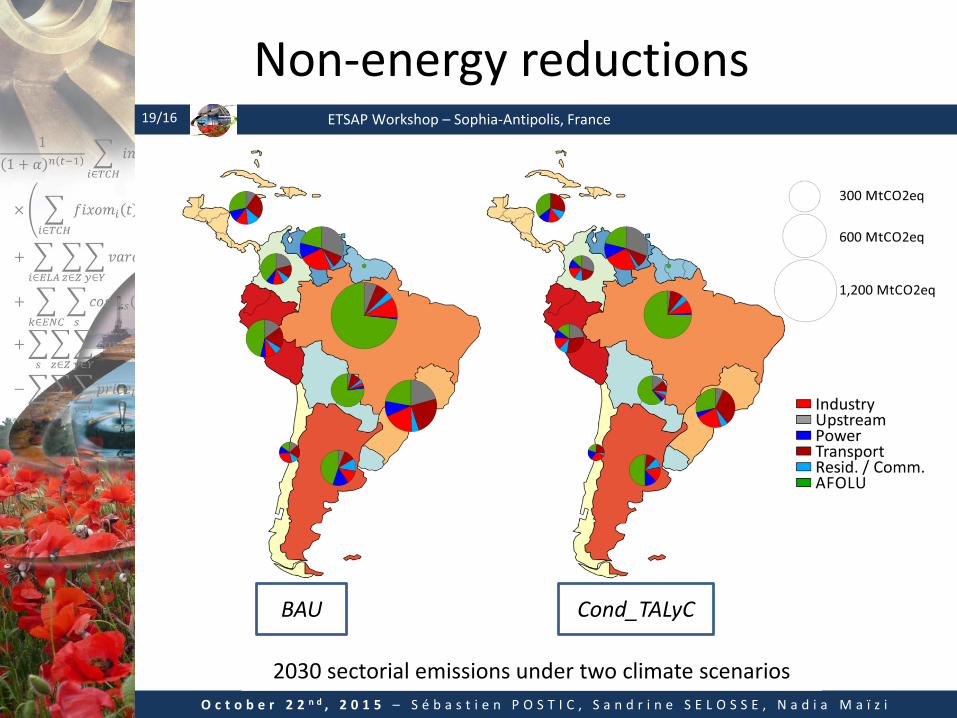
Non-energy reductions
BAU Cond_TALyC
2030 sectorial emissions under two climate scenarios

ETSAP Workshop – Sophia-Antipolis, France20/16
O c t o b e r 2 2 n d , 2 0 1 5 – S é b a s t i e n P O S T I C , S a n d r i n e S E L O S S E , N a d i a M a ï z i
Concluding remarks
• A quite specific climate-energy context– Clean electricity => the challenge is not EU’s one...
– Non-energy GHGs => adapt the modeling framework
• Improvement of INDCs over NAMAs– But what’s next after 2030?
– Ambitious strategy is achievable
• Relevance of energy exports– Interest of coupling TIAM and TALyC
• Climate change adaptation– A local, renewable energy mix
– How to hedge against CC effects? => stoch. TIMES
– Overcapacity versus regional integration....
ETSAP Workshop – Sophia-Antipolis, France21/16
O c t o b e r 2 2 n d , 2 0 1 5 – S é b a s t i e n P O S T I C , S a n d r i n e S E L O S S E , N a d i a M a ï z i
Thank you for your attention!
Contact:[email protected]