Embed Size (px)
Citation preview
LET’SINSPIRE

Hani AbdulwahabJeeraune Matundu-
TjiparuruHafeni Tulongeni
Hamukoto
PRESENTERS

: OVERVIEW
• Founded in 1995, IPO – 1997• Become Digi.com Berhad in
2000• Headquarters: D’House, Subang
Hi-Tech Industrial Park, Shah Alam, Selanfor
• CEO: Albern Murty• Products: Telecommunication
Services; Mobile Services; Cable TV
• Revenue: ↑RM6.733 Billion 2013
• Net Income: ↑RM1.706 Billion• Slogan: “Lets Inspire”• Website: www.digi.com.my

PROFITABILITY
2011 2012 20130.00%
50.00%100.00%150.00%200.00%250.00%300.00%350.00%400.00%450.00%500.00% Profitability Ratios
Profit Margin ROA ROE
2011 2012 20130.00%
5.00%
10.00%
15.00%
20.00%
25.00%
30.00%
35.00% Profit Margin
DIGI MAXIS AXIATA
• 2011 Profit Margin = 21.03%; ↓18.95% in 2012; ↑25.33% in 2013
• ROA* in 2011 was 25.79%; ↑ 30.03 in 2012 and increased again in 2013 by 45.46%
• ROE** was 88.88% in 2011; ↑461.39 in 2012; and ↓258.08% in 2013
• DiGi was more profitable than MAXIS & AXIATA in 2013
• DiGi also had a better ROA & ROE than its closest competitors.
PERFORMANC & EFFICIENCY
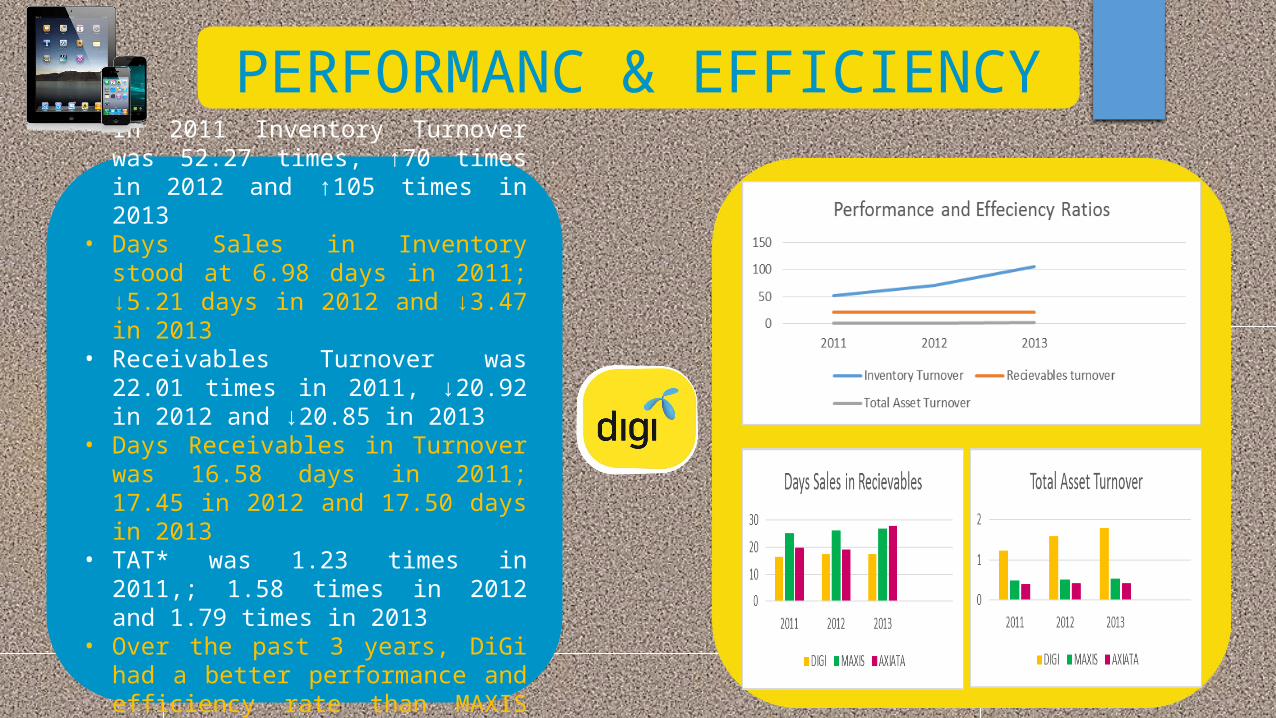
• In 2011 Inventory Turnover was 52.27 times, ↑70 times in 2012 and ↑105 times in 2013
• Days Sales in Inventory stood at 6.98 days in 2011; ↓5.21 days in 2012 and ↓3.47 in 2013
• Receivables Turnover was 22.01 times in 2011, ↓20.92 in 2012 and ↓20.85 in 2013
• Days Receivables in Turnover was 16.58 days in 2011; 17.45 in 2012 and 17.50 days in 2013
• TAT* was 1.23 times in 2011,; 1.58 times in 2012 and 1.79 times in 2013
• Over the past 3 years, DiGi had a better performance and efficiency rate than MAXIS and AXIATA

LIQUIDITY
2011 2012 20130
0.20.40.60.8
11.21.4
Current Ratio
DiGi Maxis Axiata
2011 2012 20130
0.2
0.4
0.6
0.8
1
1.2
Cash Ratio
DiGi Maxis Axiata
• Current Ratio stood at RM0.63 per RM1.00 of liability in 2011: ↓RM0.52 in 2012; ↑RM0.53 in 2013
• Quick Ratio was recorded as 0.5996 times in 2011; ↓0.4903 times in 2012 while in 2013 it stood at ↑0.5015 times
• Cash Ratios was 0.4235 times in 2011; ↓0.2306 in 2012 and no change in 2013
• Axiata was more liquid than DiGi & Maxis in both years (2011-2013)
• DiGi’s cash reserves were better than Maxis
• Maxis had more non-cash current assets
FINANCIAL STABILITY
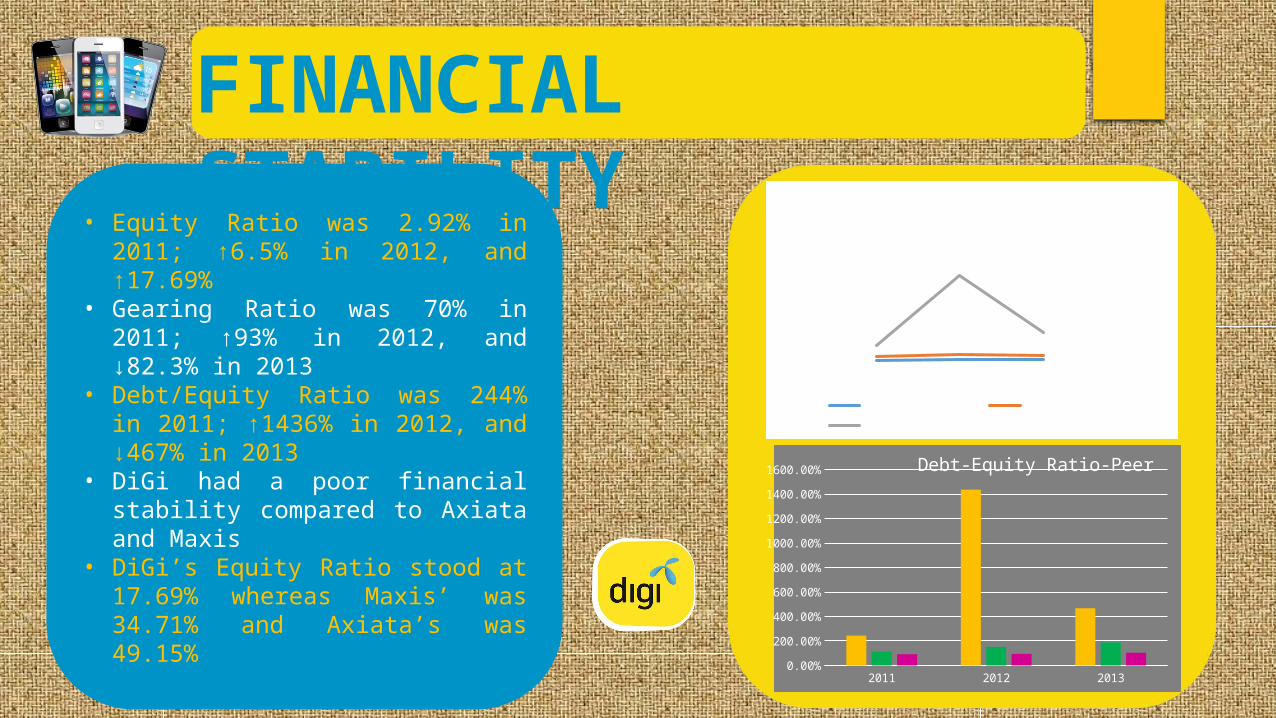
• Equity Ratio was 2.92% in 2011; ↑6.5% in 2012, and ↑17.69%
• Gearing Ratio was 70% in 2011; ↑93% in 2012, and ↓82.3% in 2013
• Debt/Equity Ratio was 244% in 2011; ↑1436% in 2012, and ↓467% in 2013
• DiGi had a poor financial stability compared to Axiata and Maxis
• DiGi’s Equity Ratio stood at 17.69% whereas Maxis’ was 34.71% and Axiata’s was 49.15%
2011 2012 2013 Category 40.00%
200.00%
400.00%
600.00%
800.00%
1000.00%
1200.00%
1400.00%
1600.00%
Financial Stability-DIGI
Equity Ratio Gearing Ratio Debt/Equity Ratio
2011 2012 20130.00%
200.00%
400.00%
600.00%
800.00%
1000.00%
1200.00%
1400.00%
1600.00% Debt-Equity Ratio-Peer
DIGI MAXIS
THANK
YOU