Embed Size (px)
Citation preview

Type of Charts
(with R 3.4.1 x64) v3.0 2017-09-17

Informations

Recommanded books

Graph Continuum
Dot and Vector Charts

Dots cloud charts
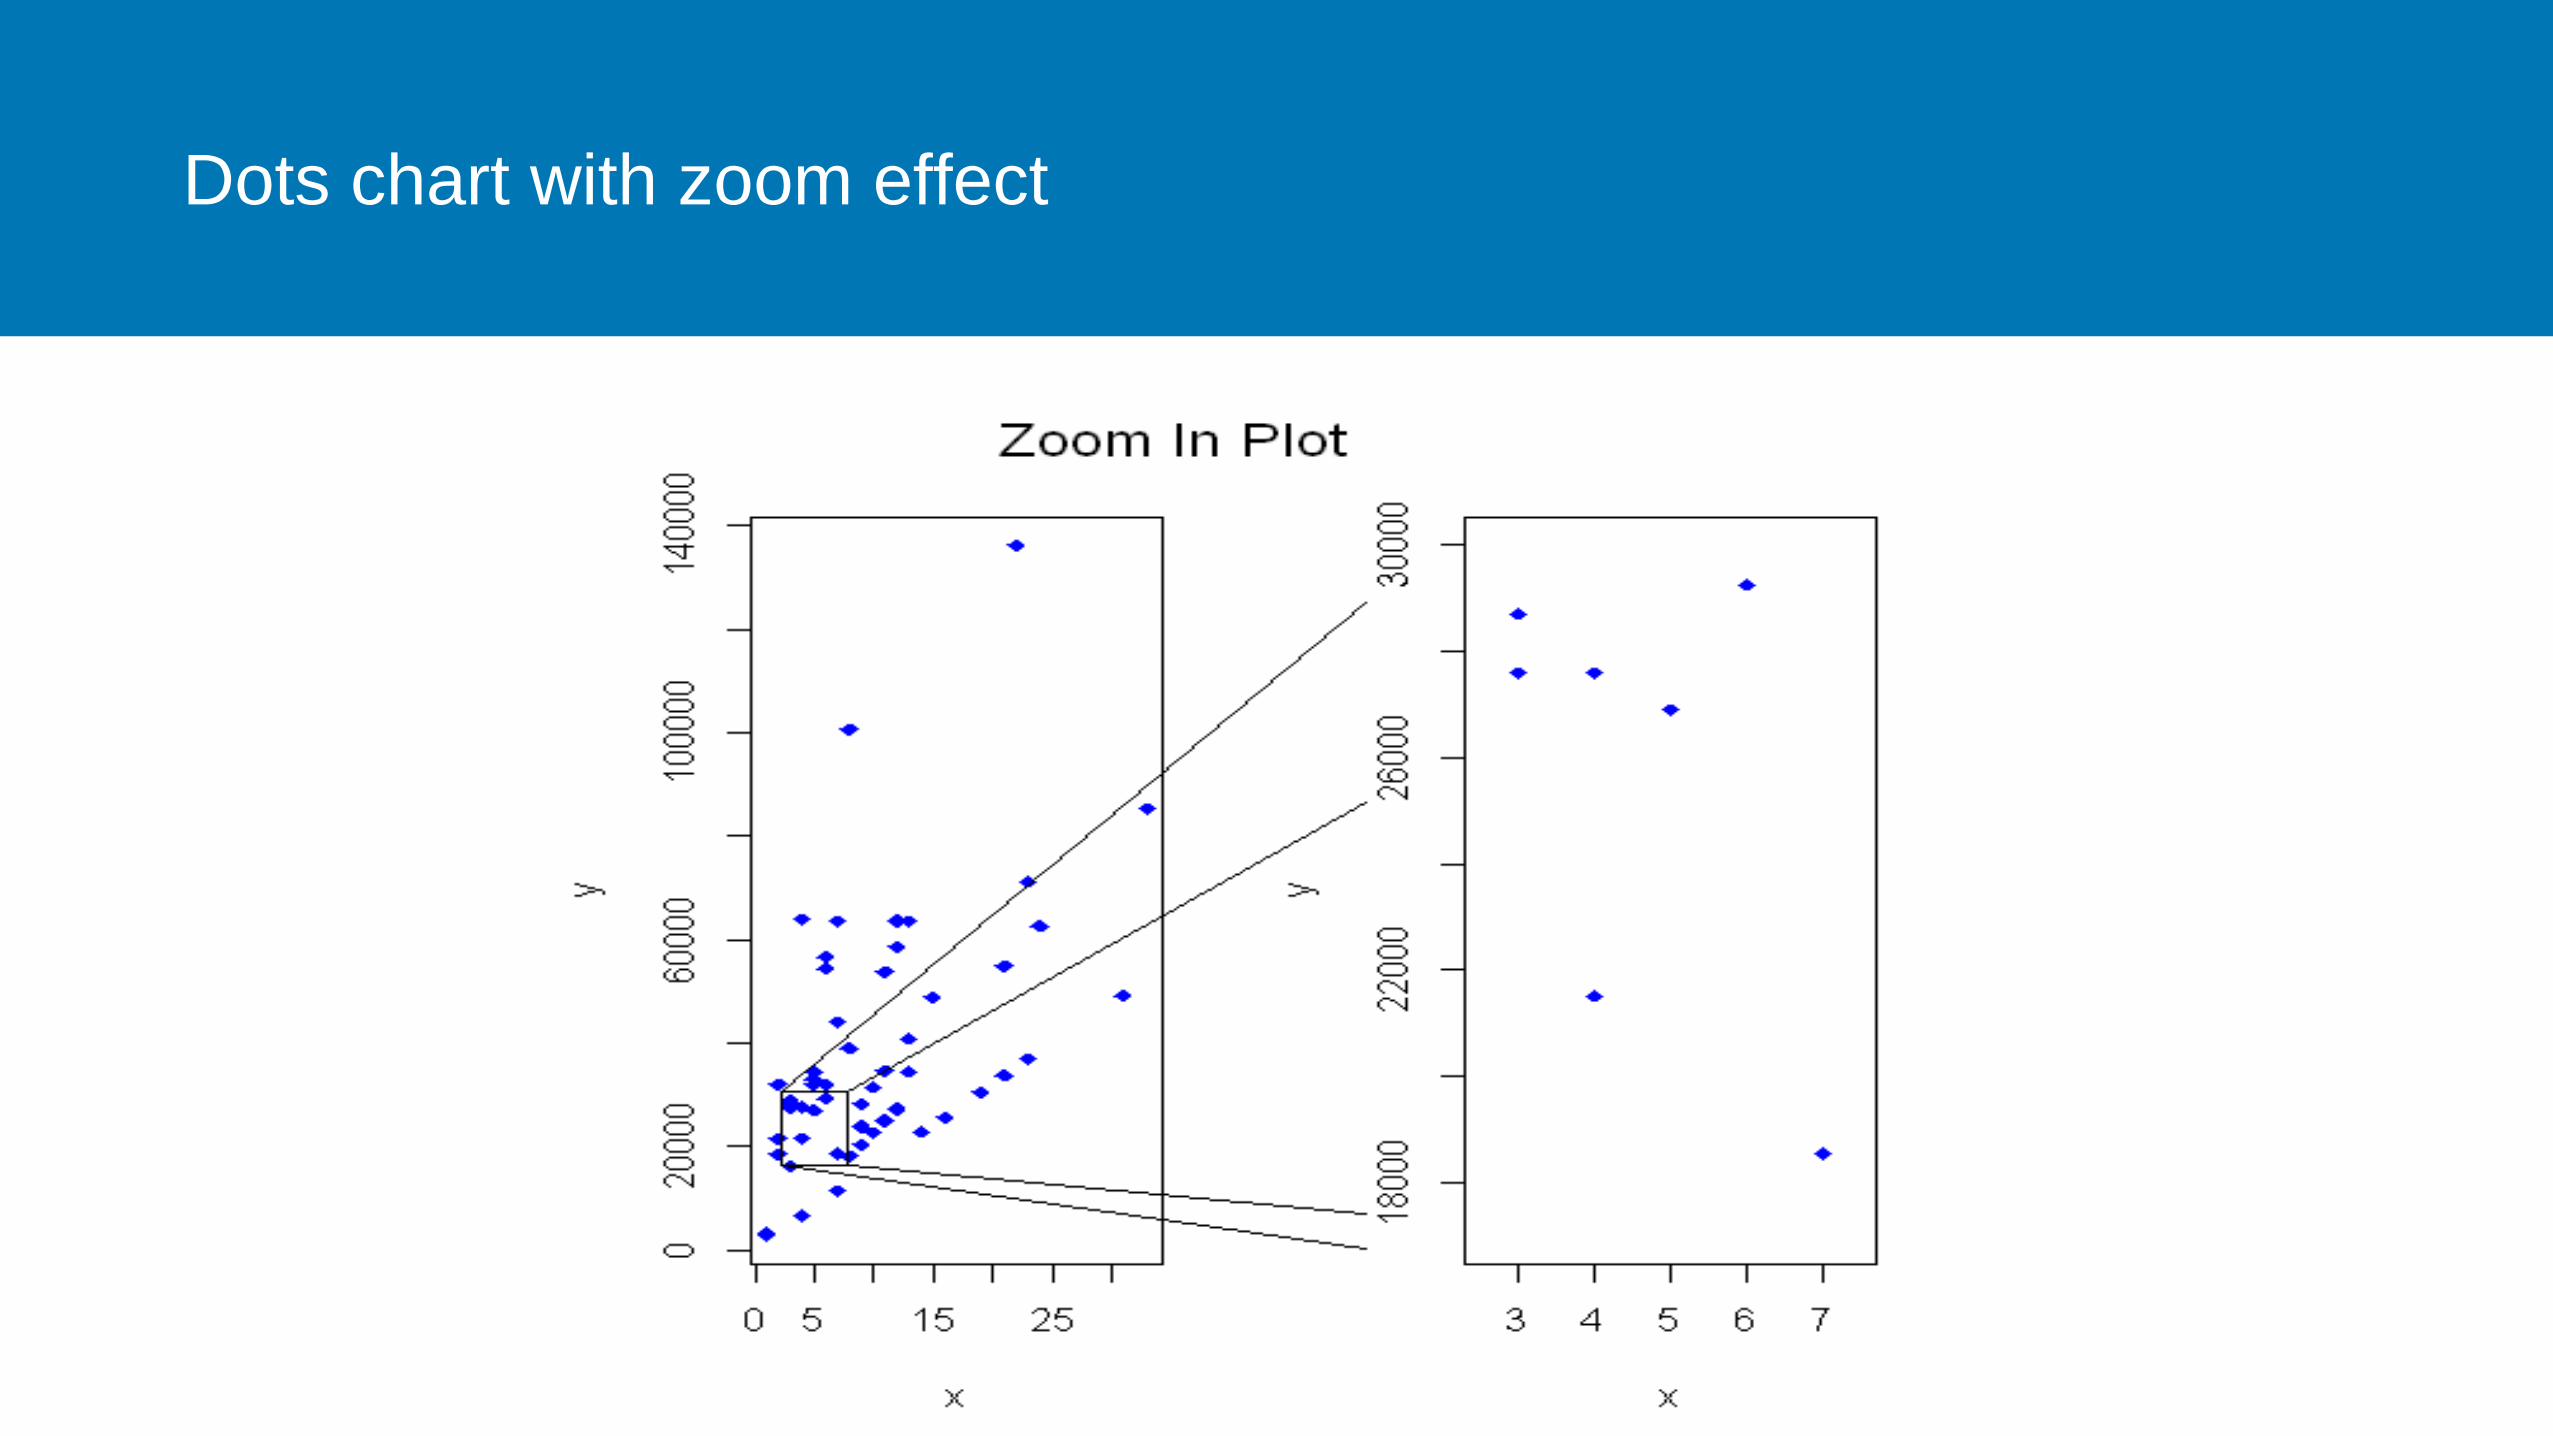
Dots chart with zoom effect

Error bars dots chart
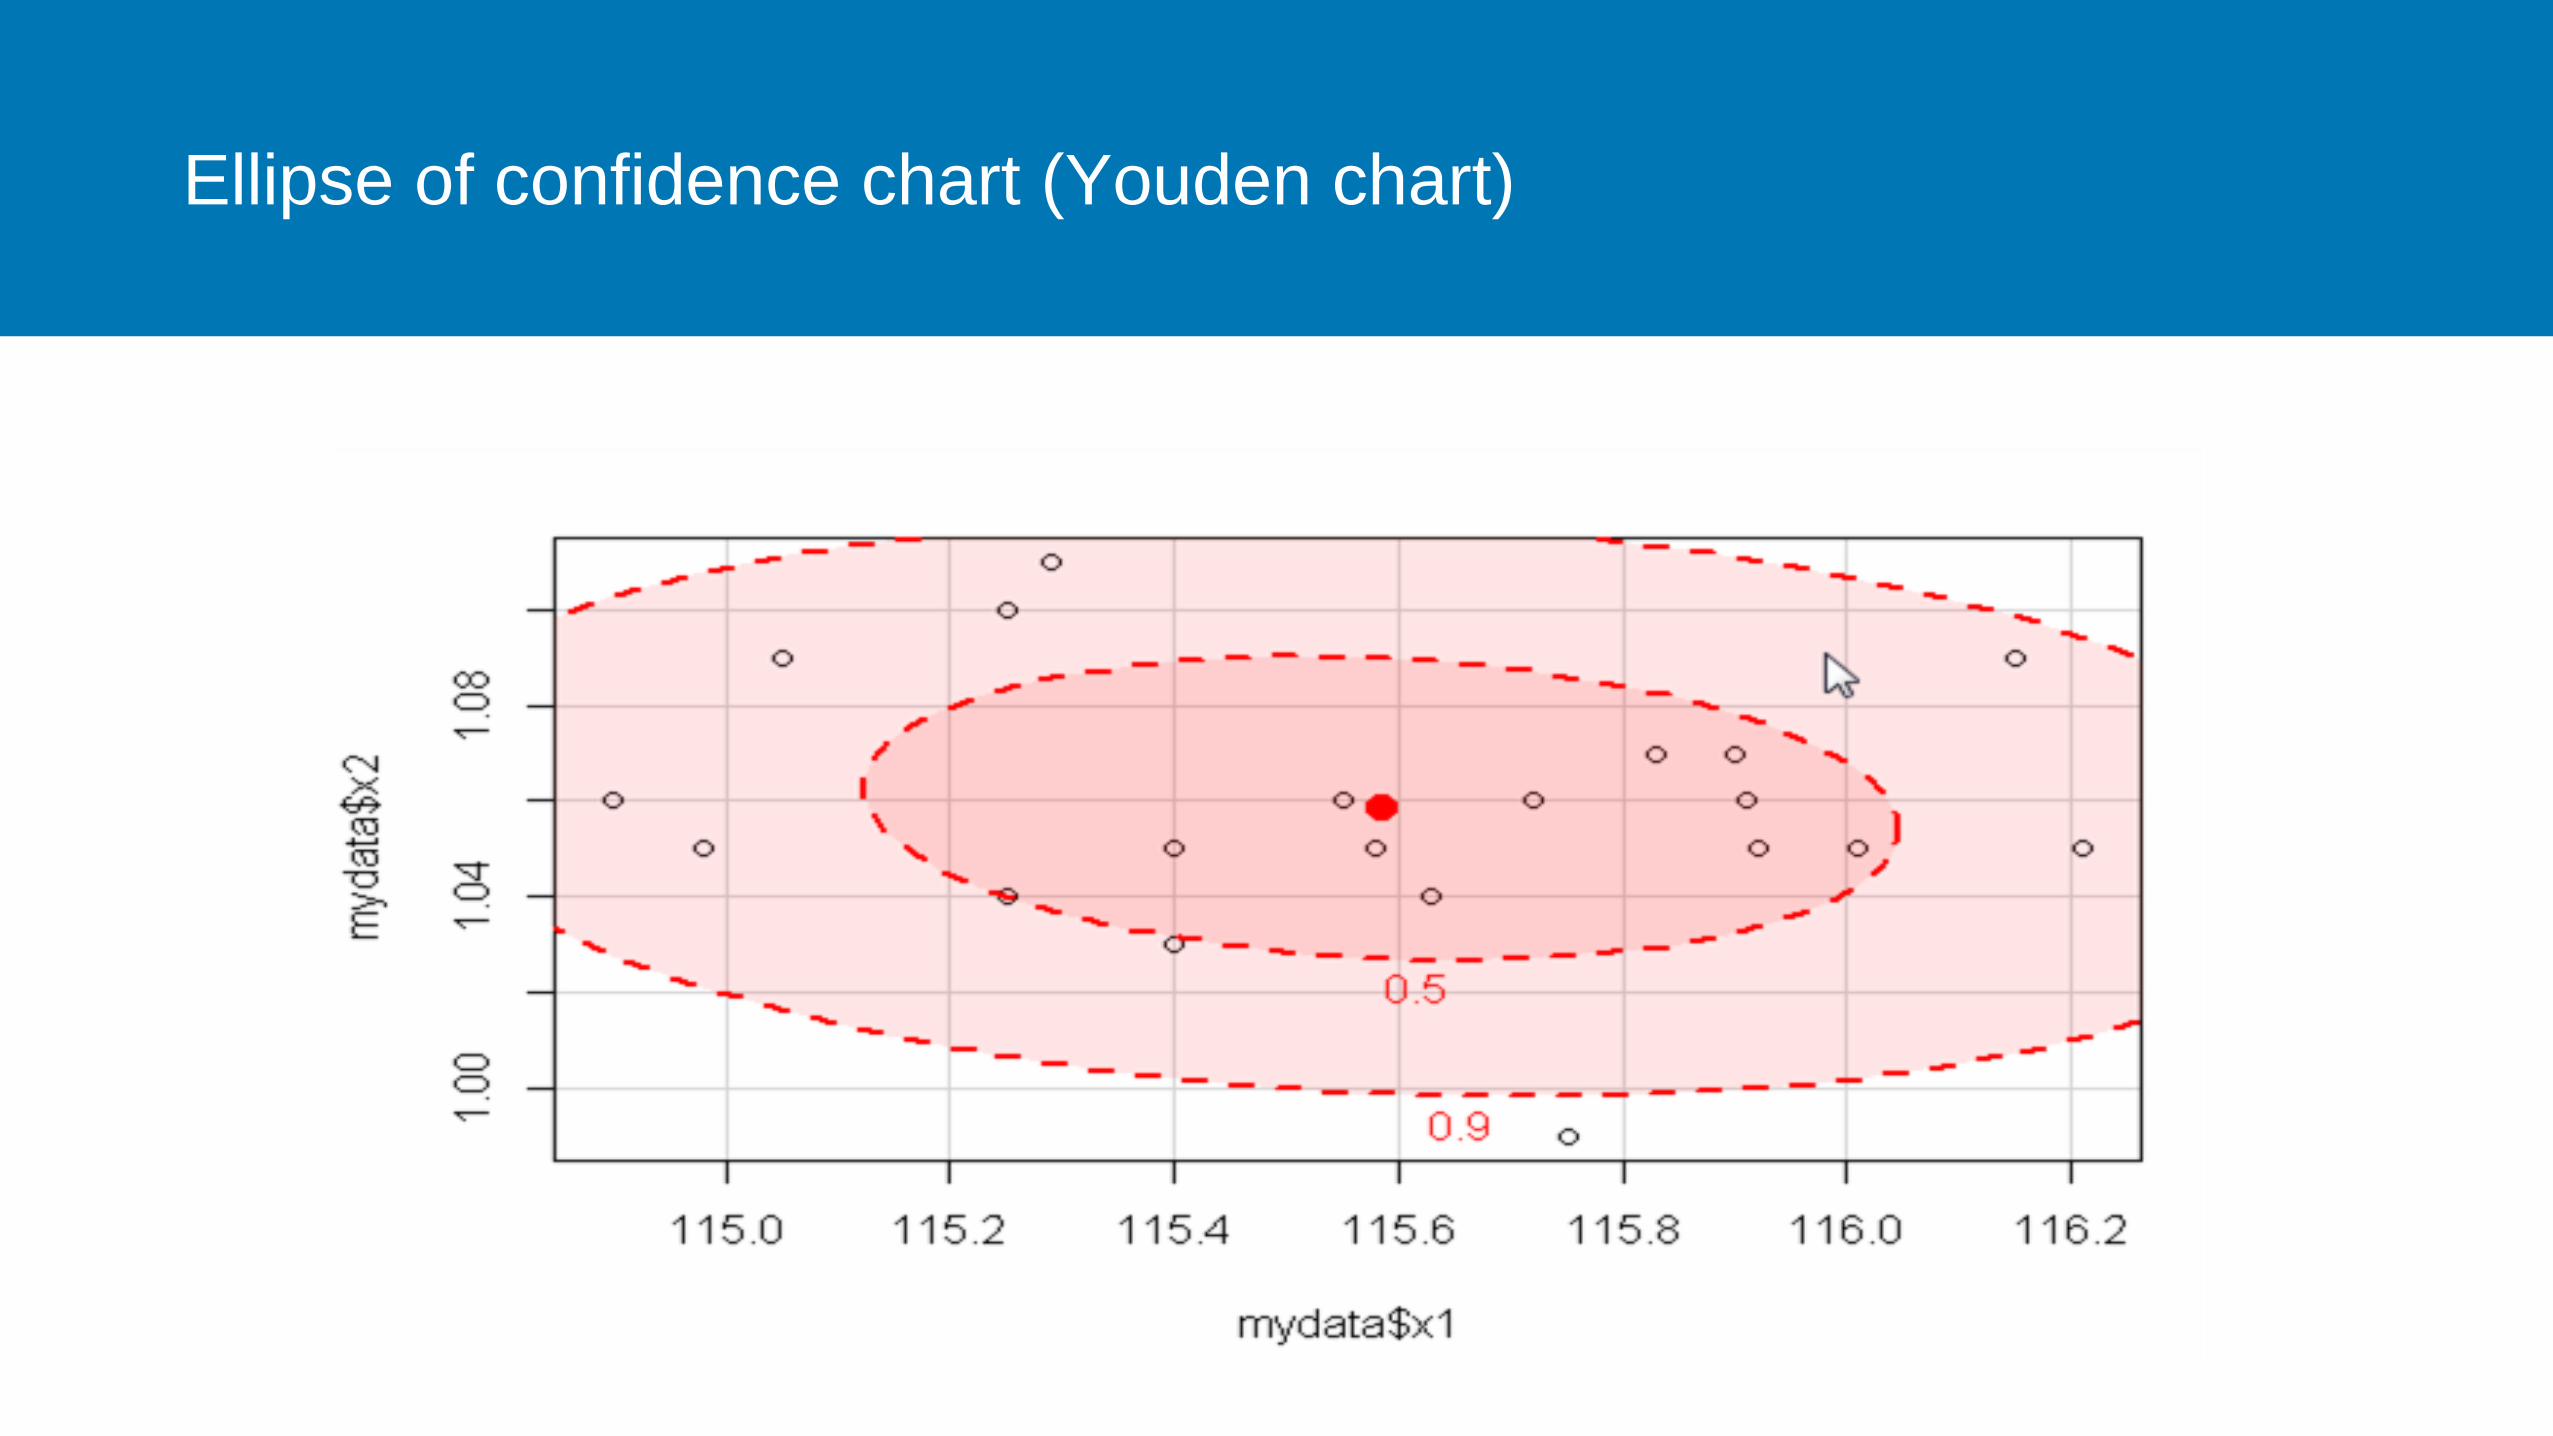
Ellipse of confidence chart (Youden chart)
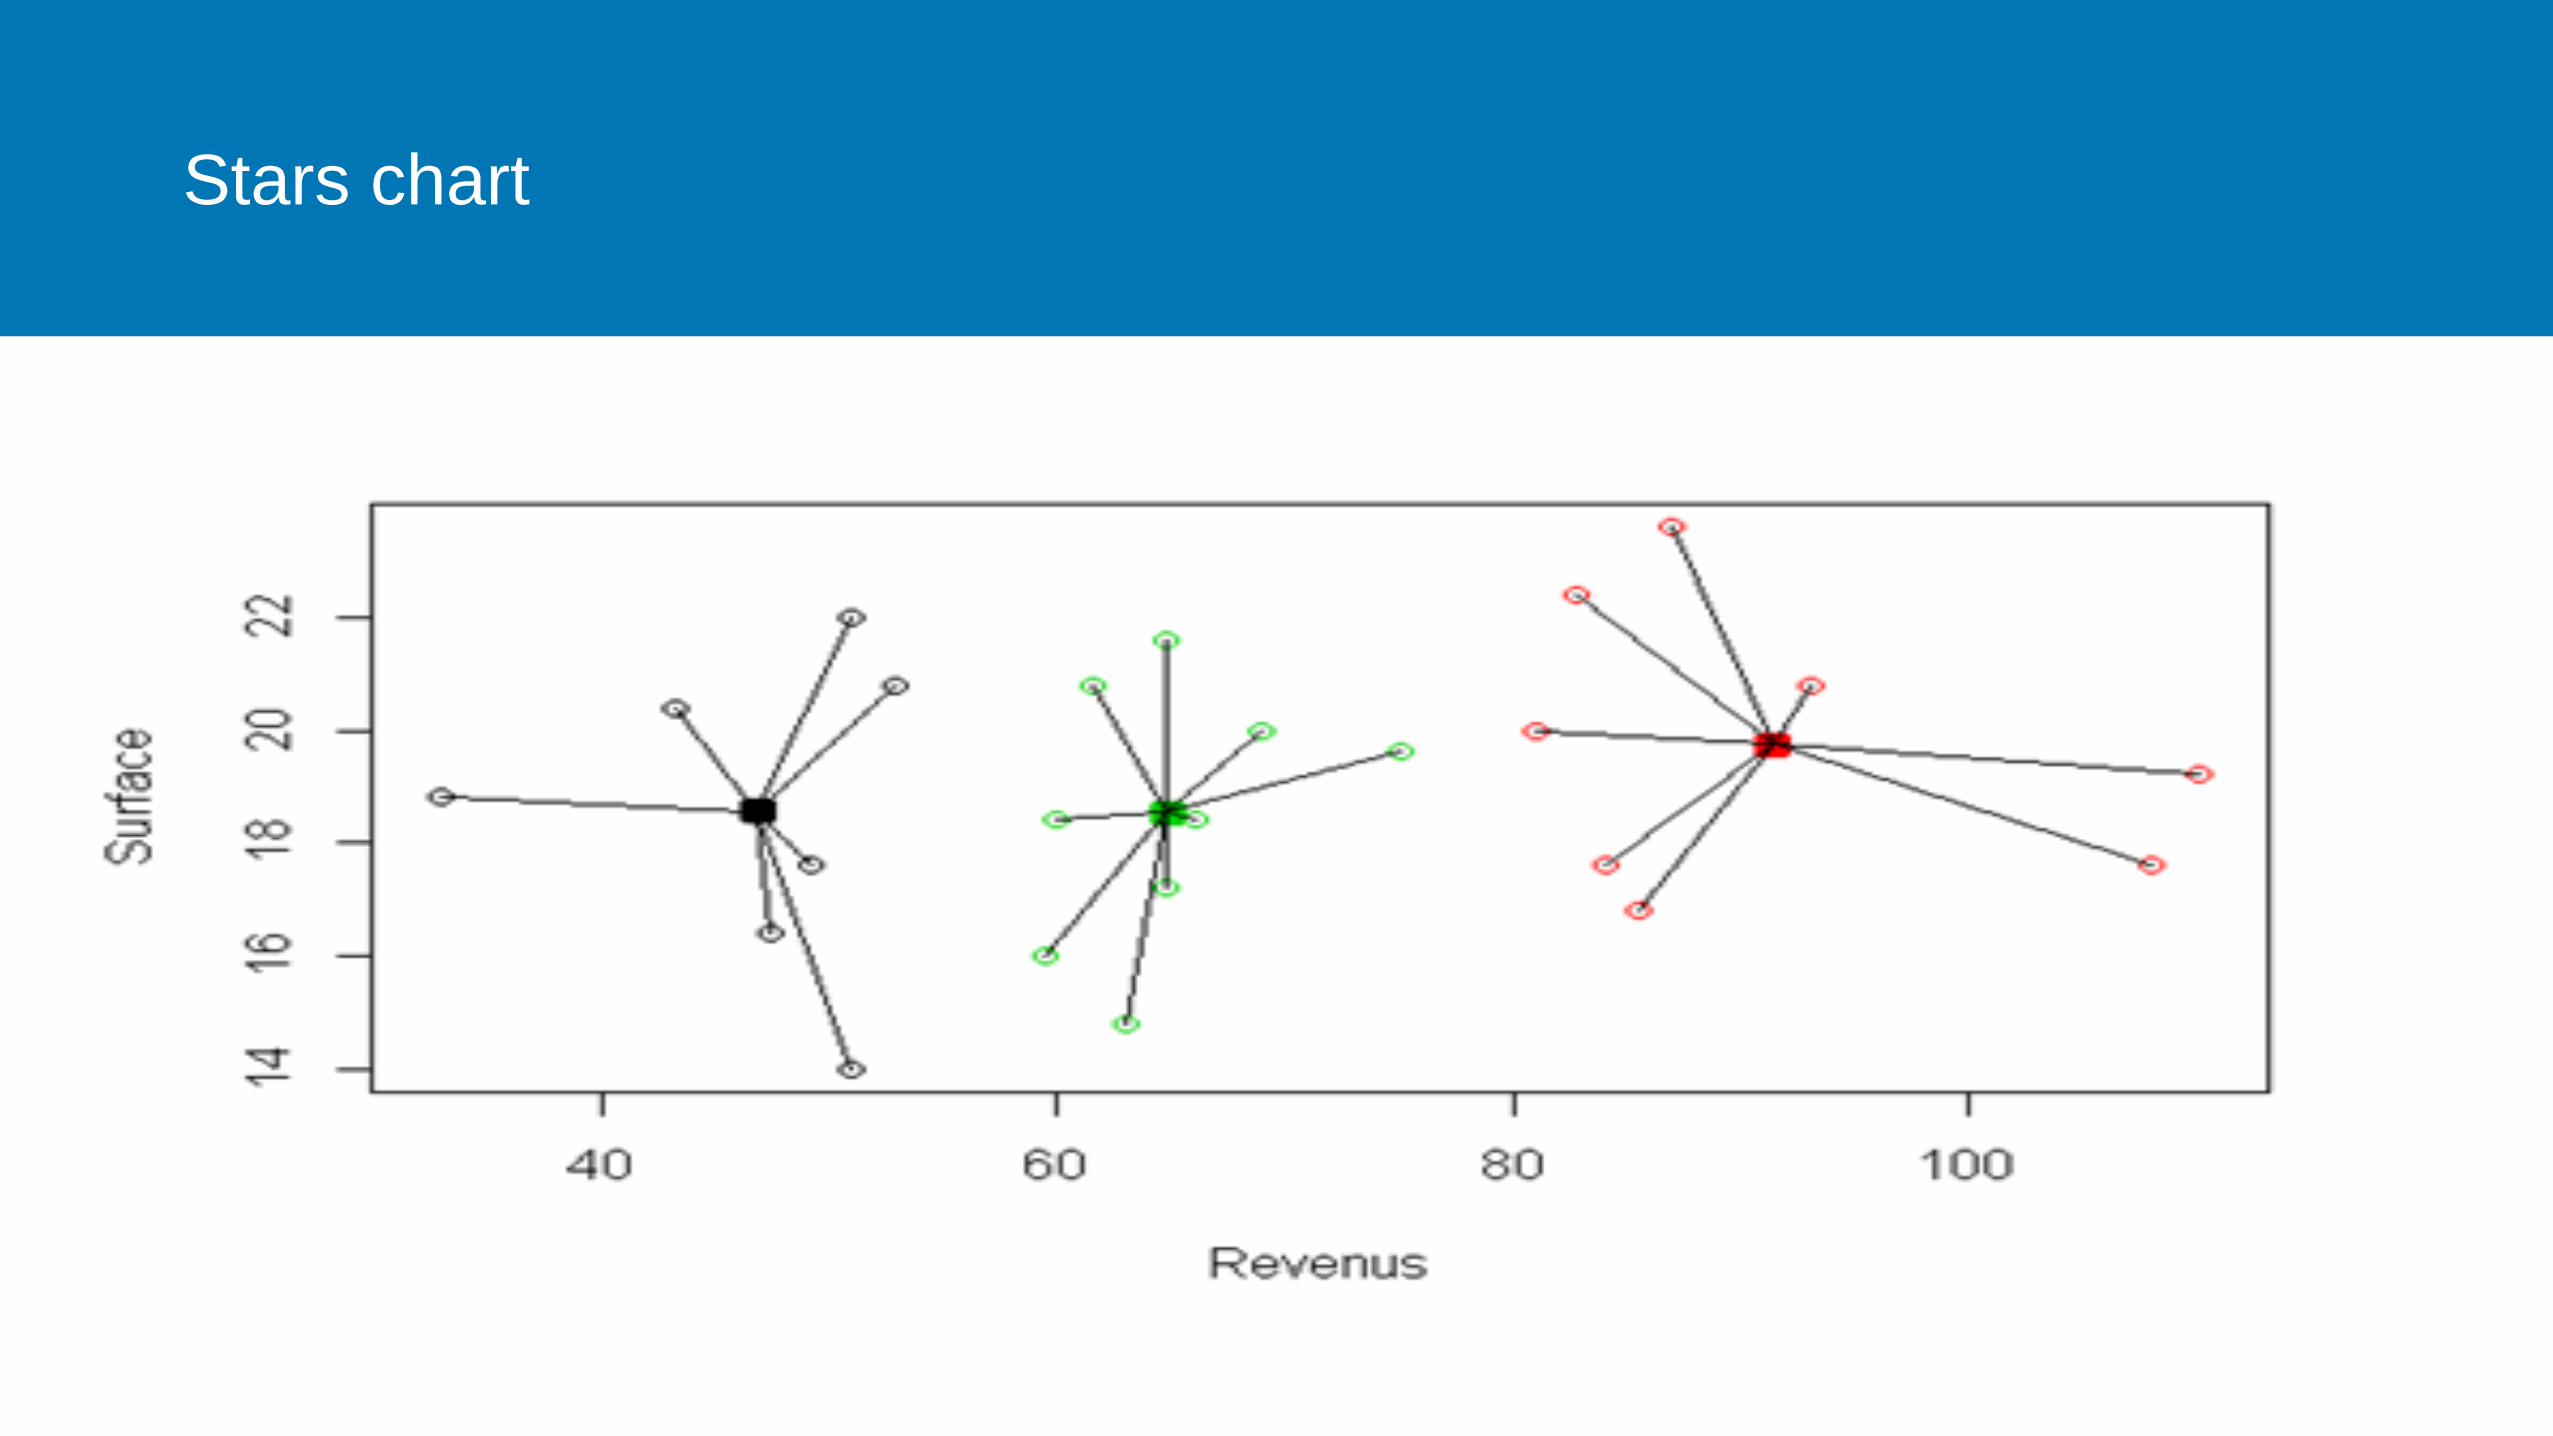
Stars chart

Cleveland chart

Stem-and-Leaf chart
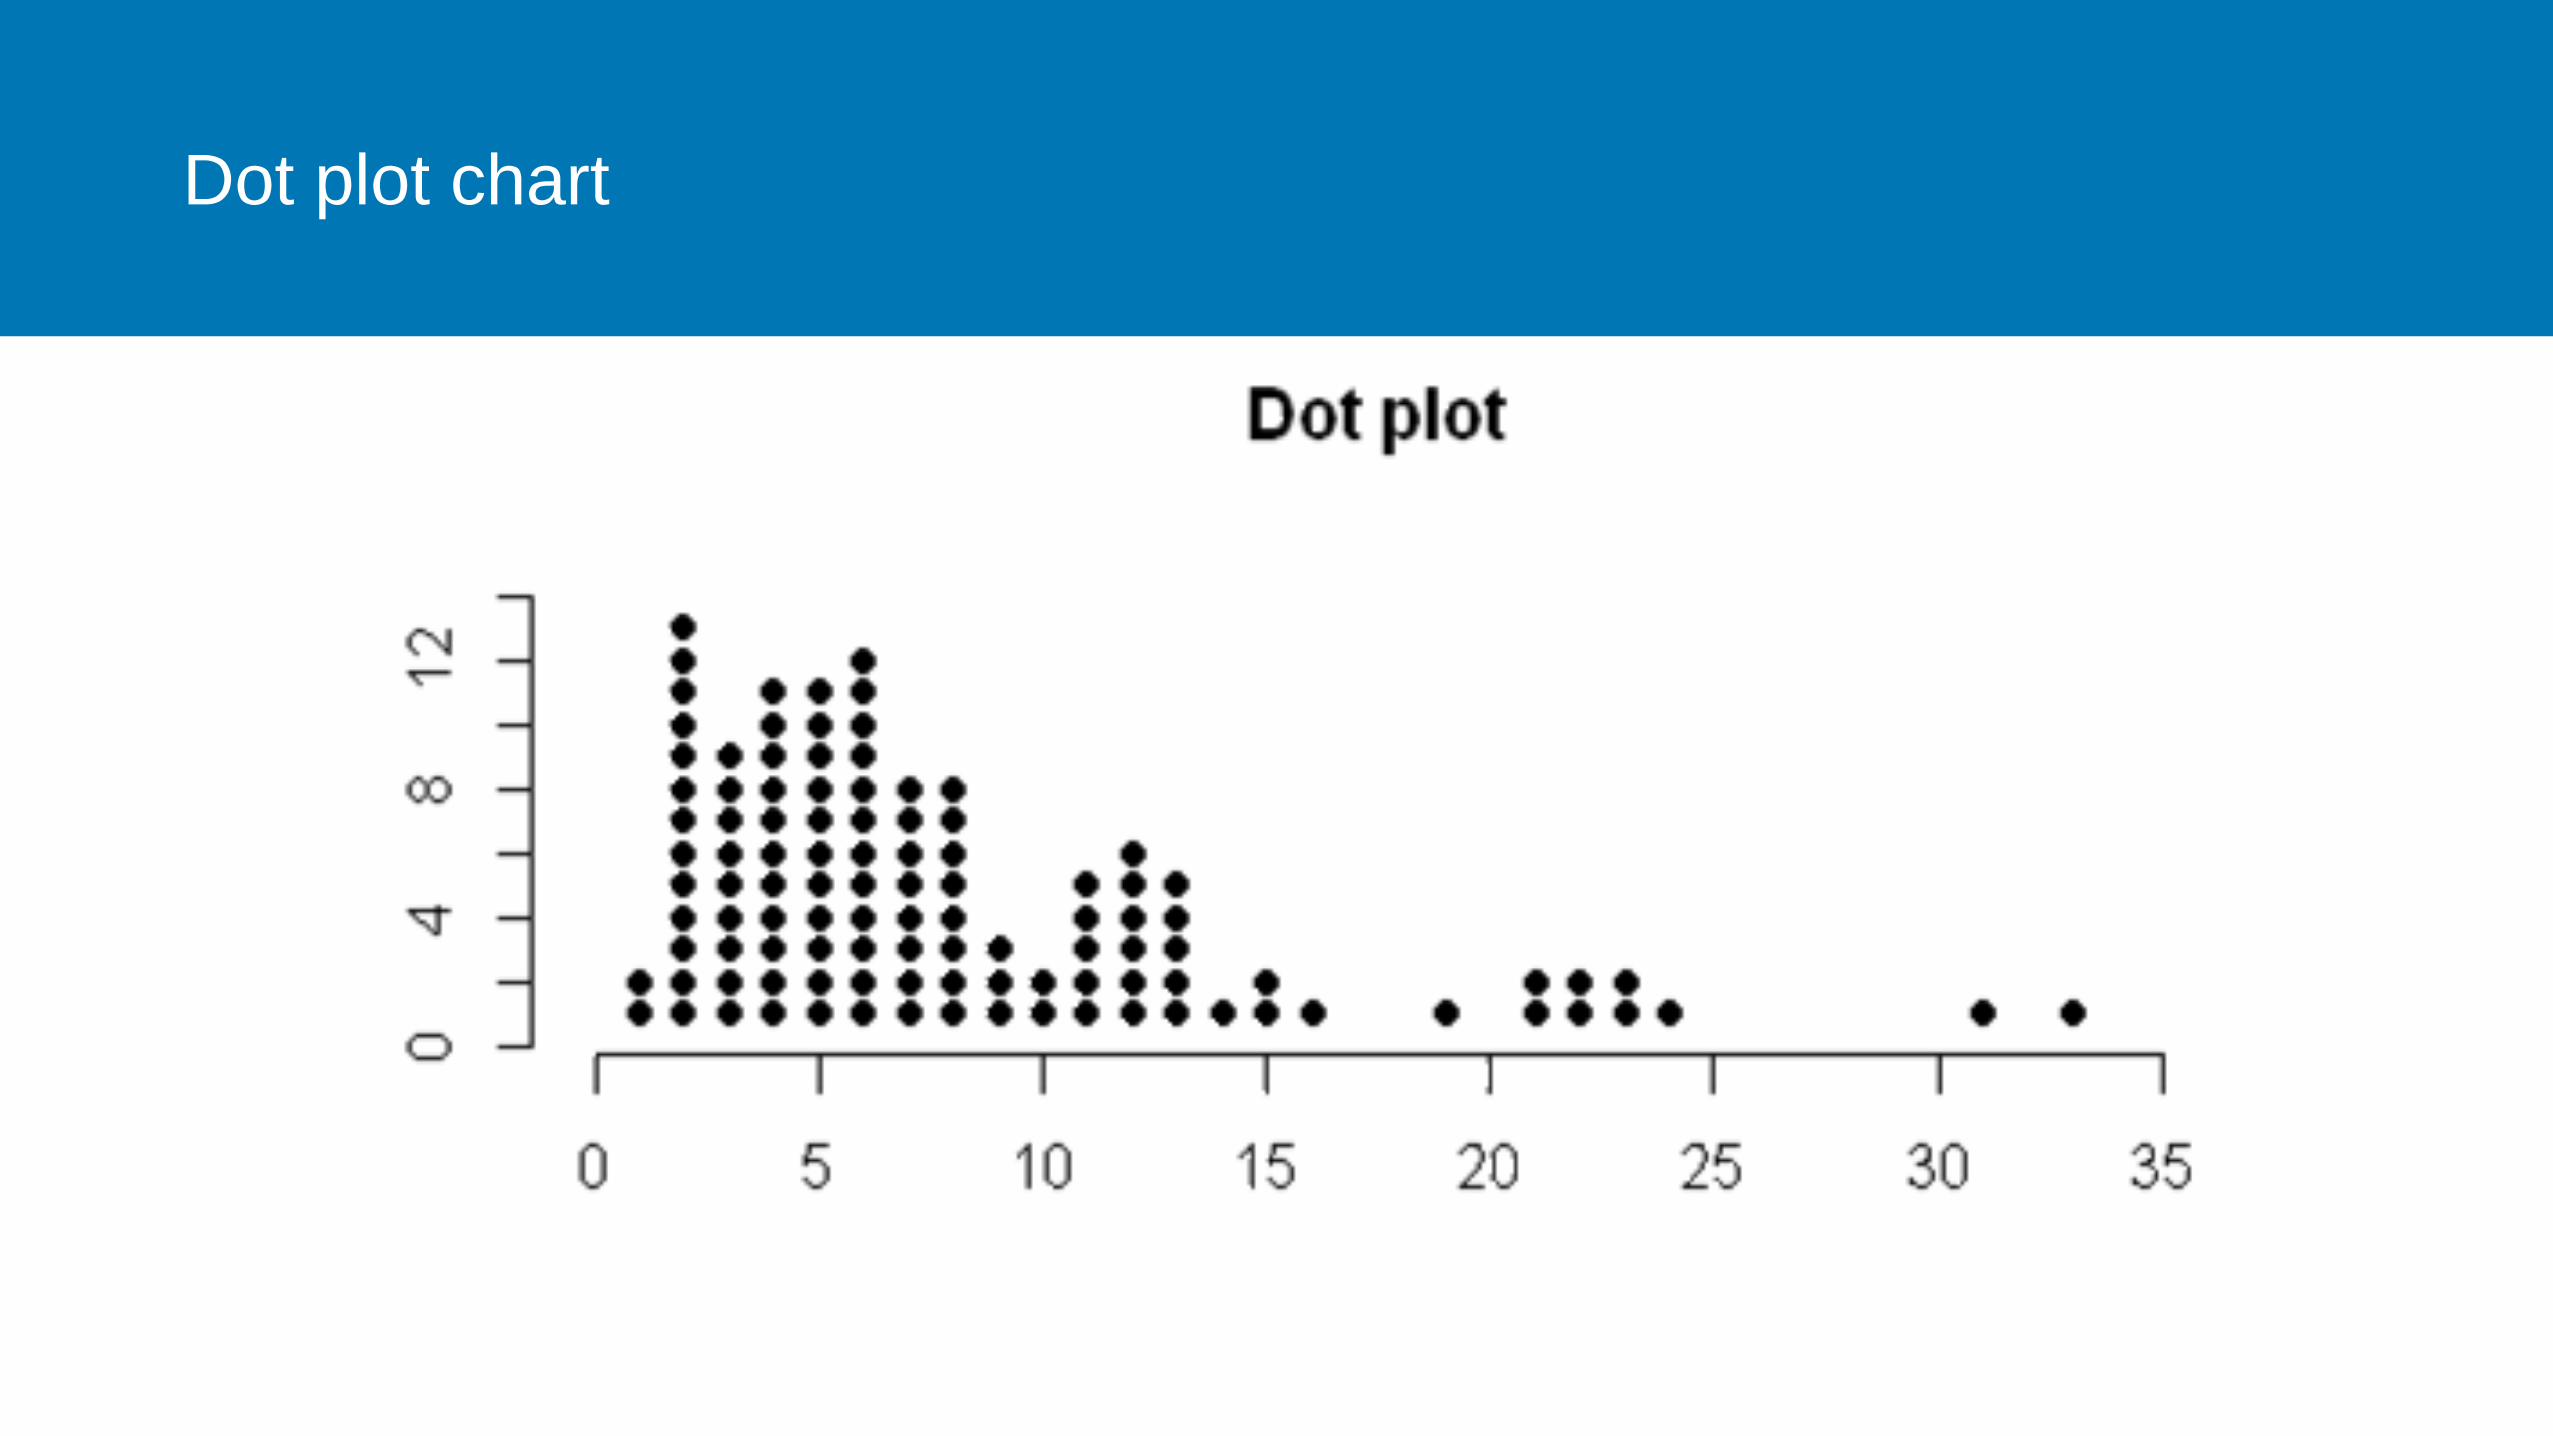
Dot plot chart
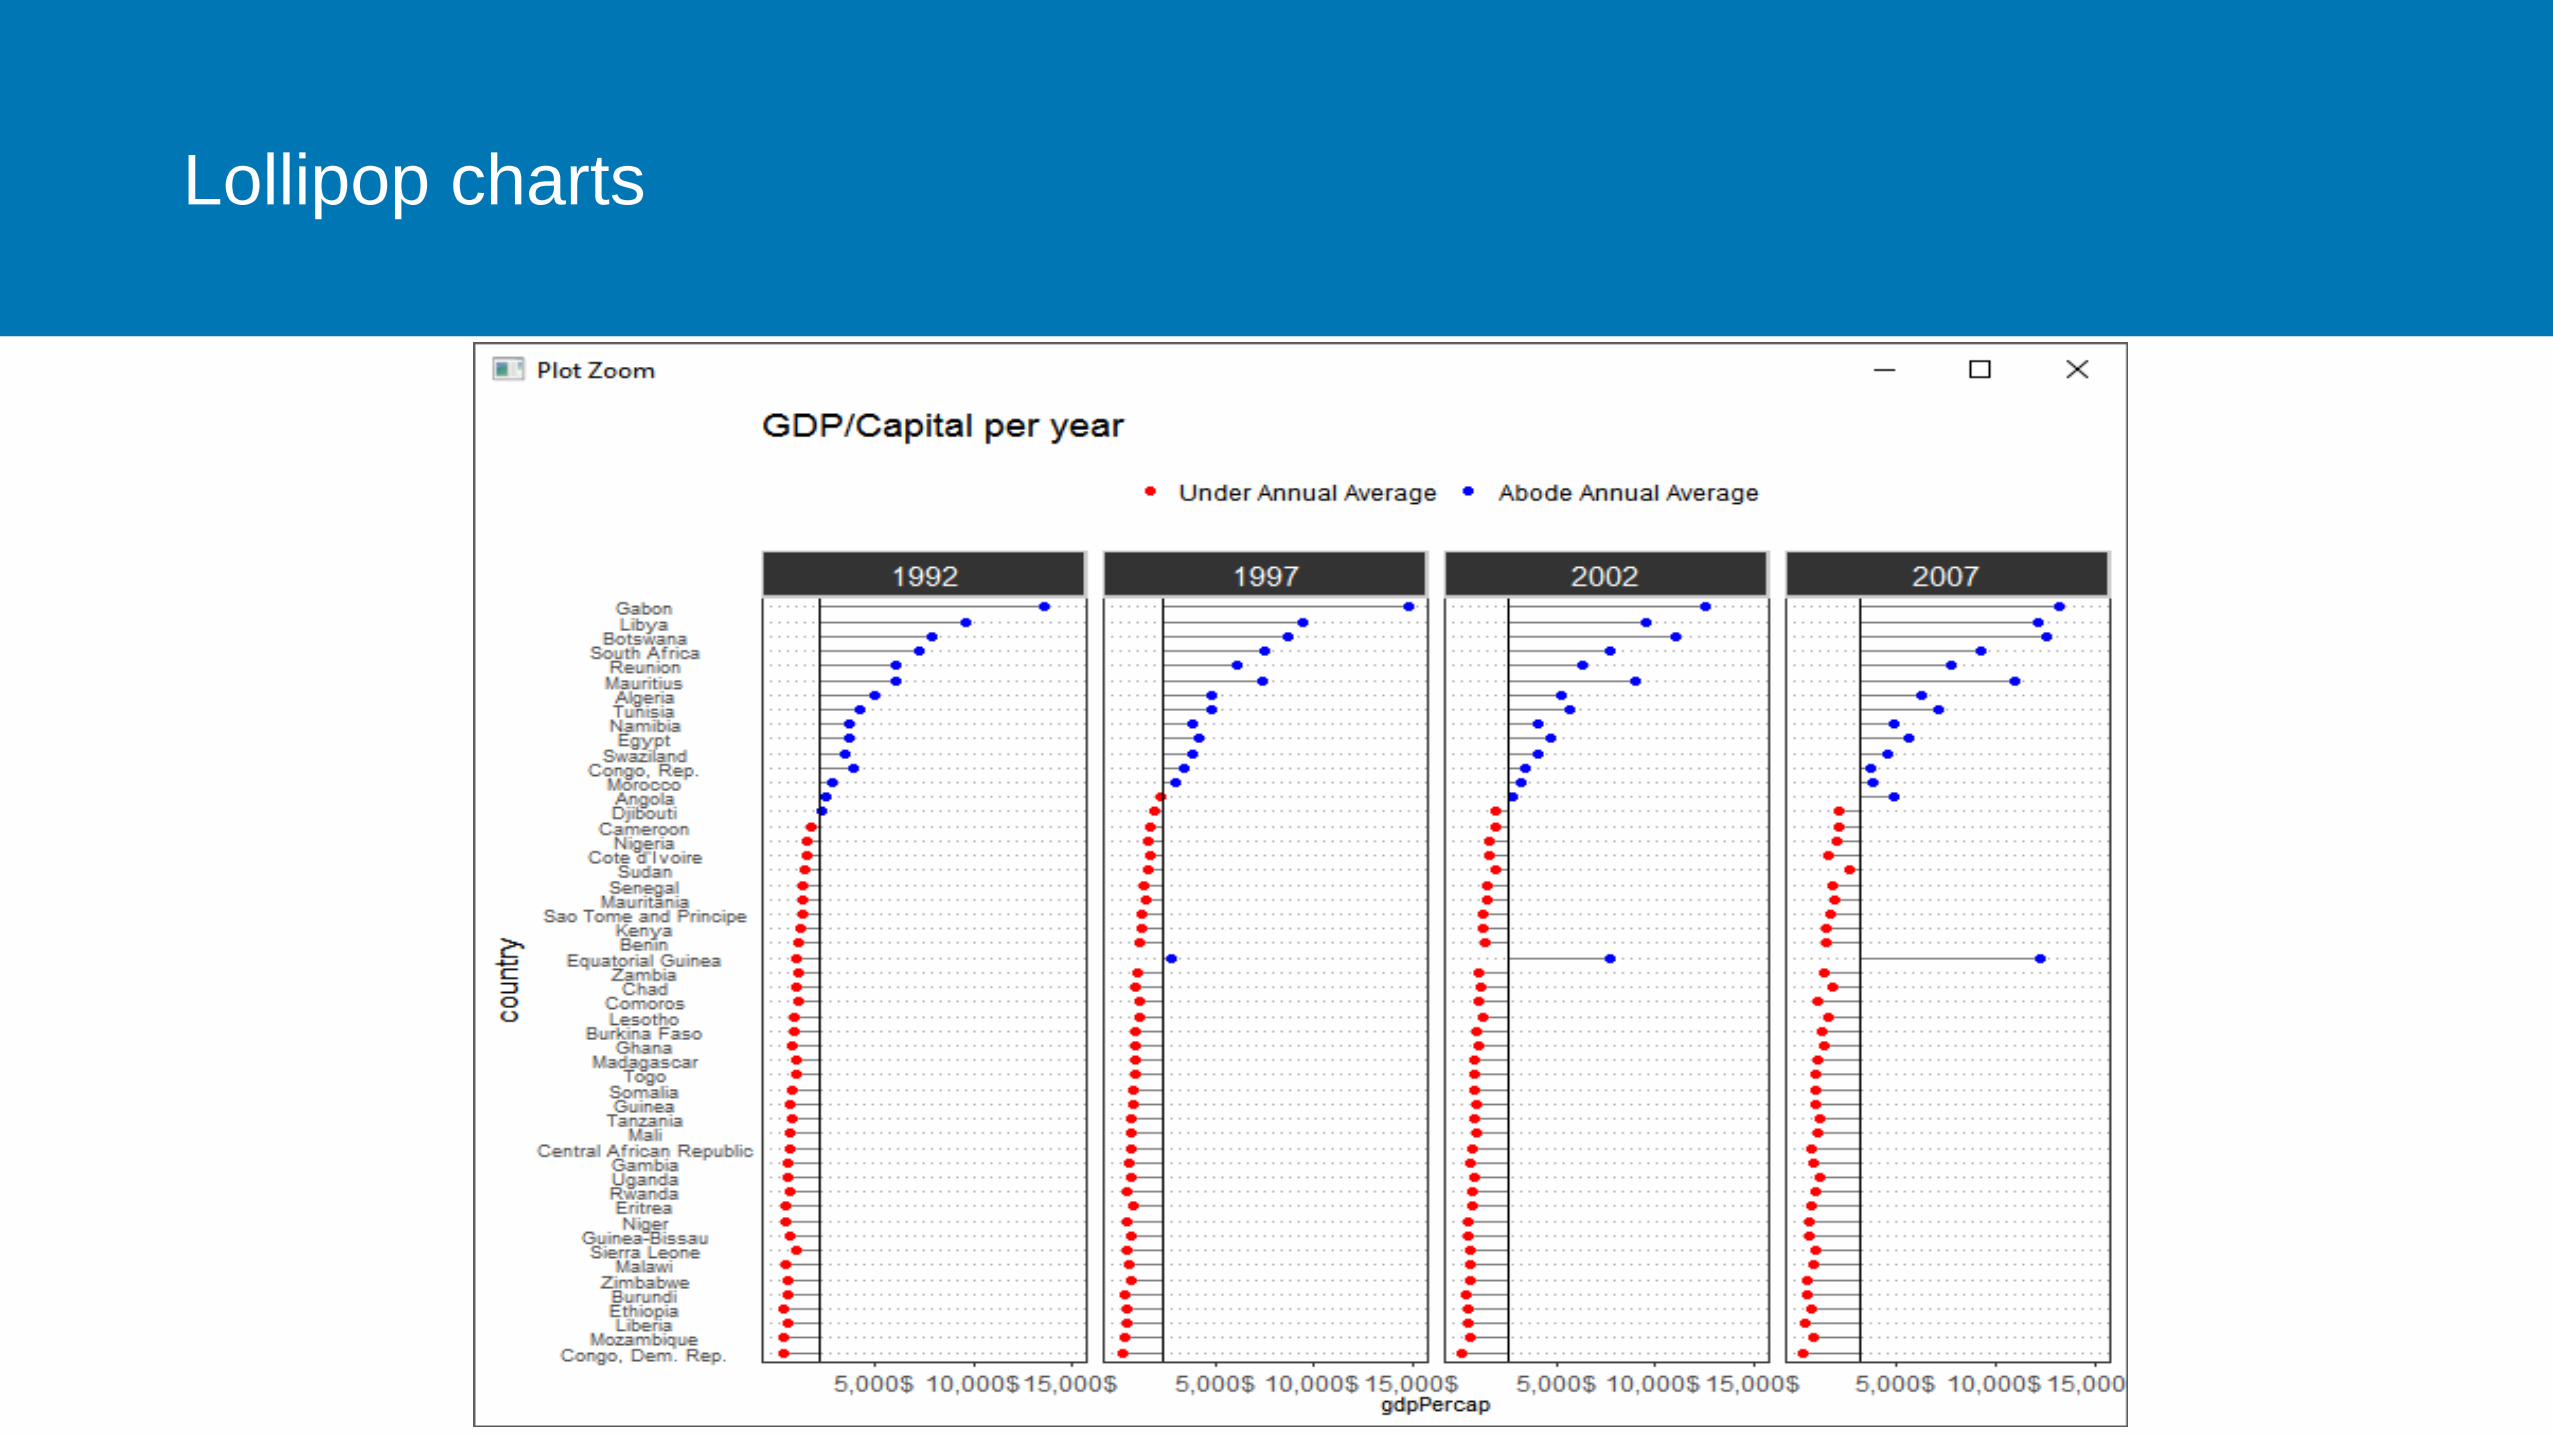
Lollipop charts

Sunflowers charts

Stripchart (Jitters chart)

Vectors charts
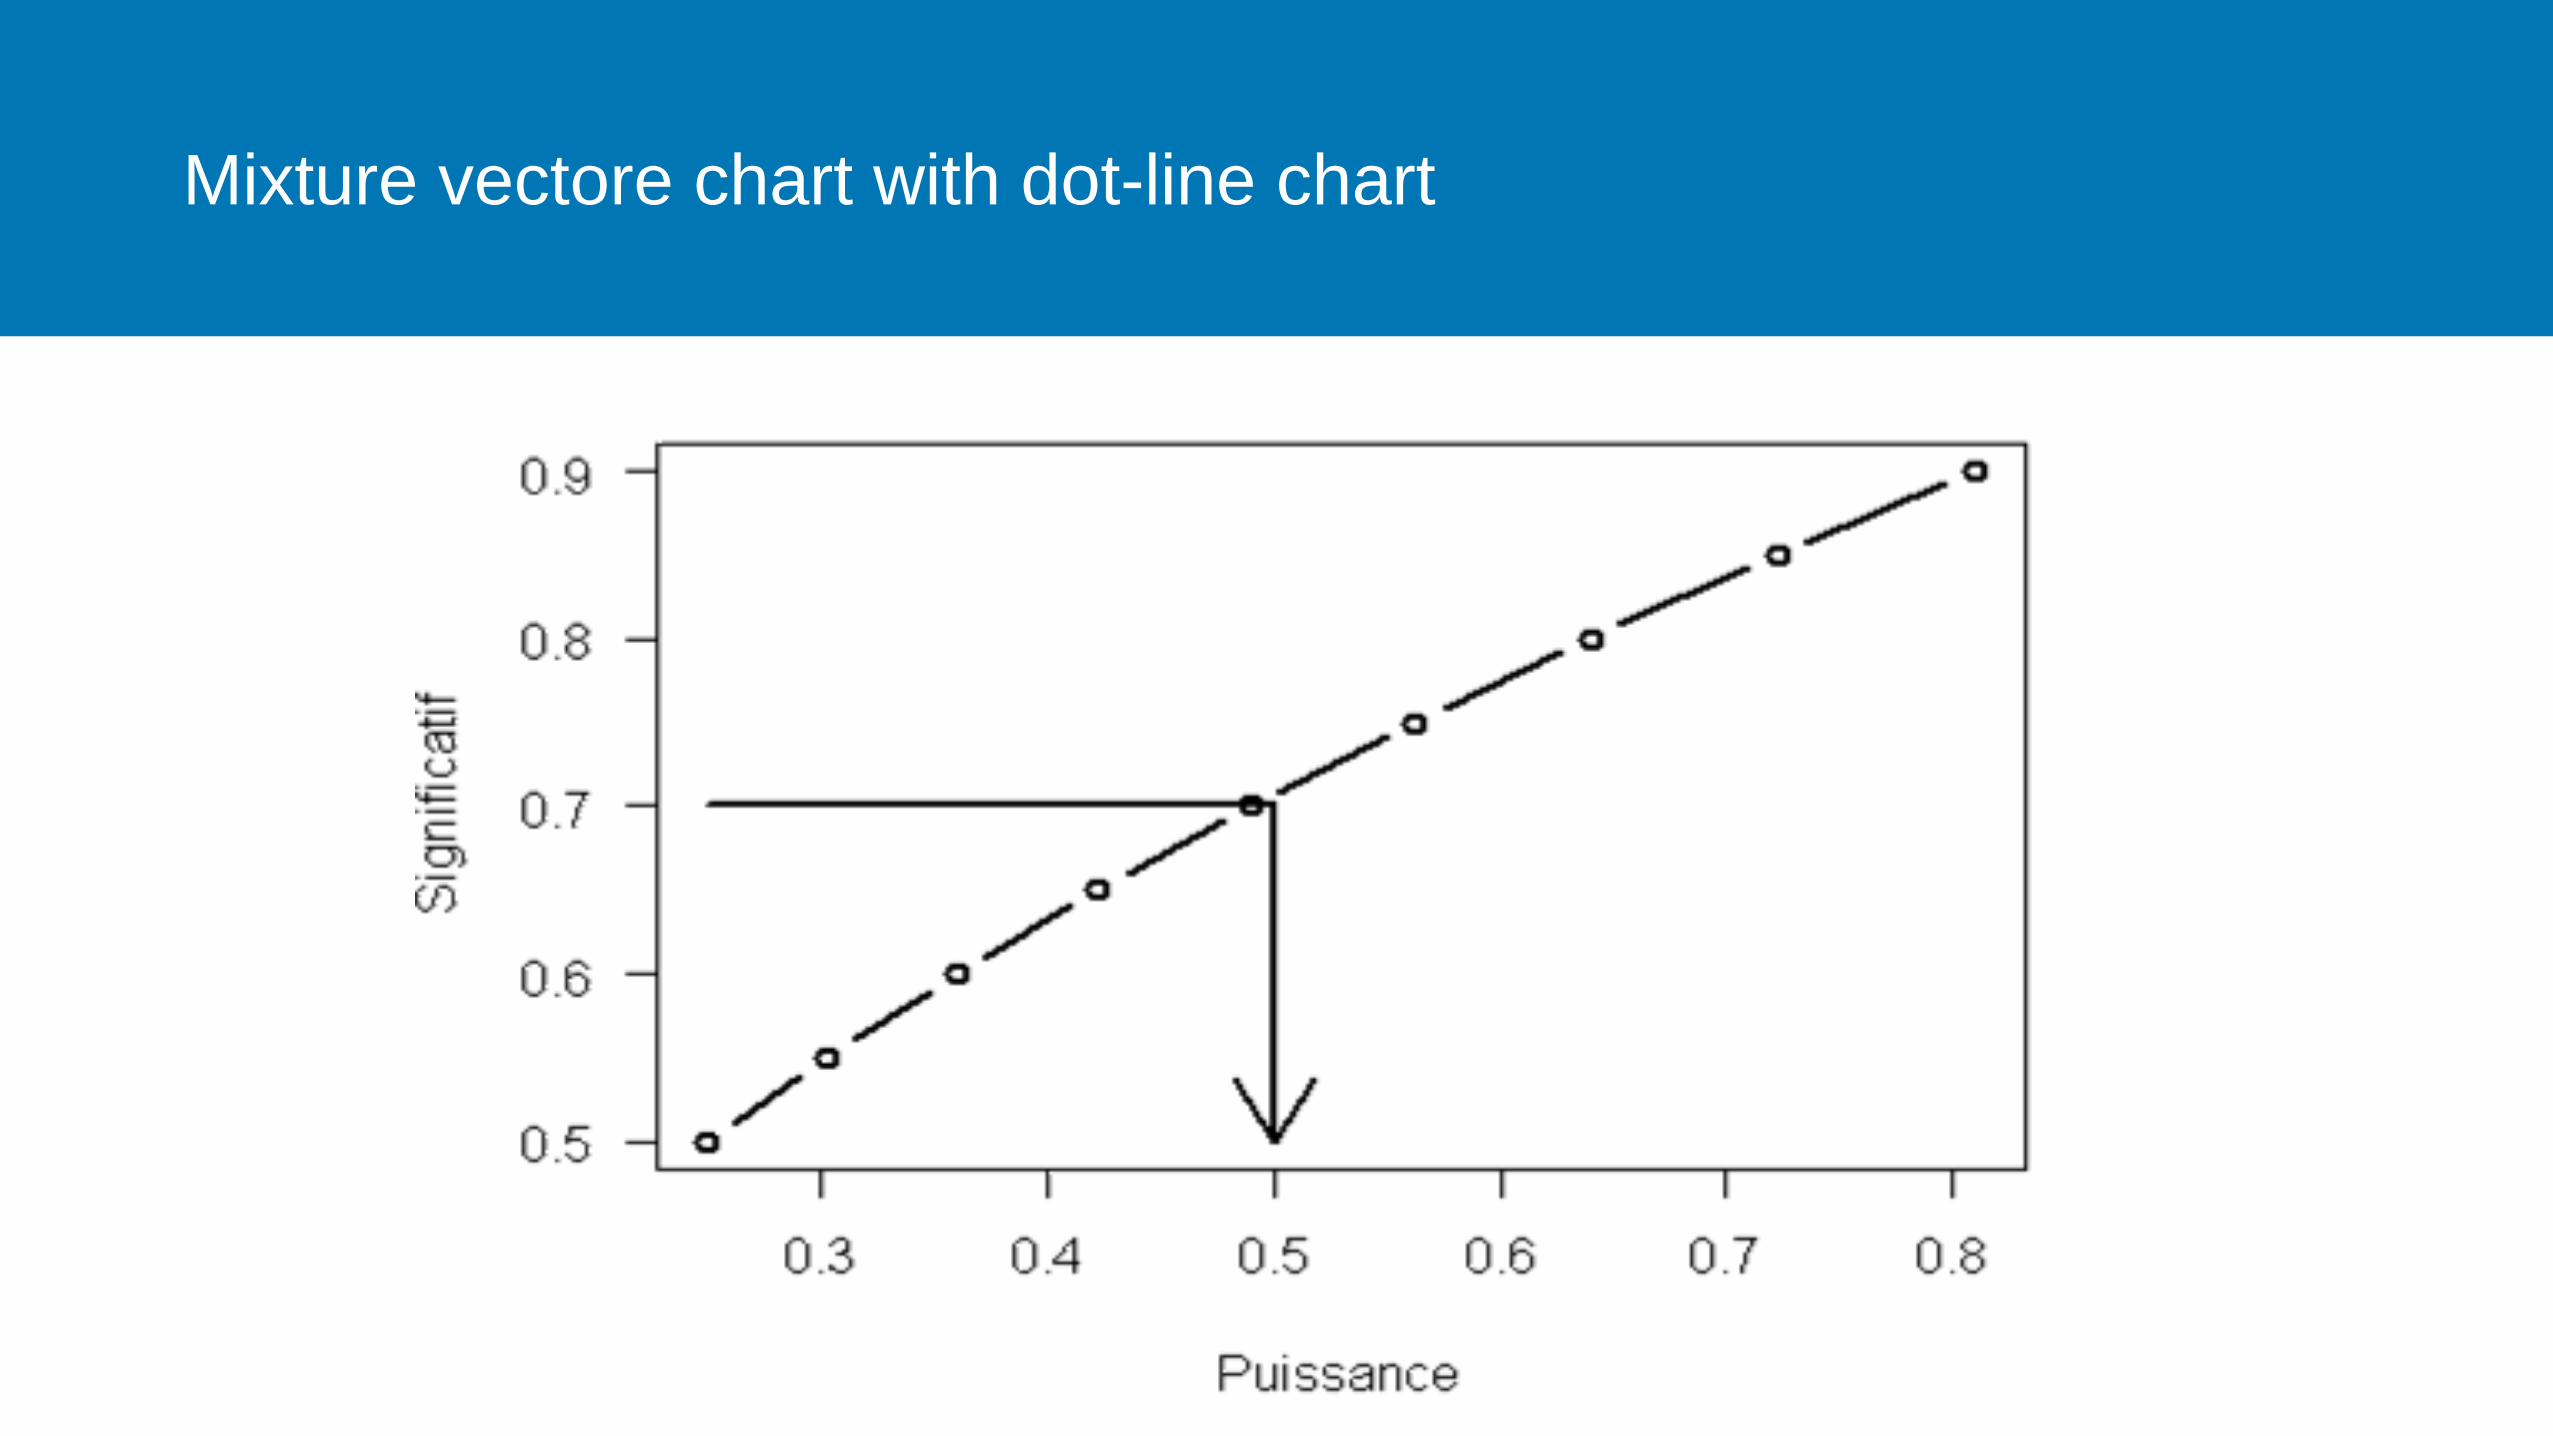
Mixture vectore chart with dot-line chart

Bar Charts
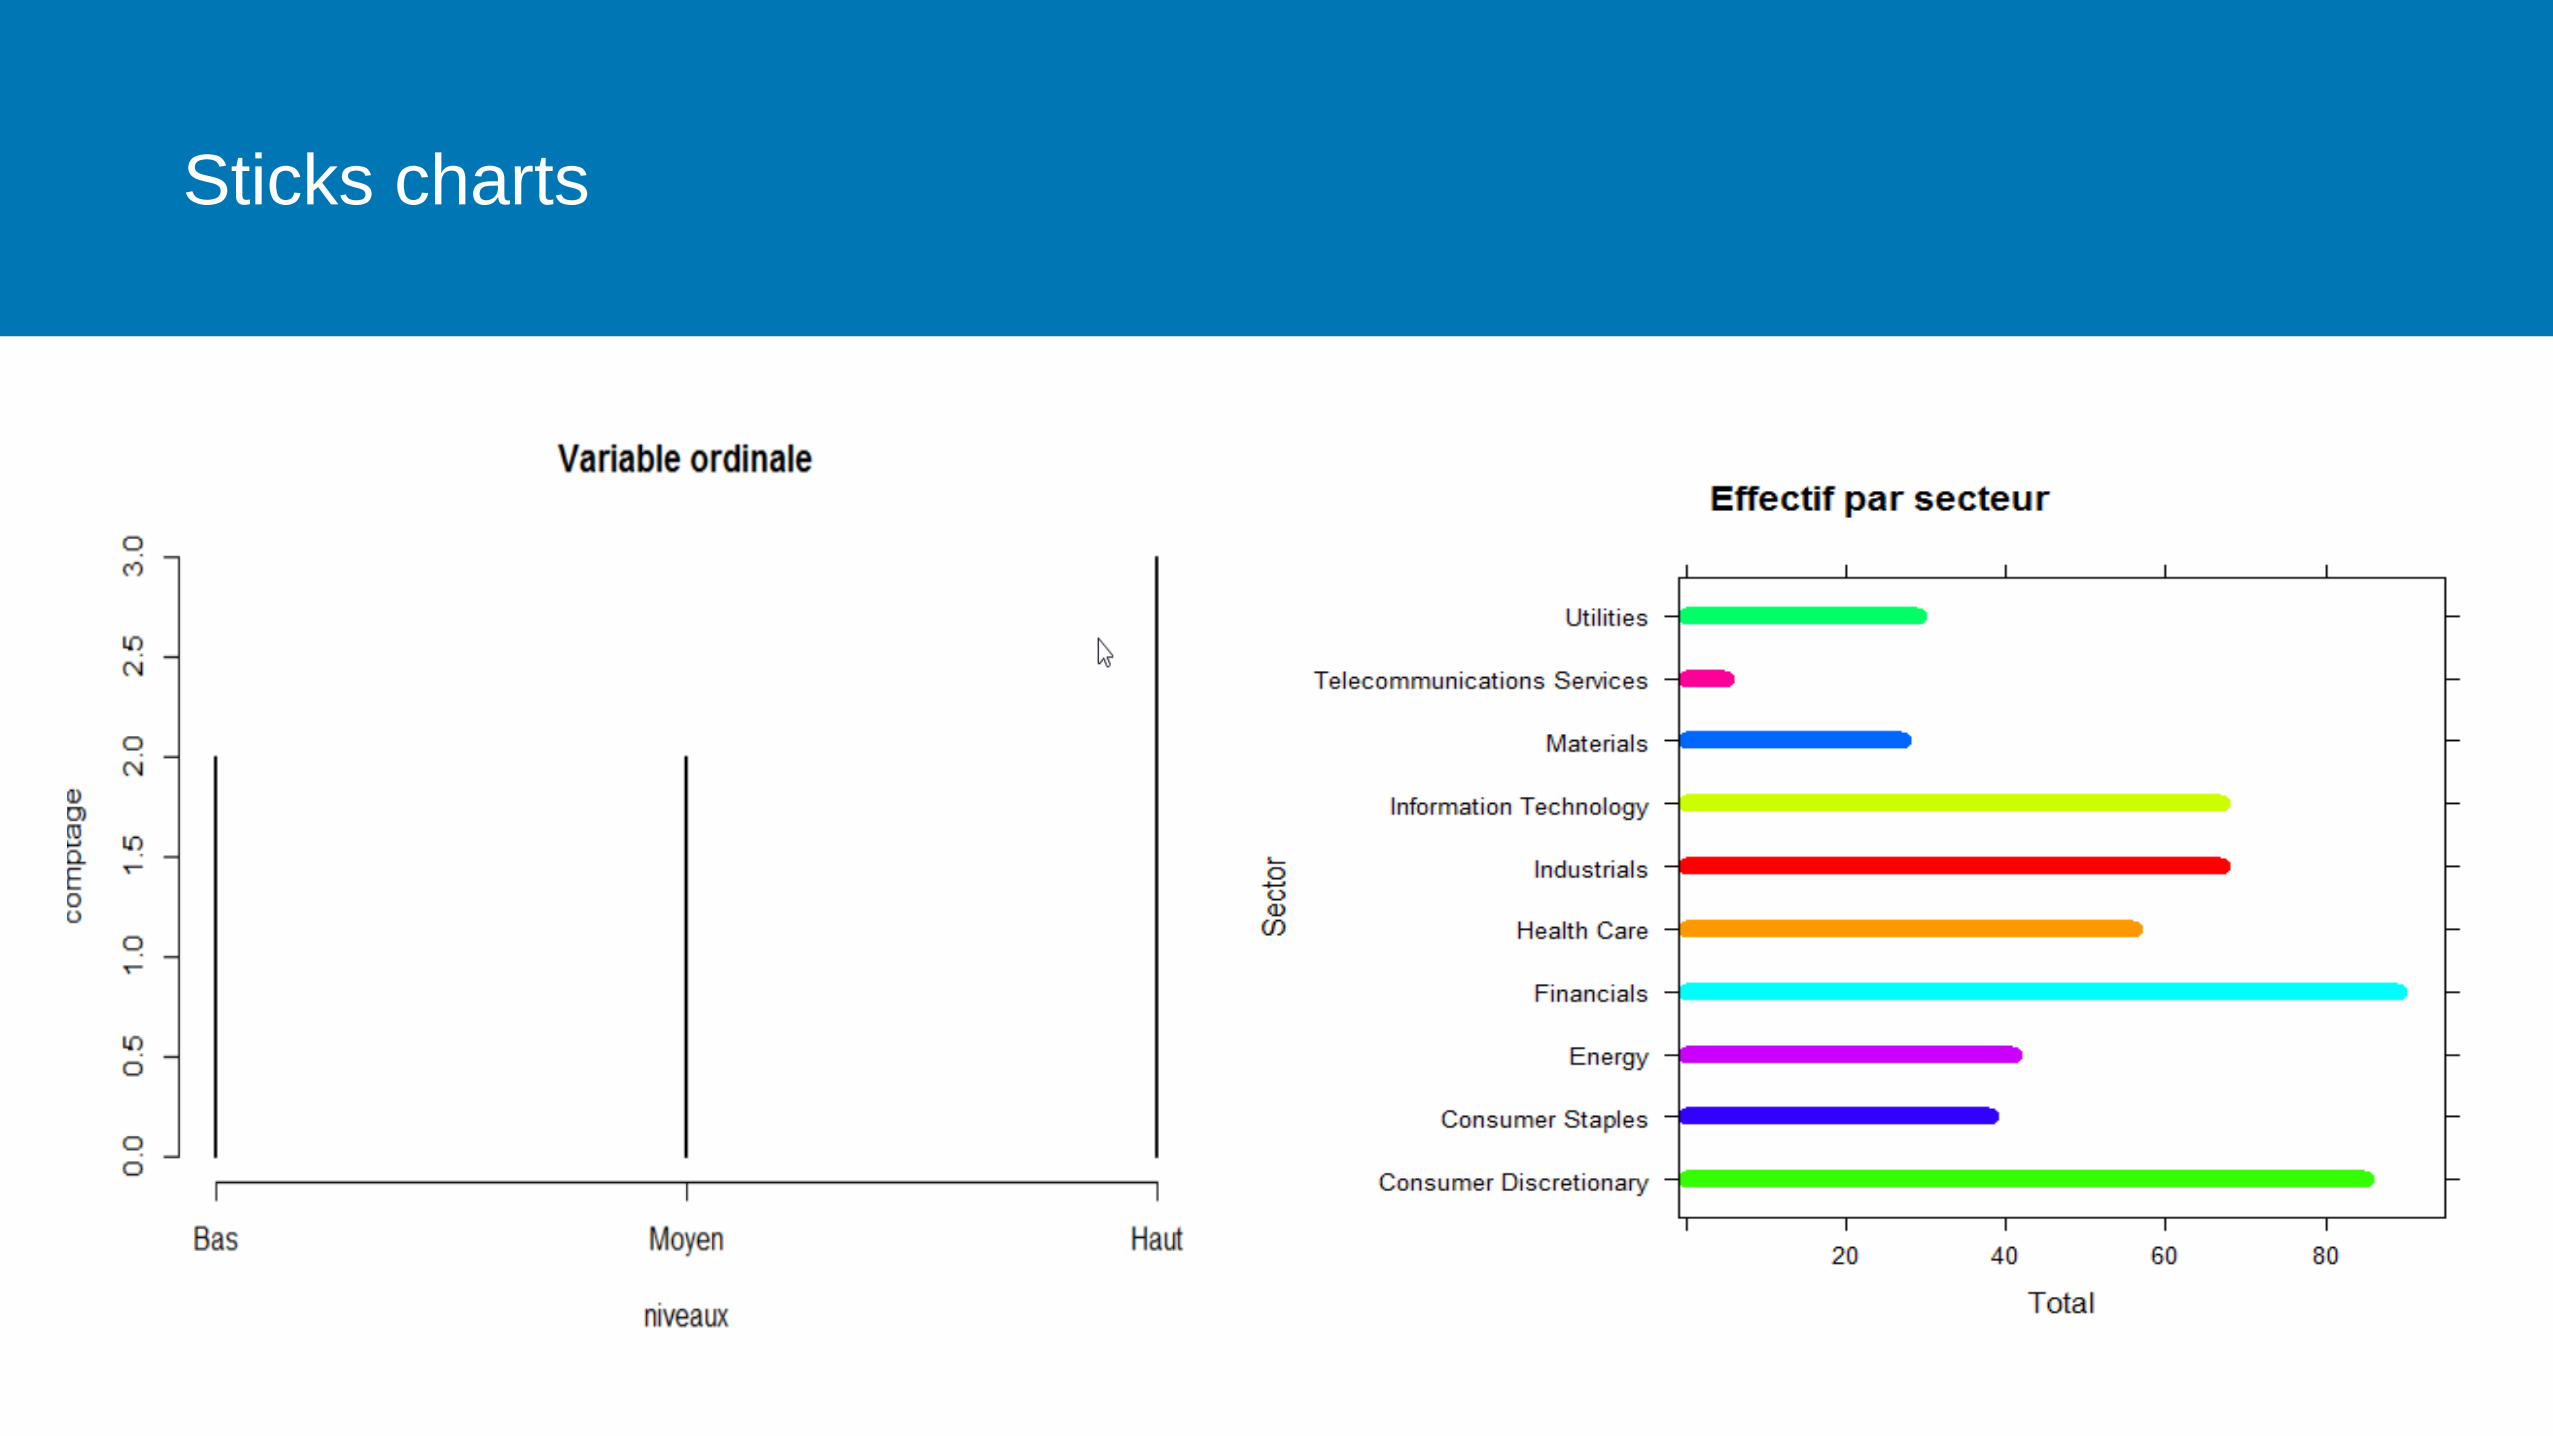
Sticks charts
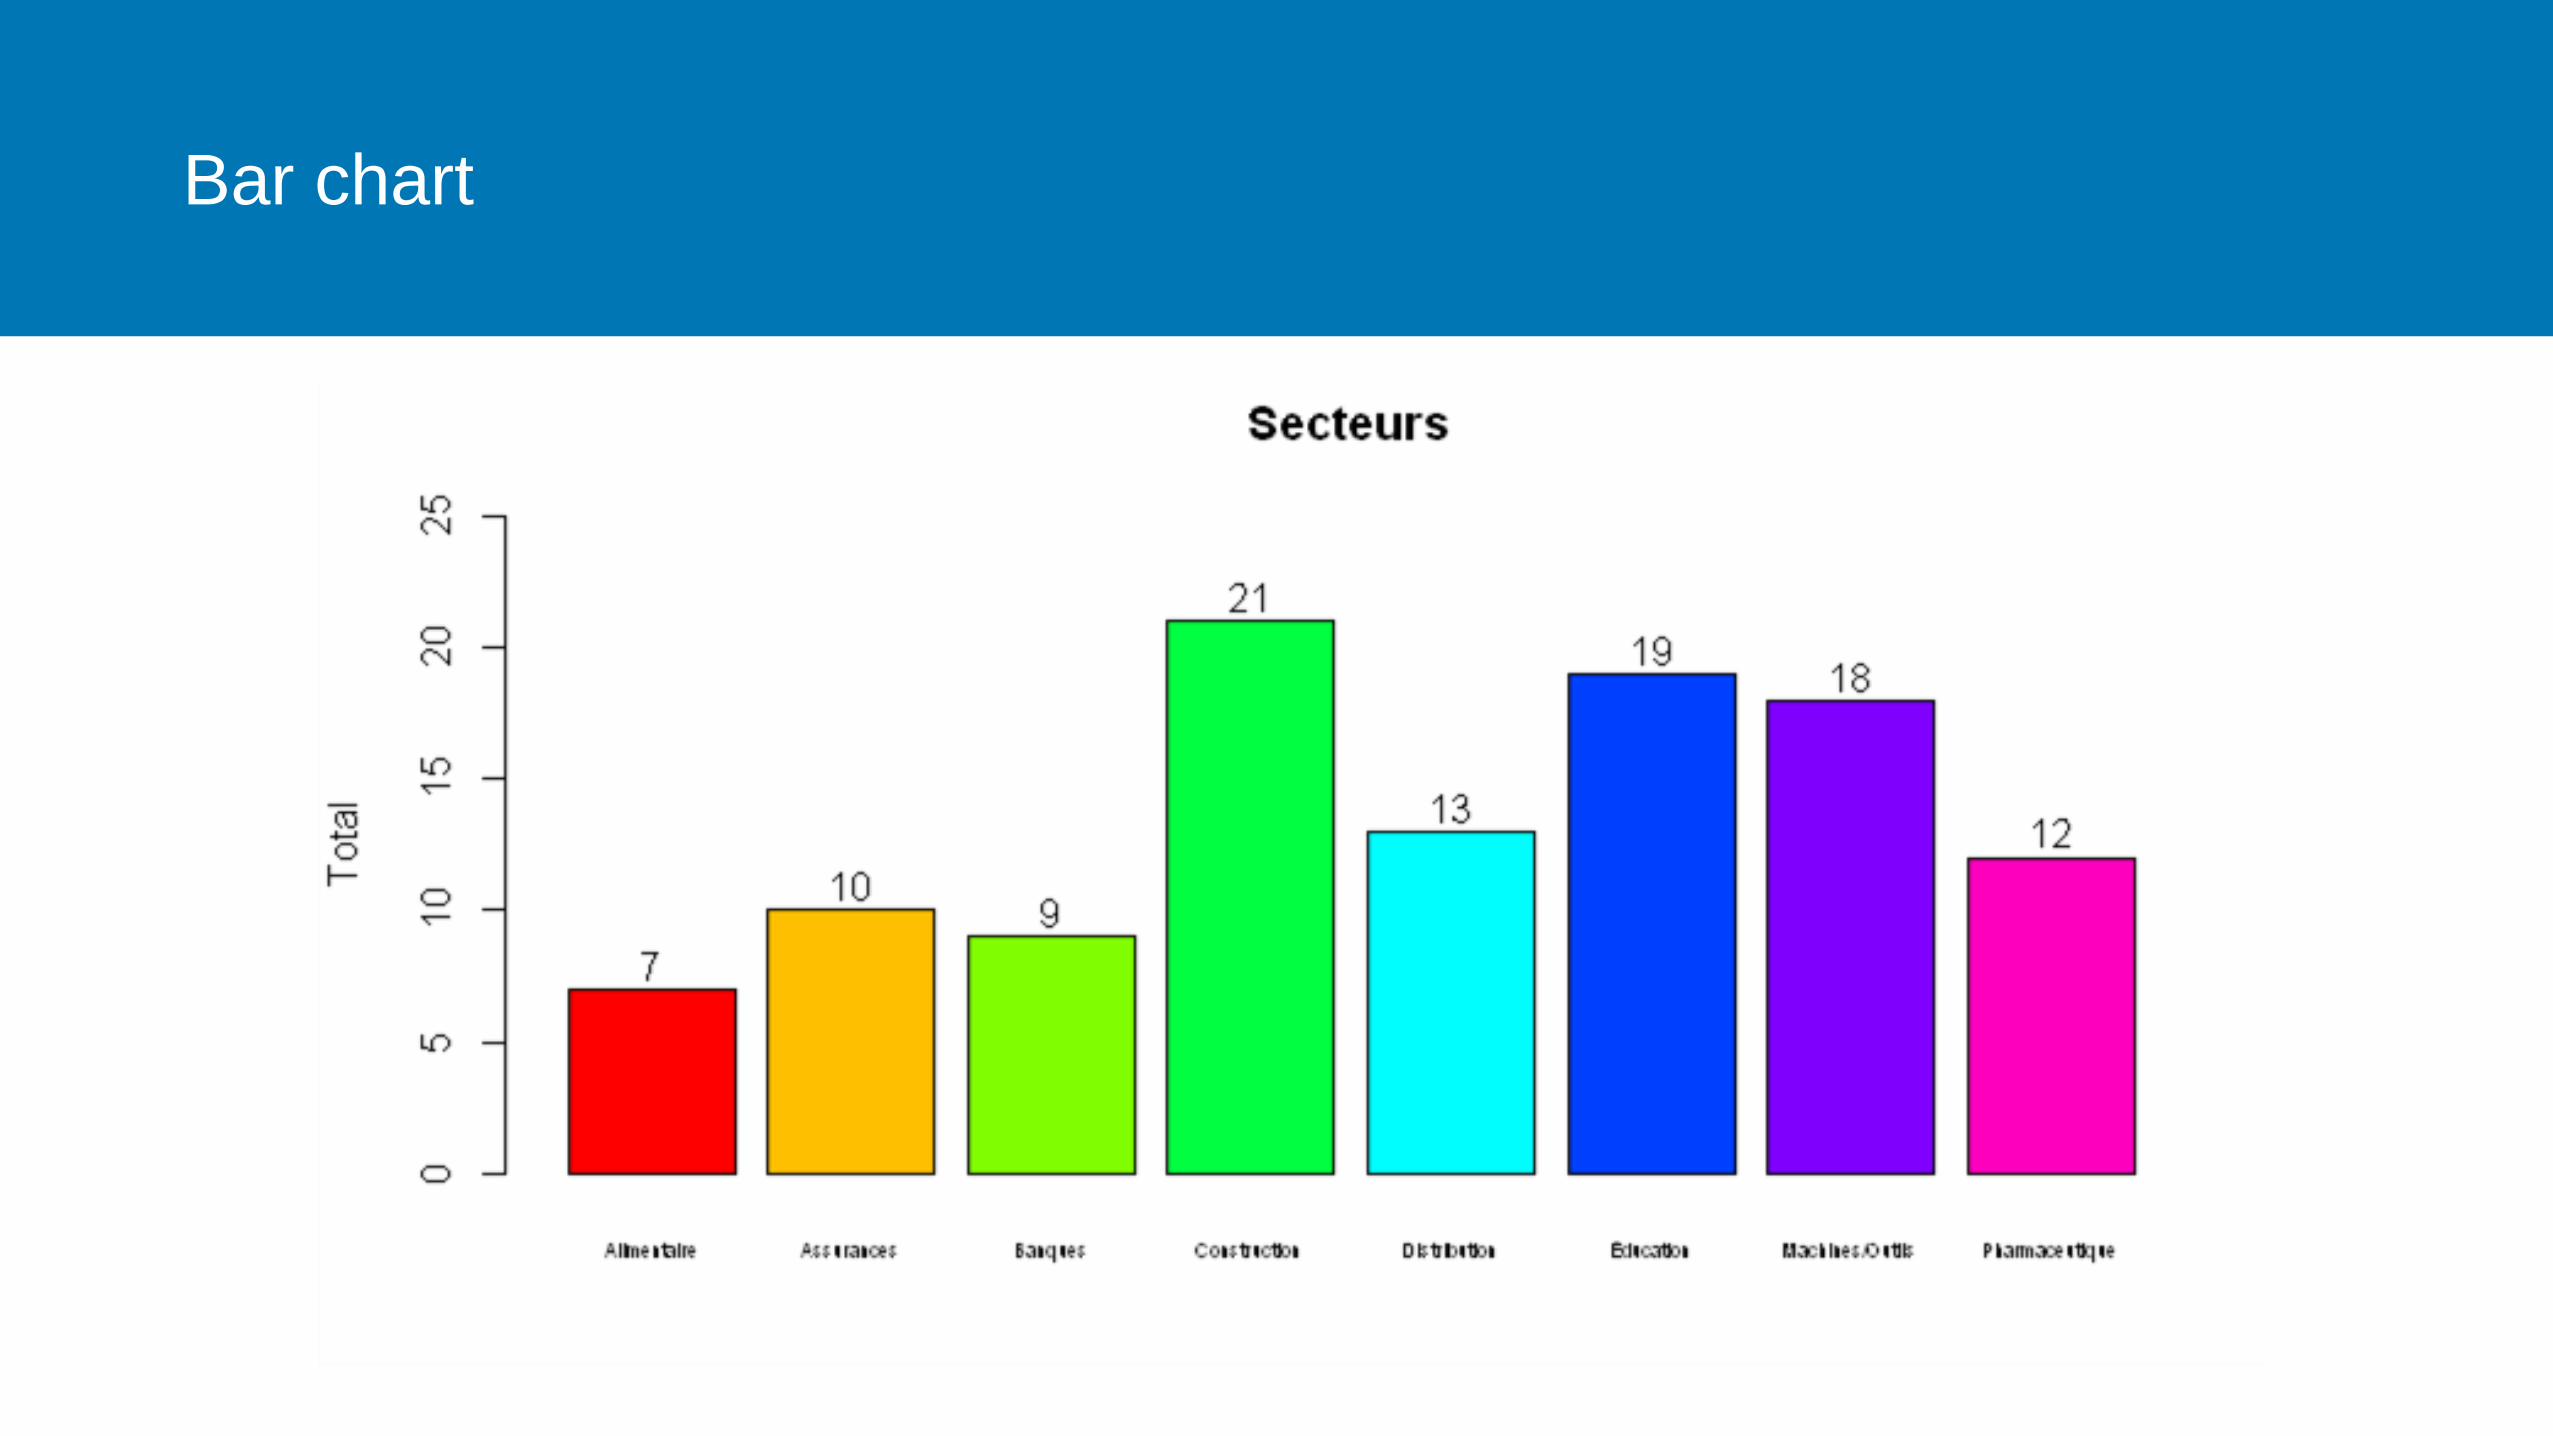
Bar chart

Bar chart with error bars
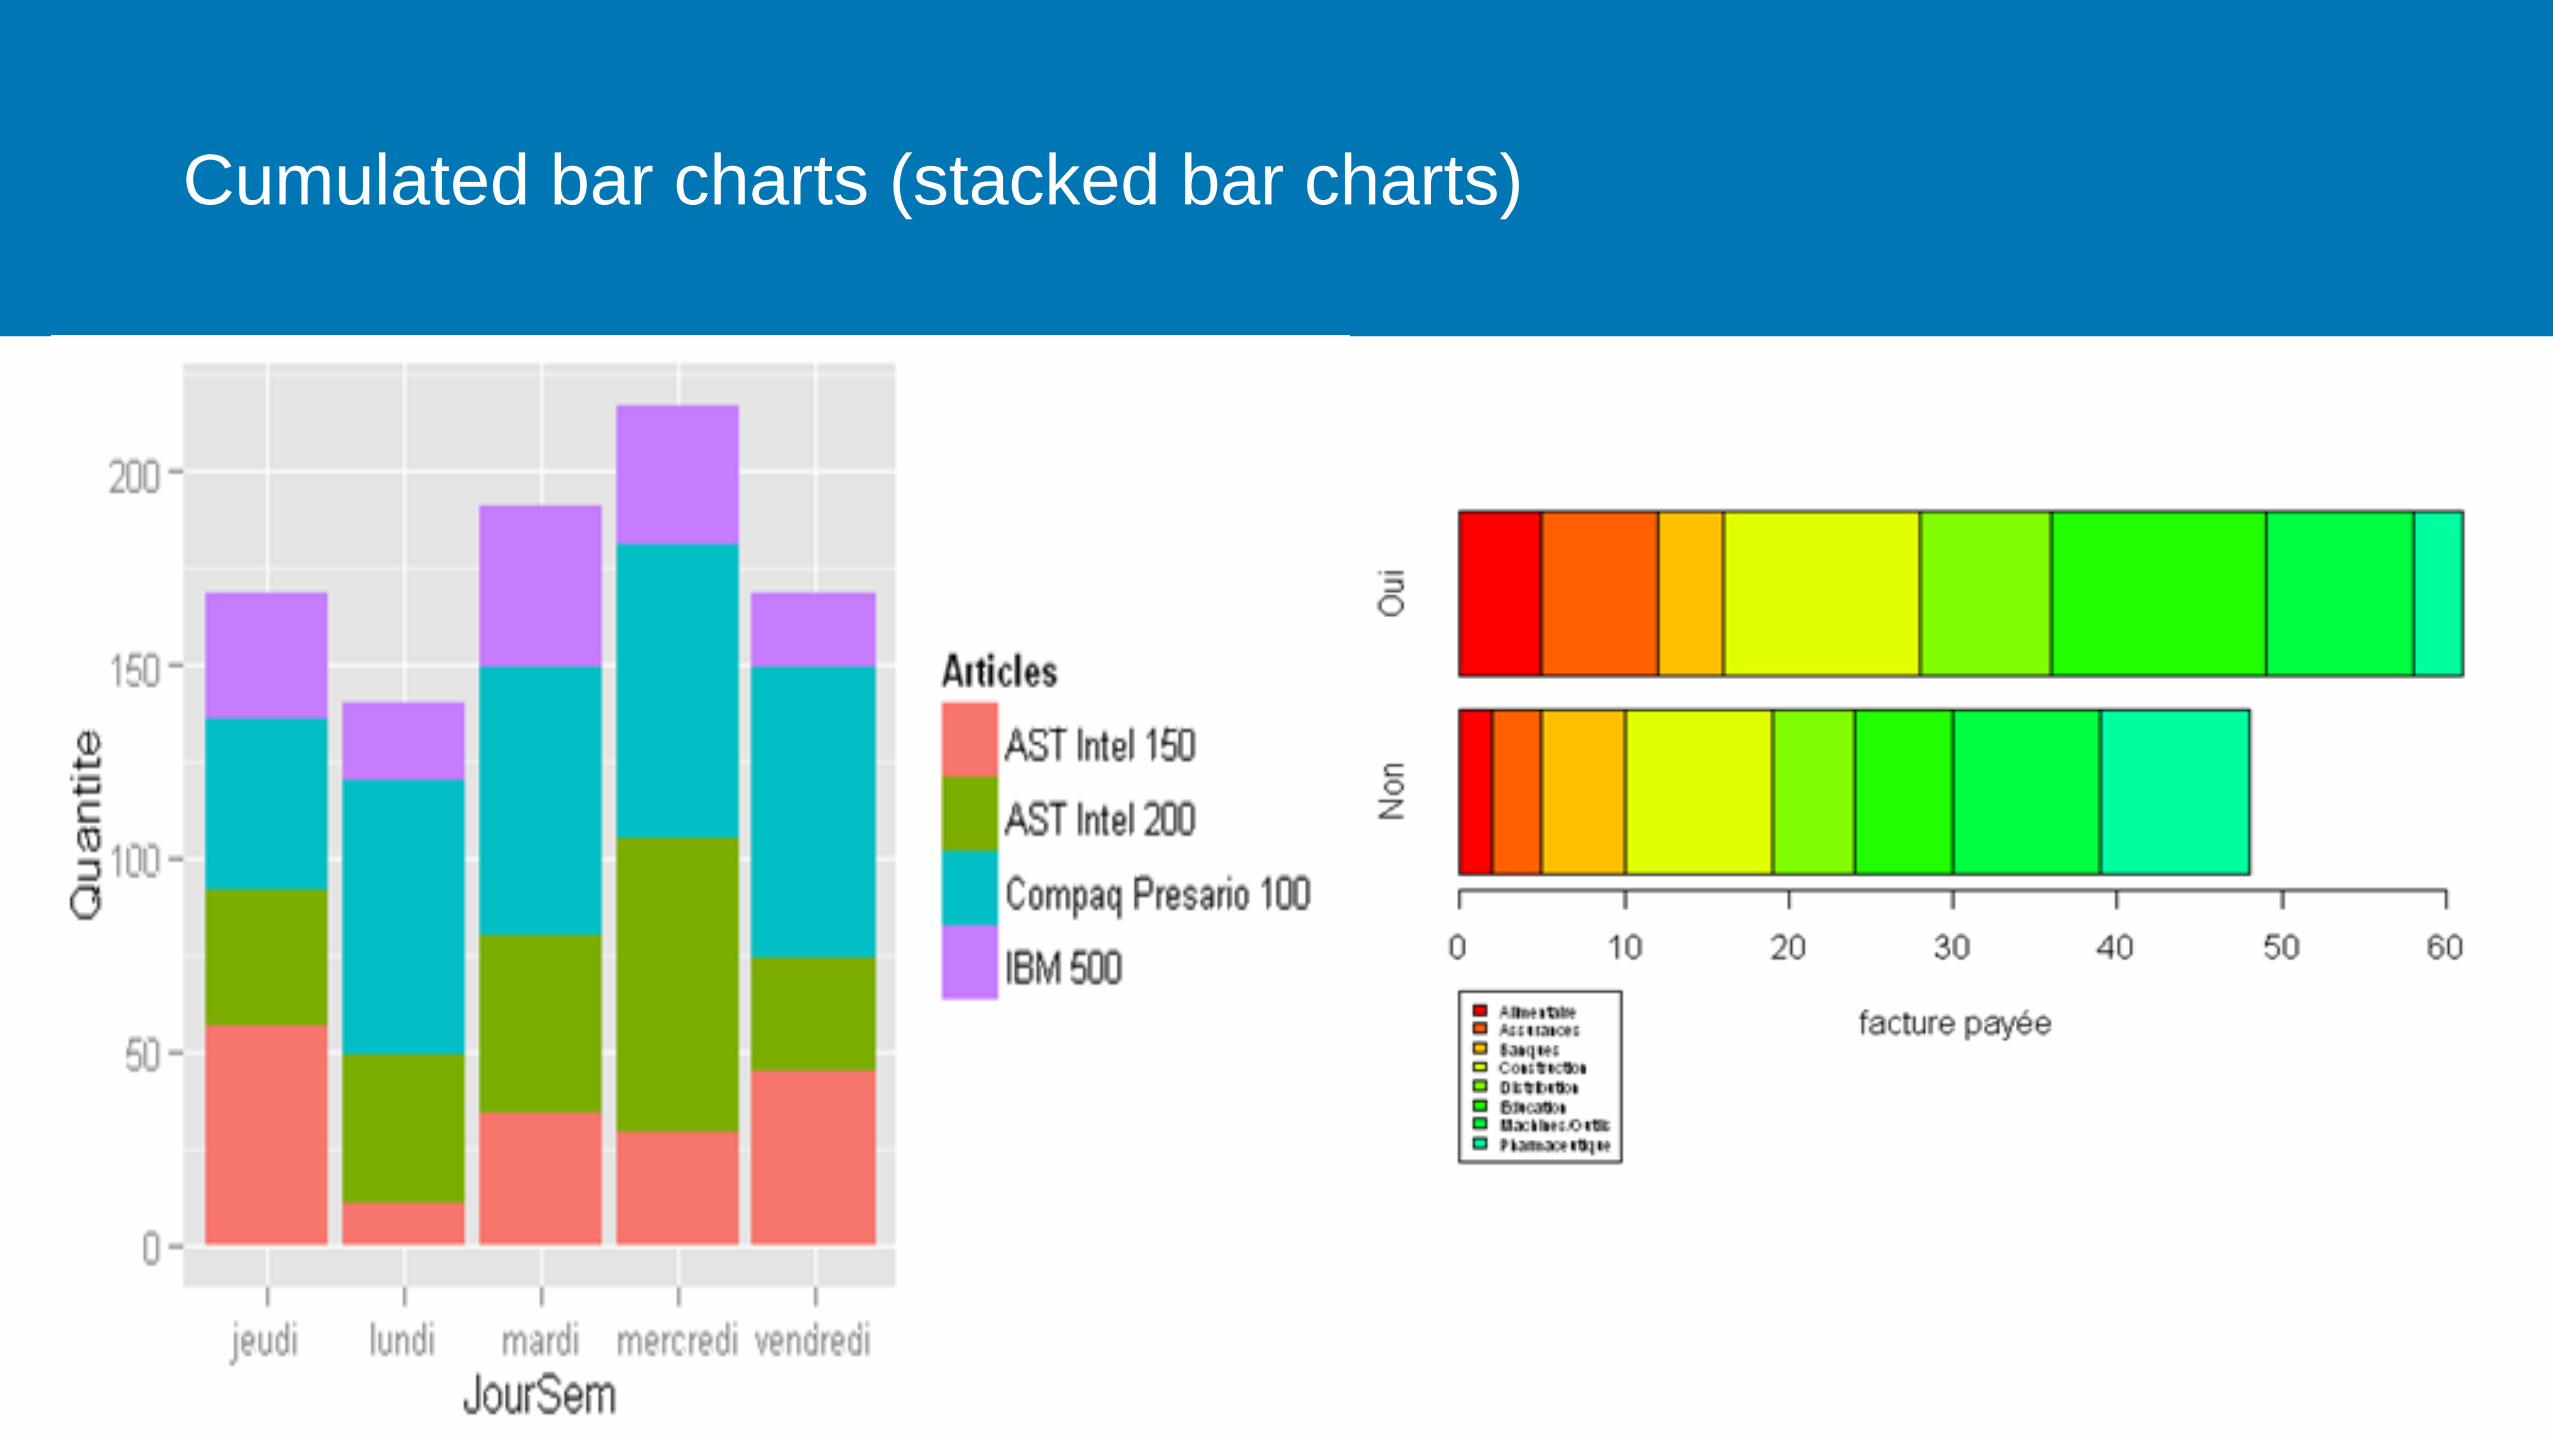
Cumulated bar charts (stacked bar charts)

Grouped bar charts

Standardized bar chart (normalized bar chart)

Back to back bar charts

Histograms

Overlayed Histograms

Cascade chart

Tornado chart

Box & Whiskers charts
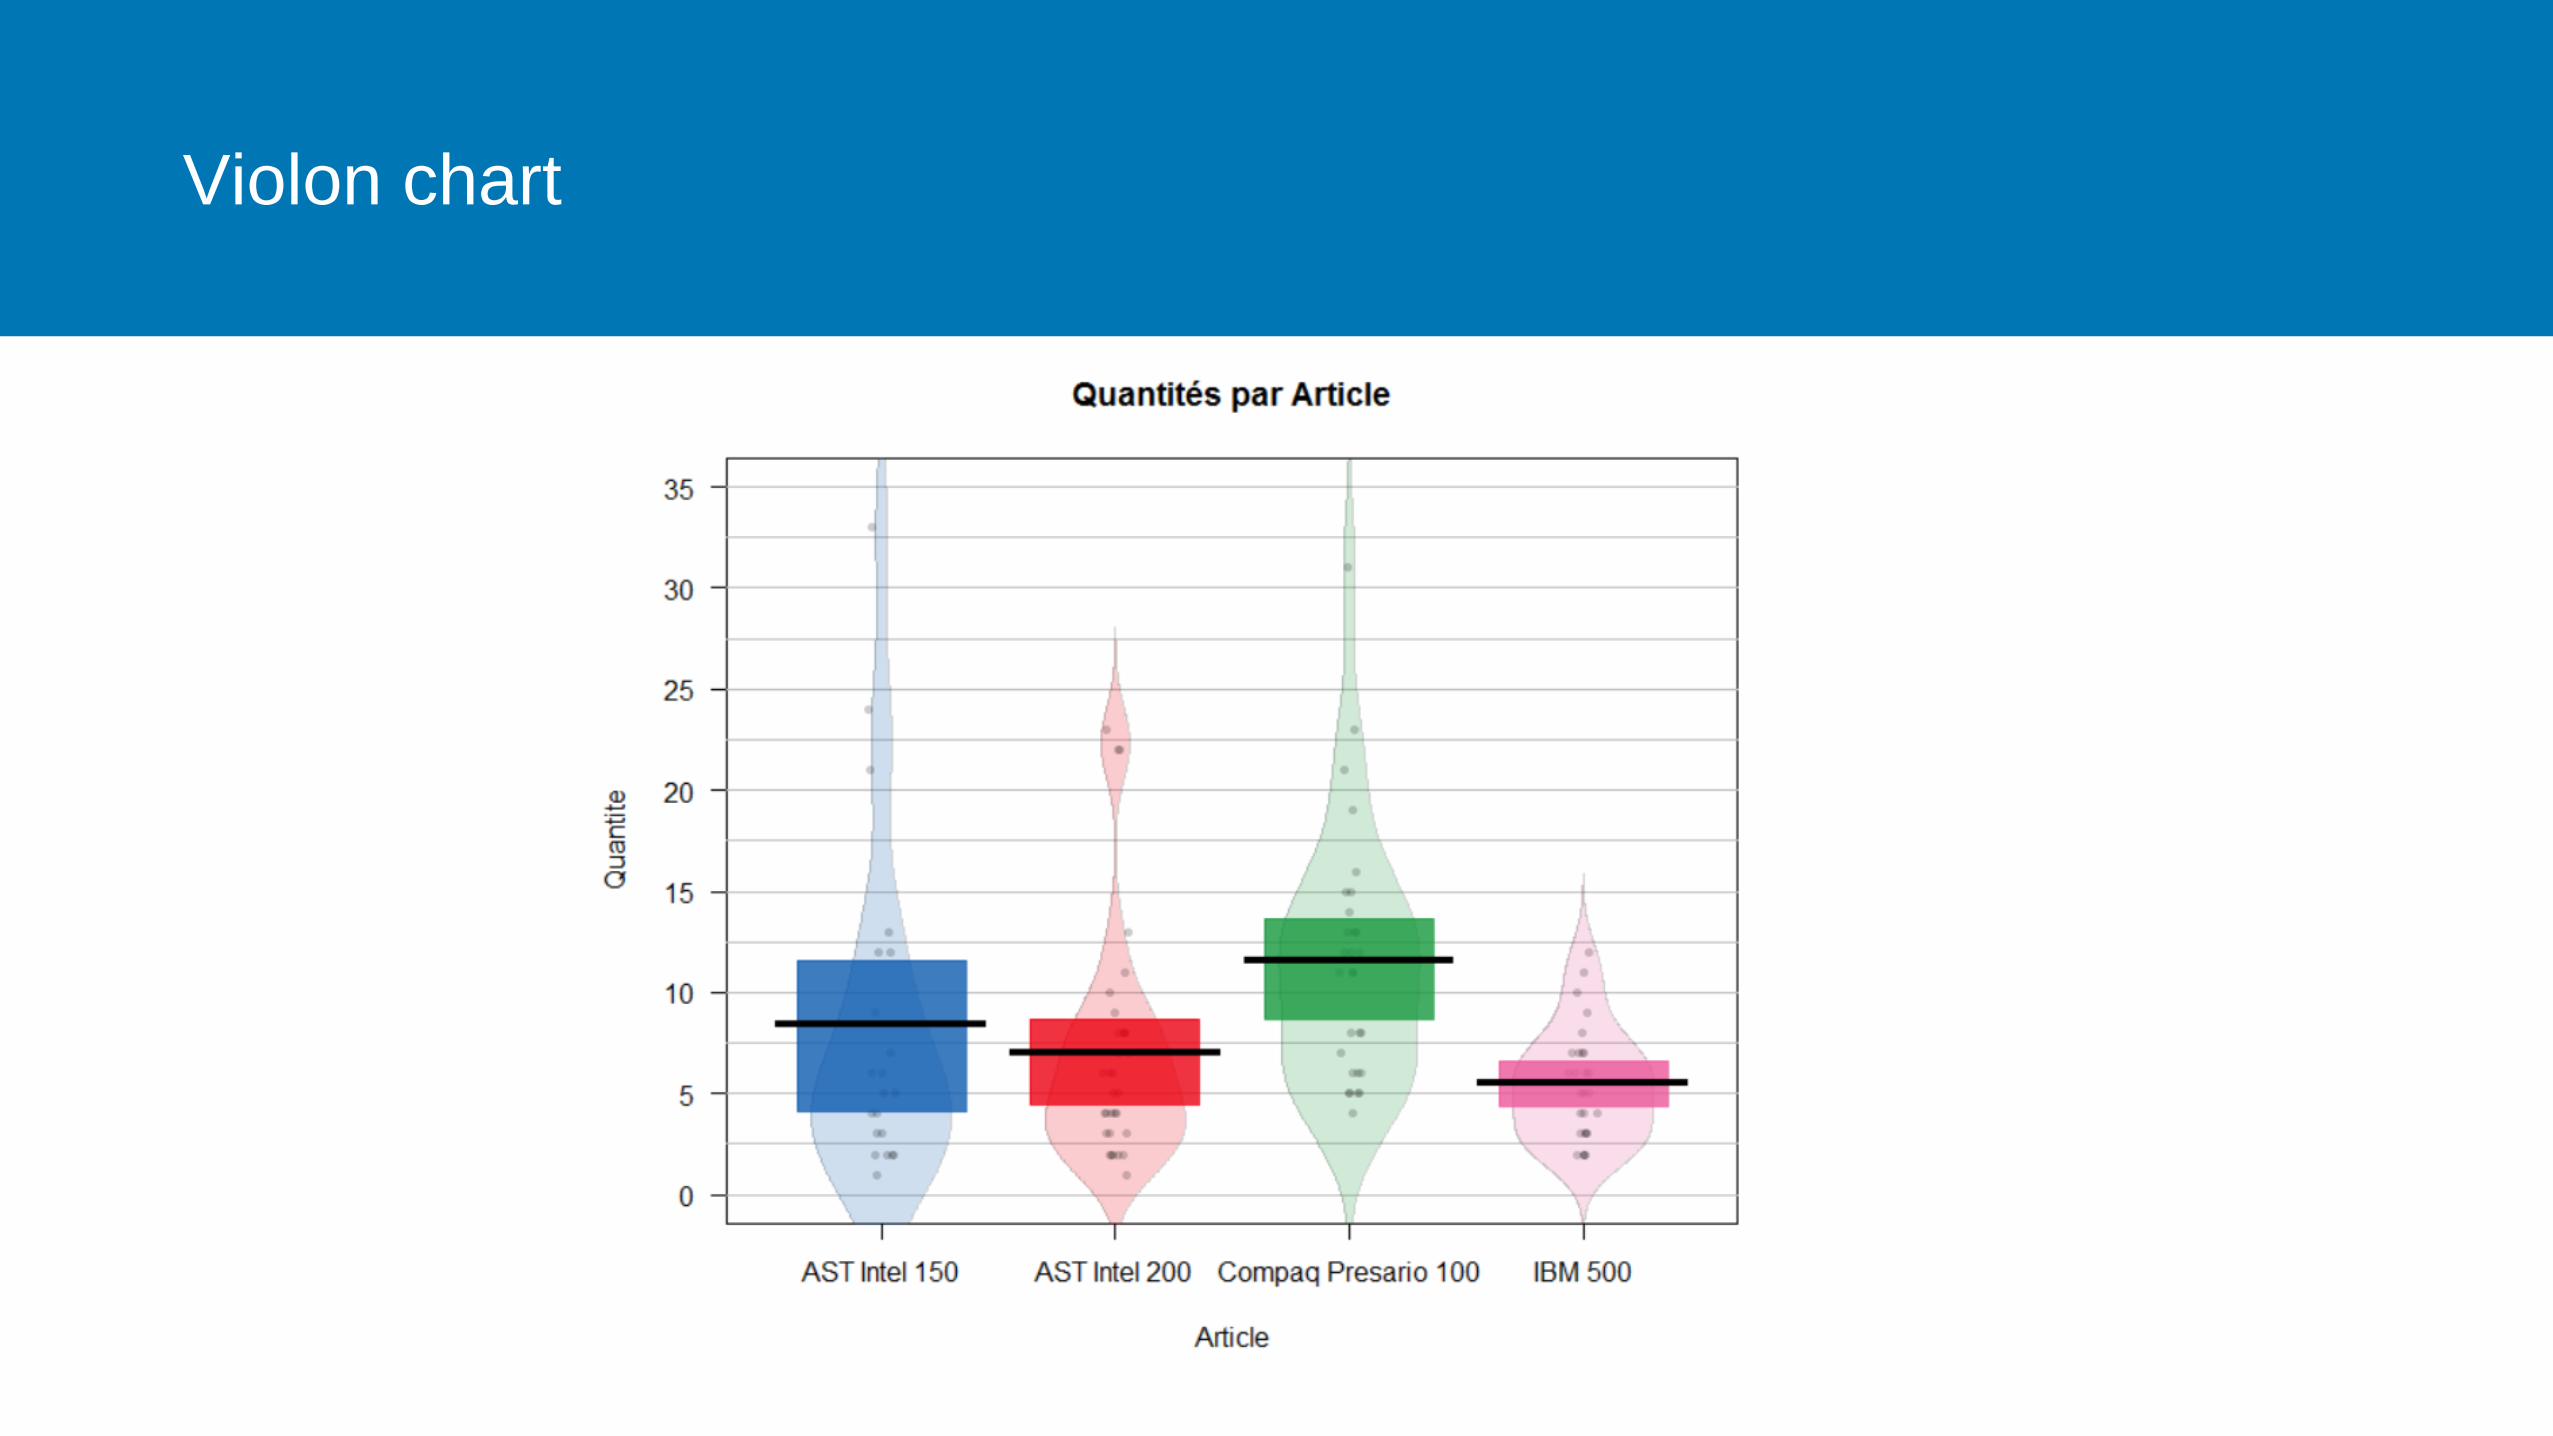
Violon chart

Pyramide chart

Association chart

Missing values charts

Polar Charts

Sector charts

Donuts charts

Bubble charts
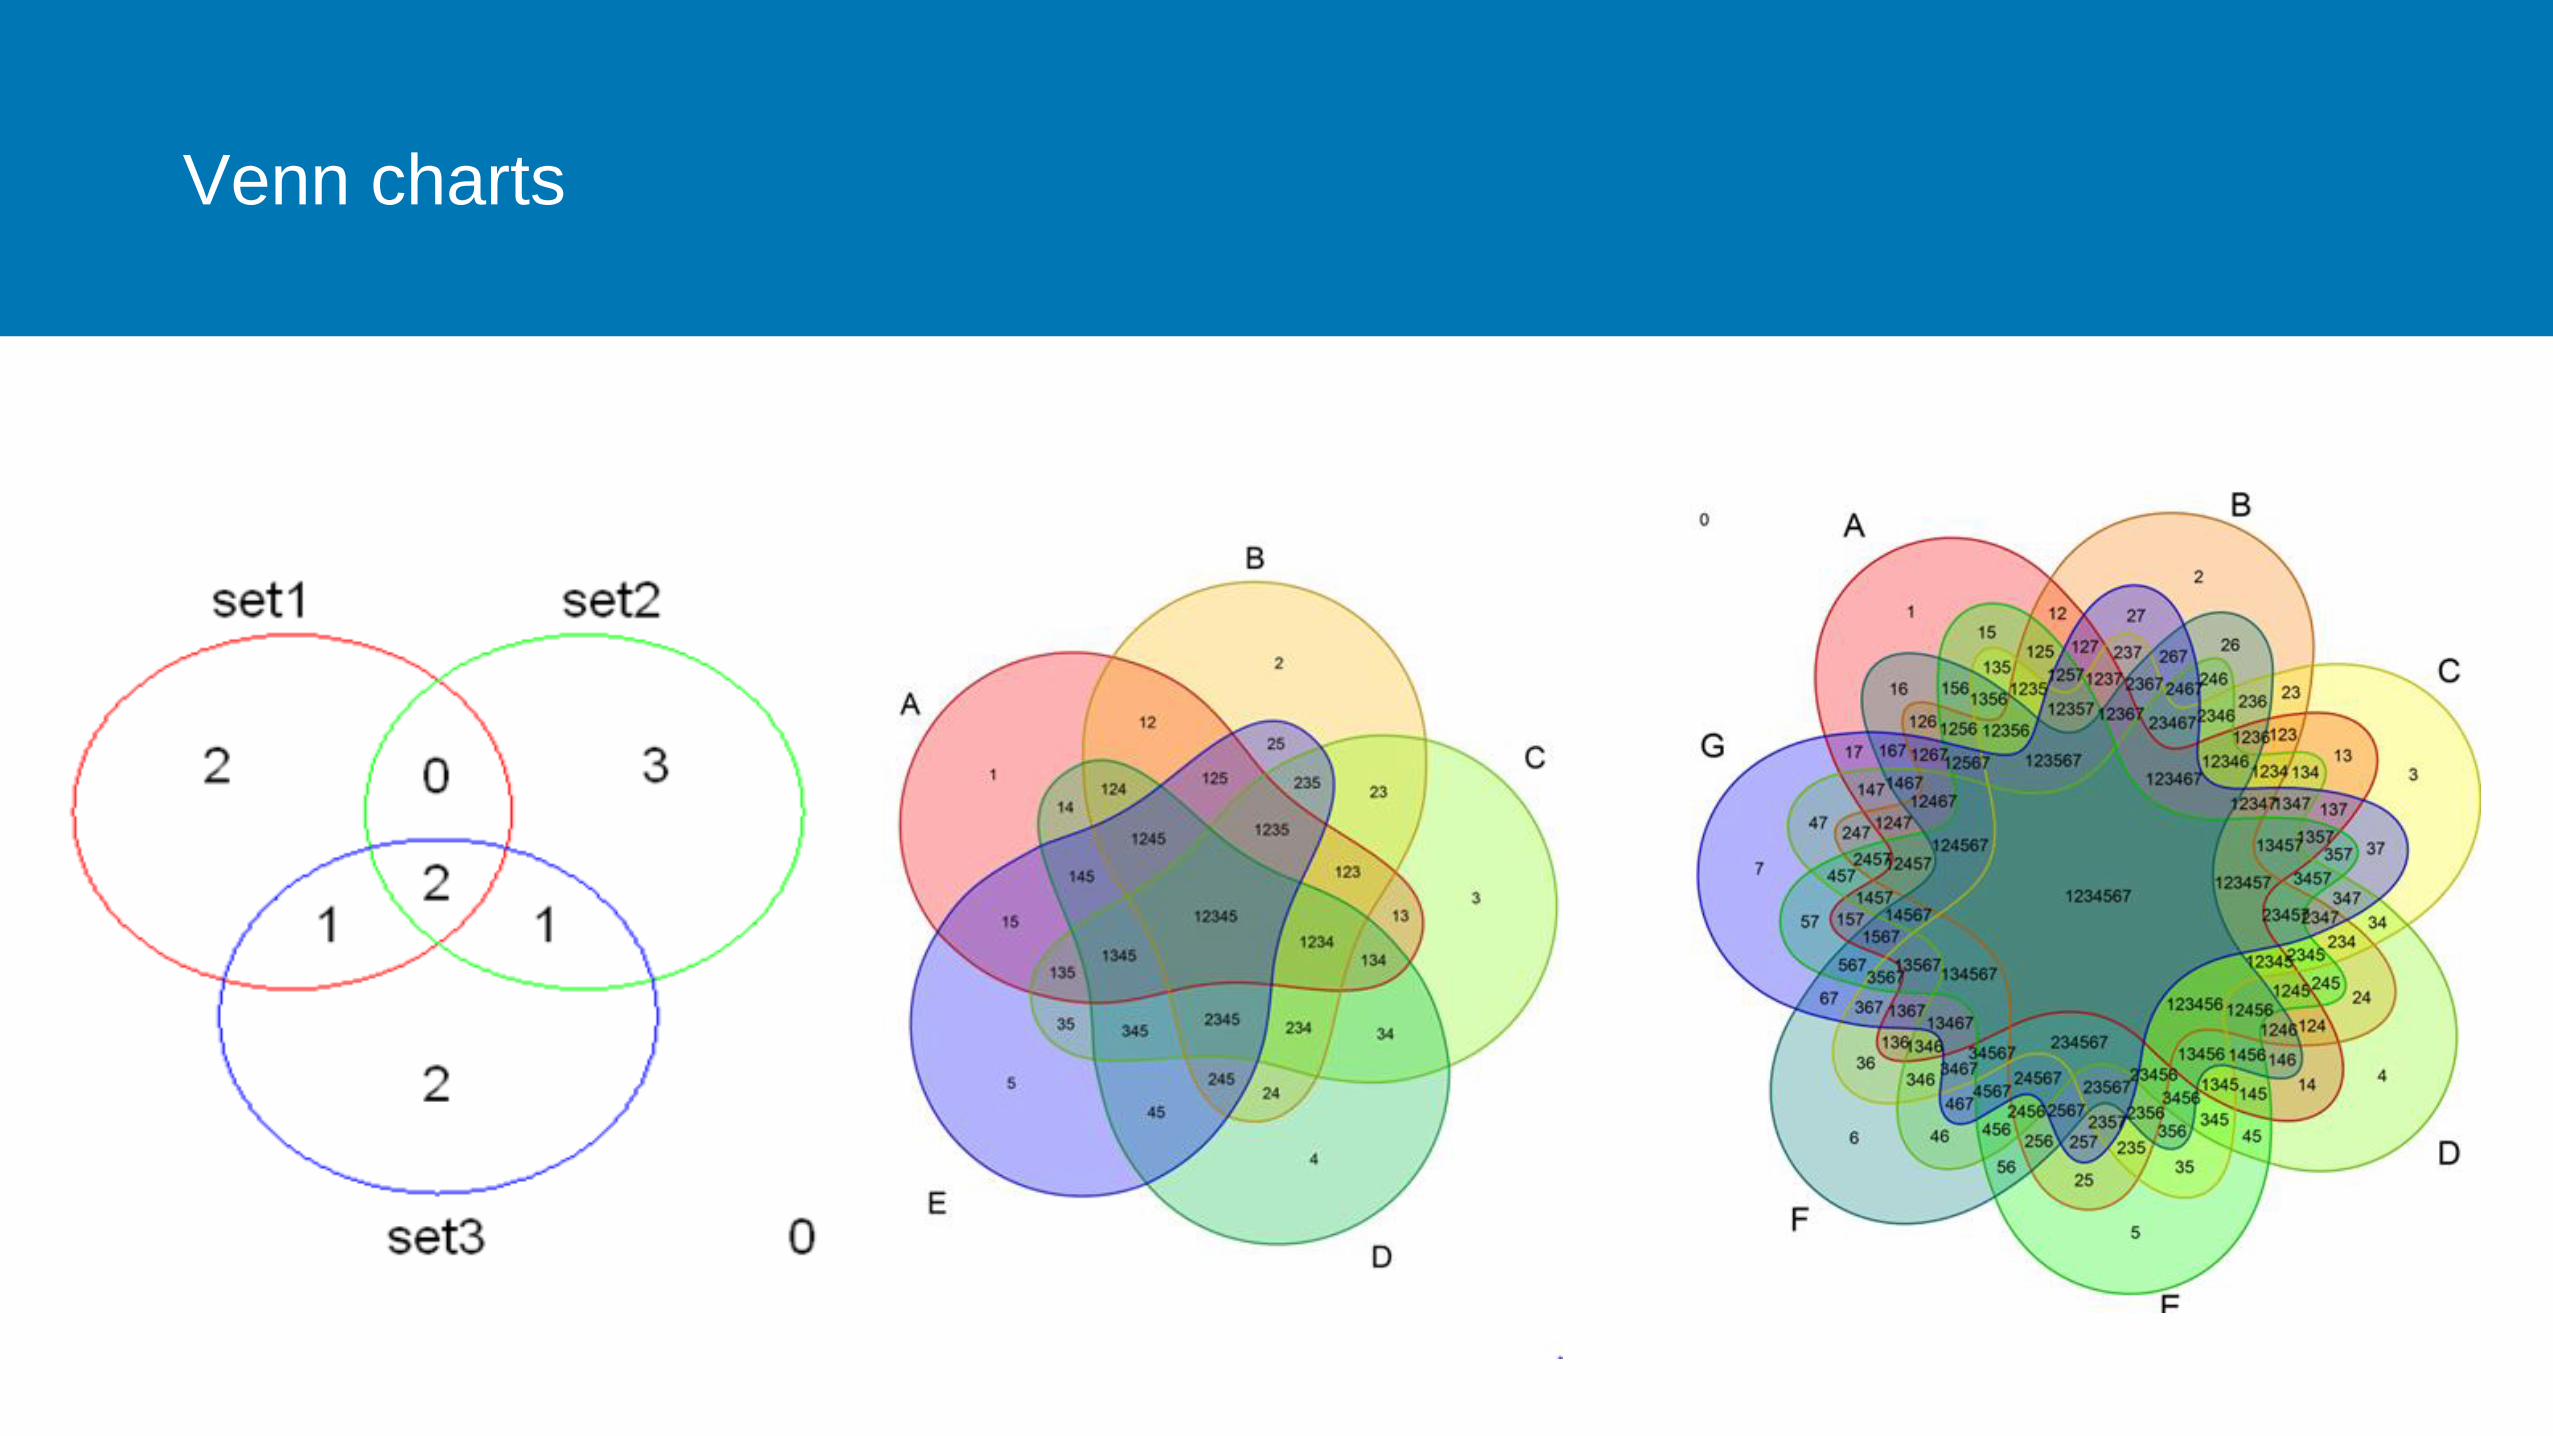
Venn charts

Rosling chart (animated bubbles)

Fourfold charts

Agreement chart

Dynamics sector chart
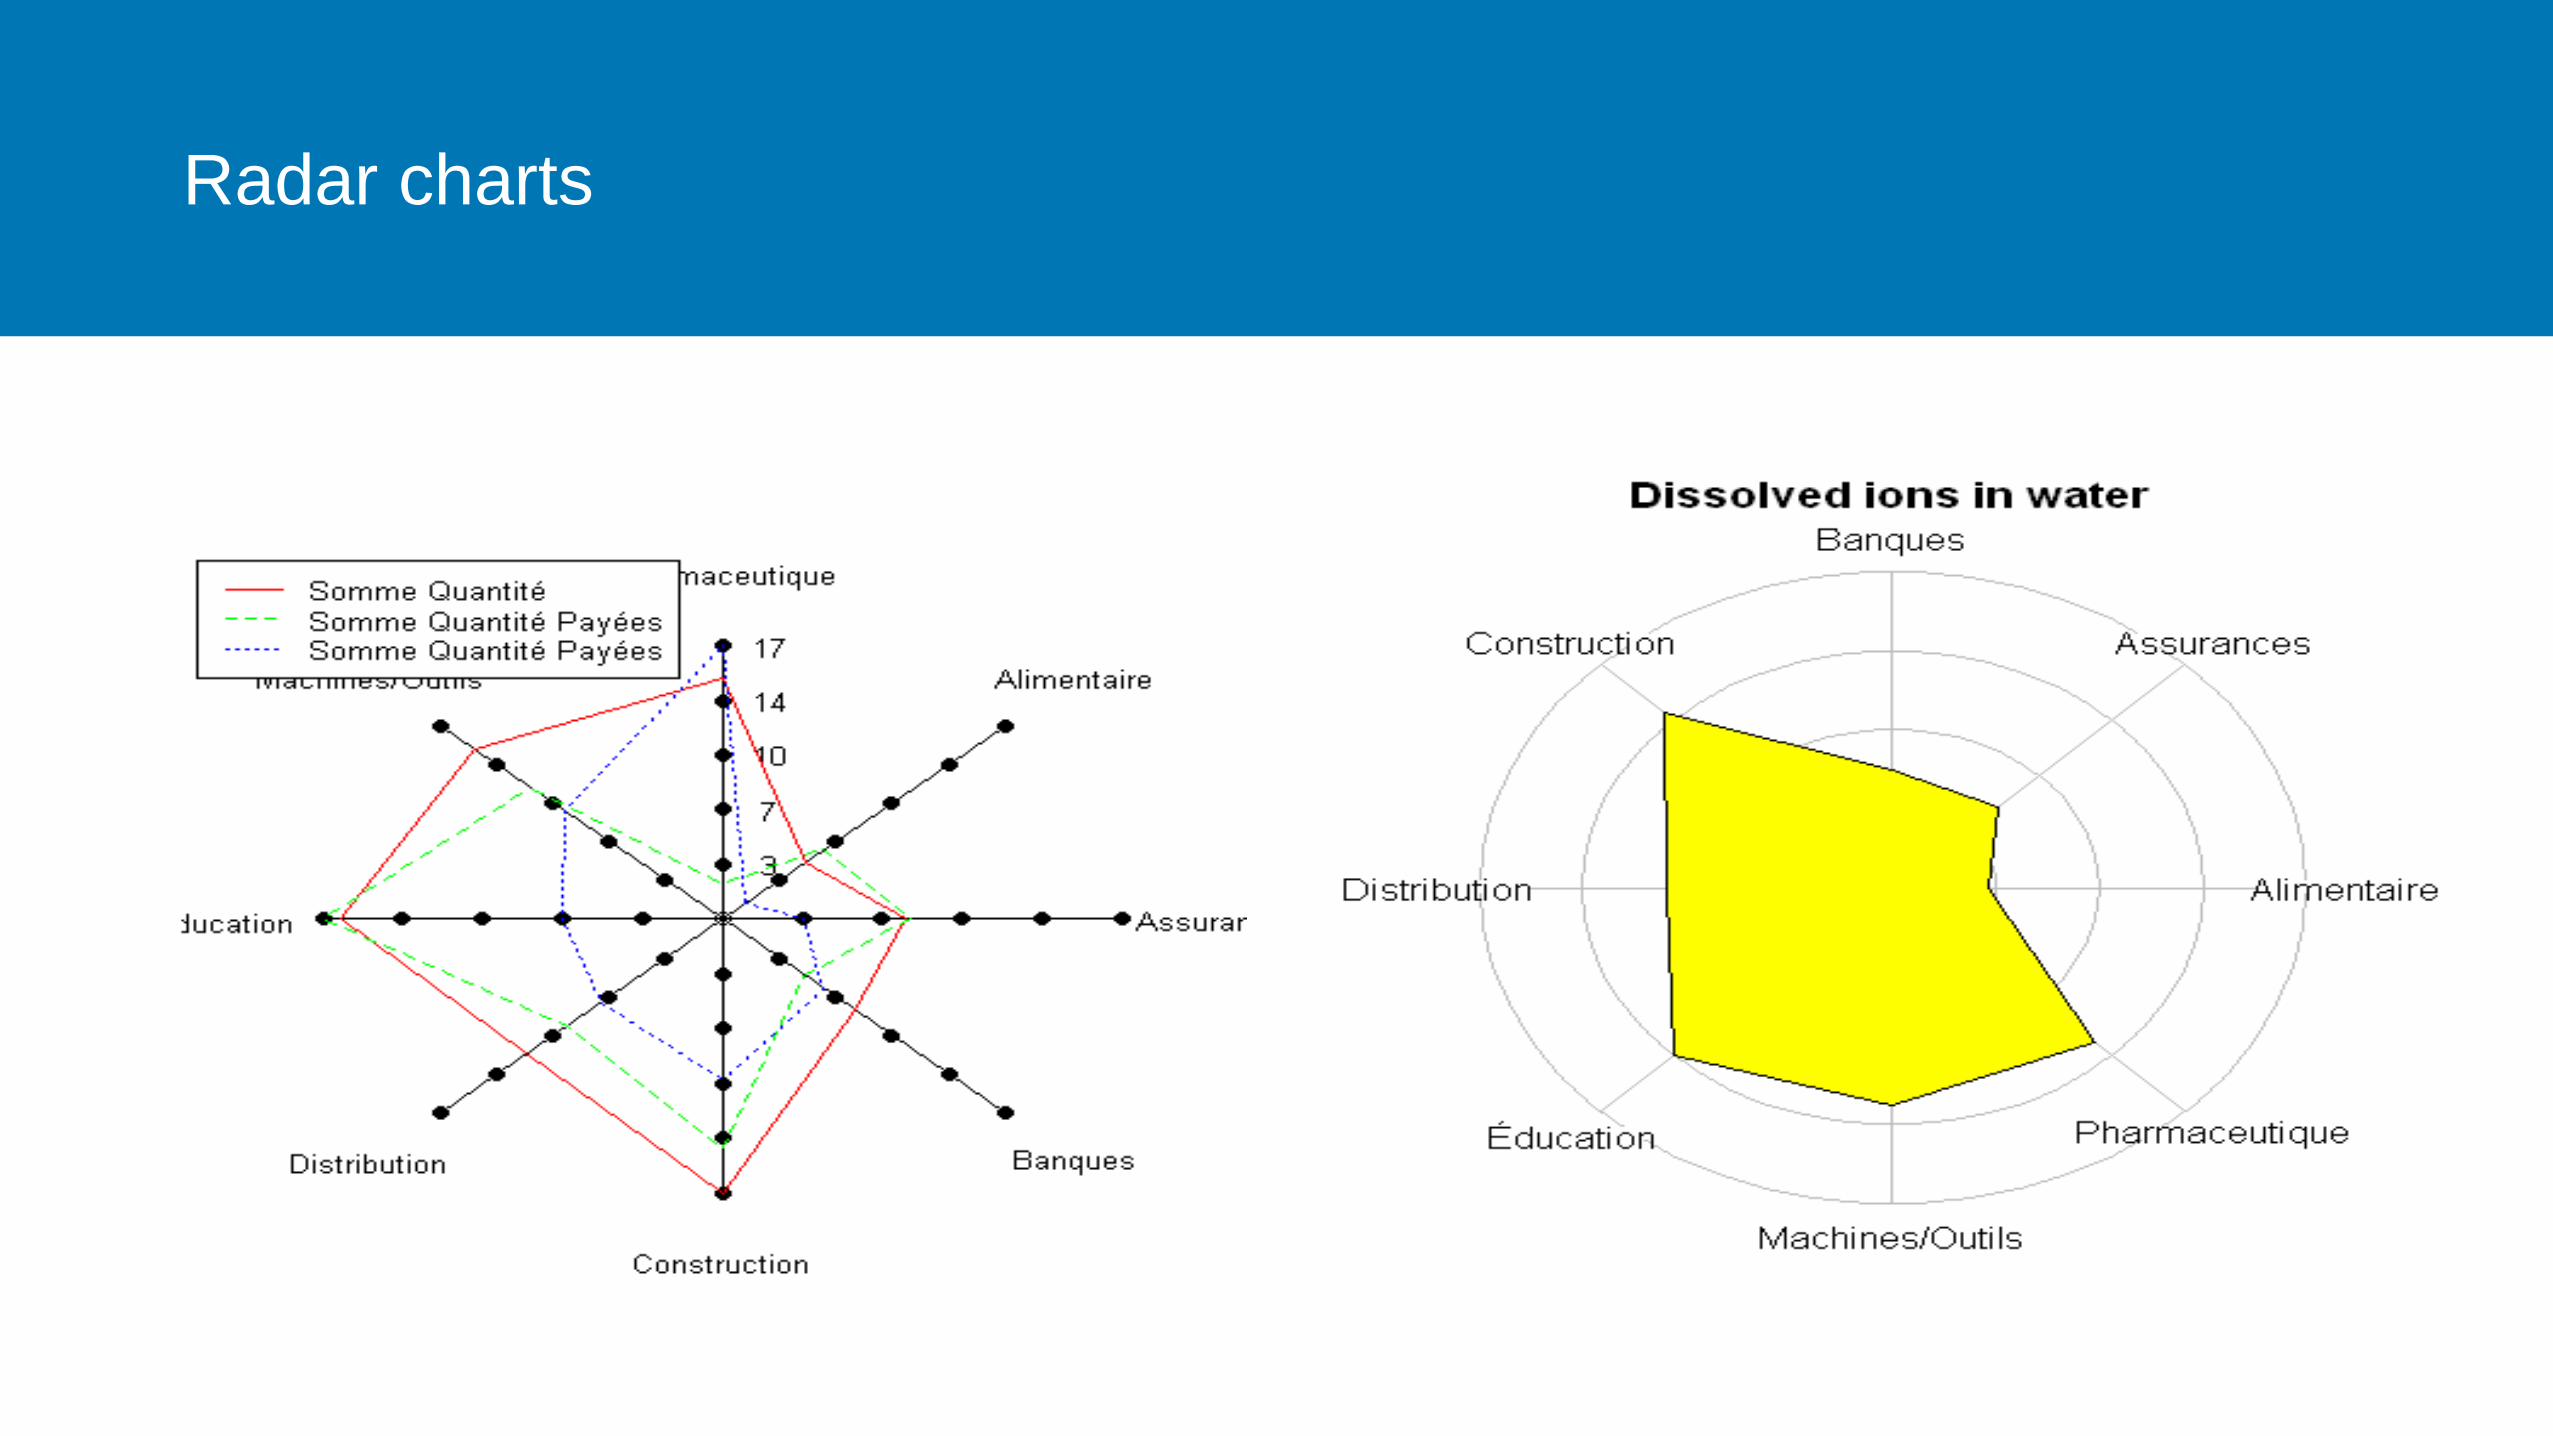
Radar charts

Radial charts (nightingale rose chart)

Lines and Curves Charts

X-Y lines chart
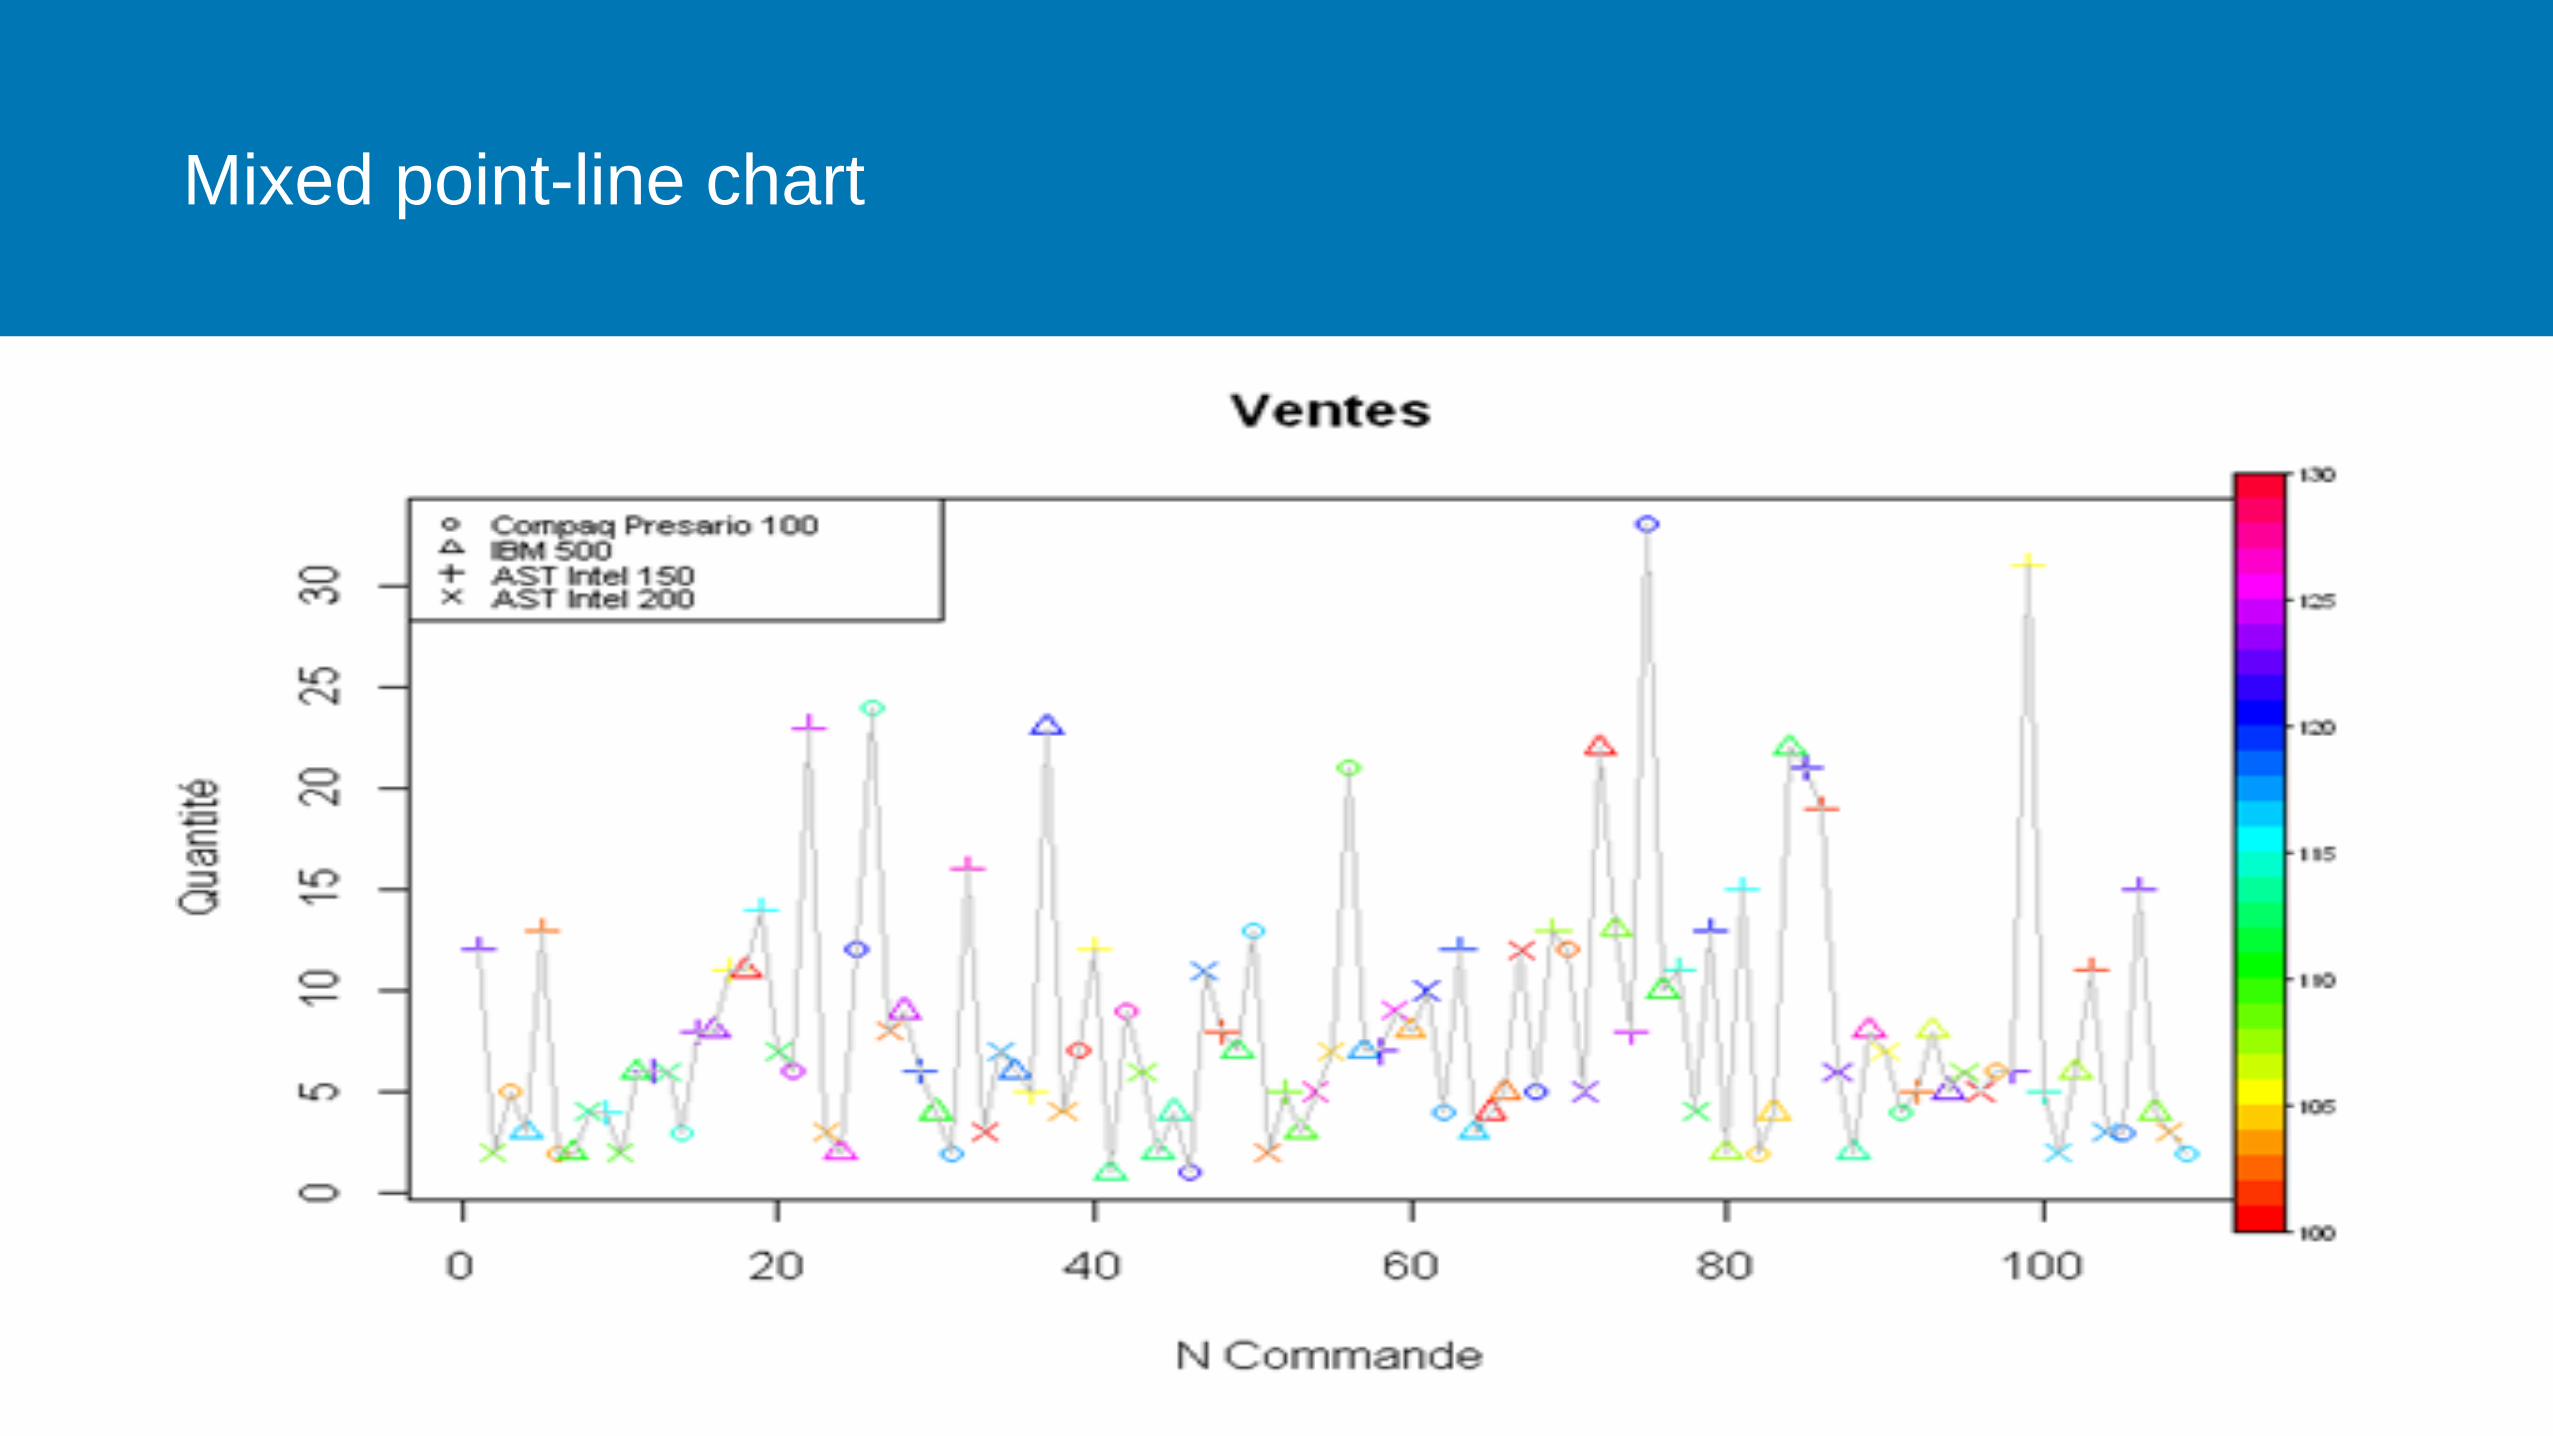
Mixed point-line chart

Frequency specturem chart (Fast Fourier Tranform chart)
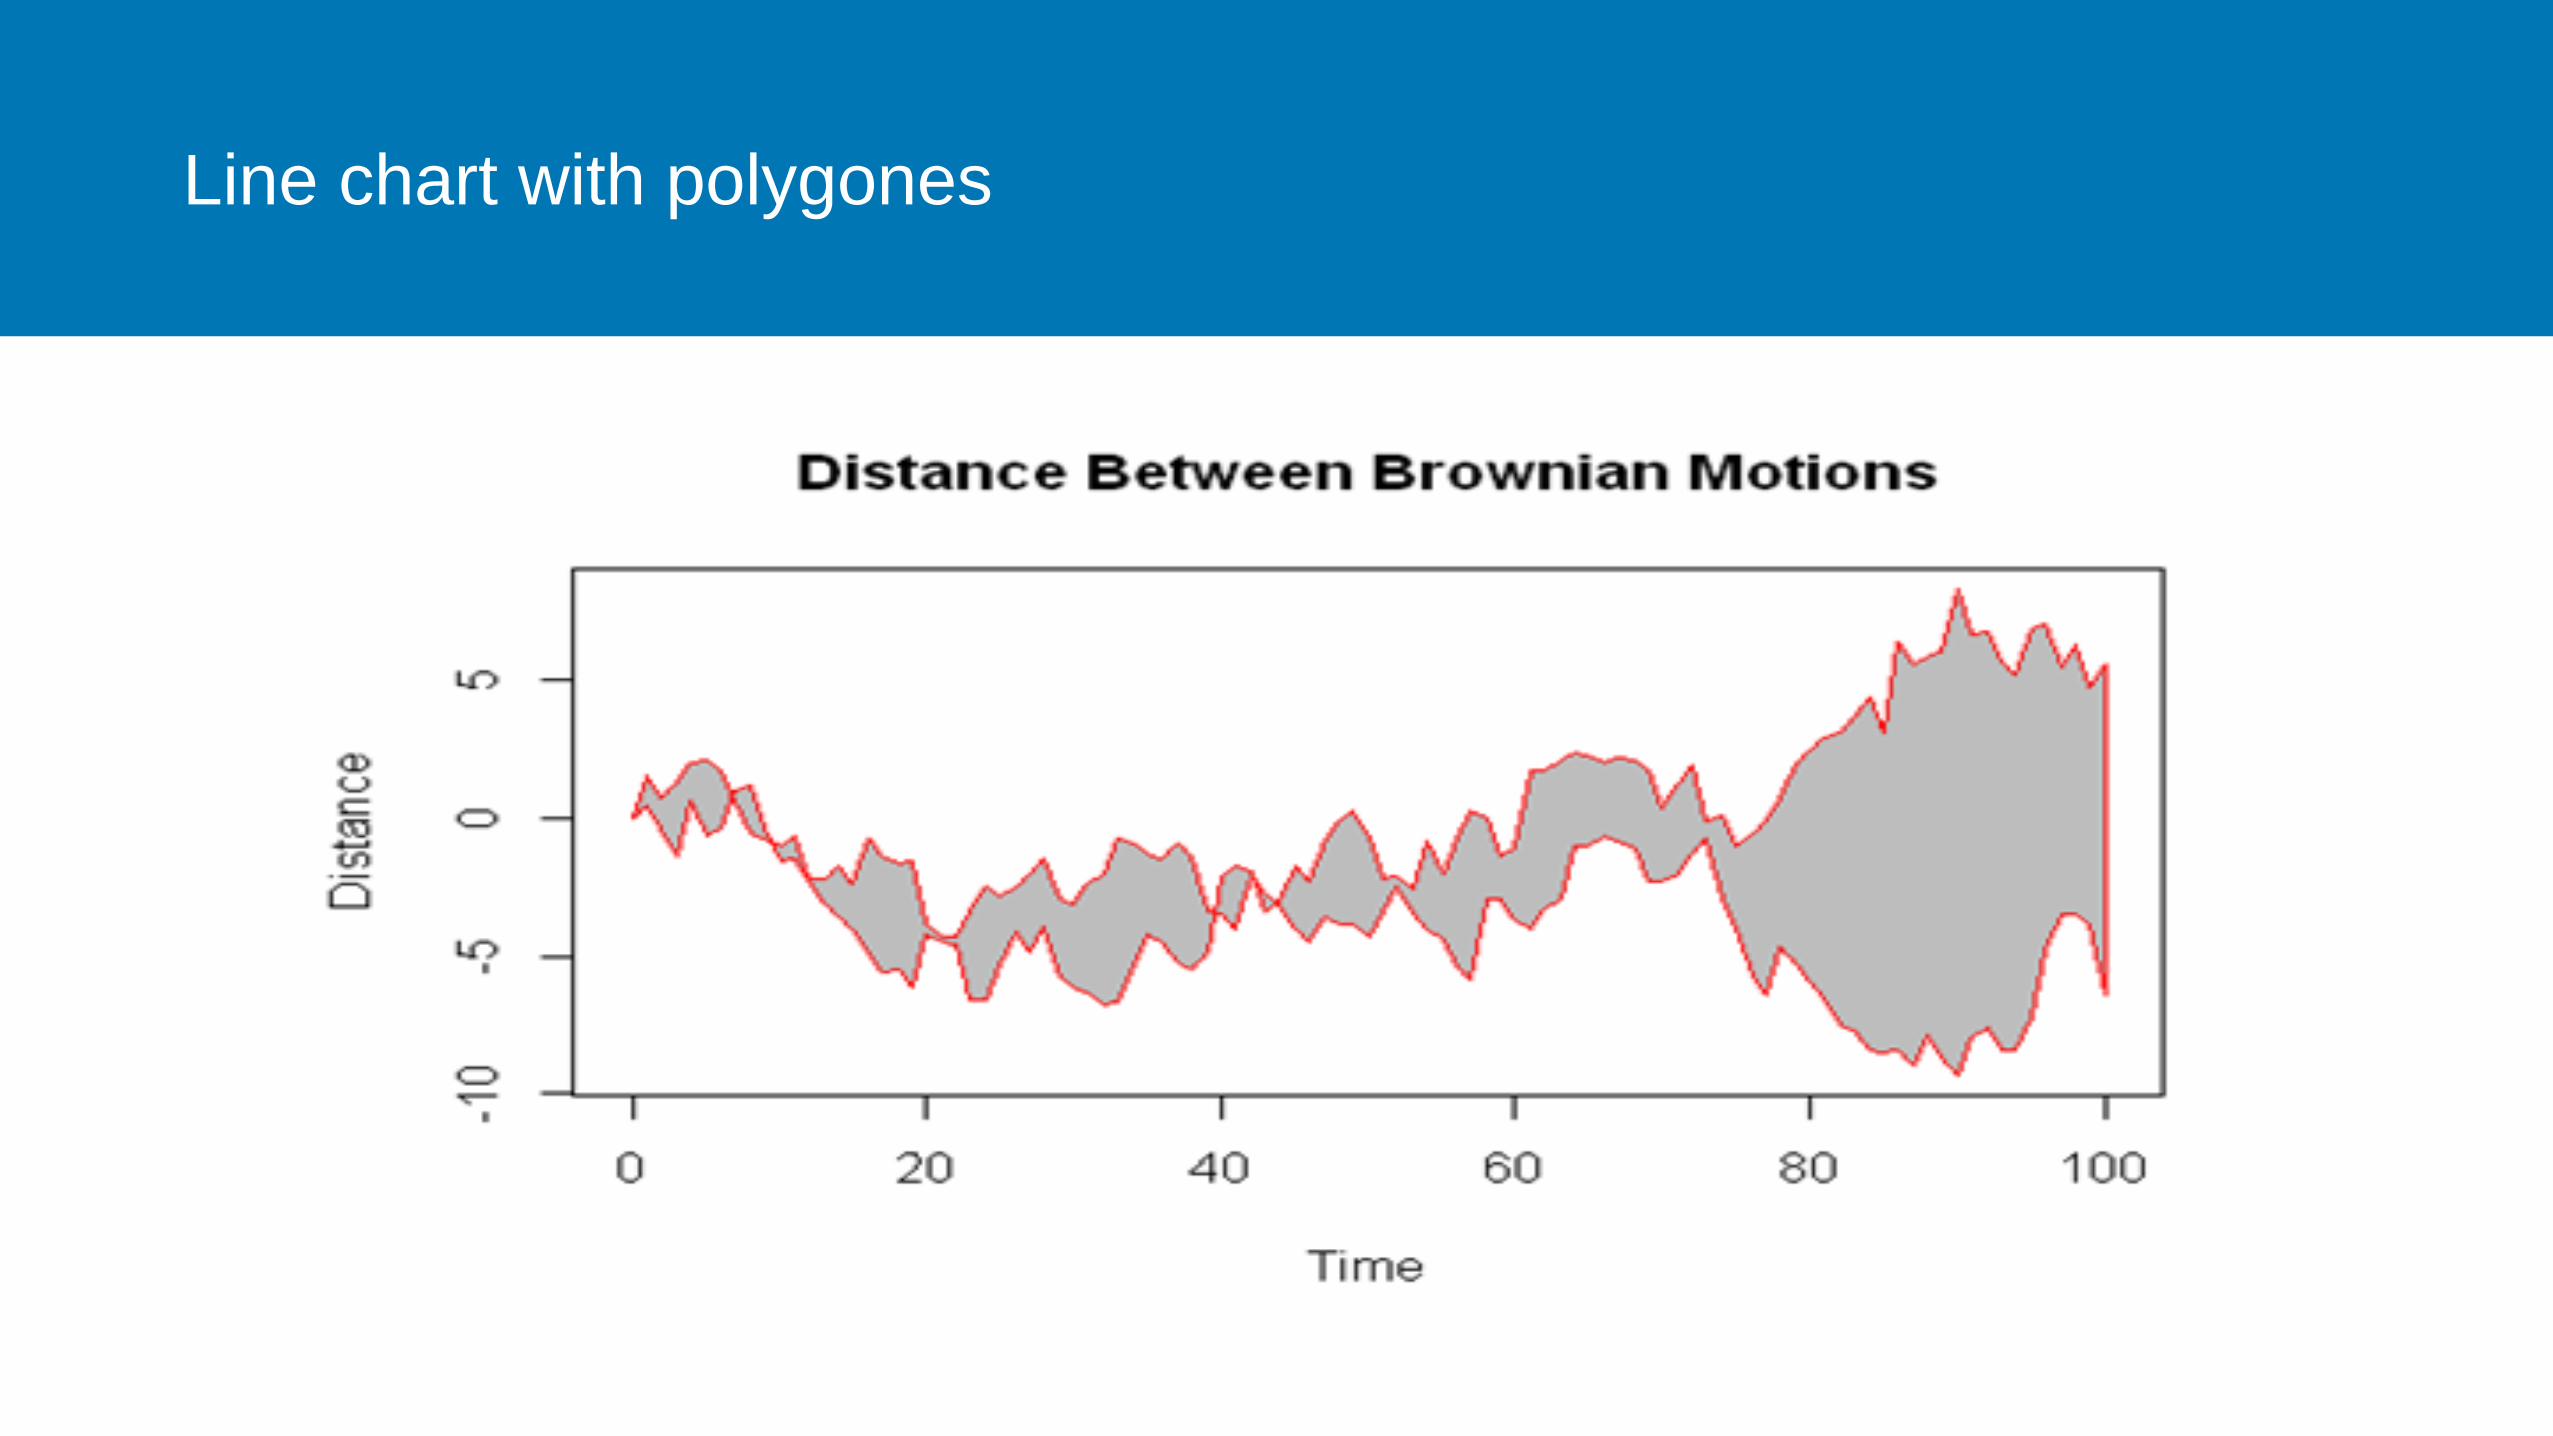
Line chart with polygones
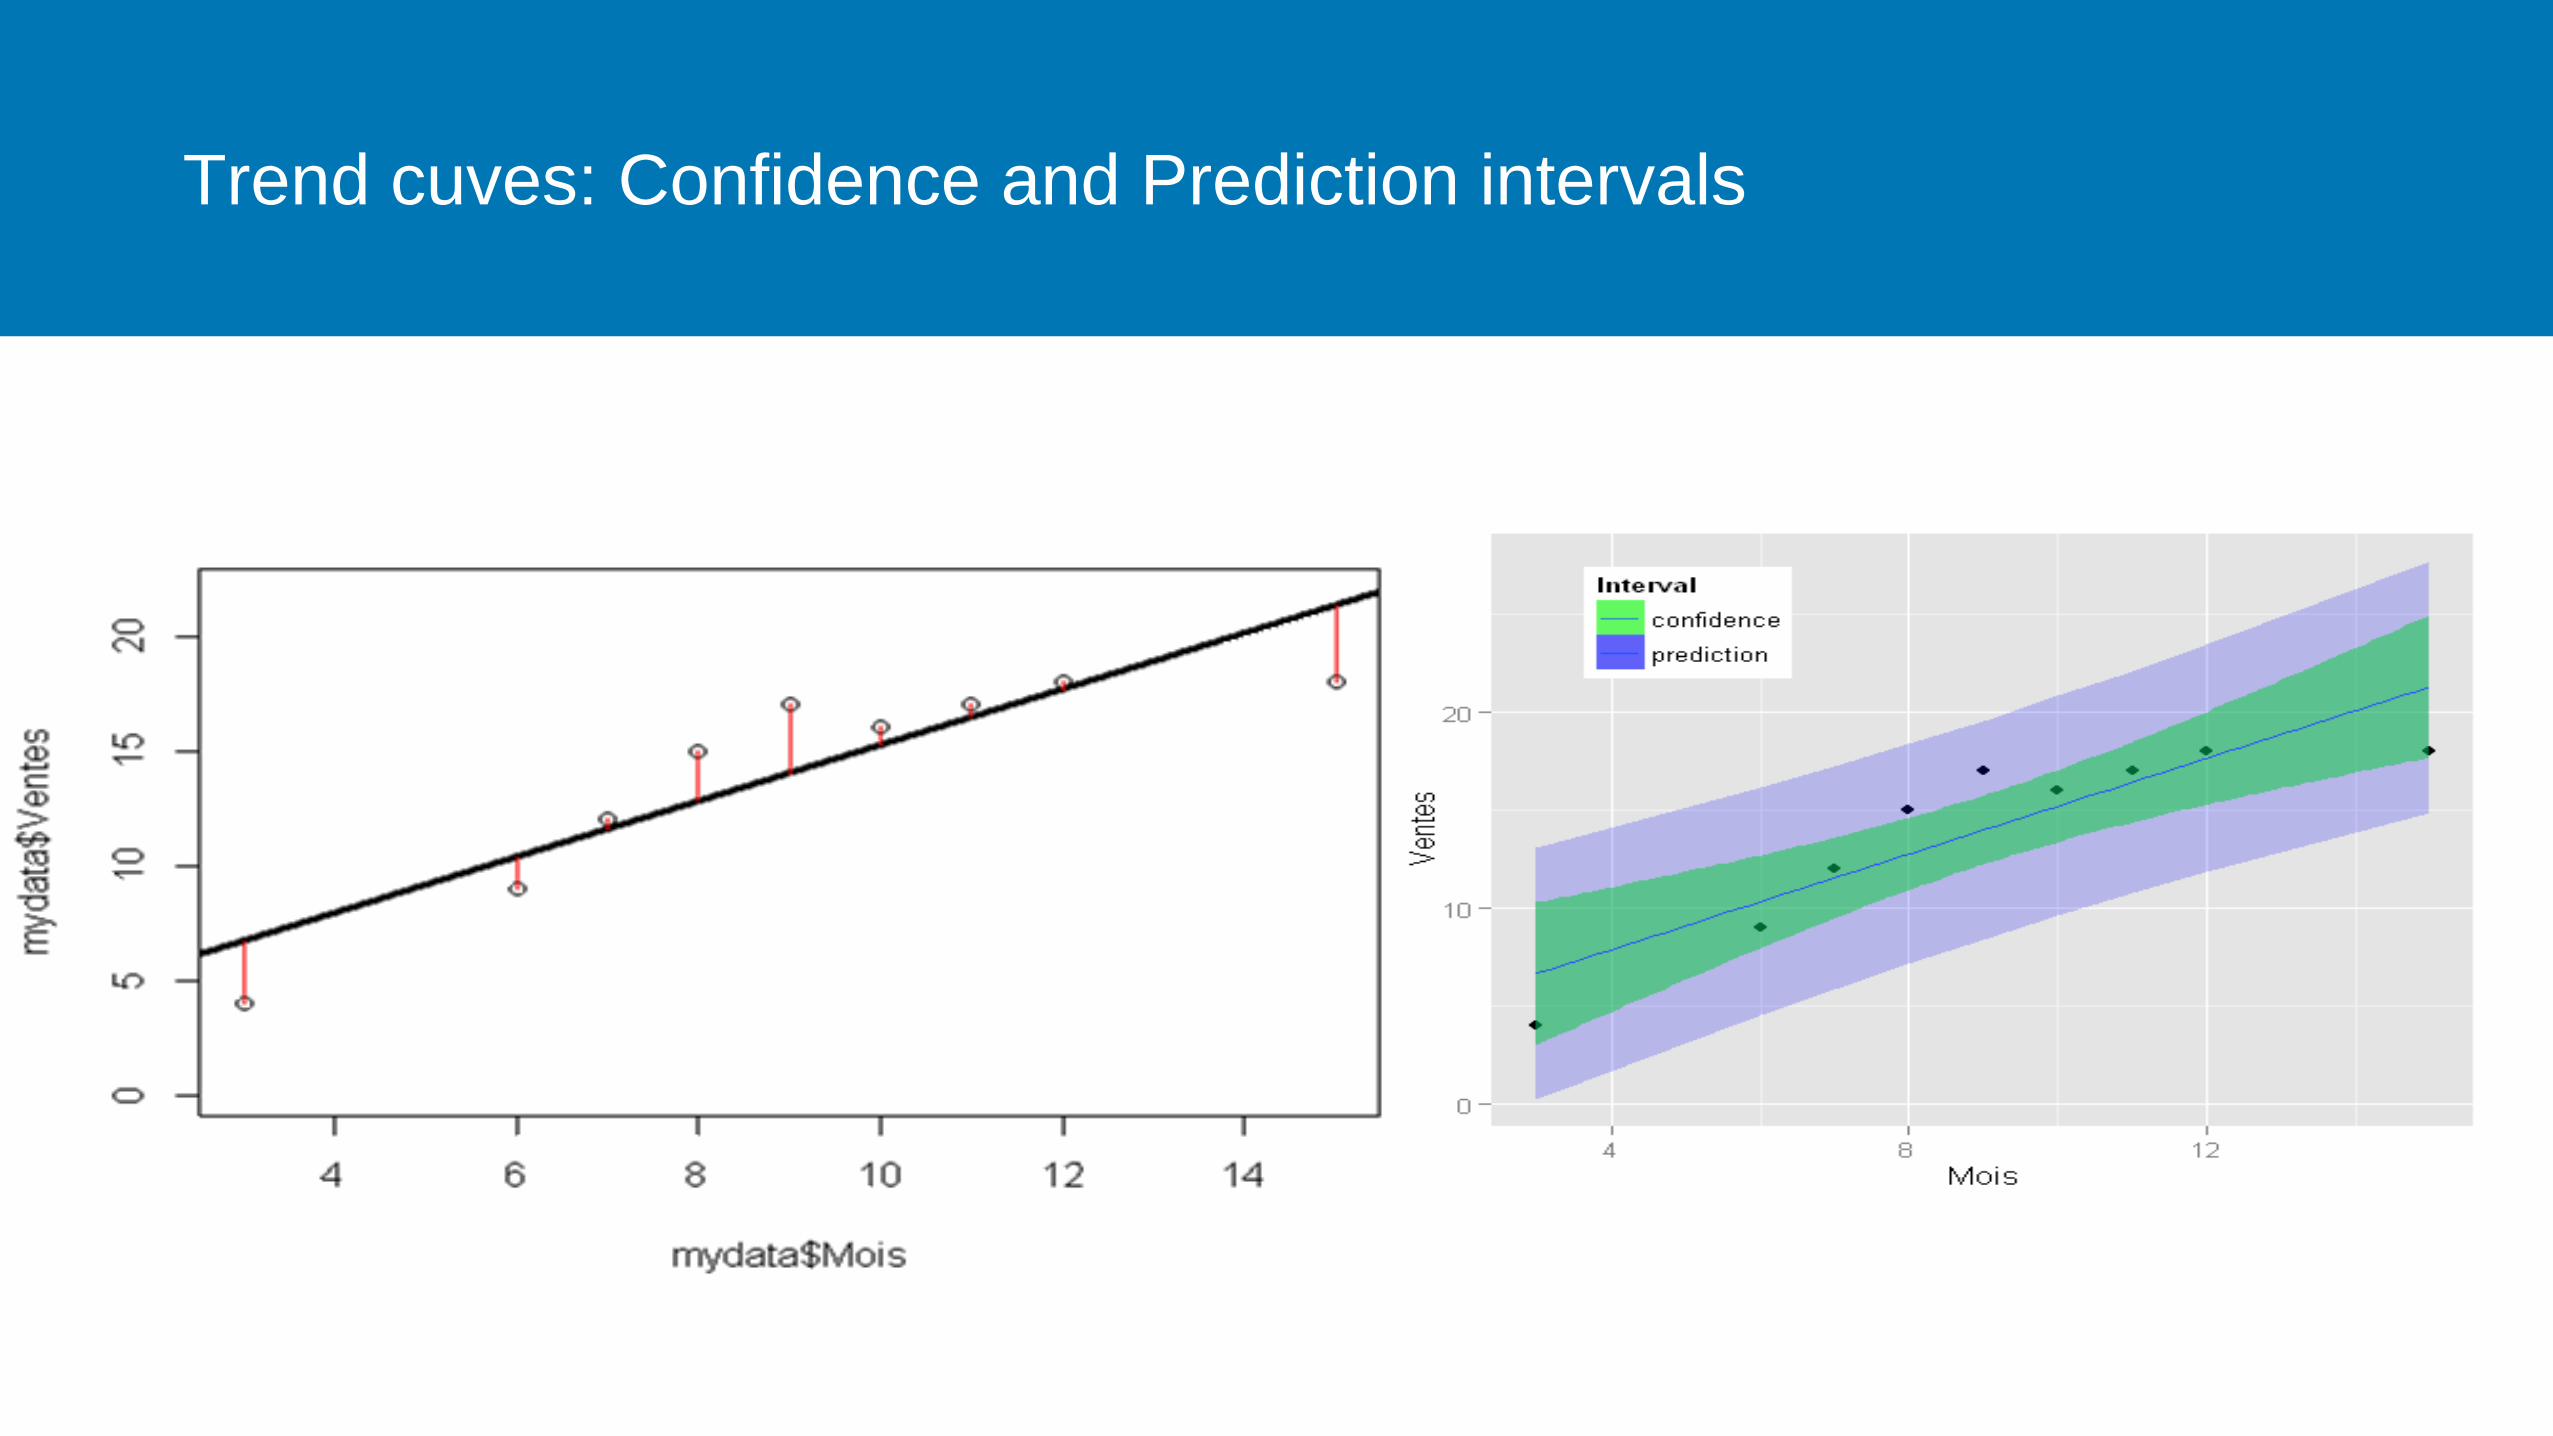
Trend cuves: Confidence and Prediction intervals
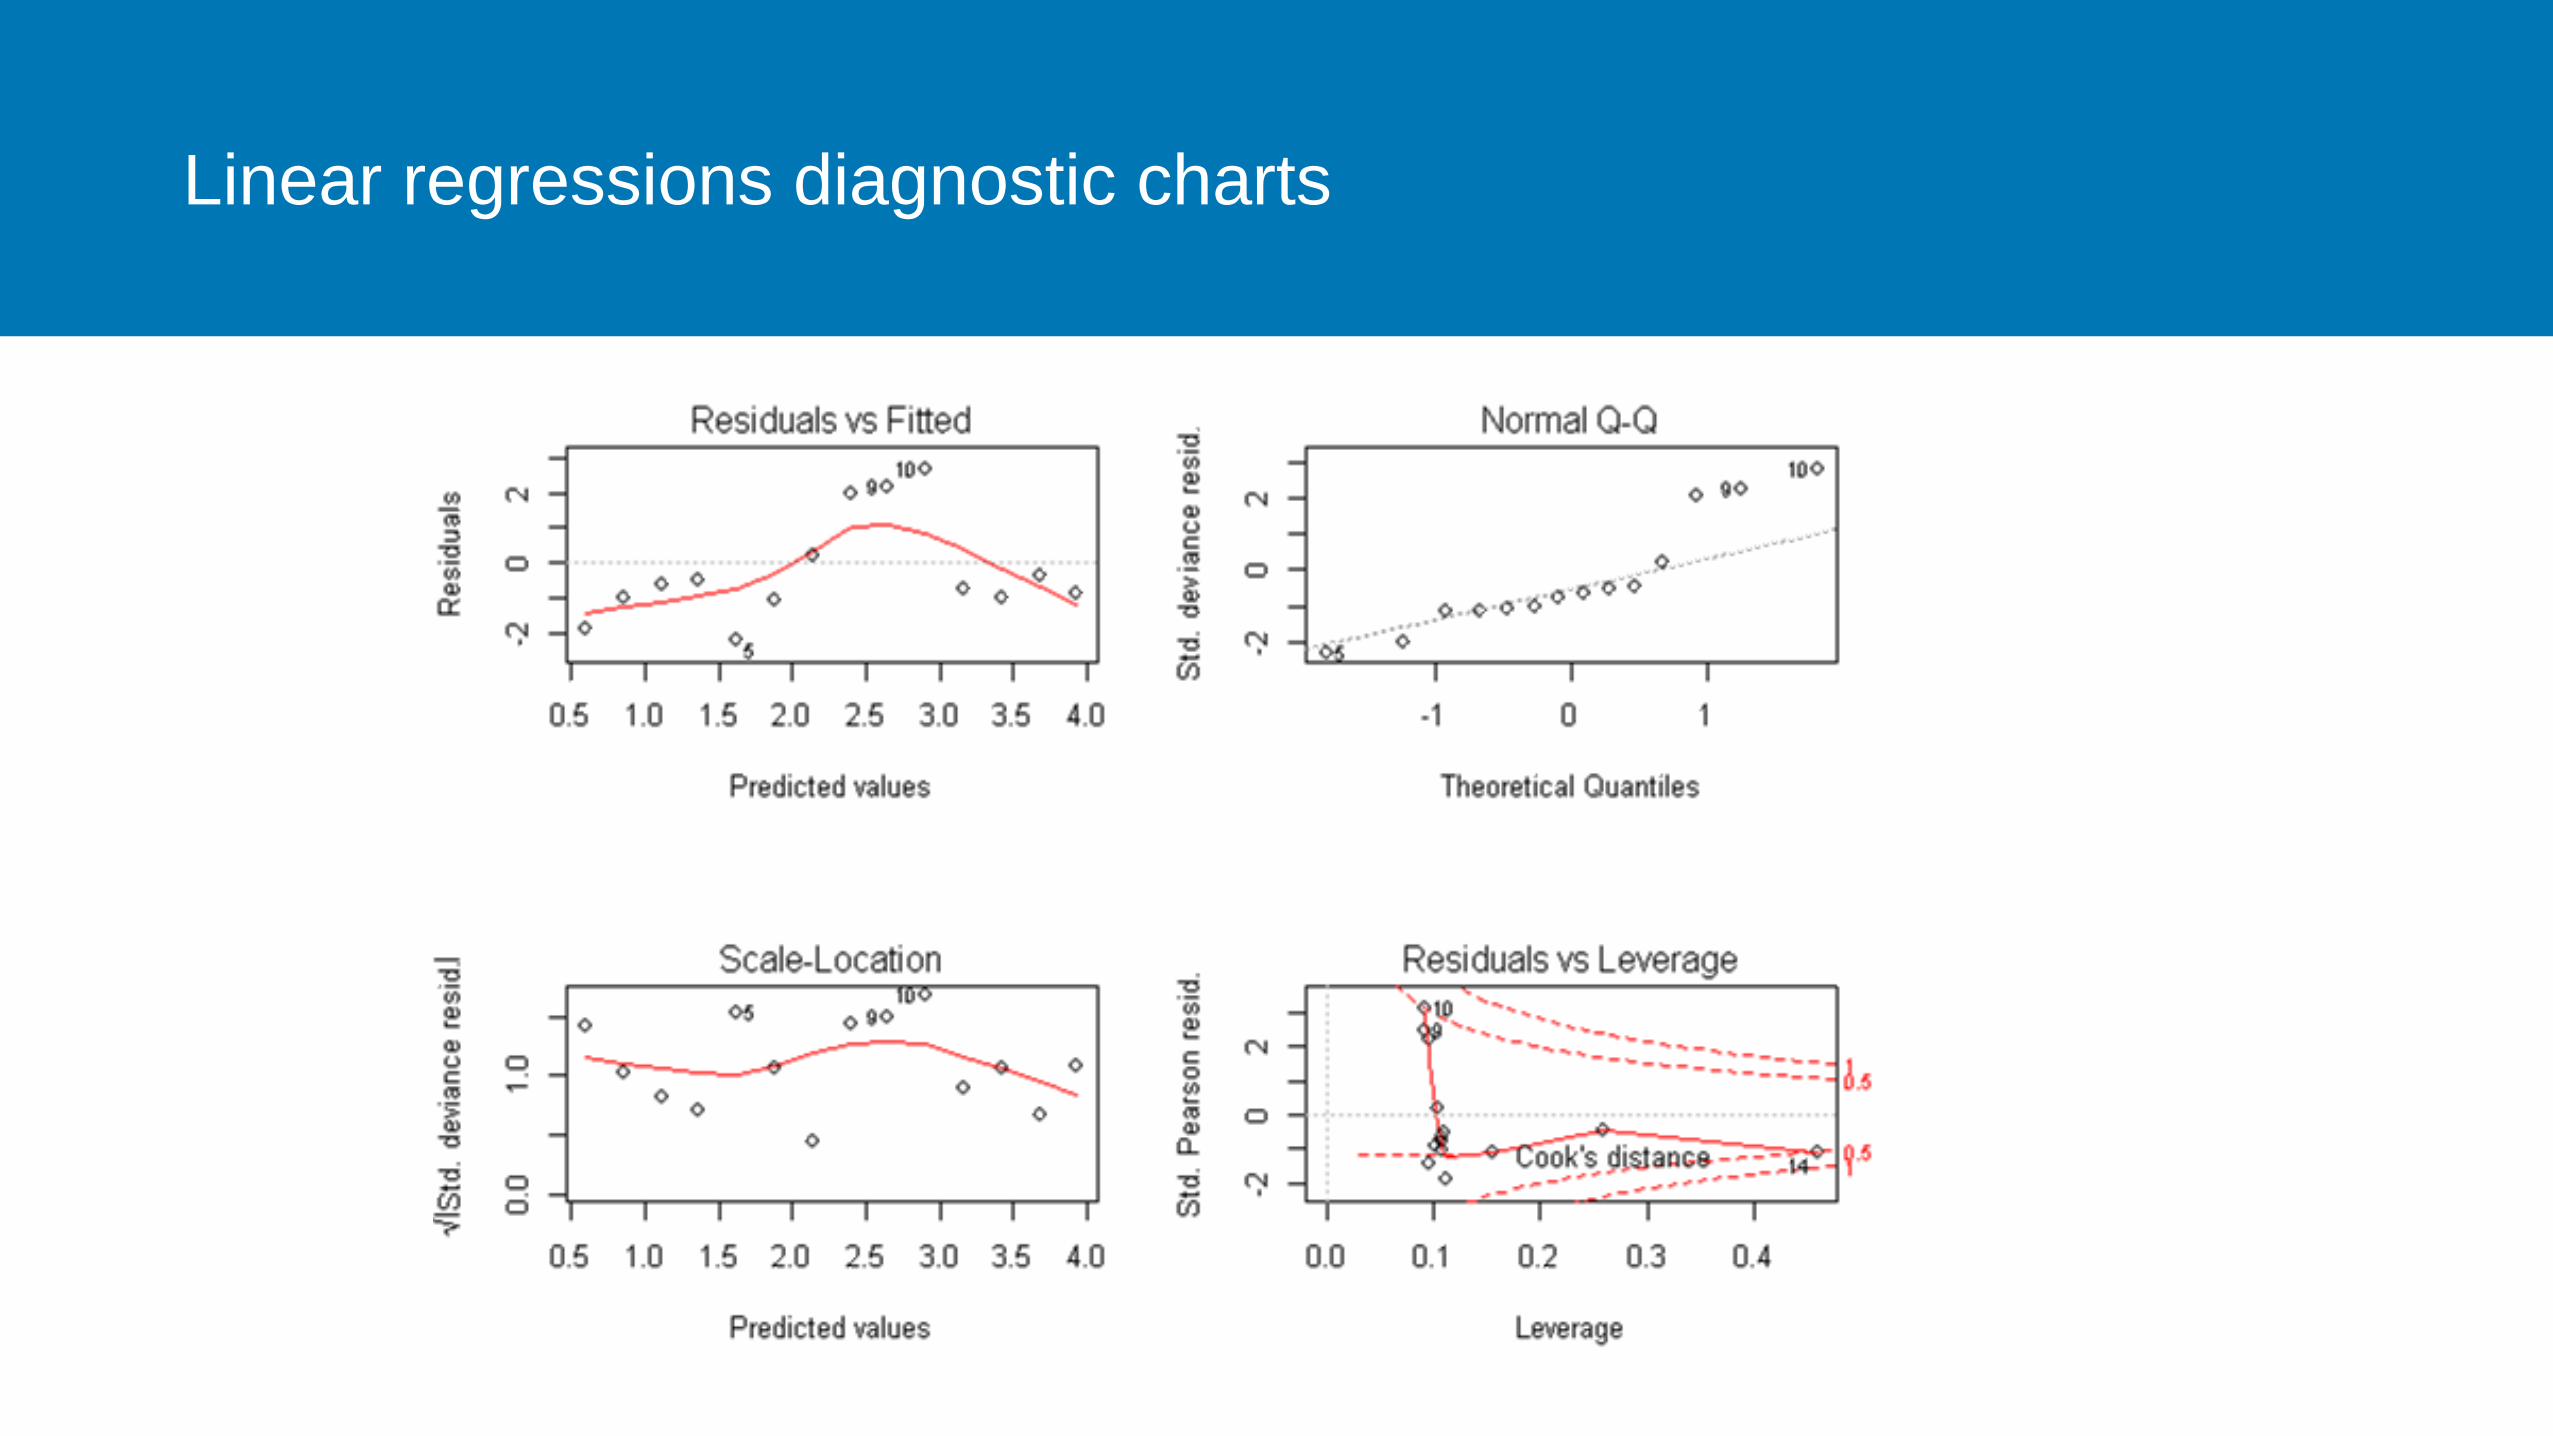
Linear regressions diagnostic charts

LOESS regression chart

Step chart (cumulated function chart)

Curves and Intervals density charts

Joy charts

Margin and Lattice Charts
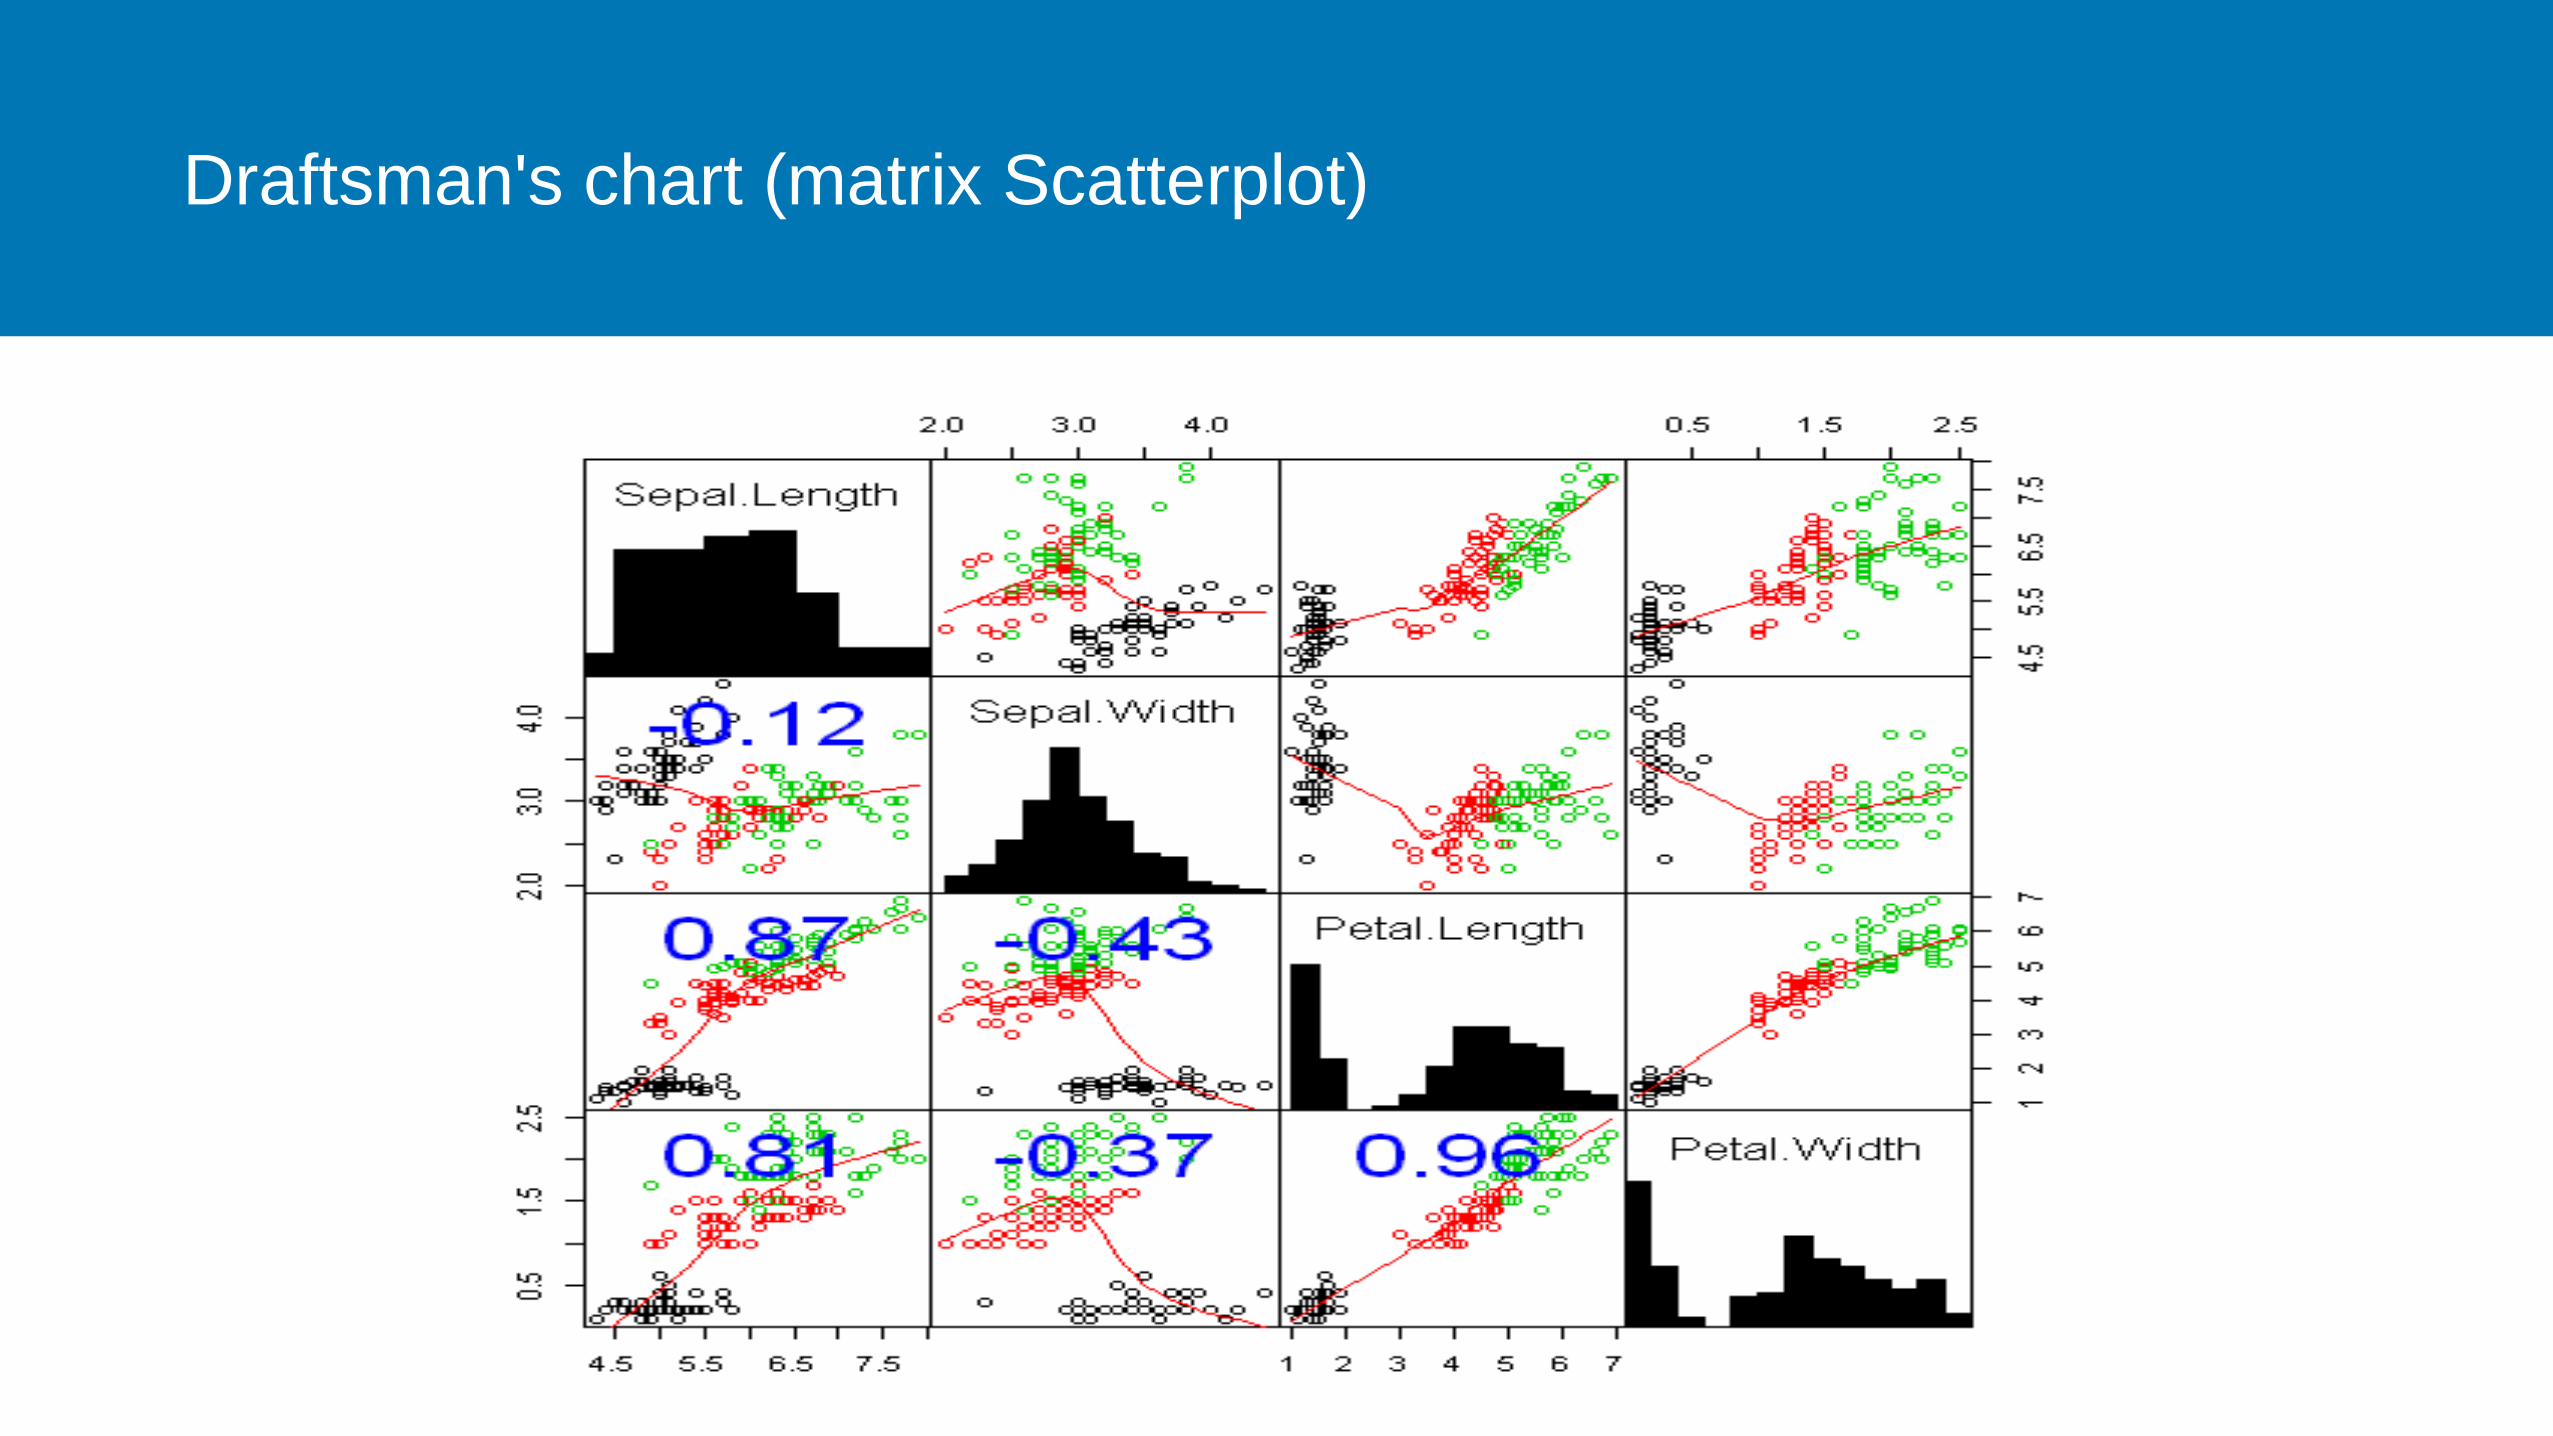
Draftsman's chart (matrix Scatterplot)

Lattice charts
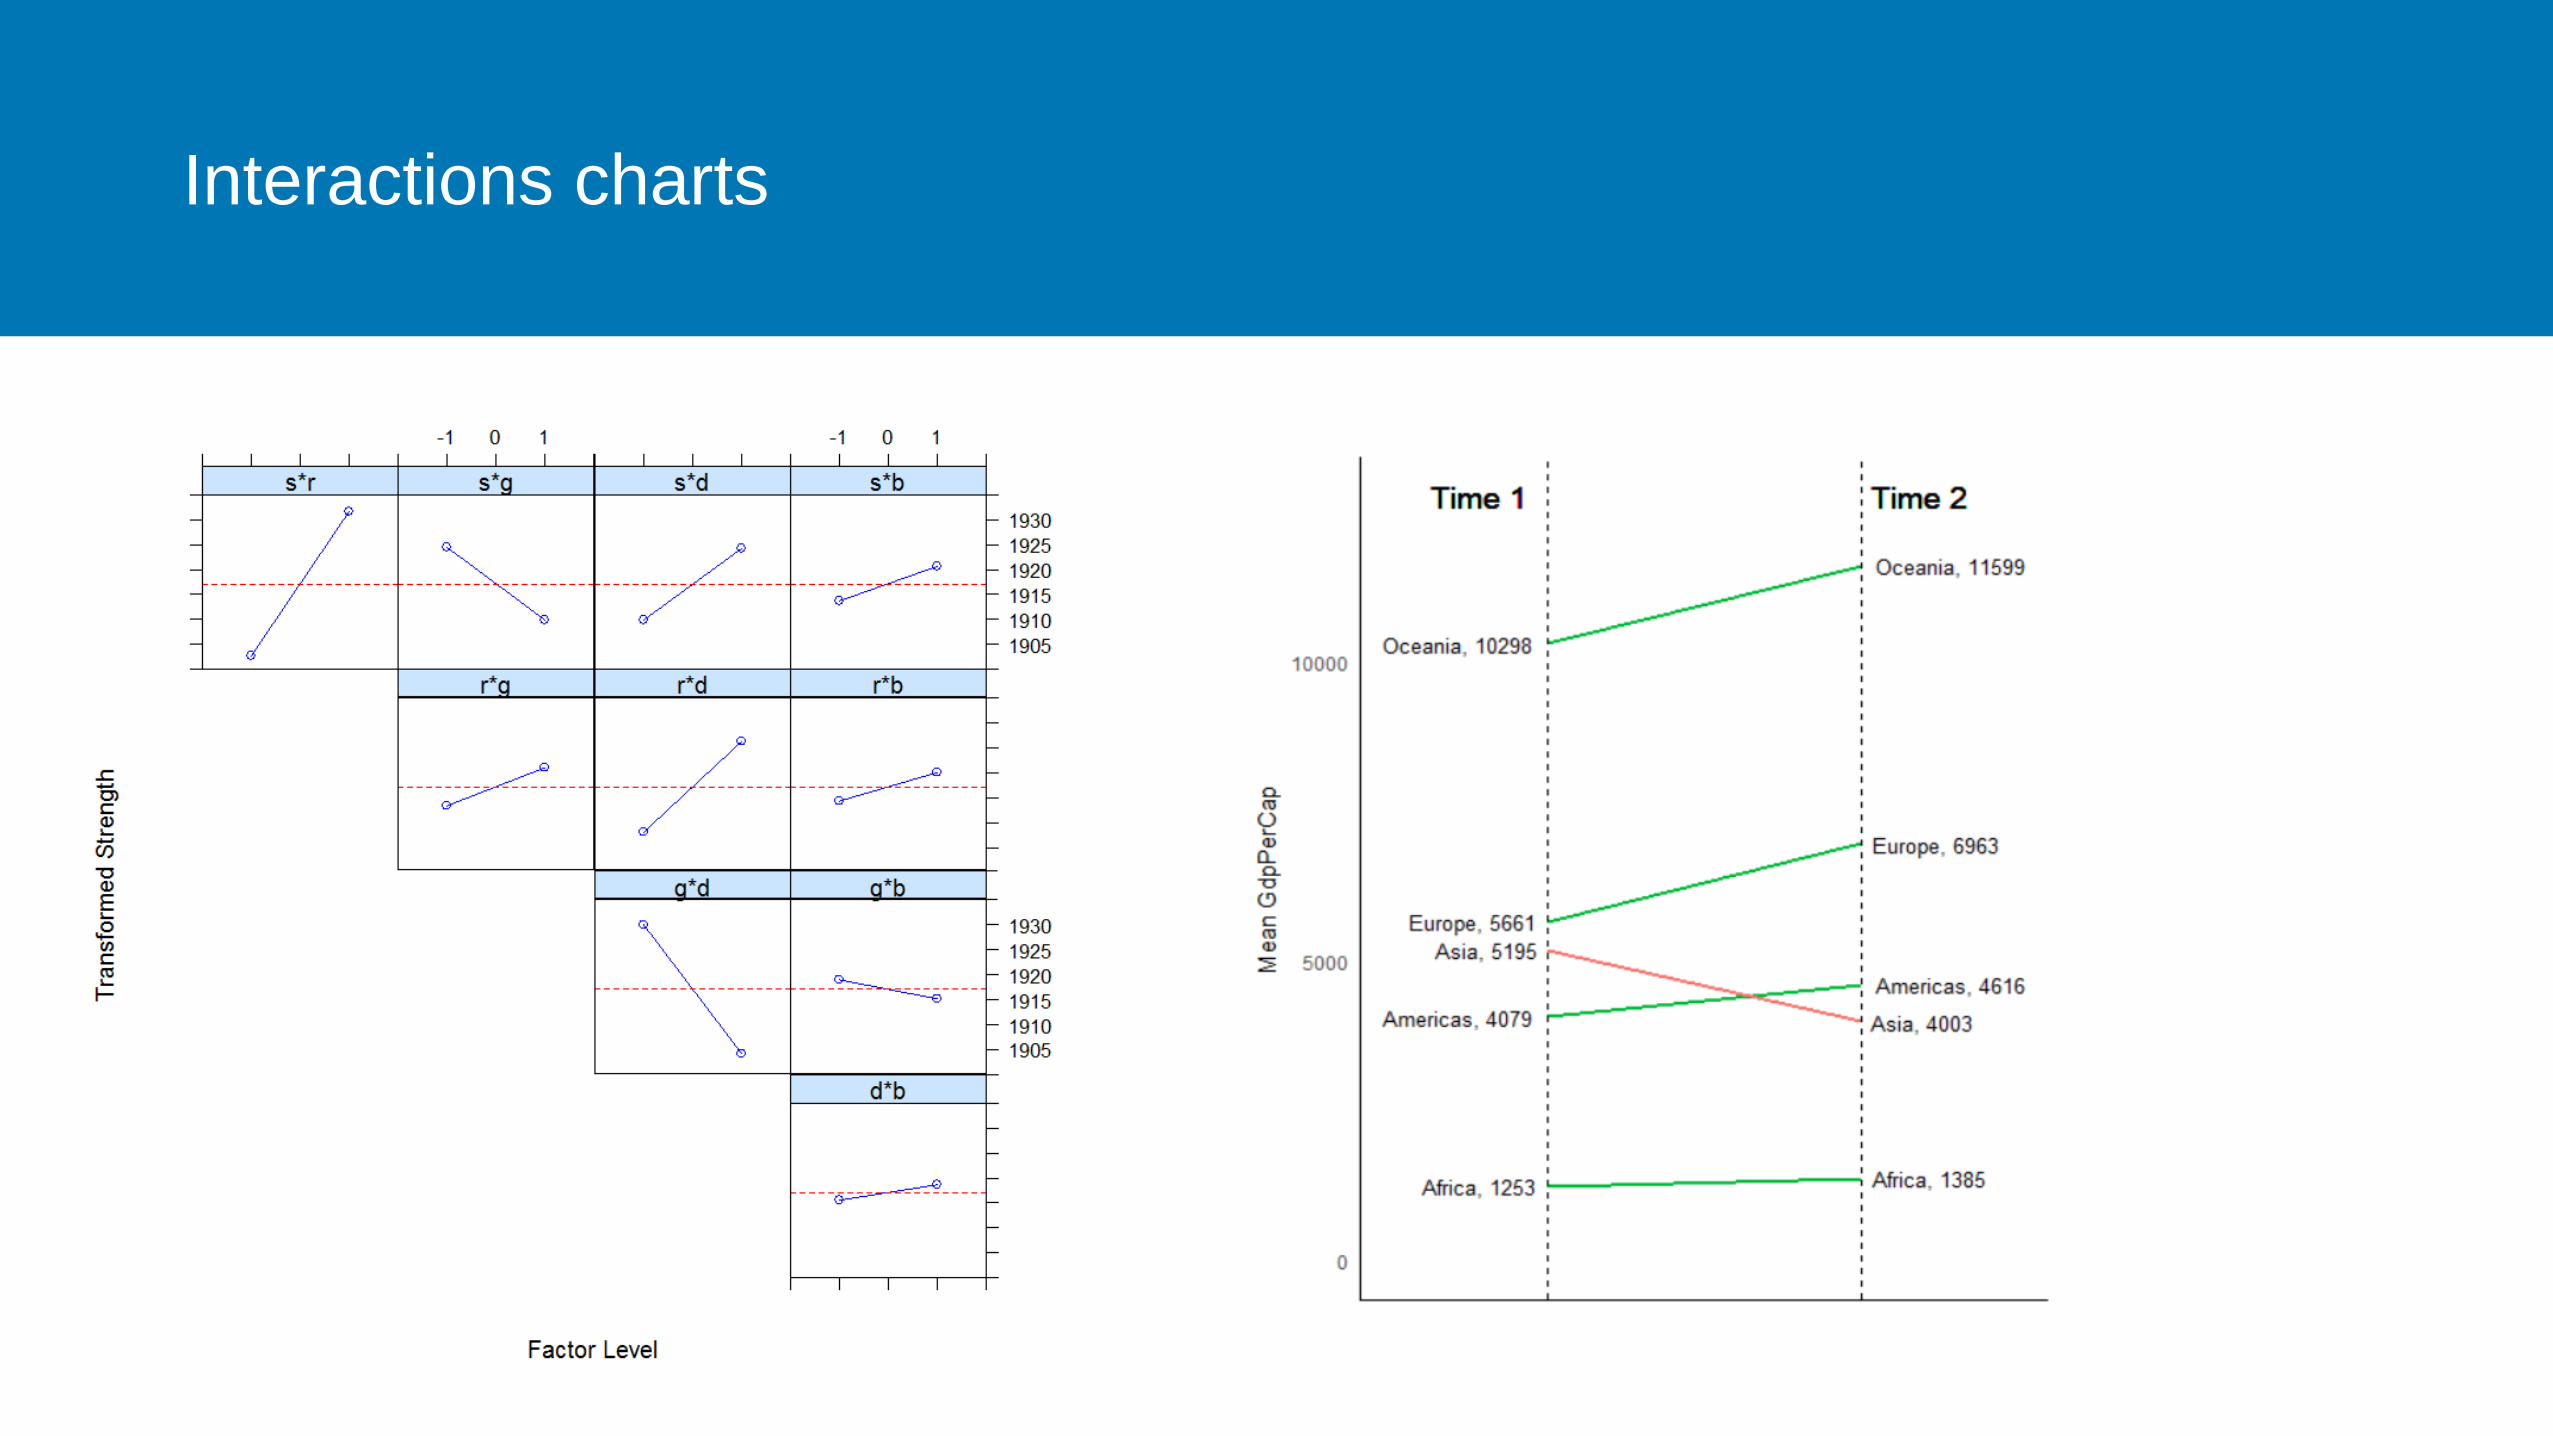
Interactions charts

Margin chart (with histogram)
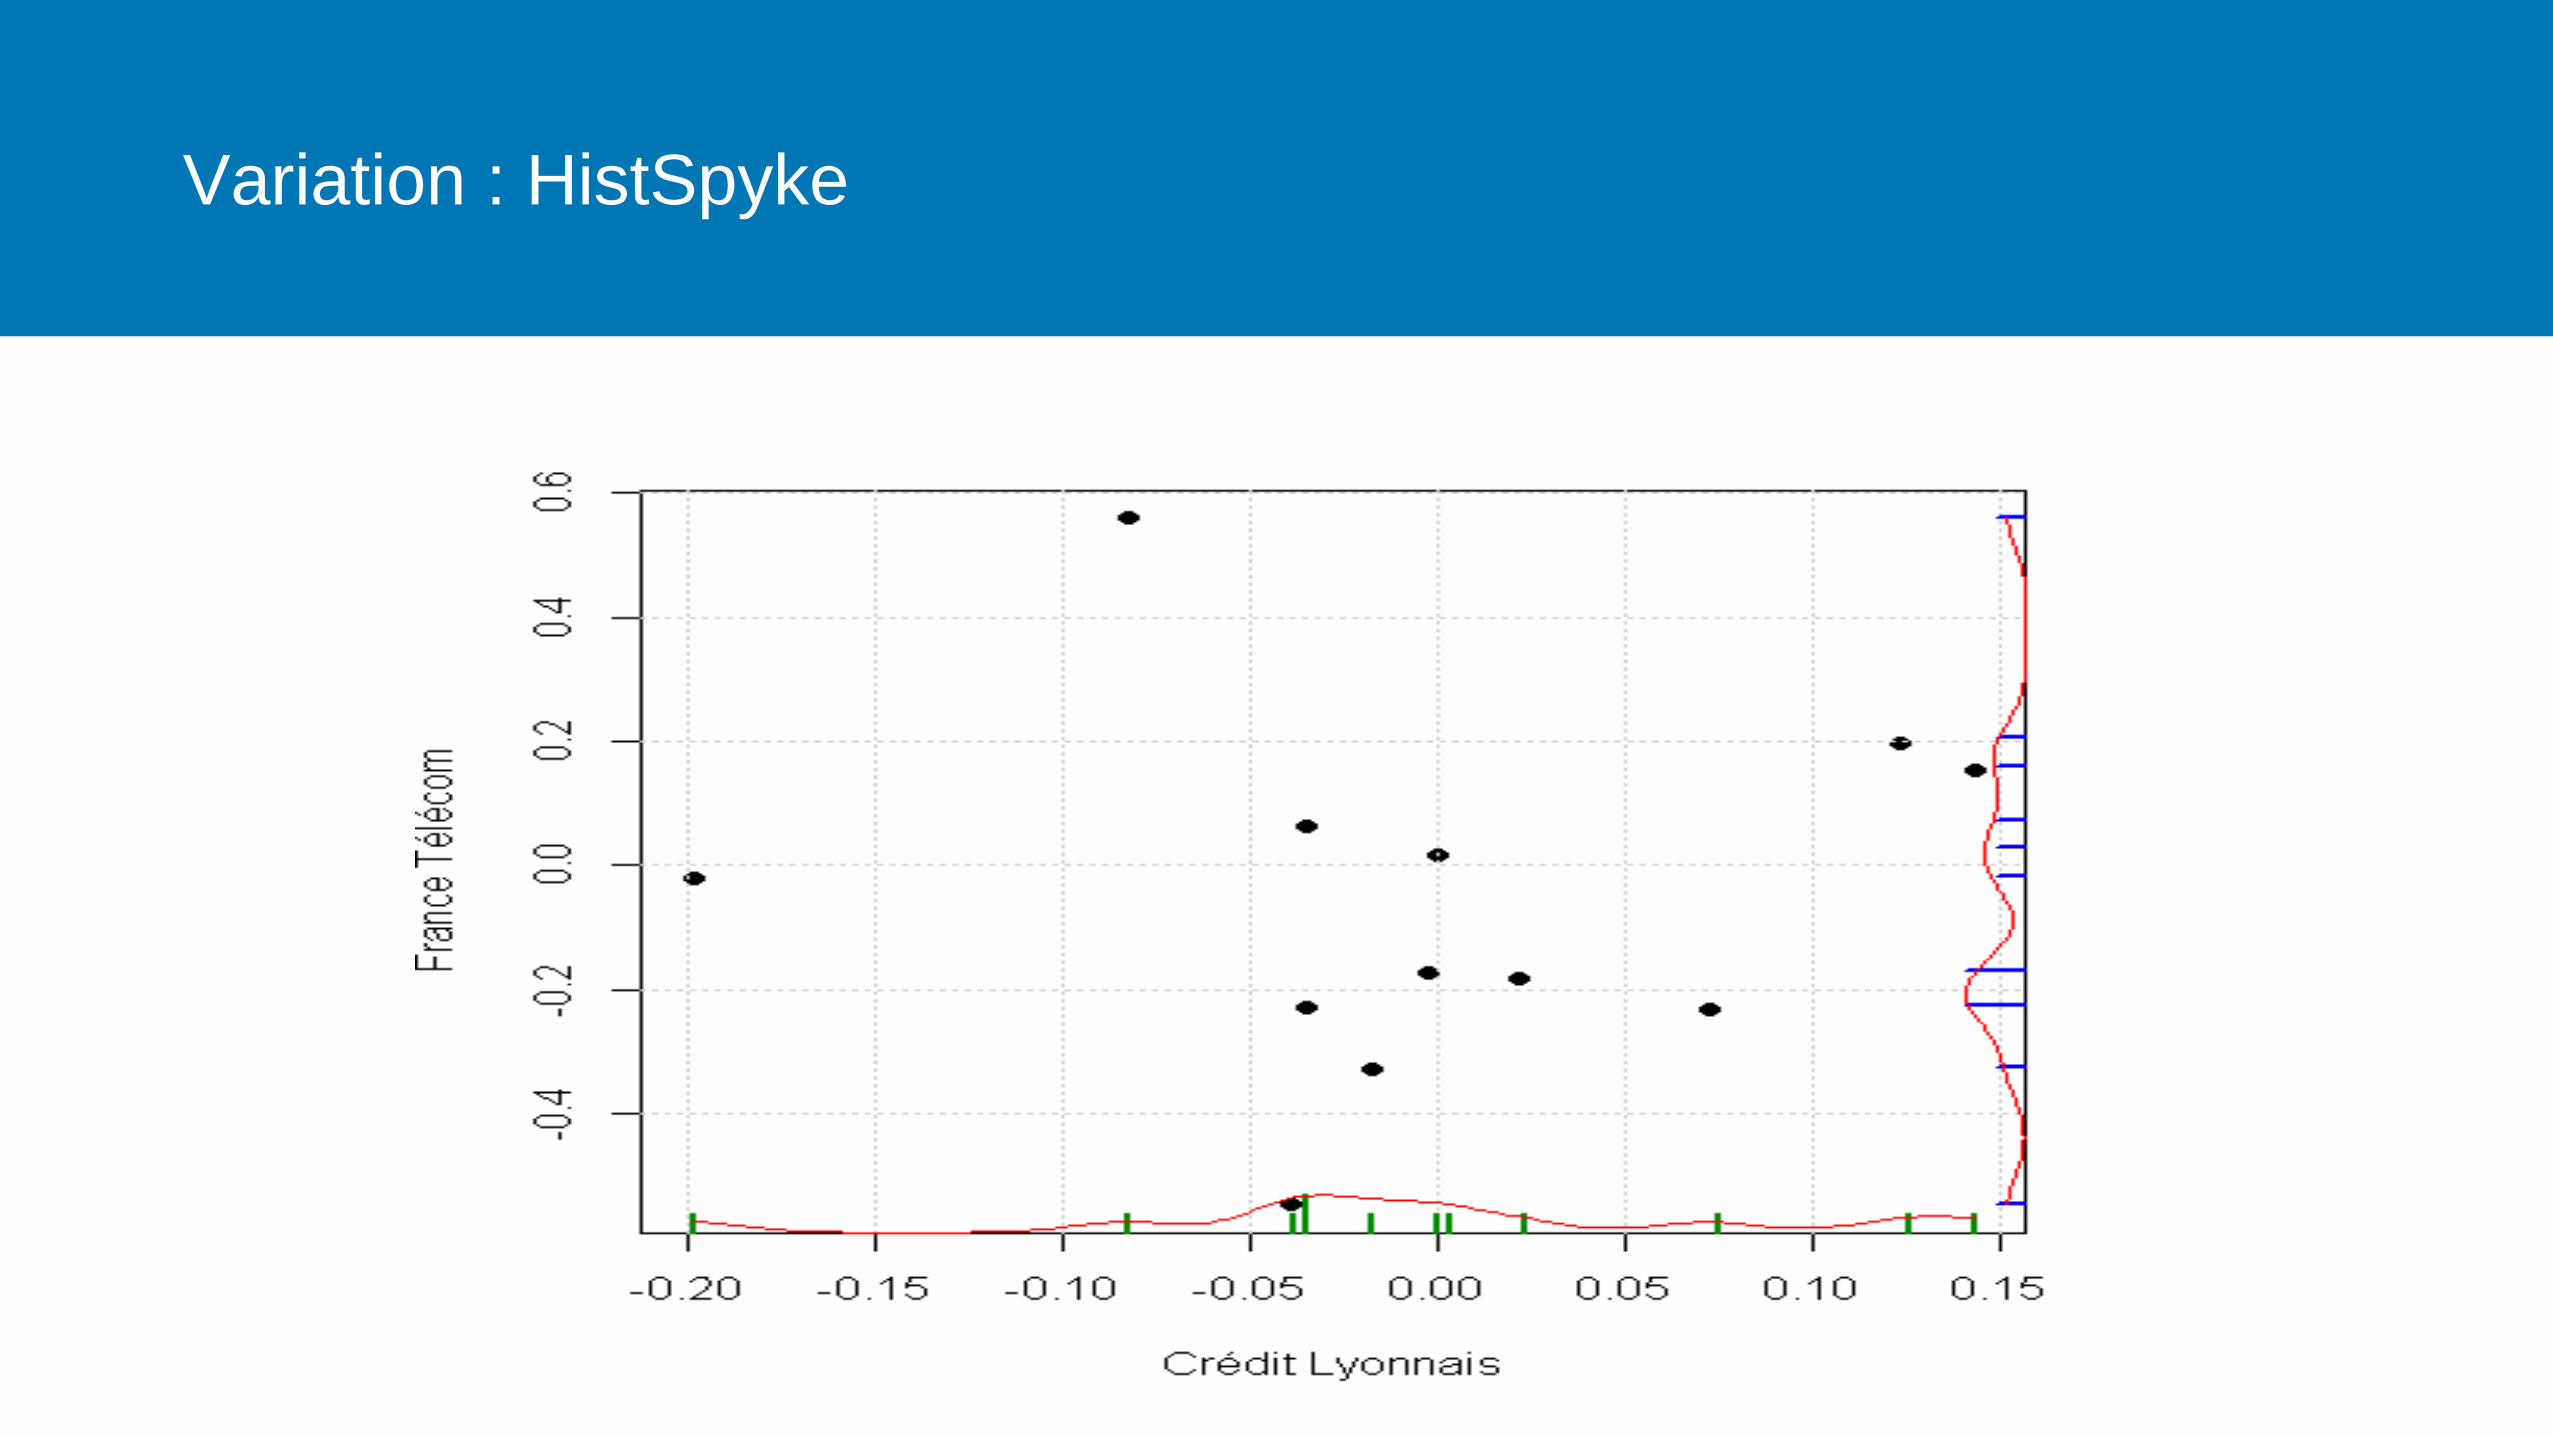
Variation : HistSpyke
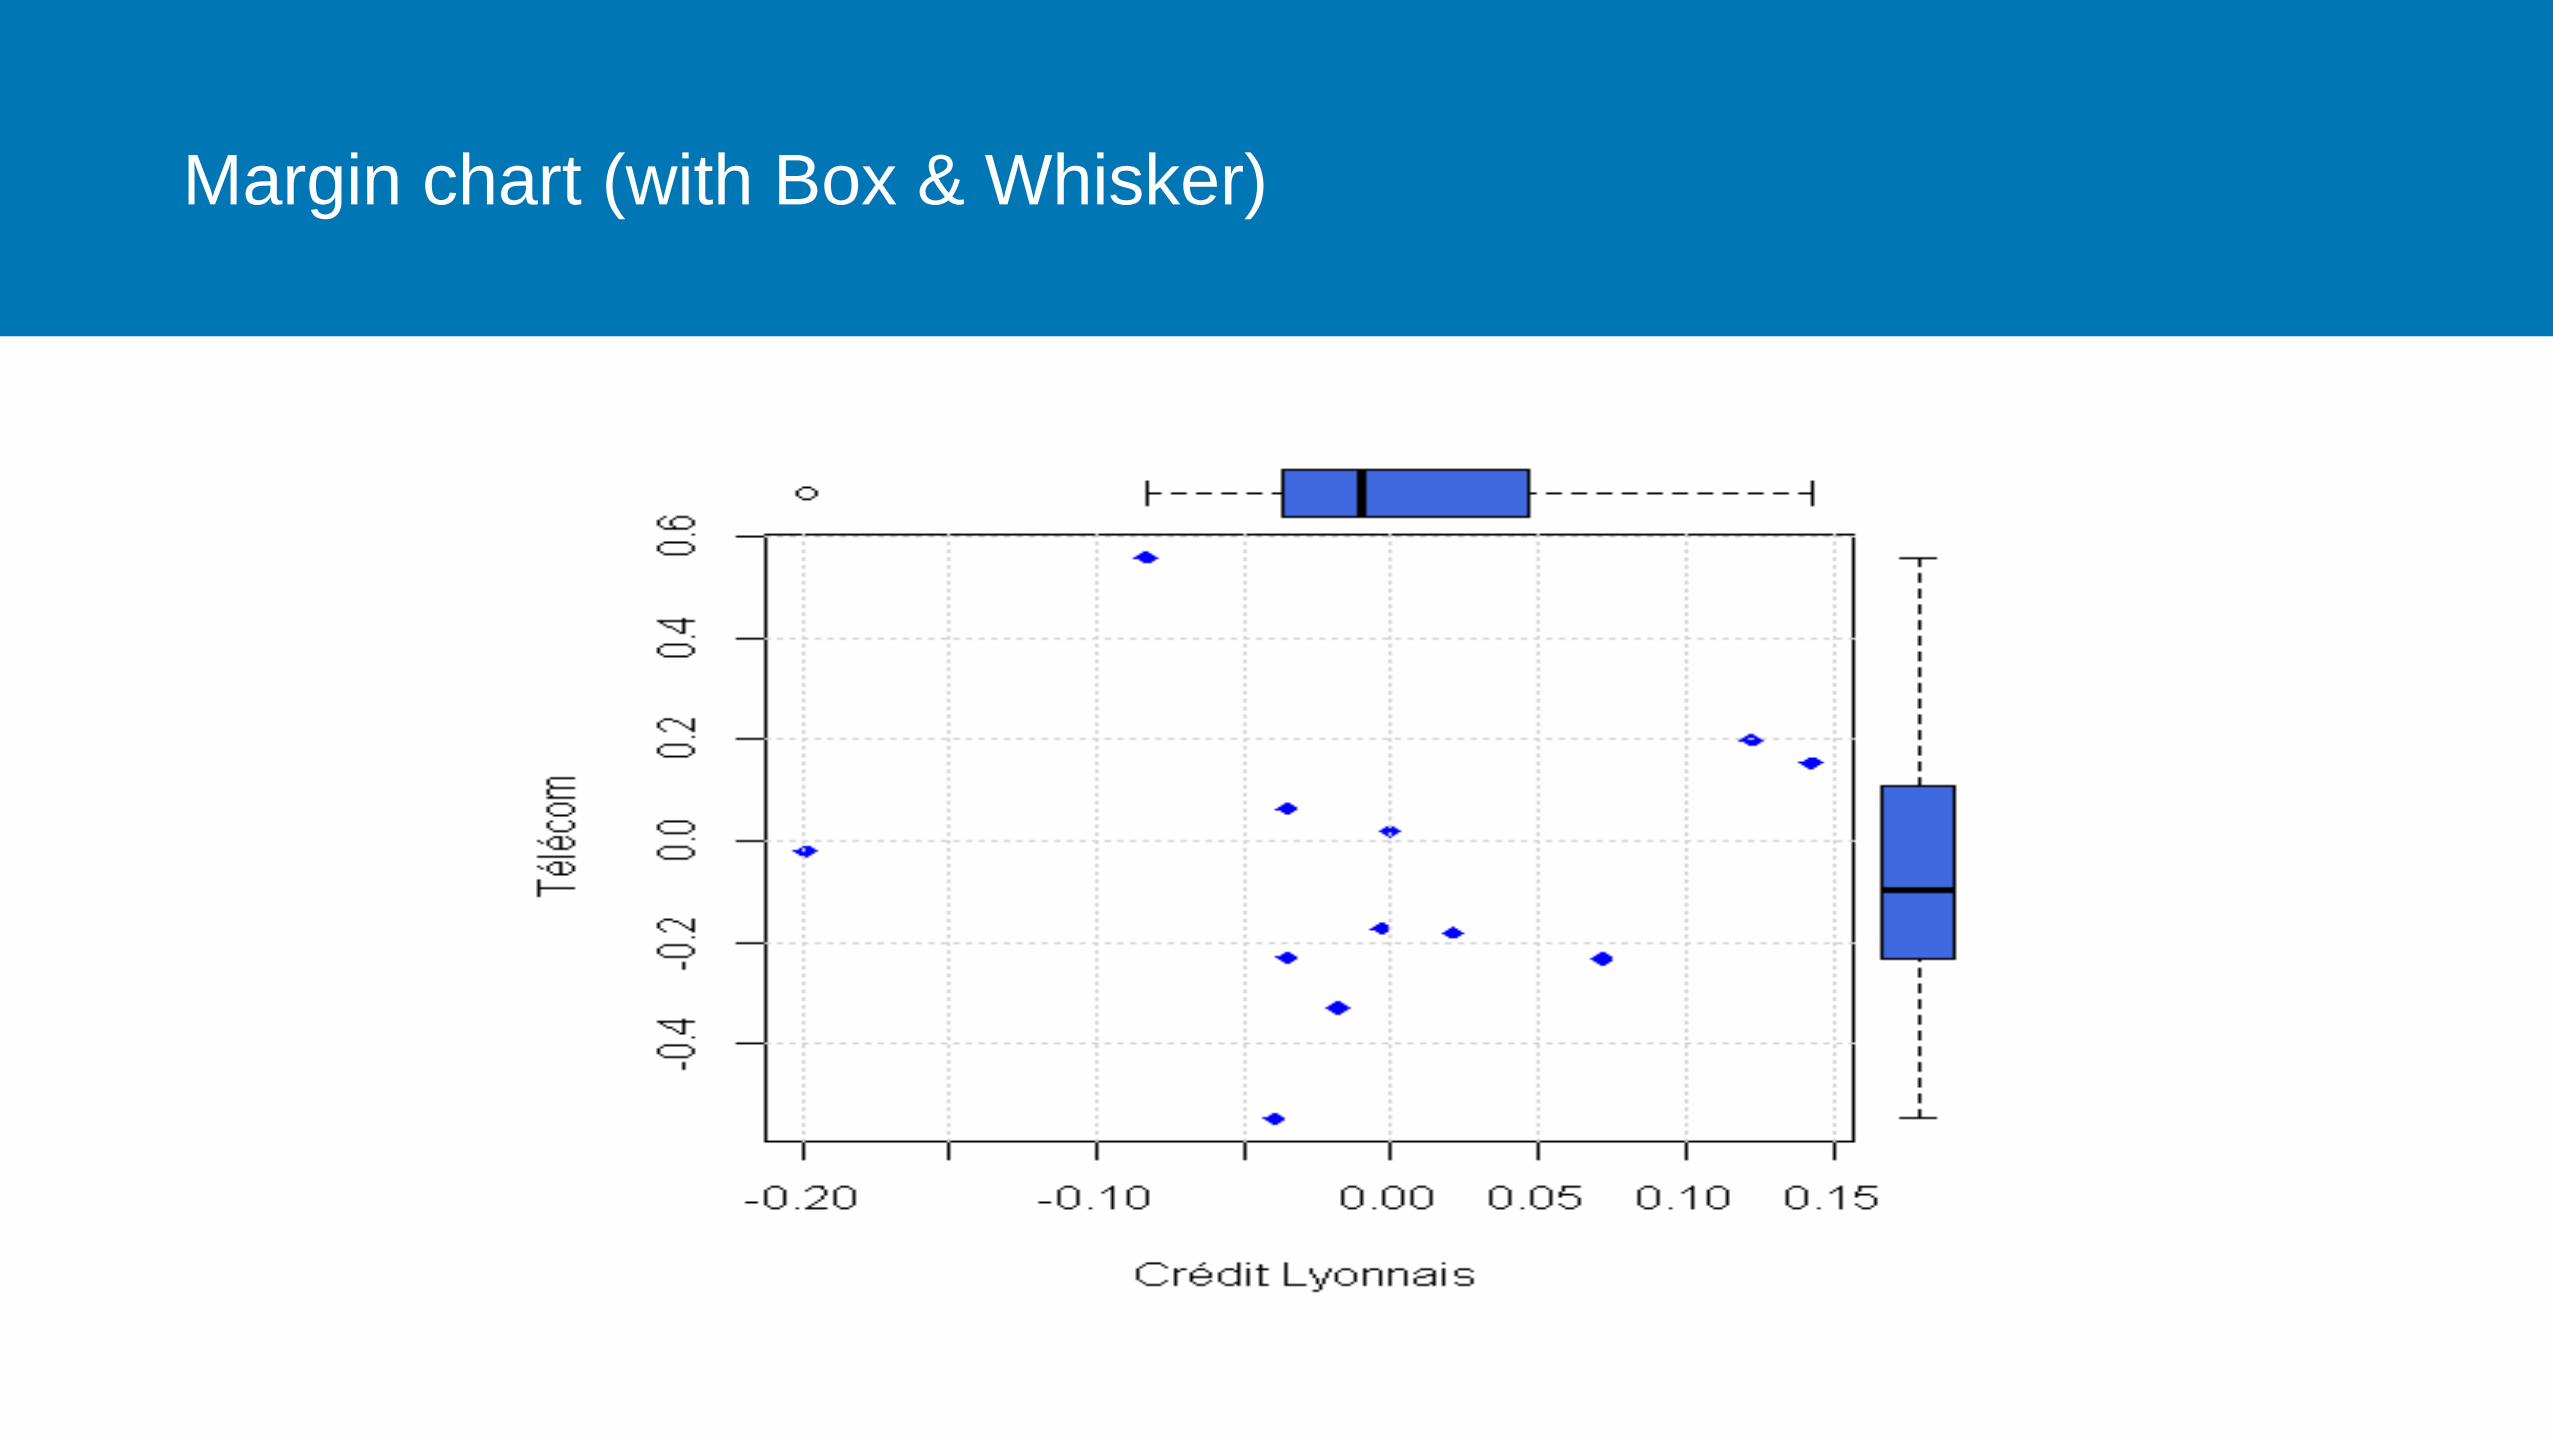
Margin chart (with Box & Whisker)
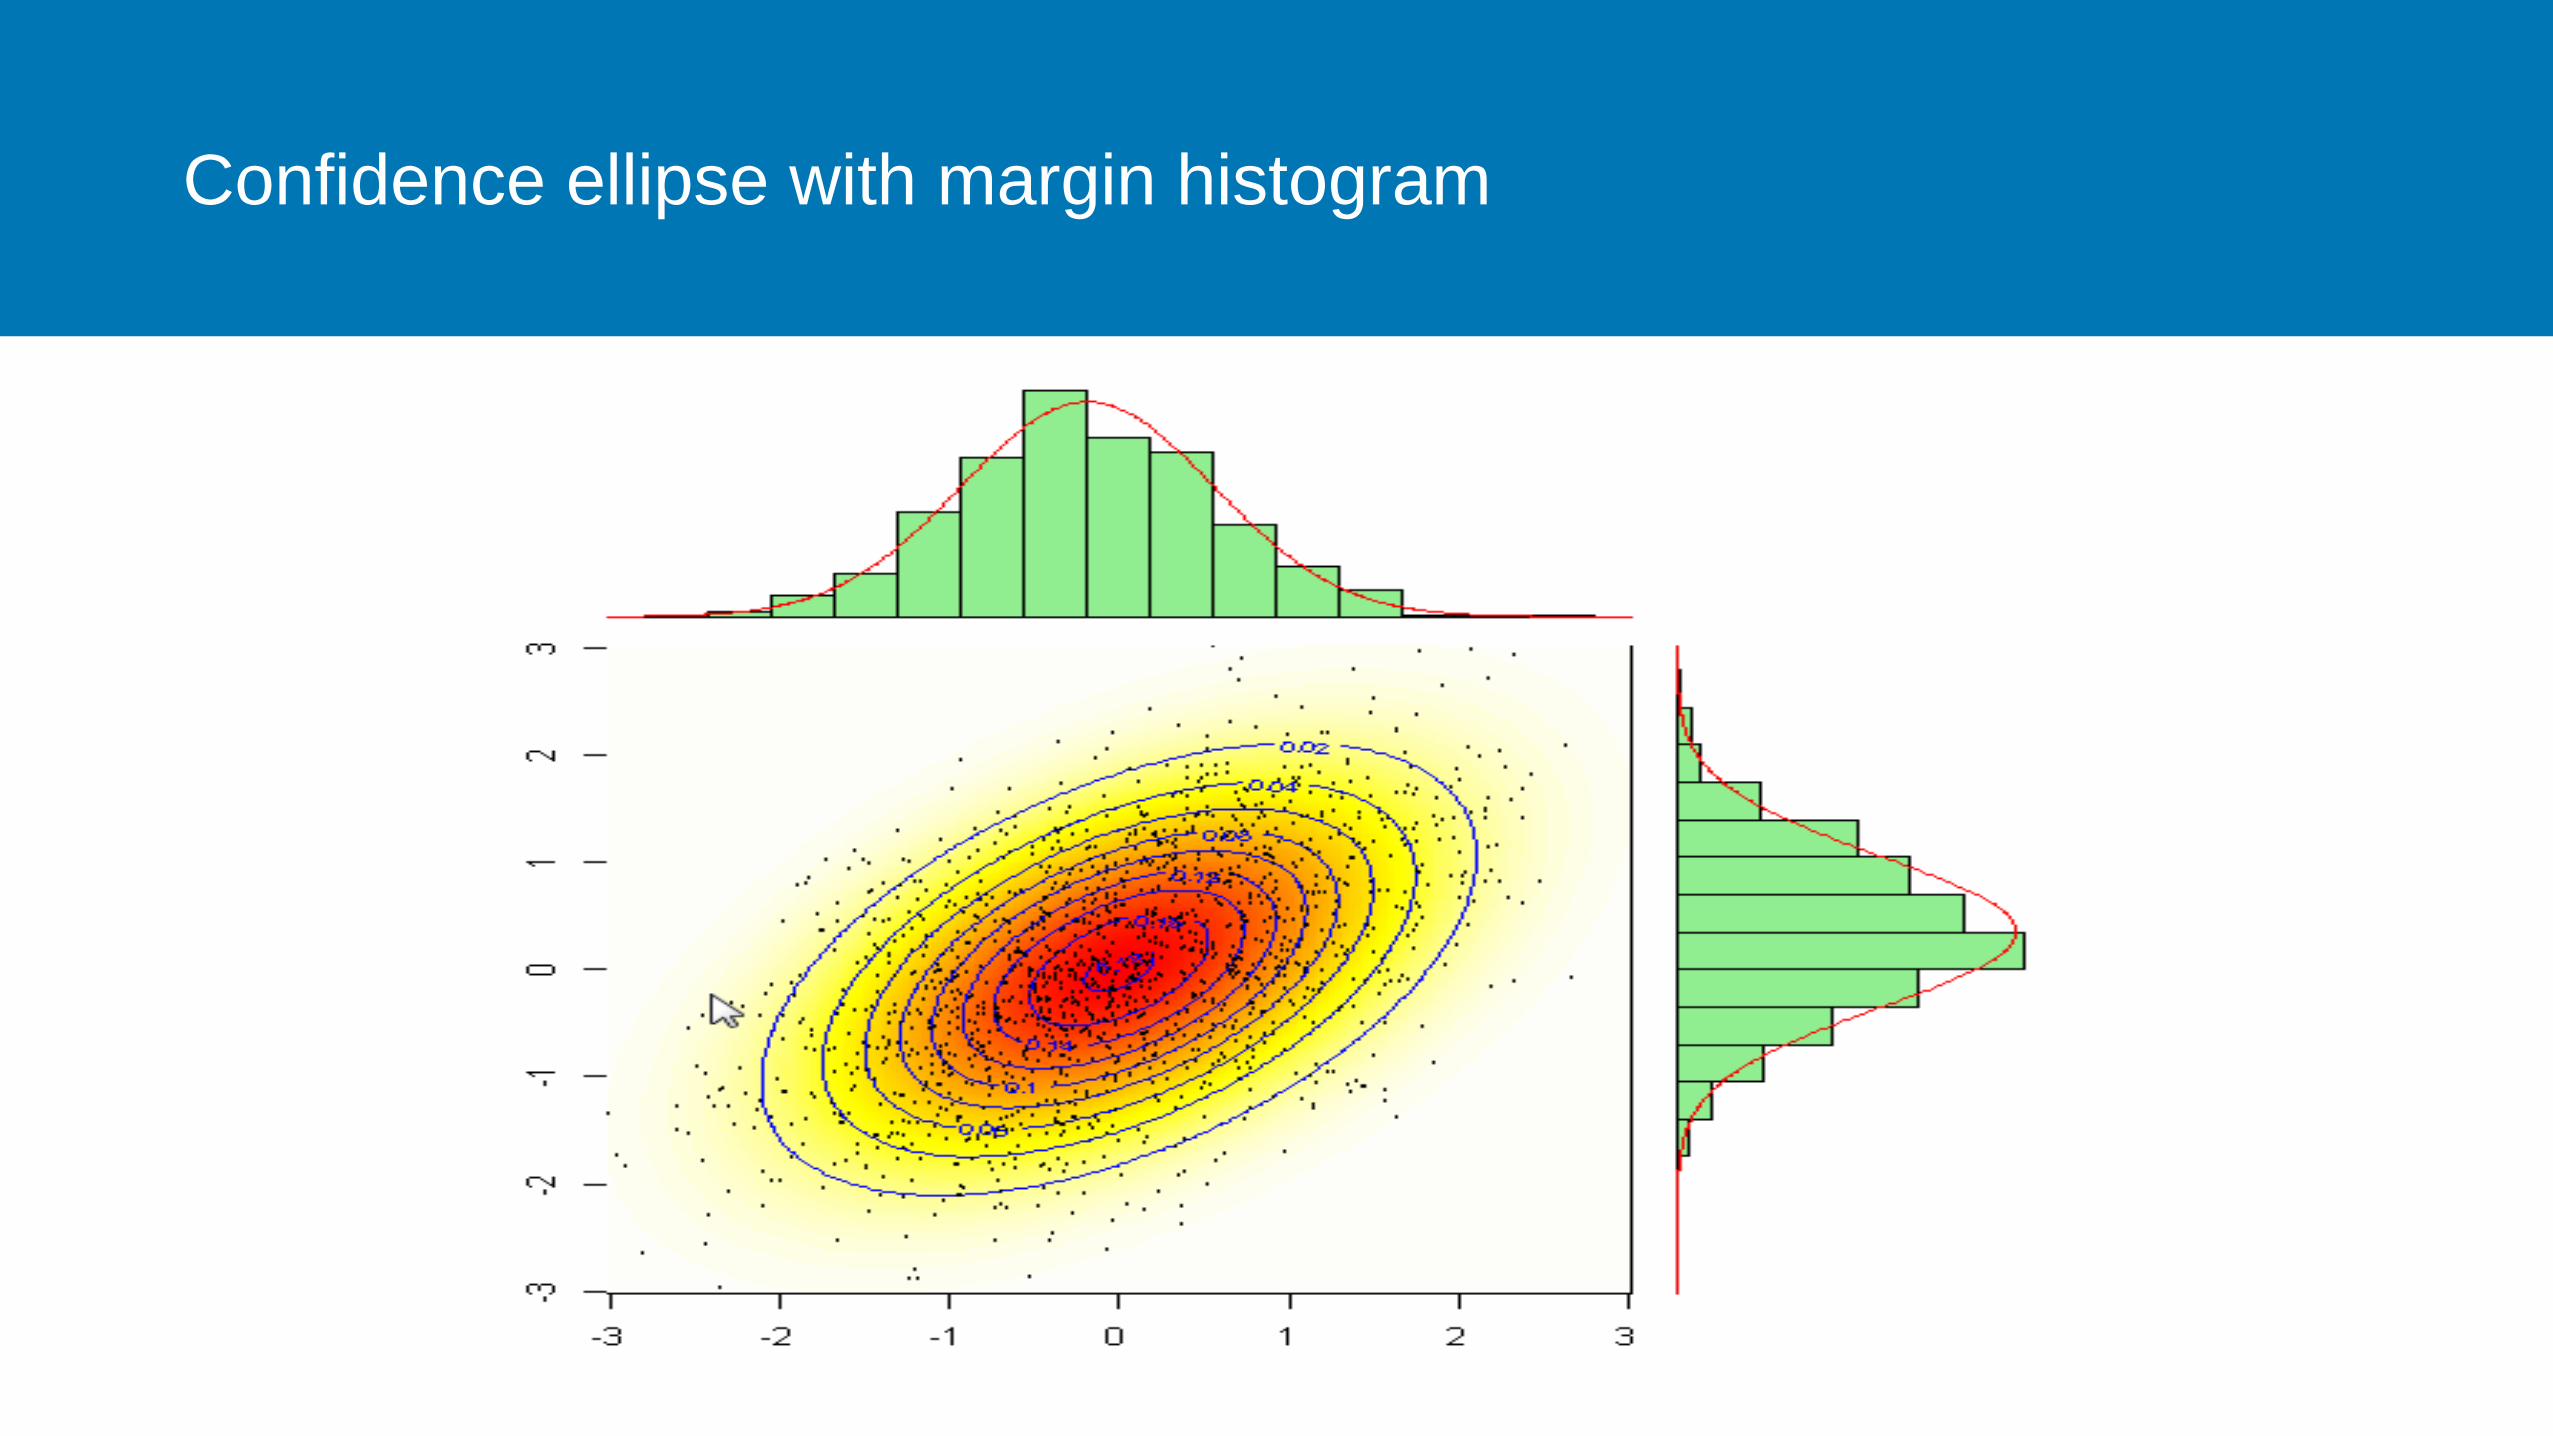
Confidence ellipse with margin histogram

Correlograms

Area Charts

Stacked areas charts

Stream charts

Isodensity curves charts

Ternary charts (mixtures charts)
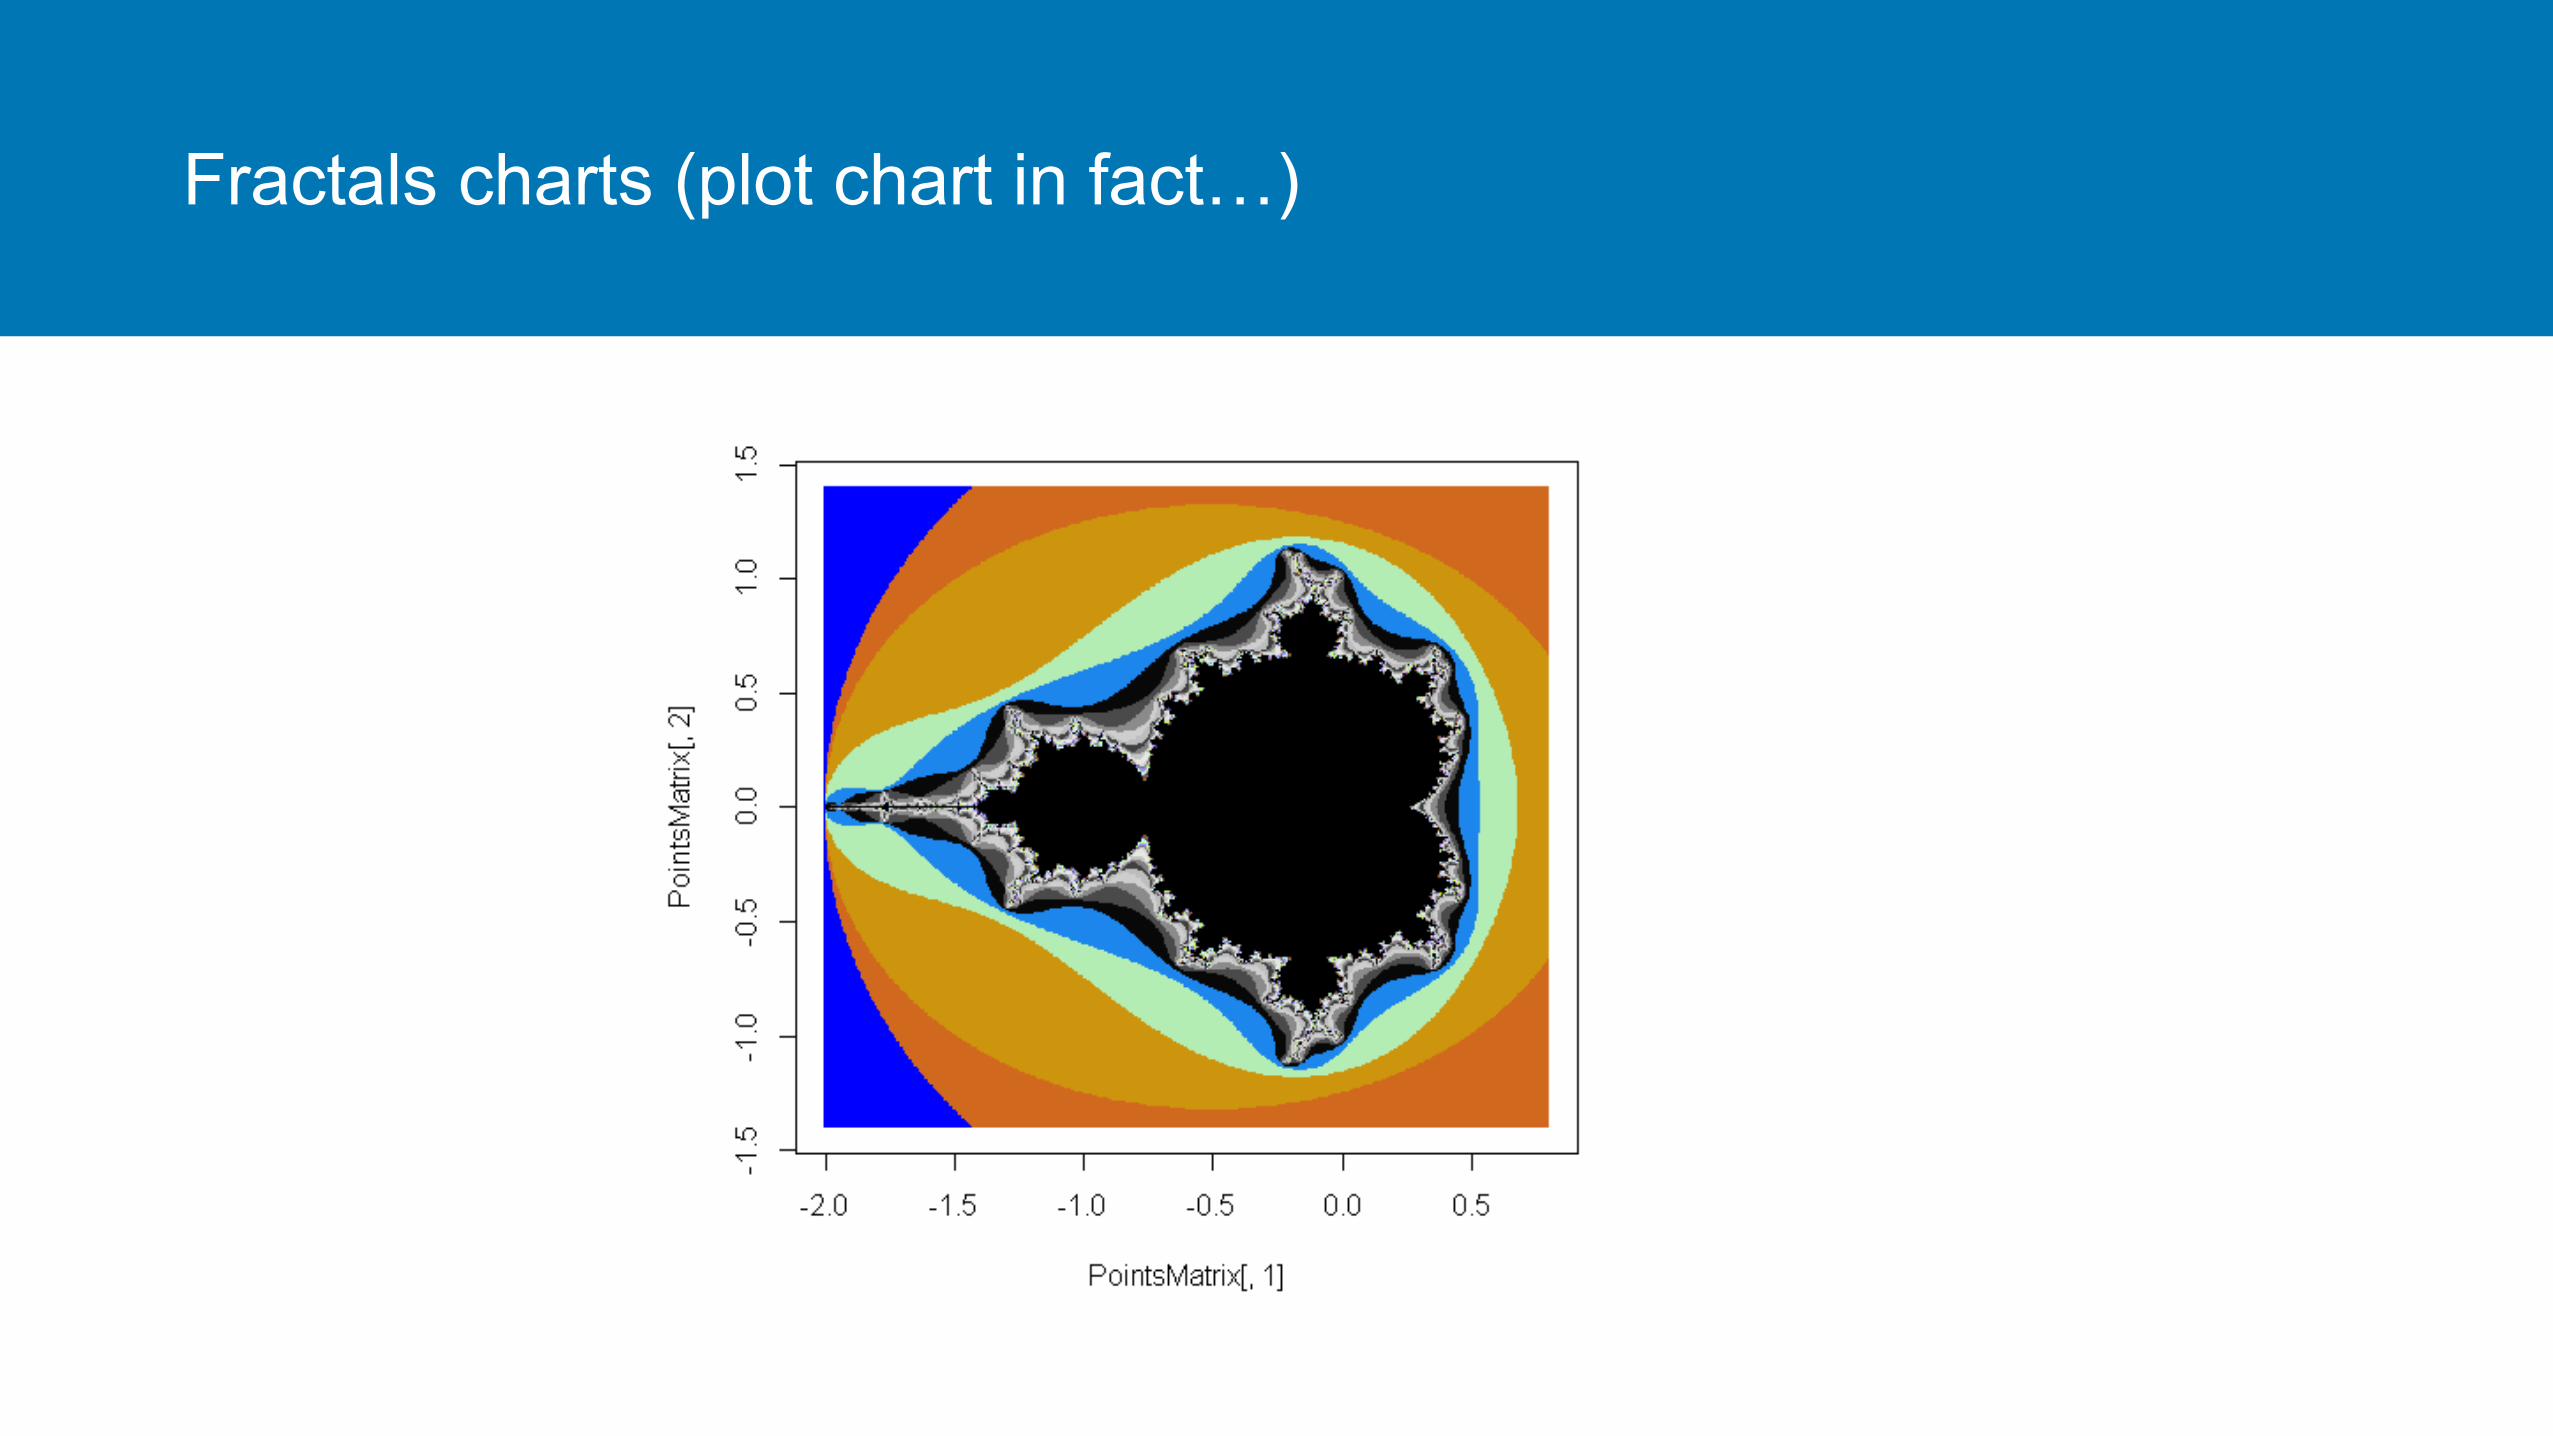
Fractals charts (plot chart in fact…)

Funnel chart

Link/Flow Charts
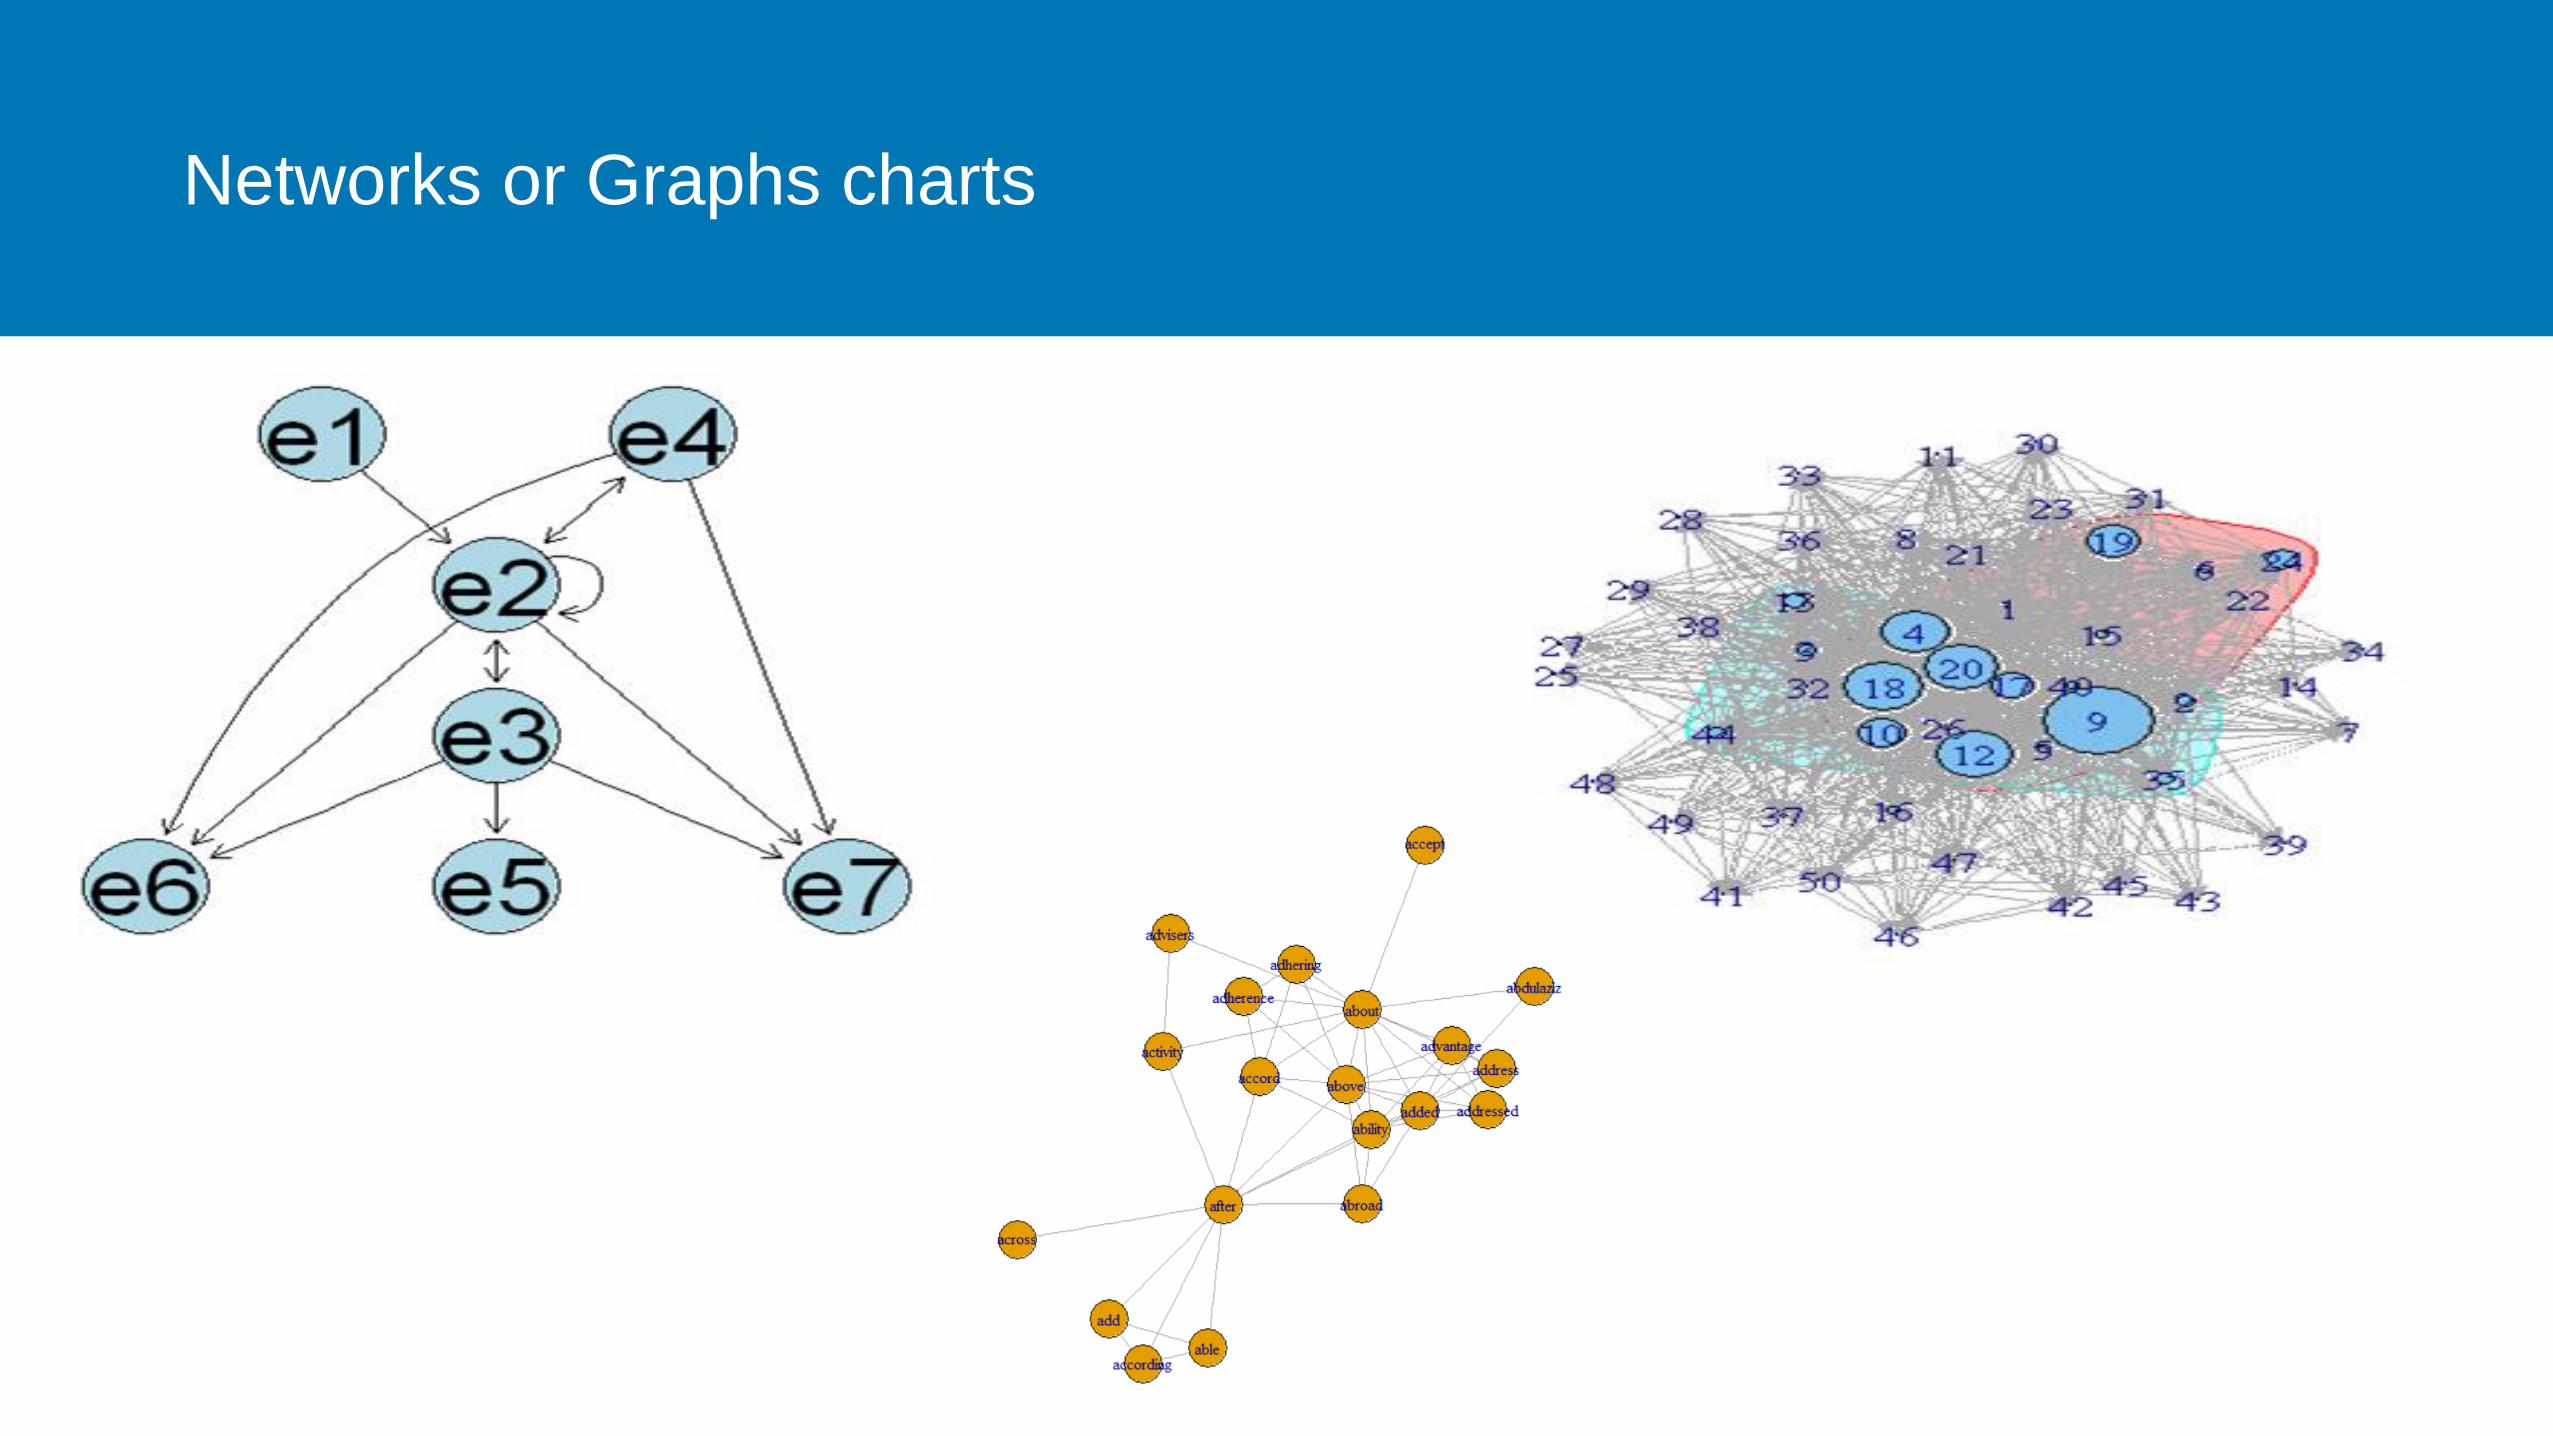
Networks or Graphs charts
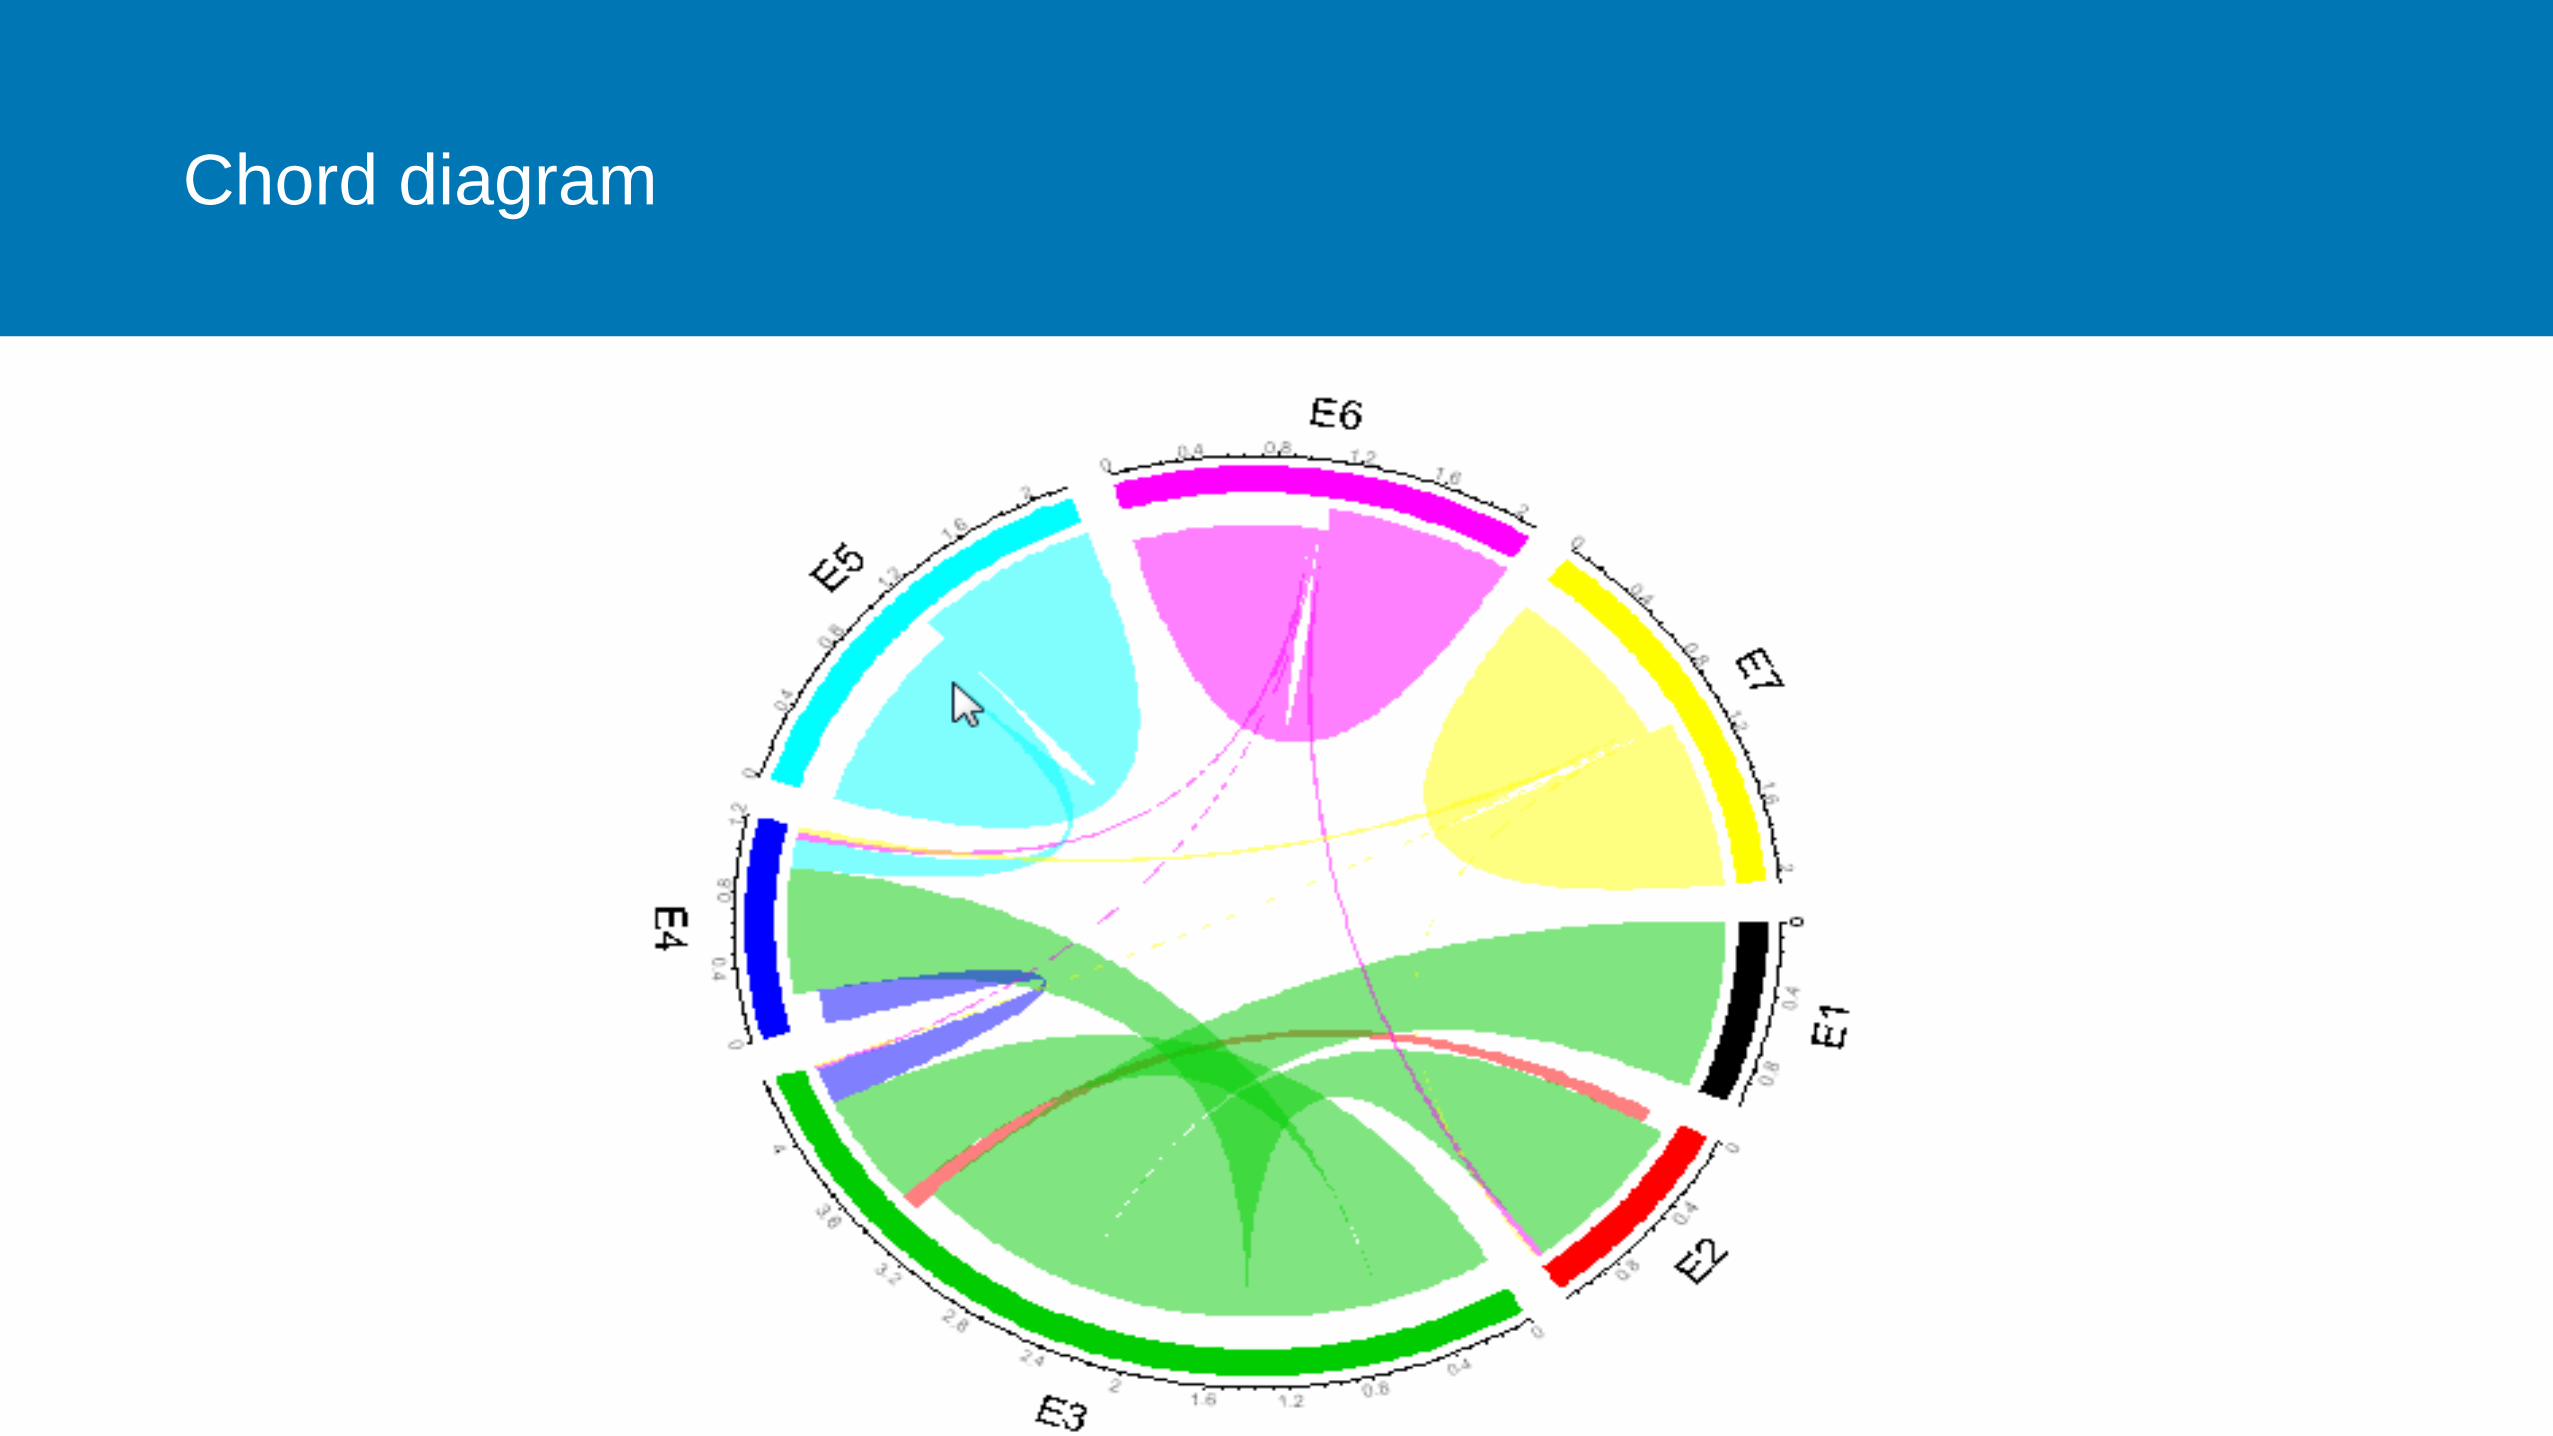
Chord diagram

Neural Network
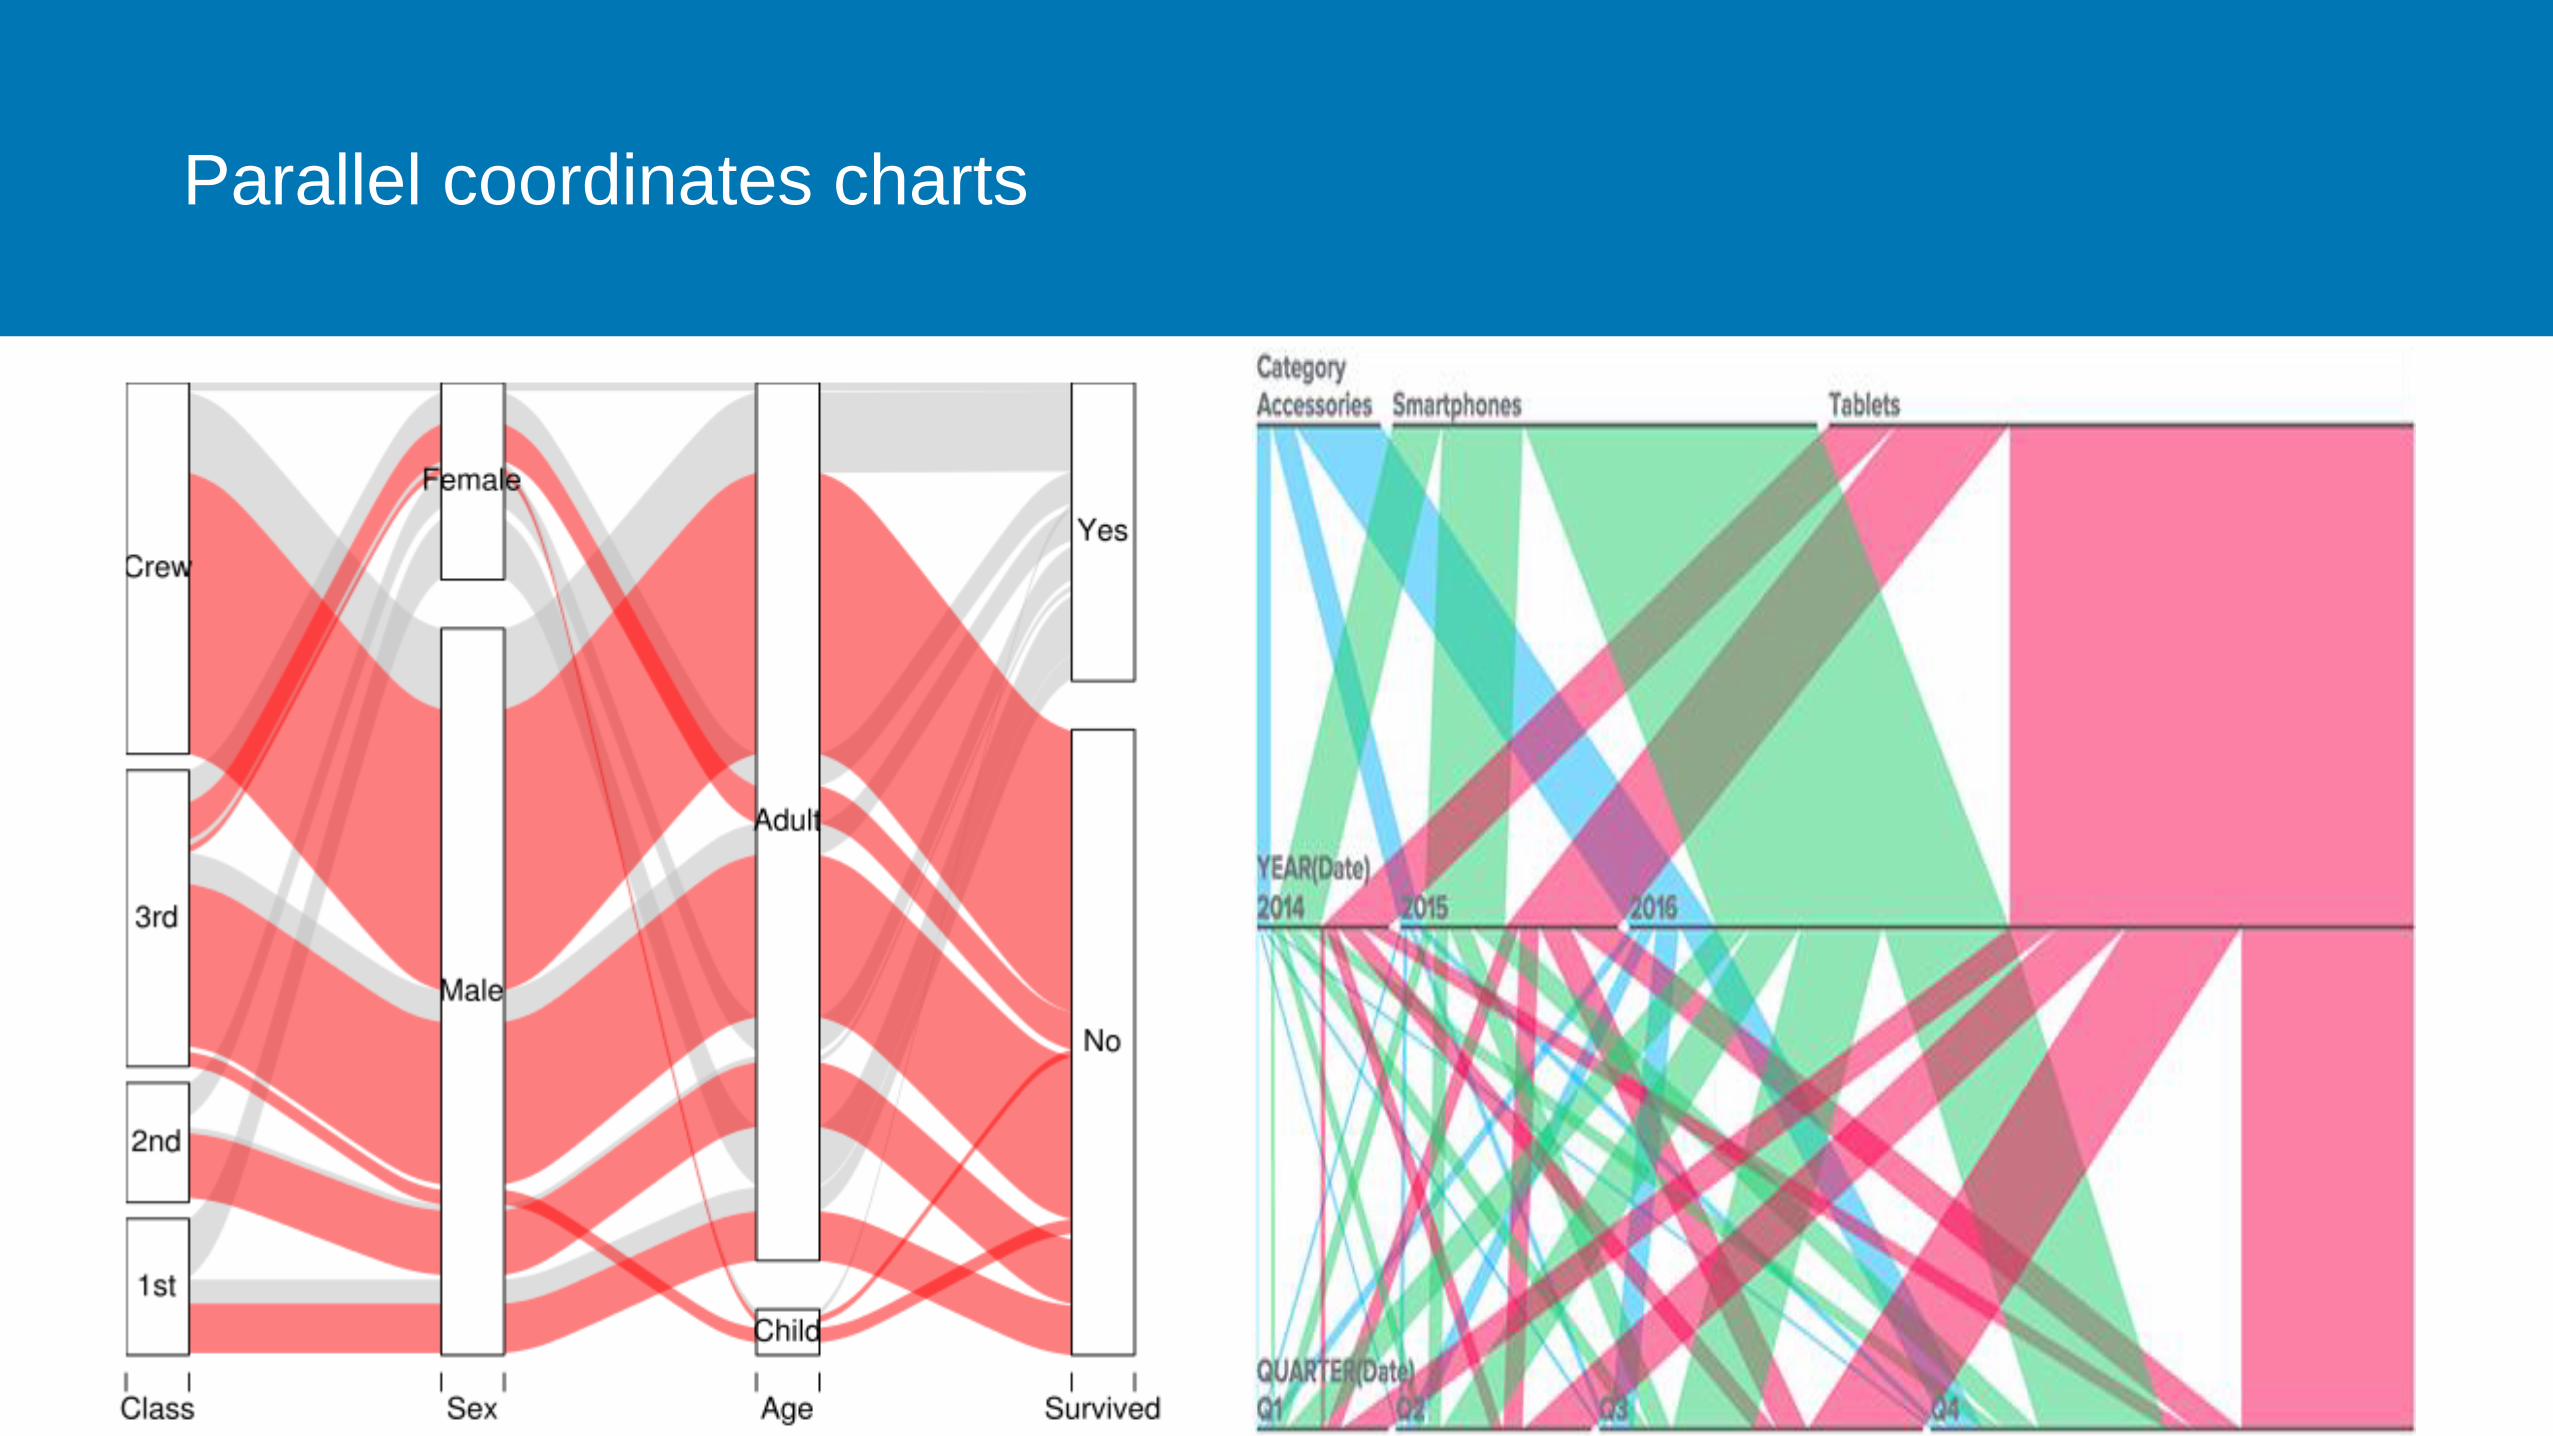
Parallel coordinates charts

Arc-connection chart

3D Charts

3D Bar chart

3D Sectors chart

3D Surfaces
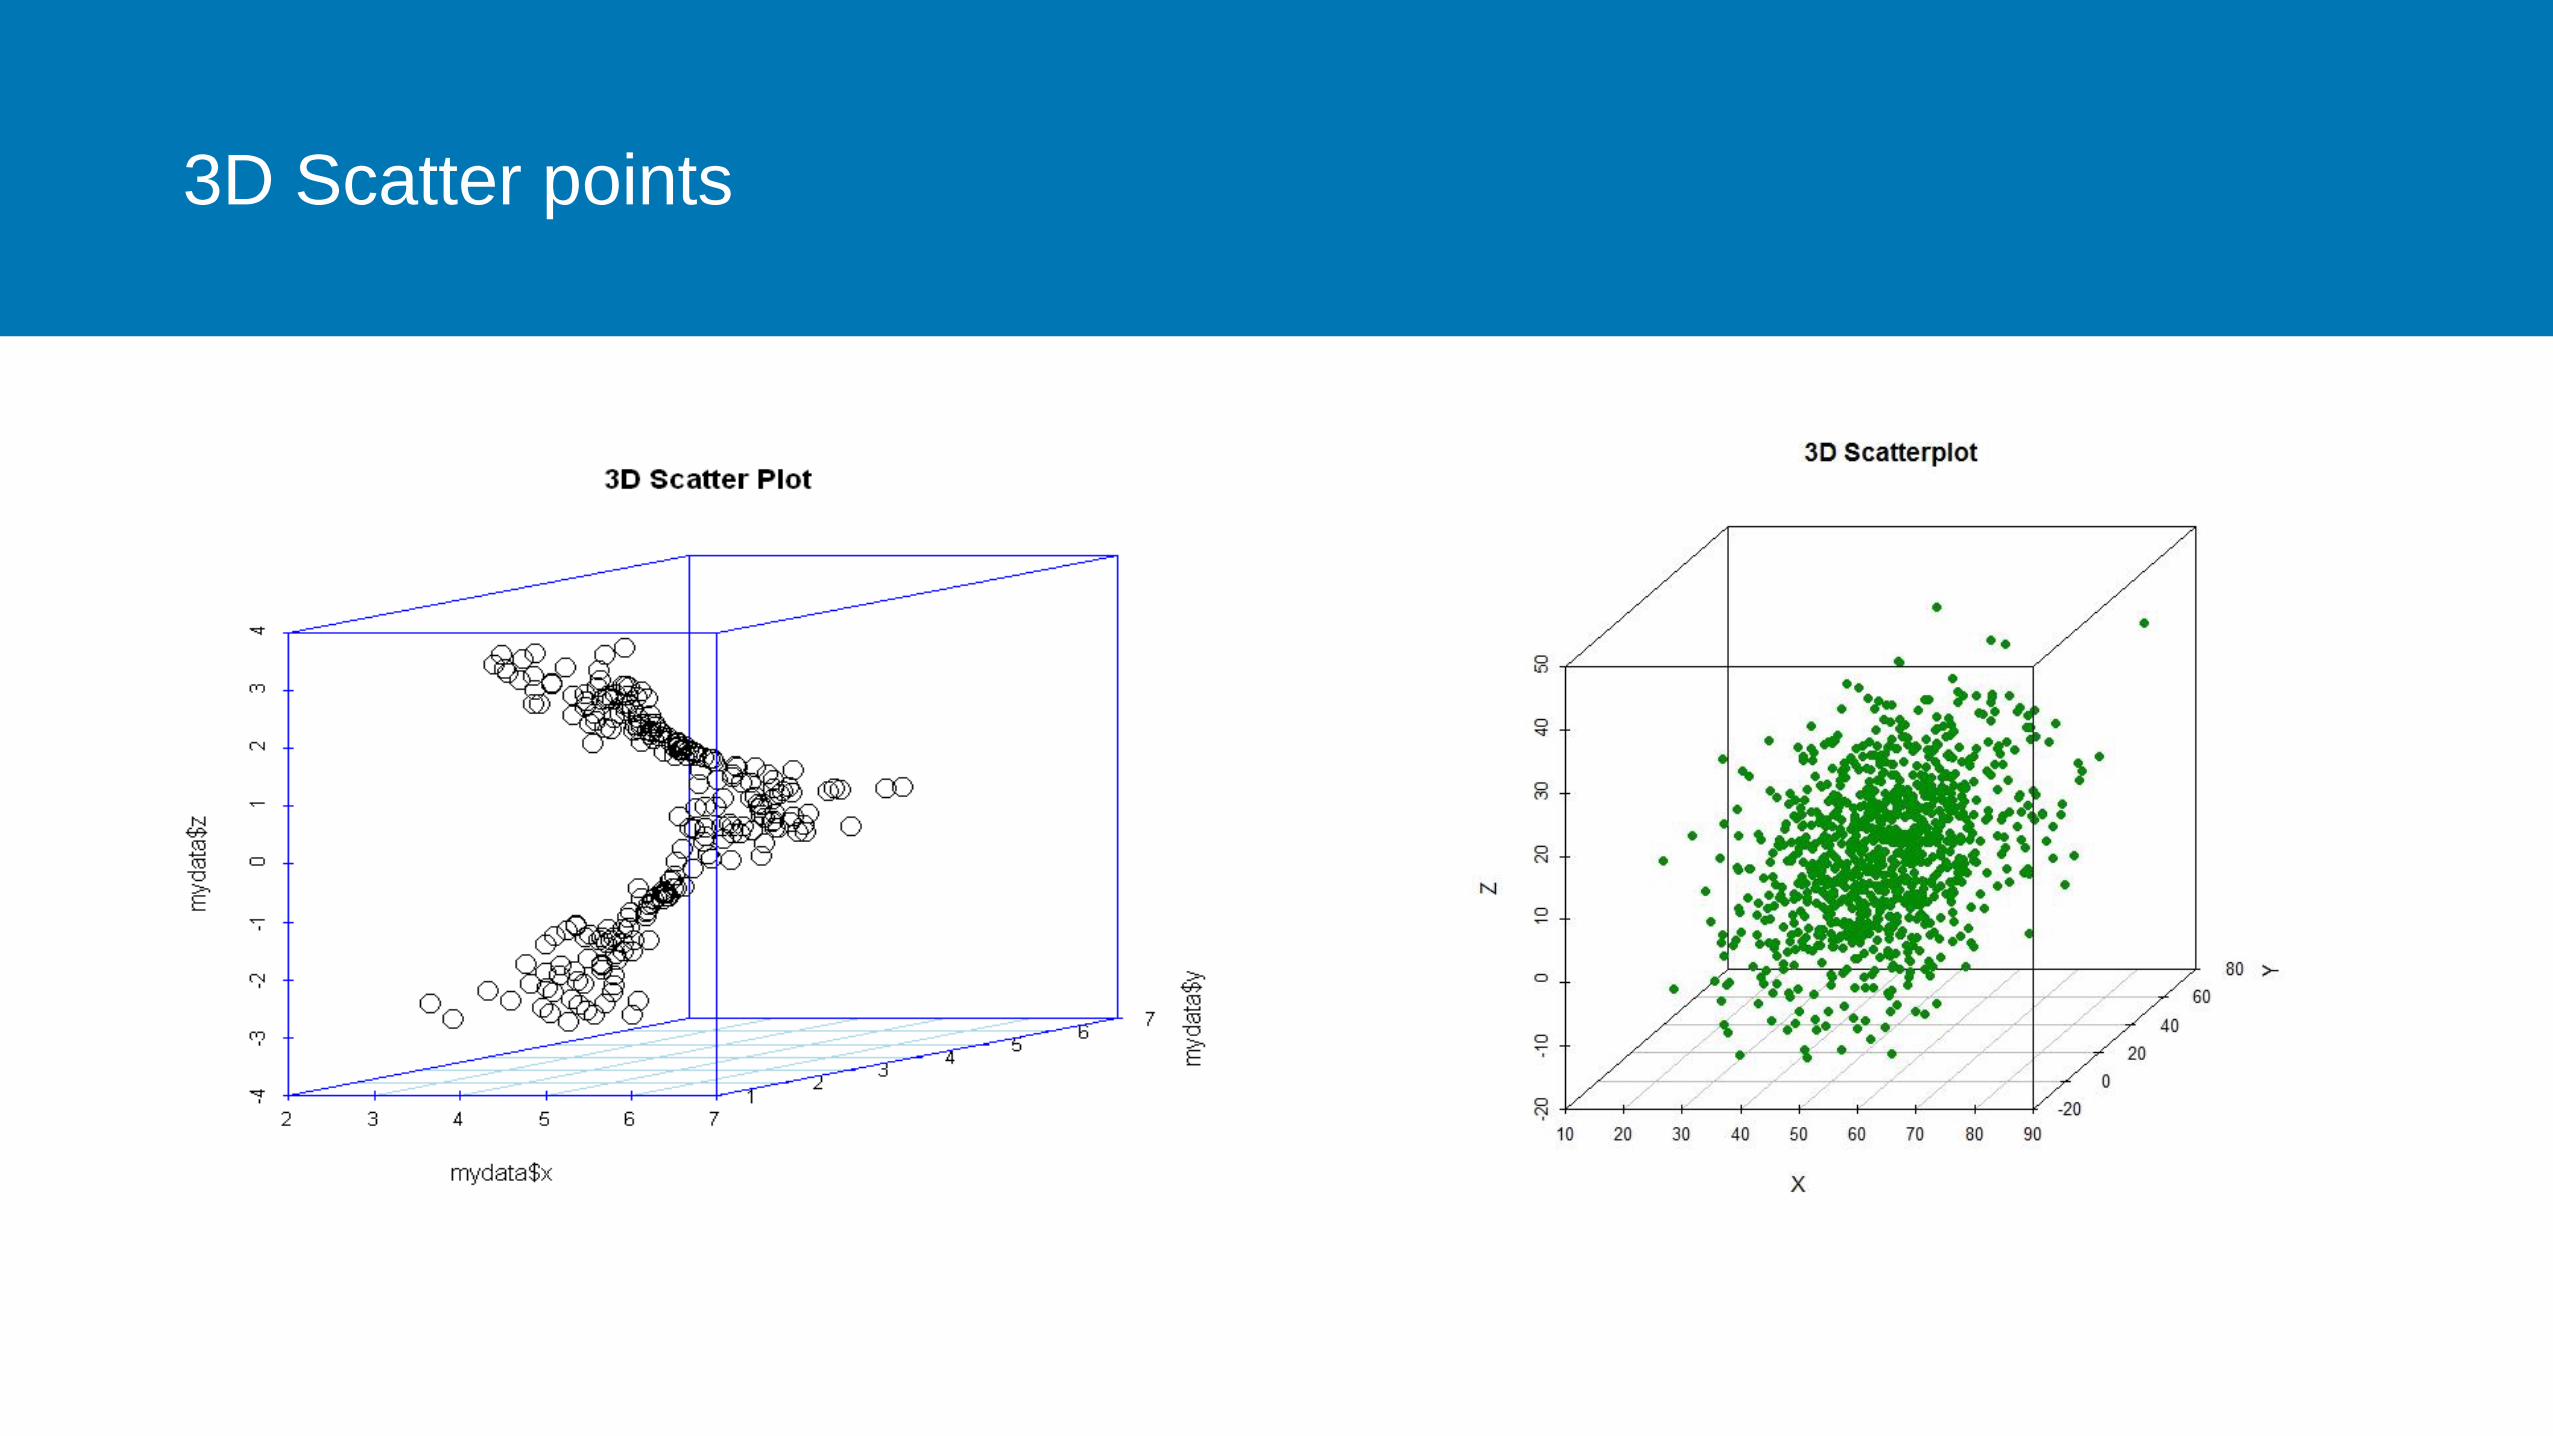
3D Scatter points

3D Bivariate Regression (without/with confidence ellipsoid)
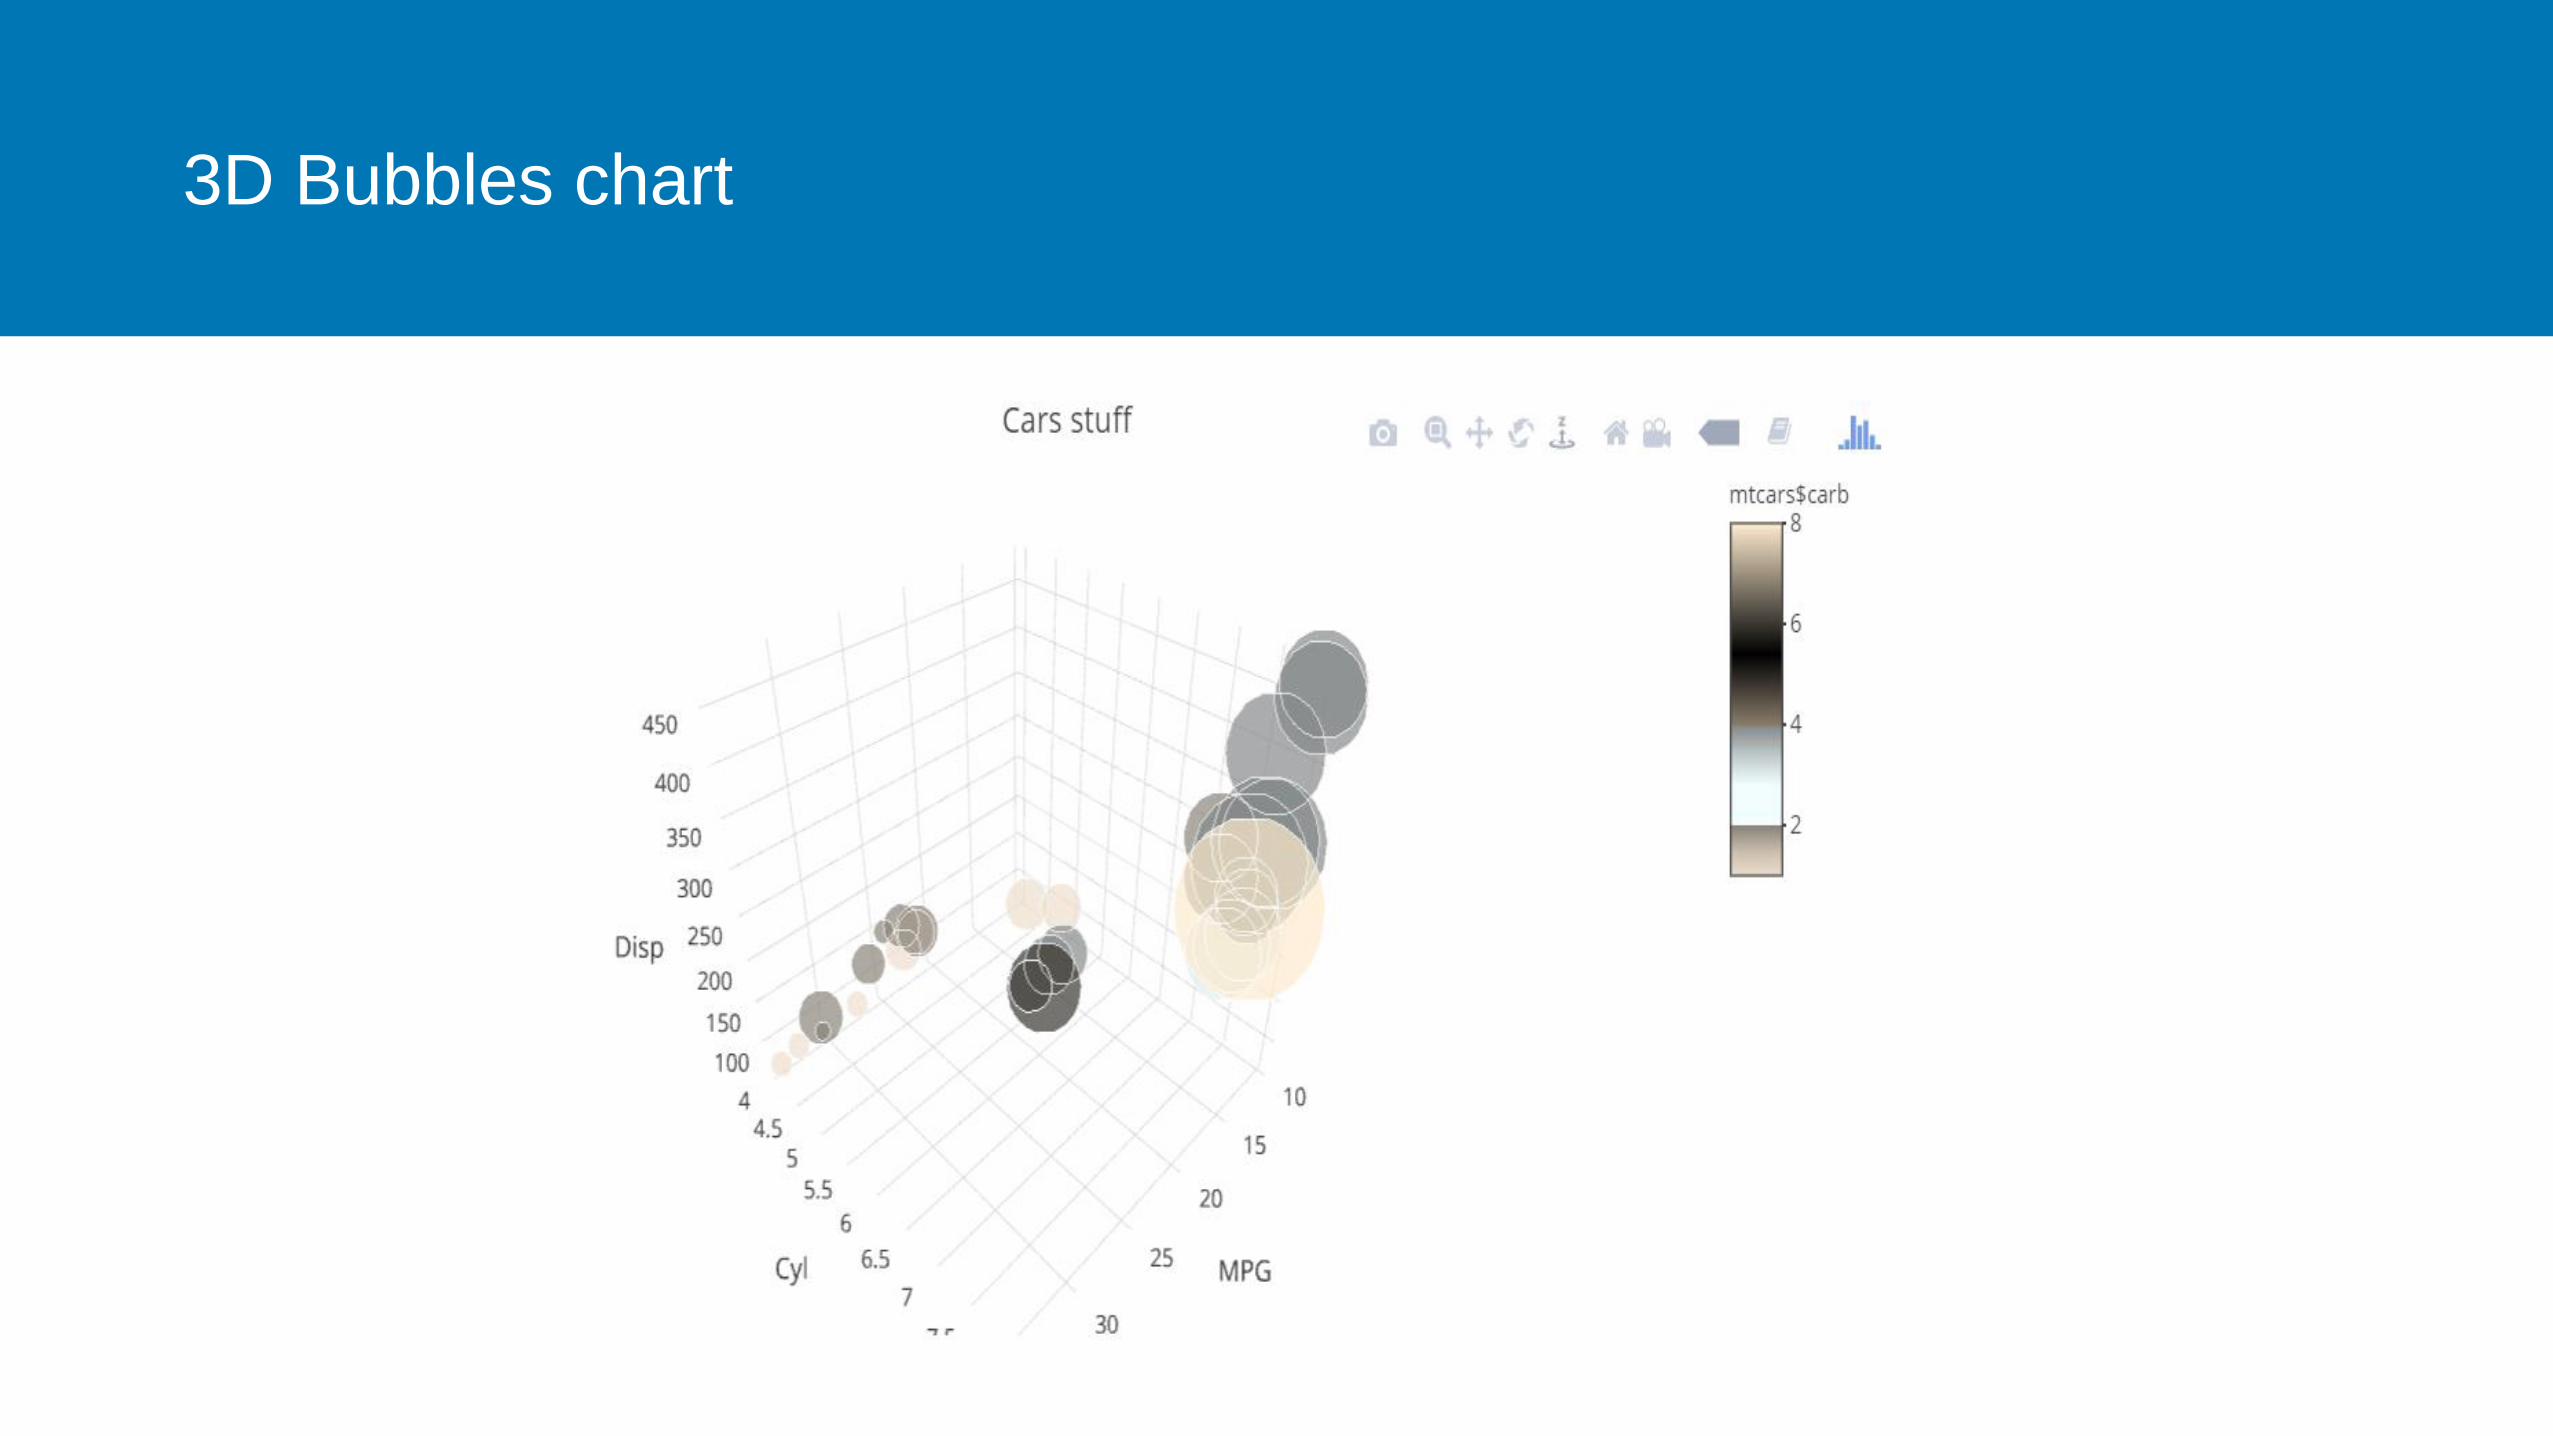
3D Bubbles chart
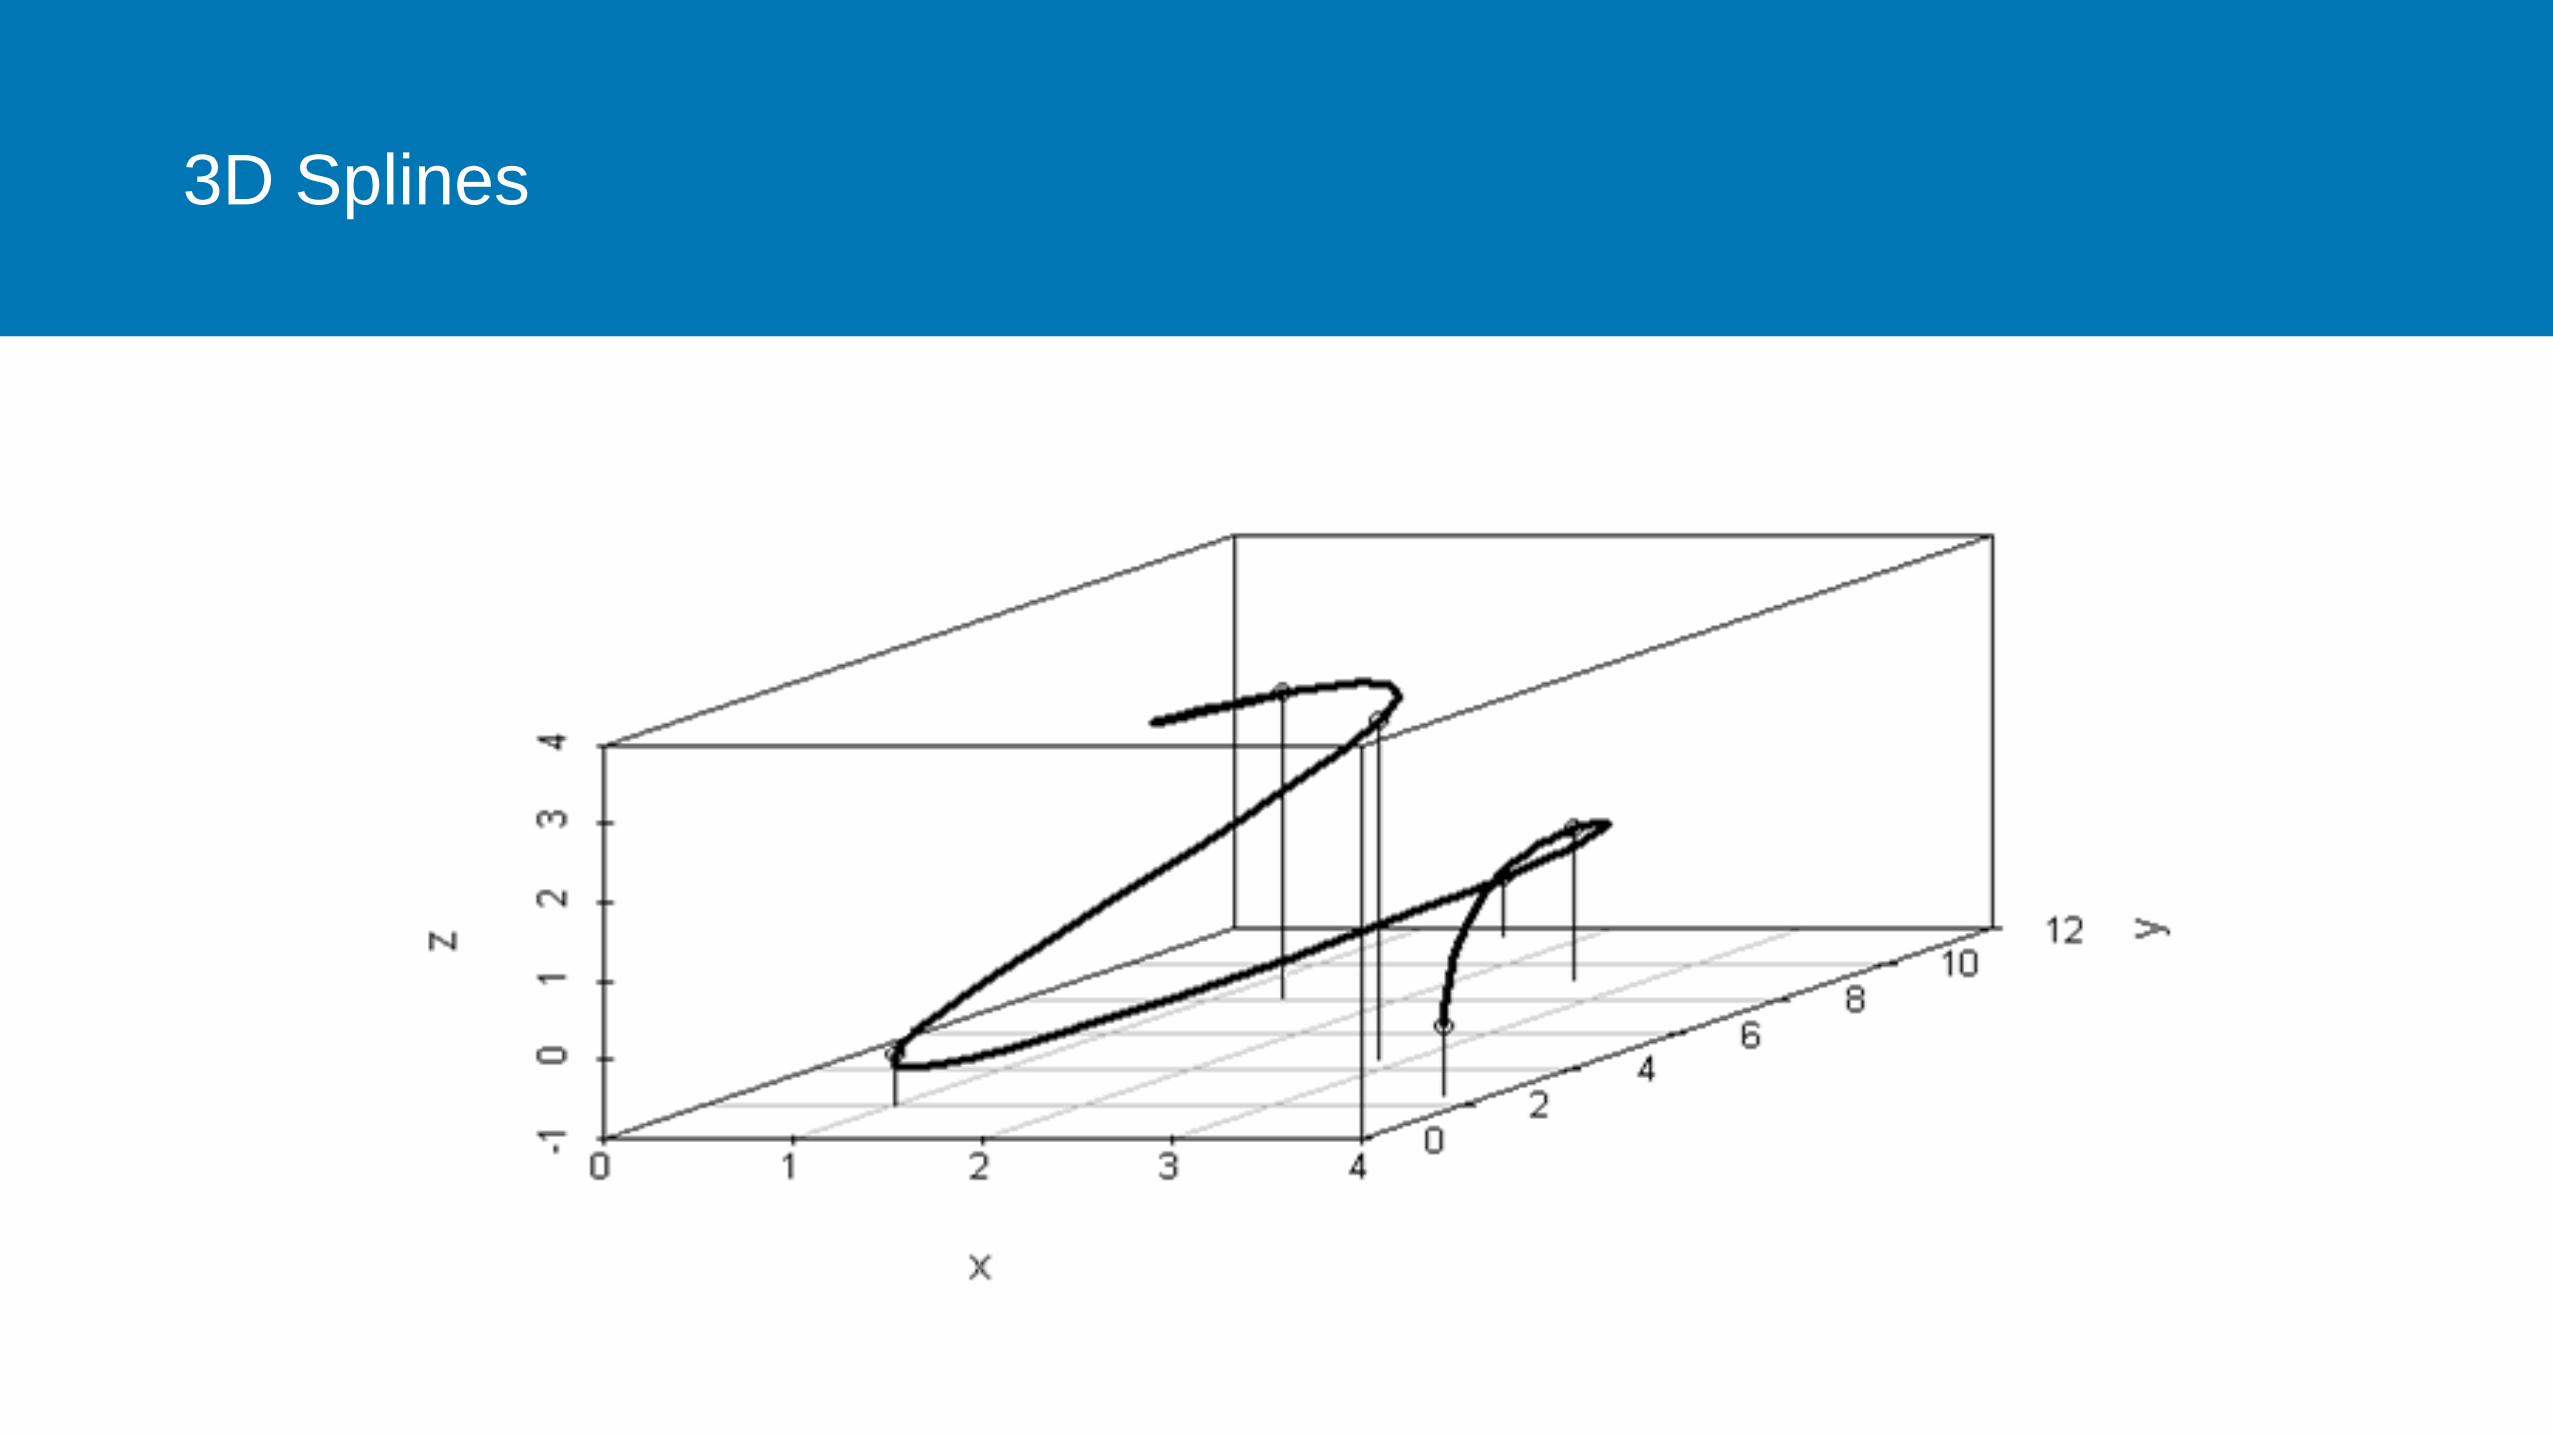
3D Splines

3D Slices chart

Management Charts
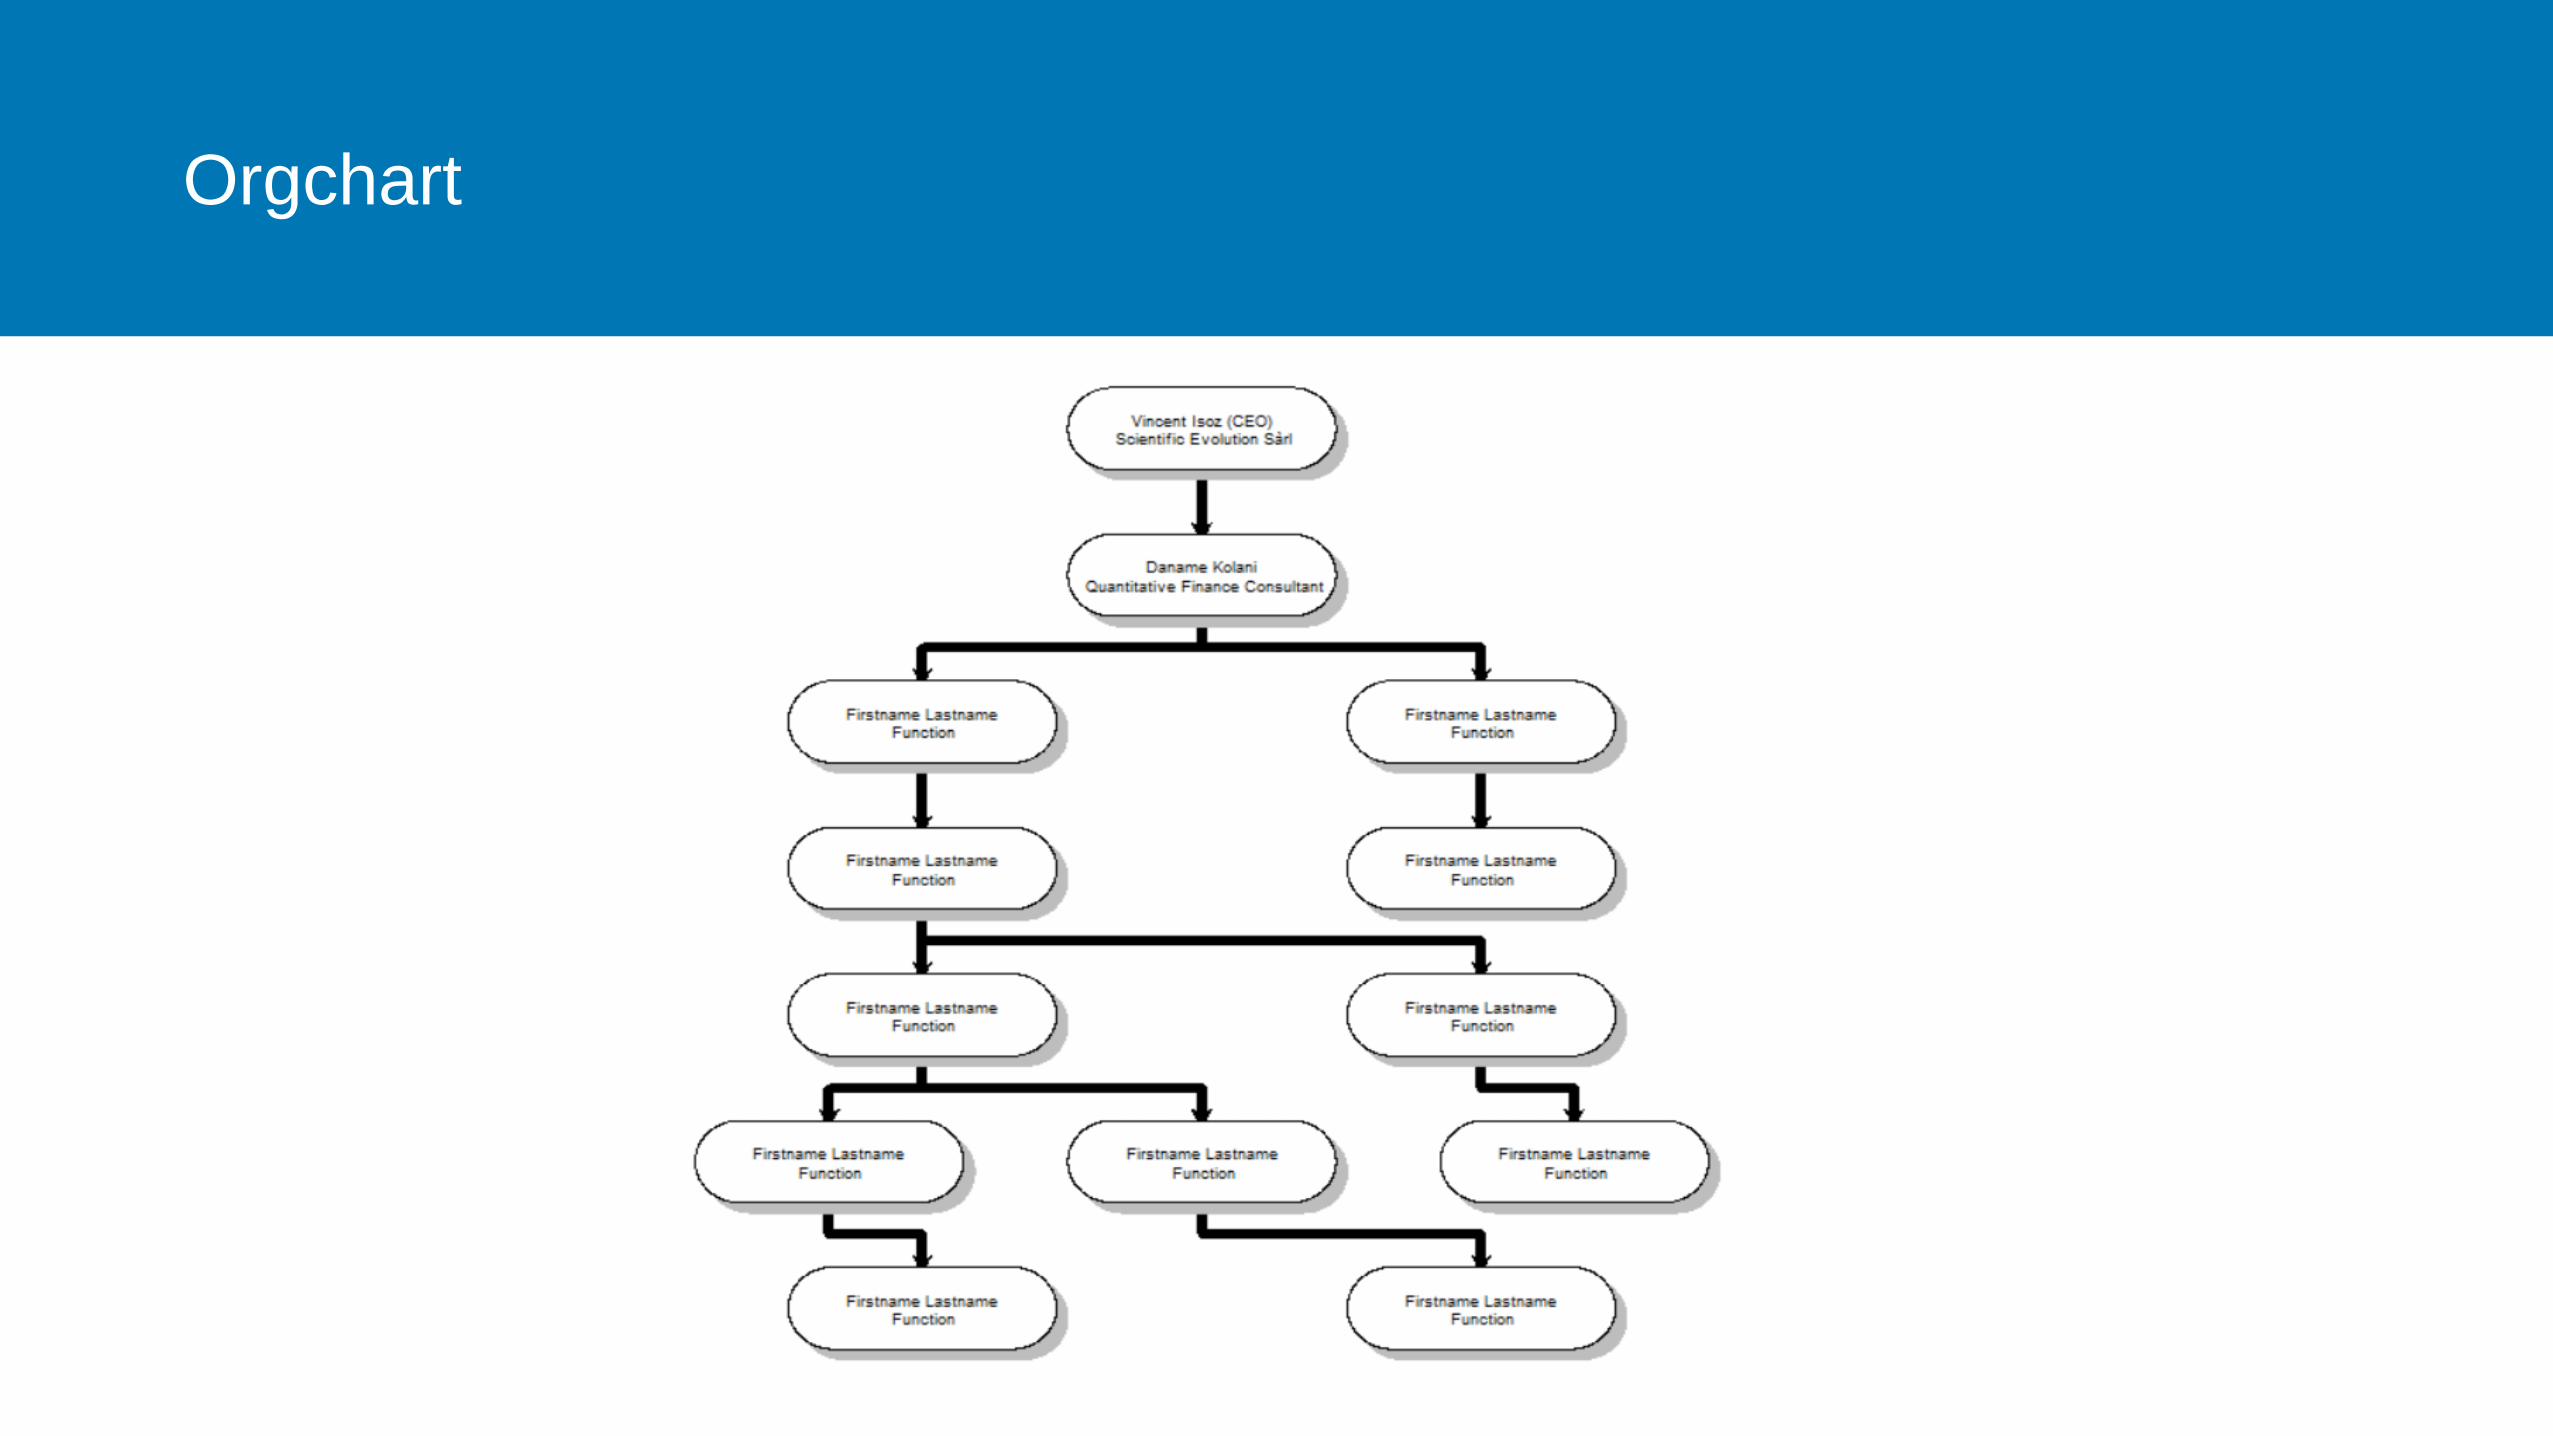
Orgchart
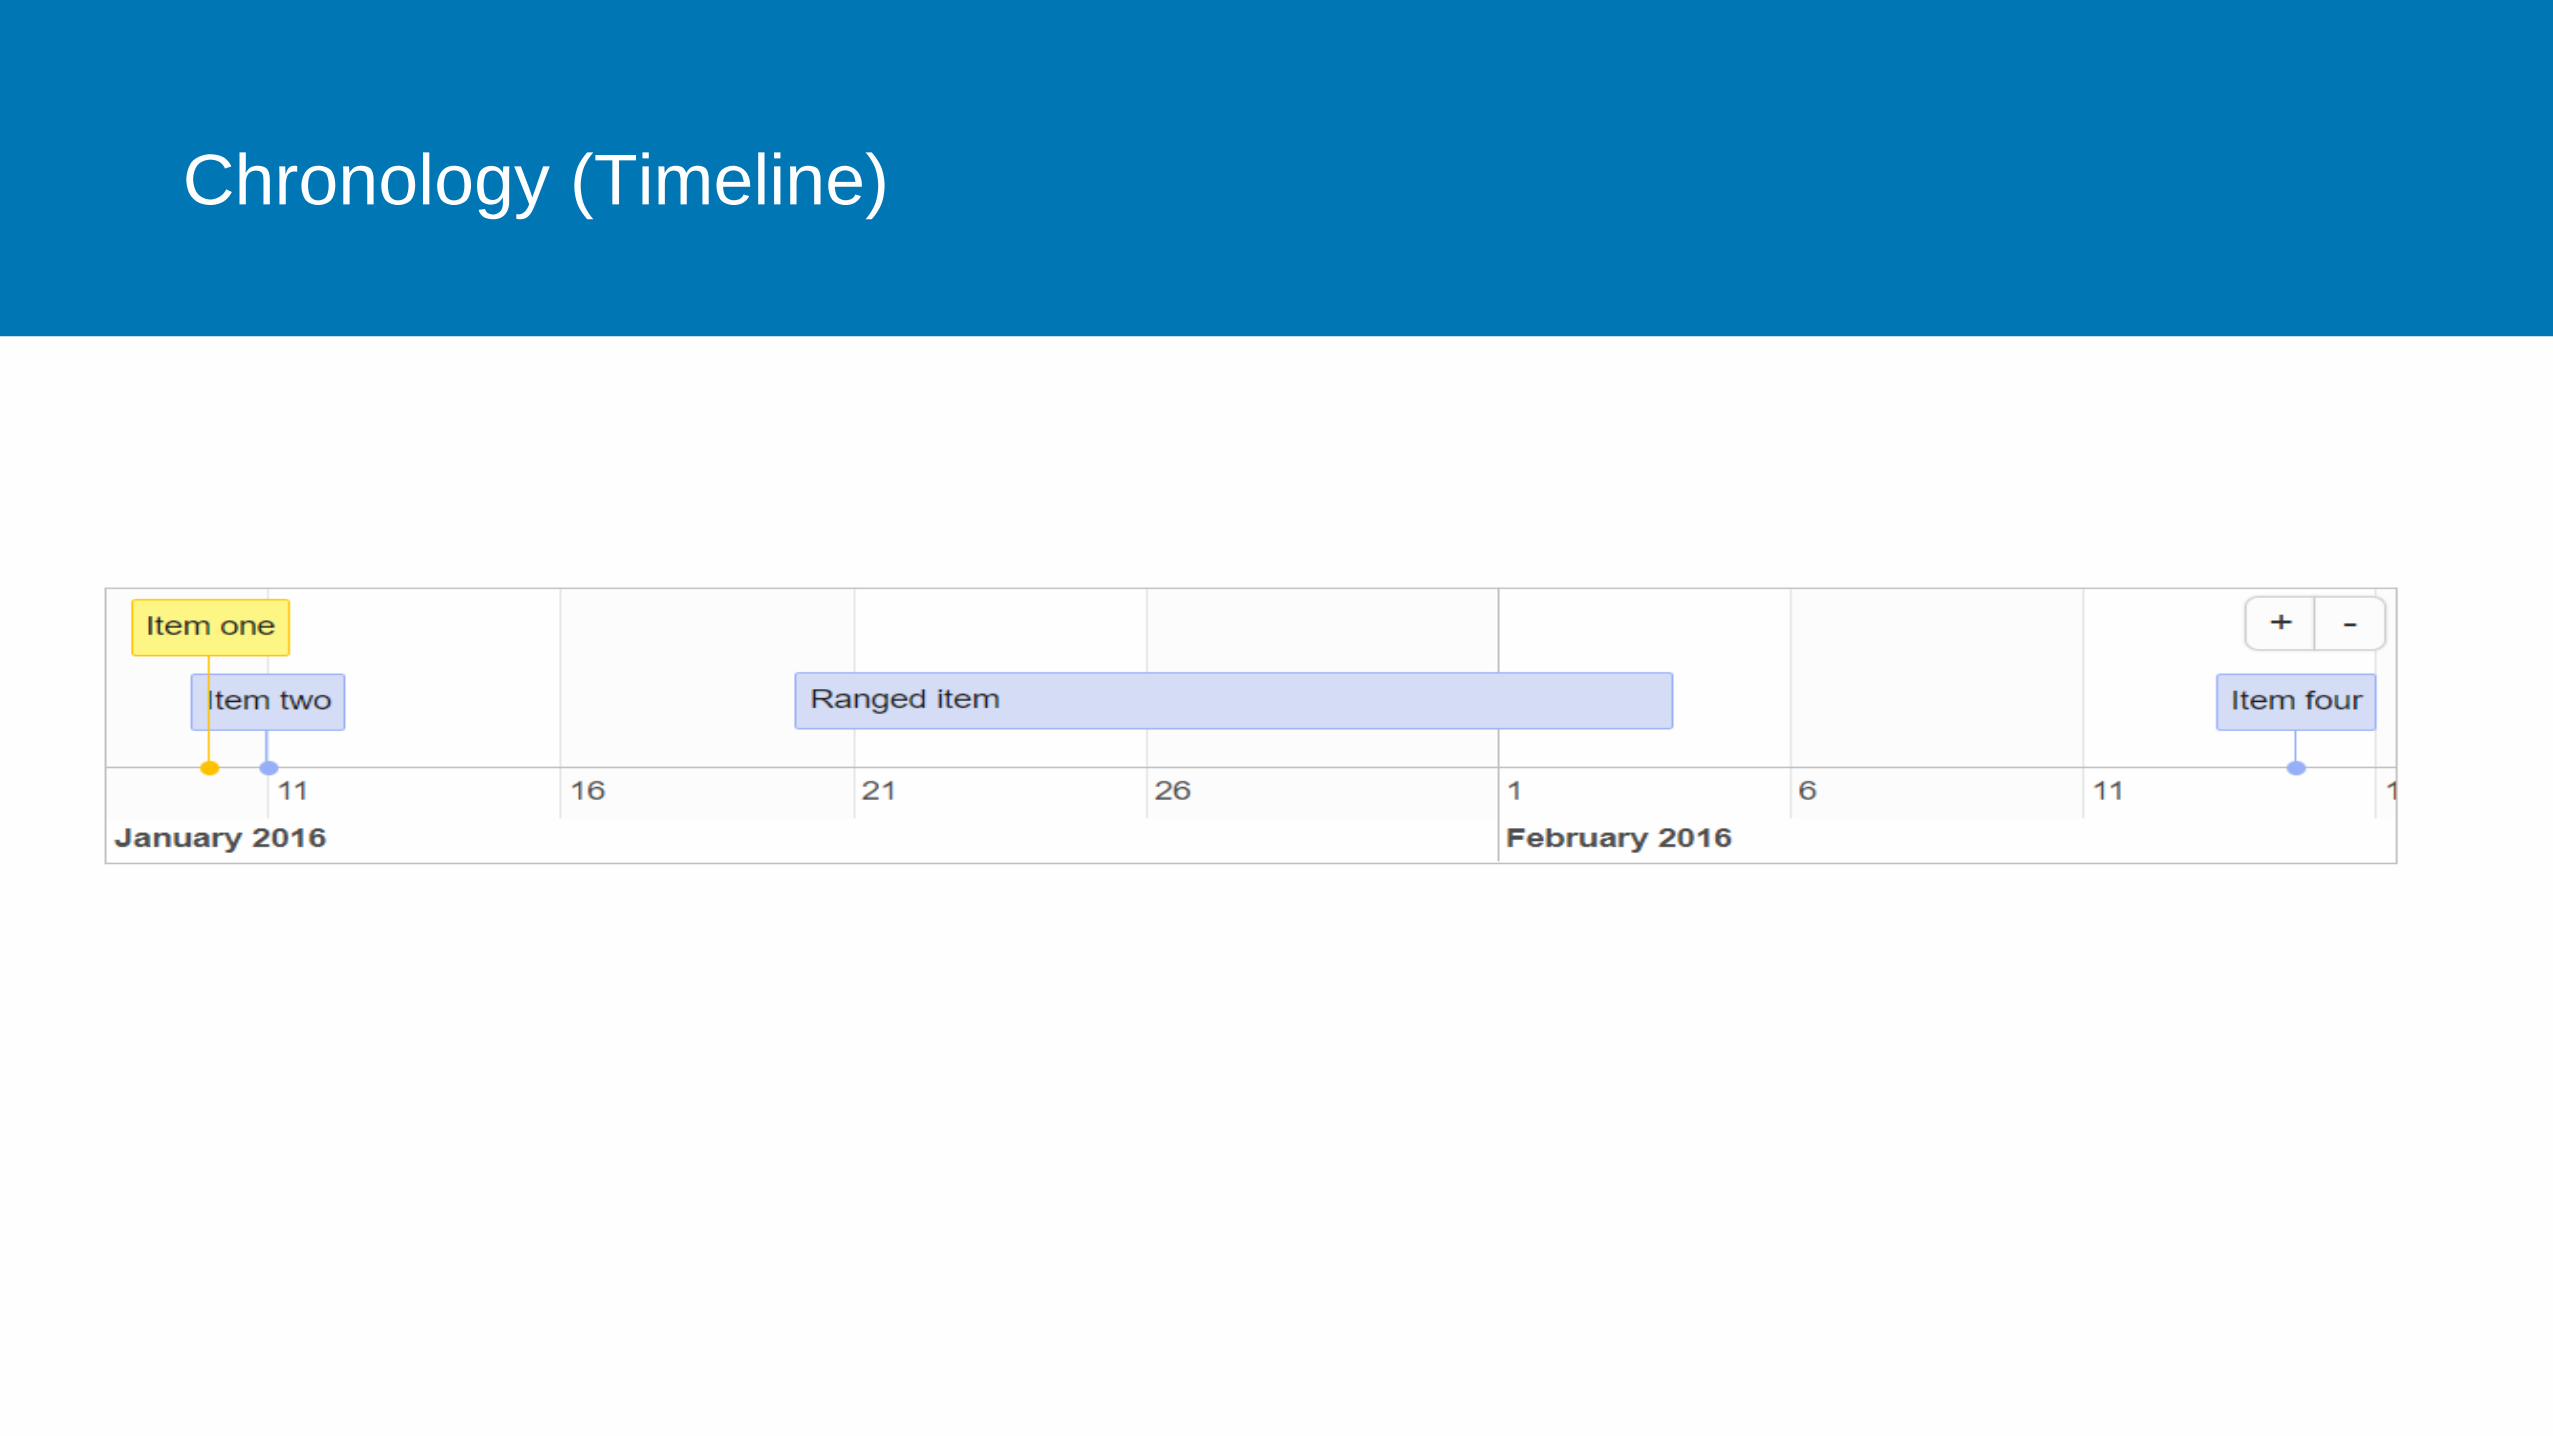
Chronology (Timeline)

Gantt chart

Calendar Heat Map chart
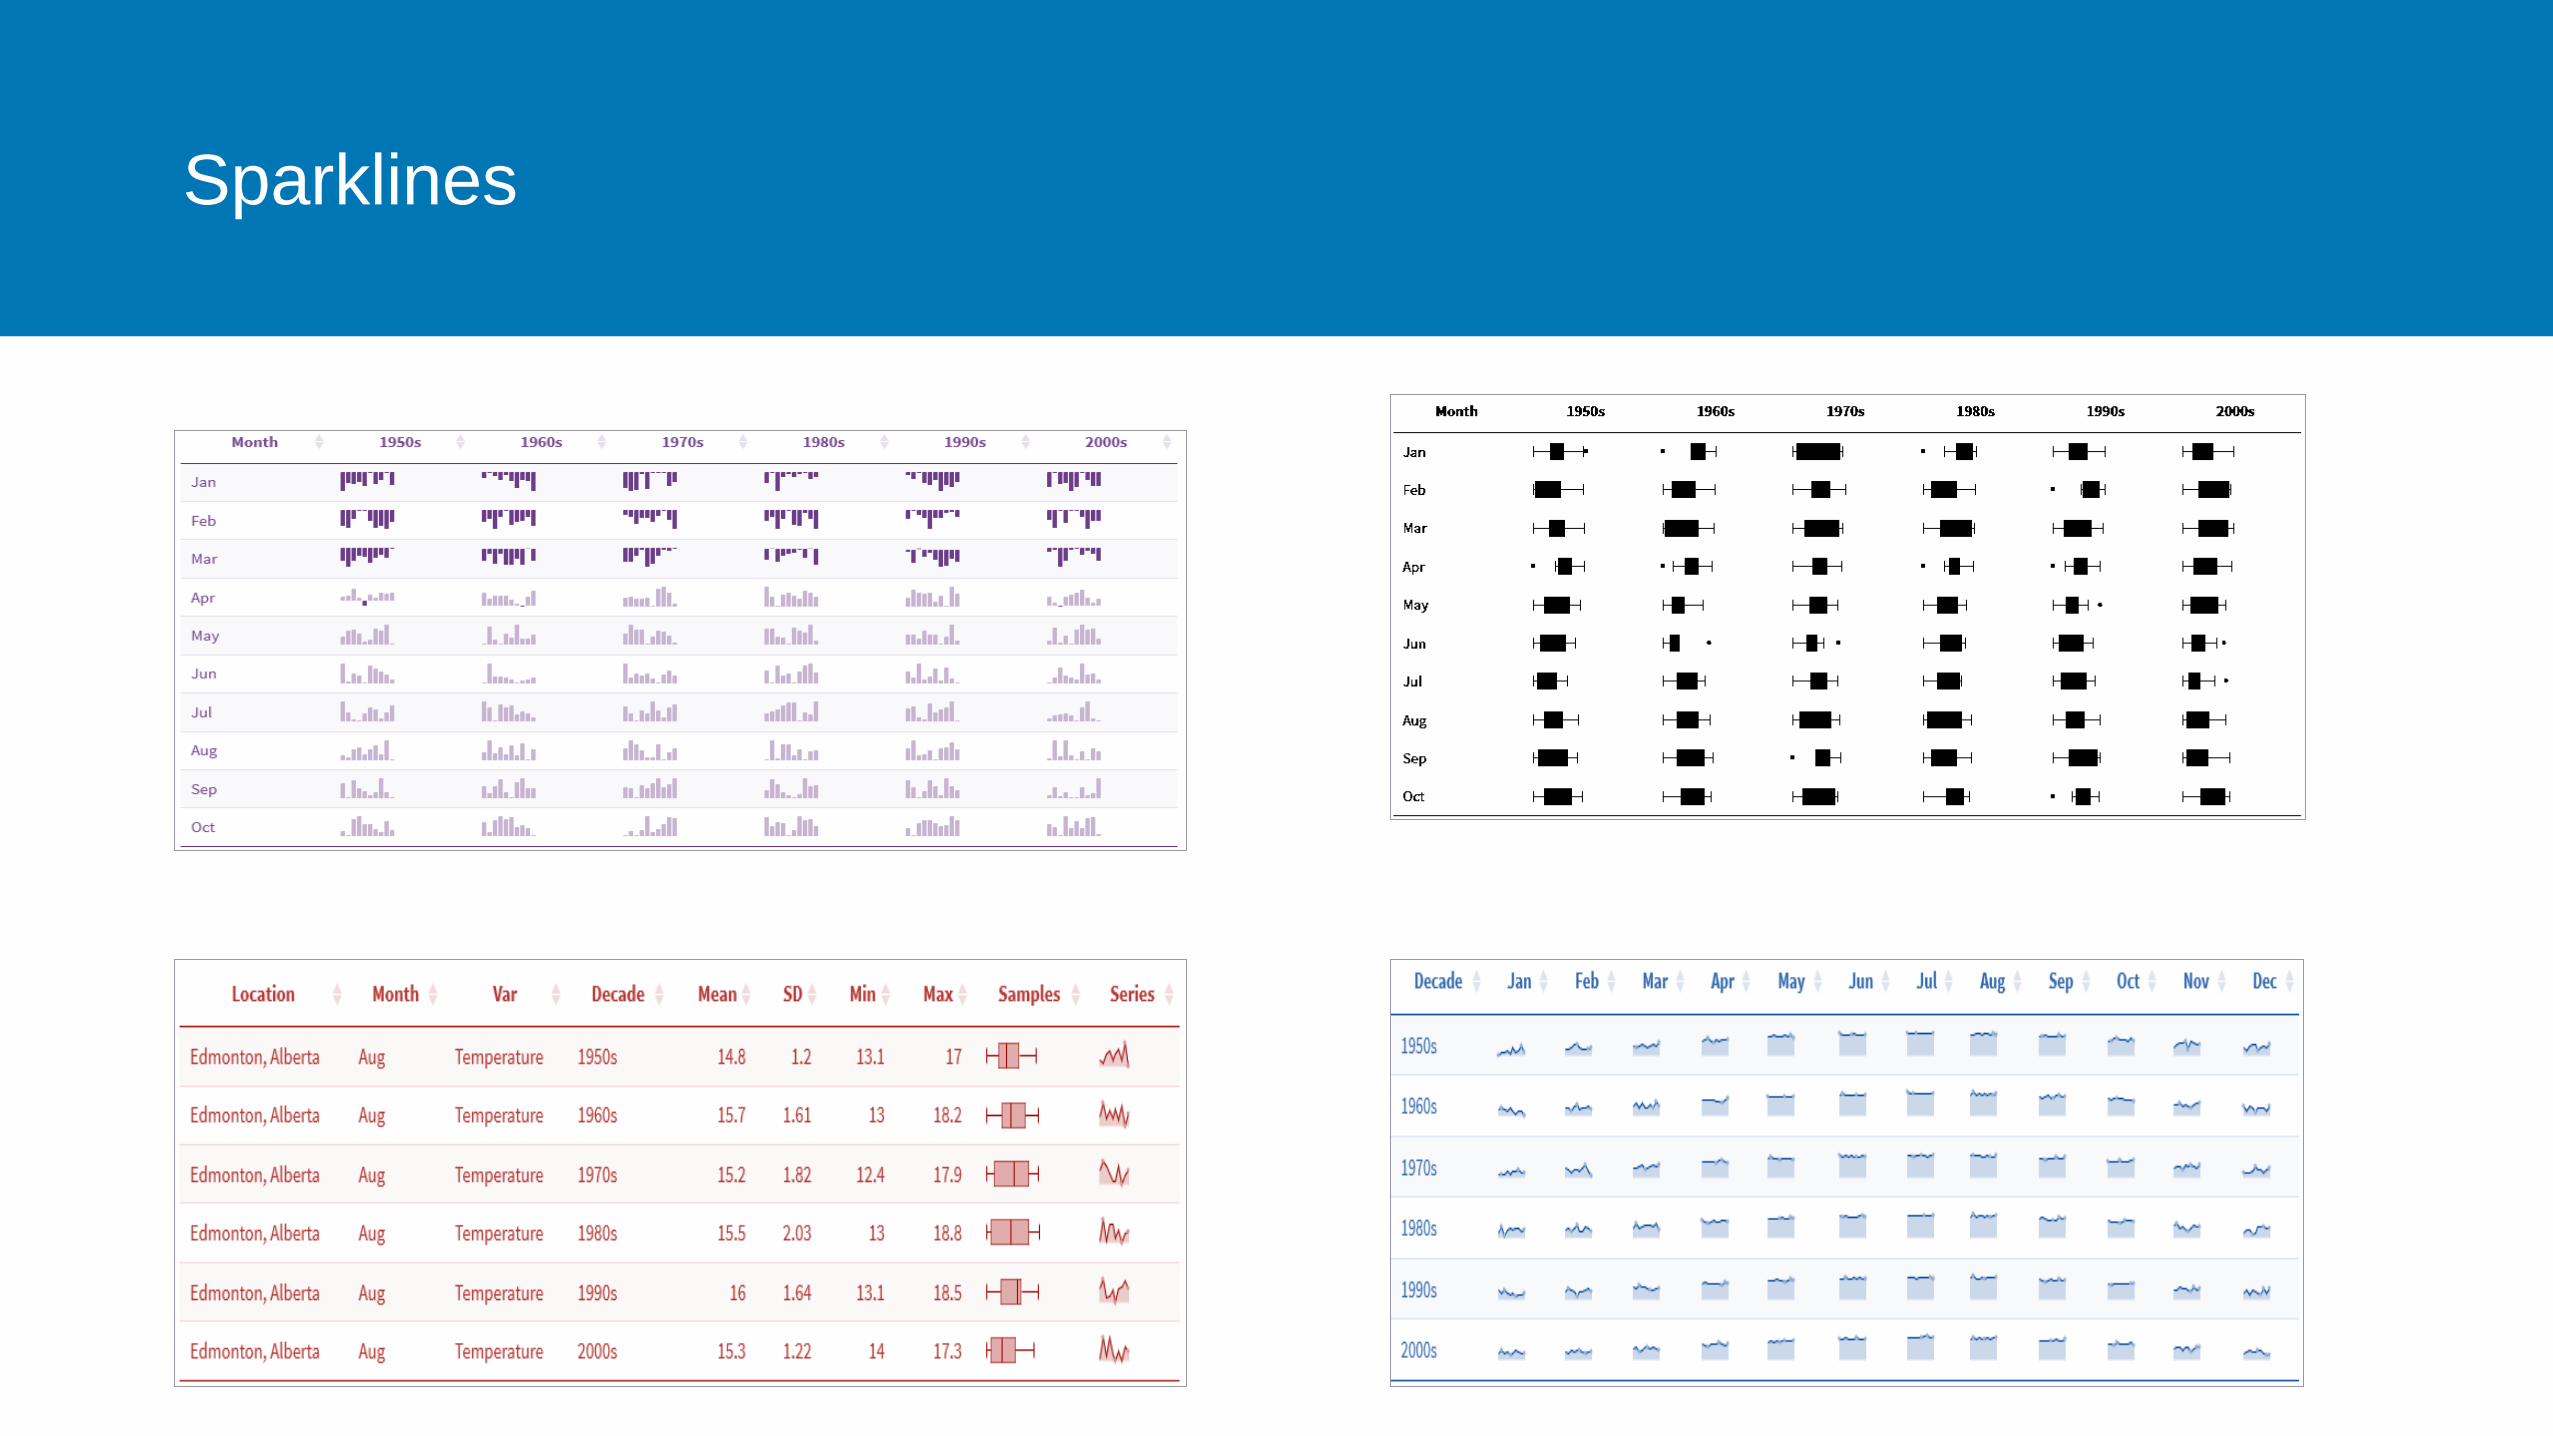
Sparklines

Gauge chart

Bullet chart

Waffle chart

Finance Charts

Fan chart

Autocorrelogram chart

Temporal series clustering

Return Heat Map chart

Financial chronological series and bar charts

OHLC chart (Open-High-Low-Close chart)

OHLC Stock chart (Candlestick chart)

Candlestick and Bar charts with Bollinger bands

Variation with reference index

Binomial Tree chart
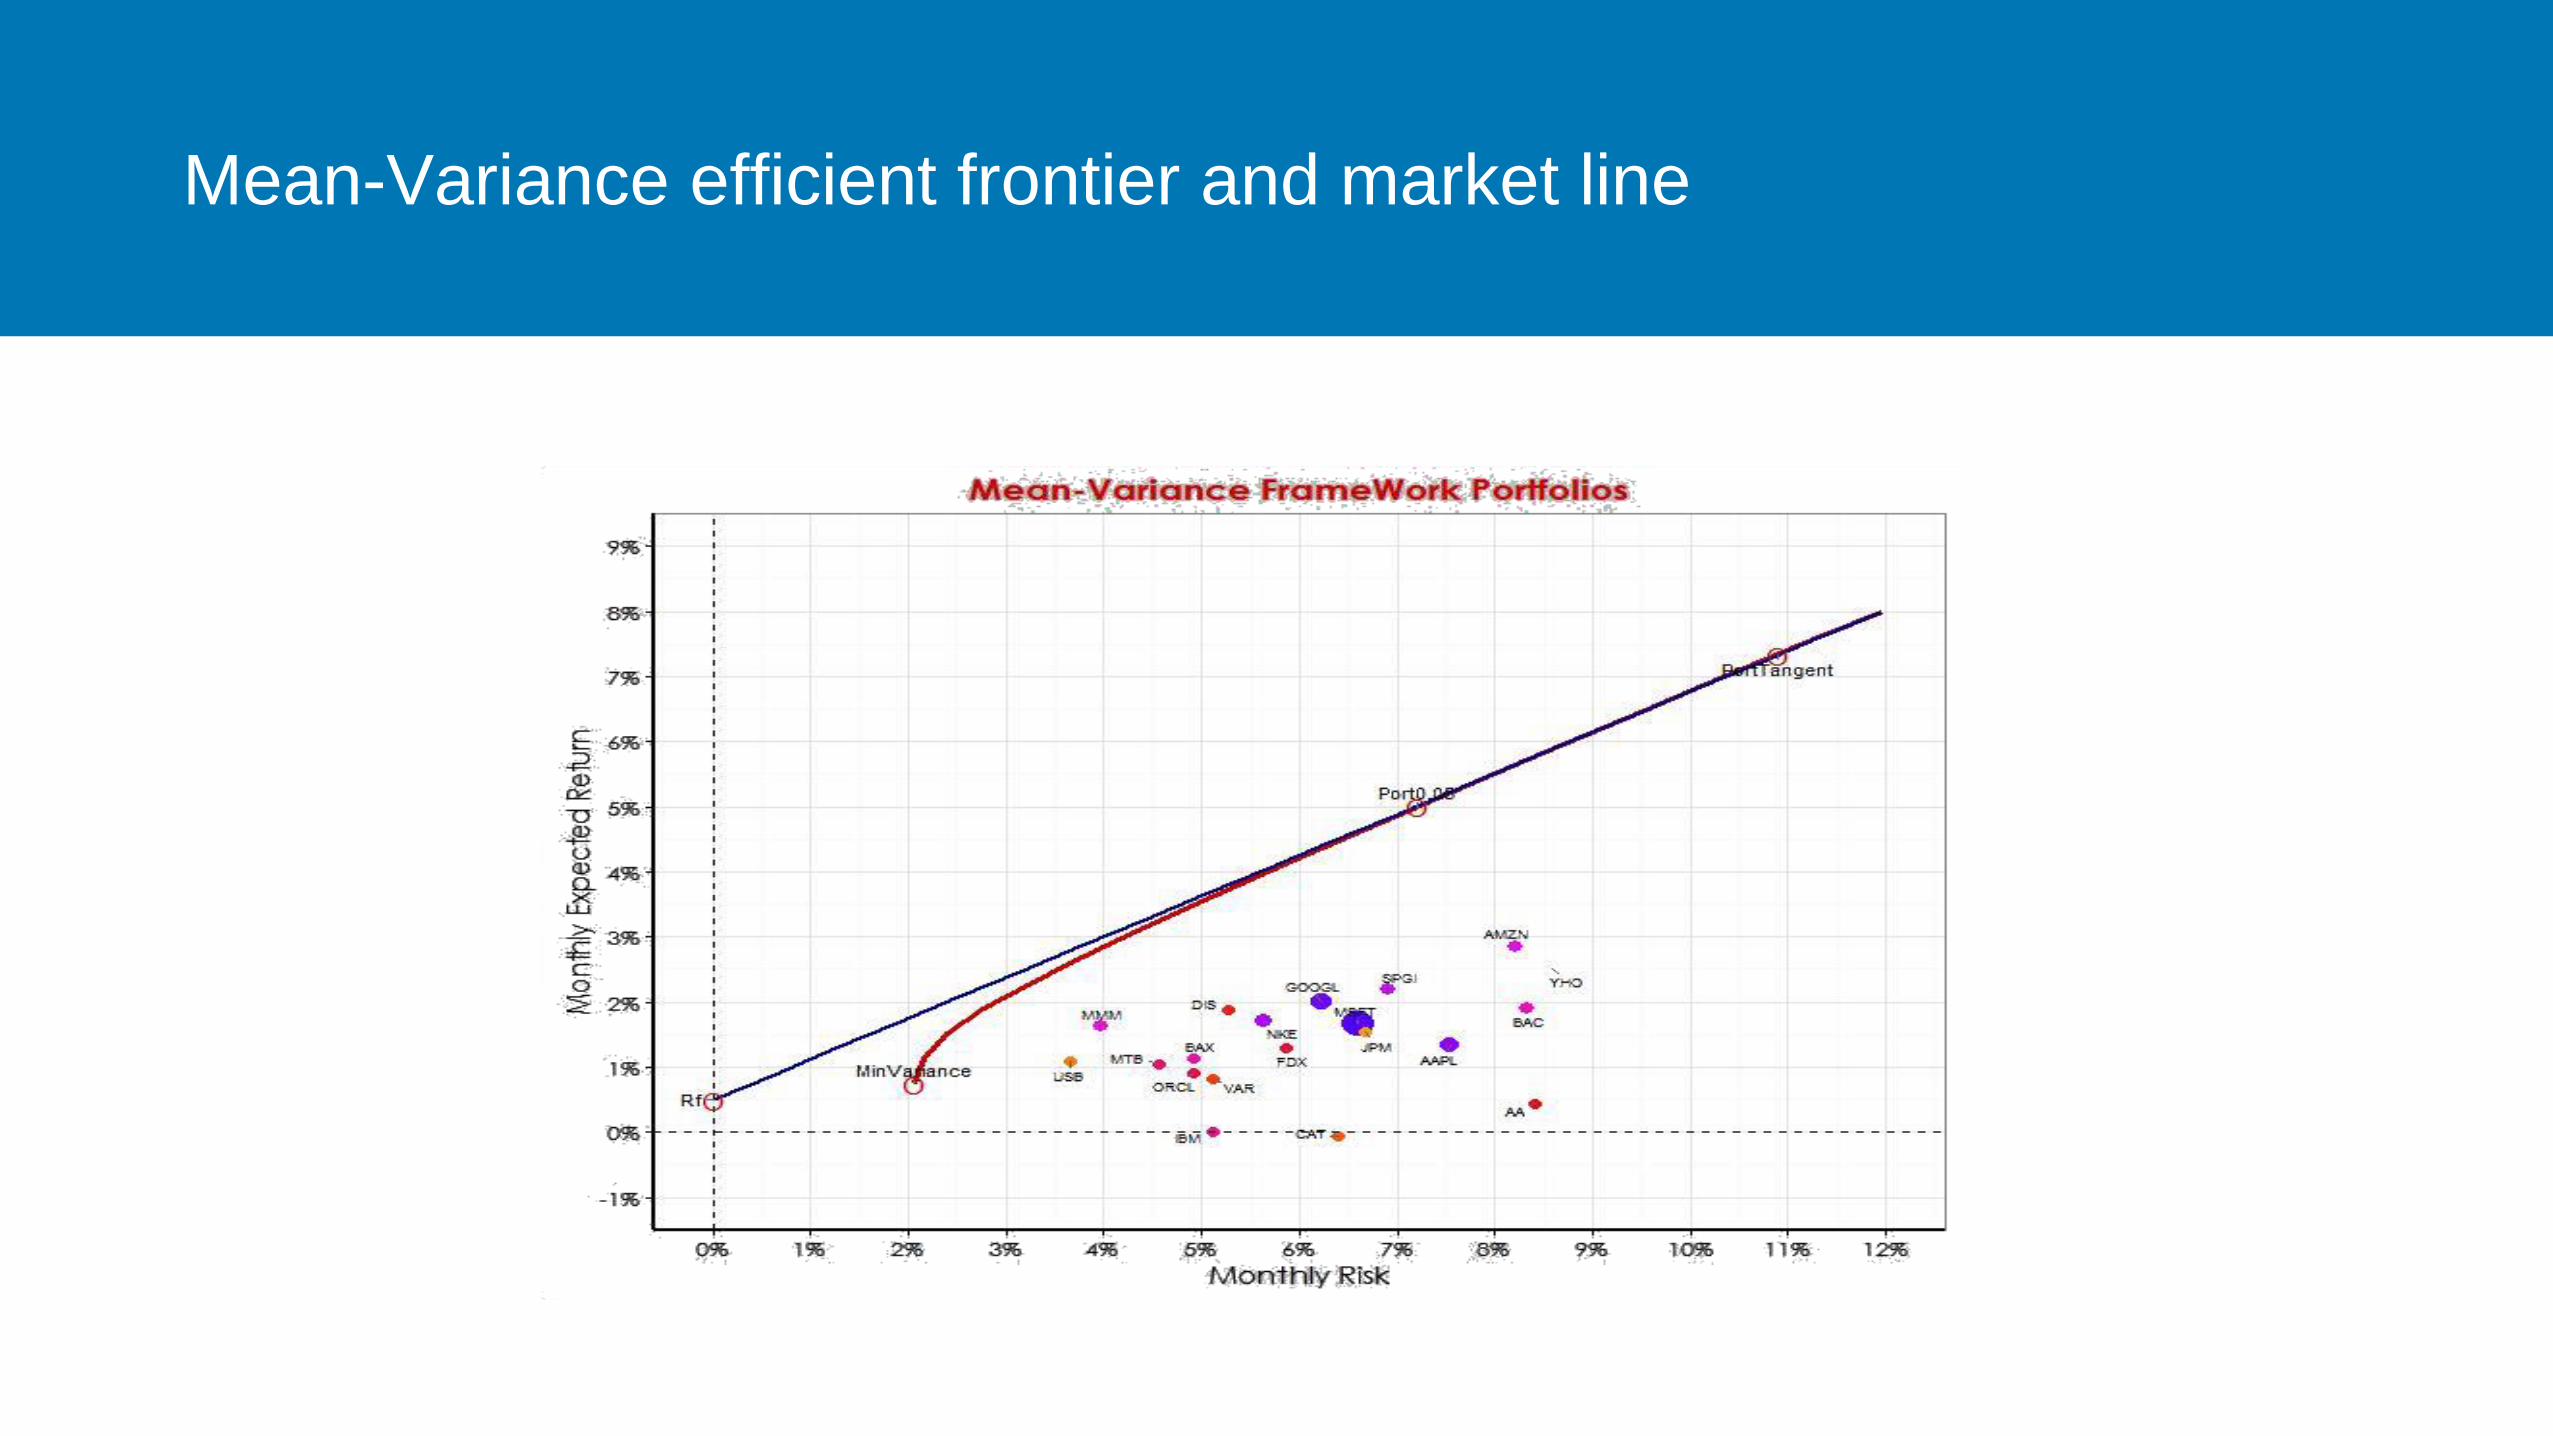
Mean-Variance efficient frontier and market line

Performance charts

Asset allocation chart

Quality

Cause & Effect chart (Ishikawa chart)

Control chart (Six Sigma)
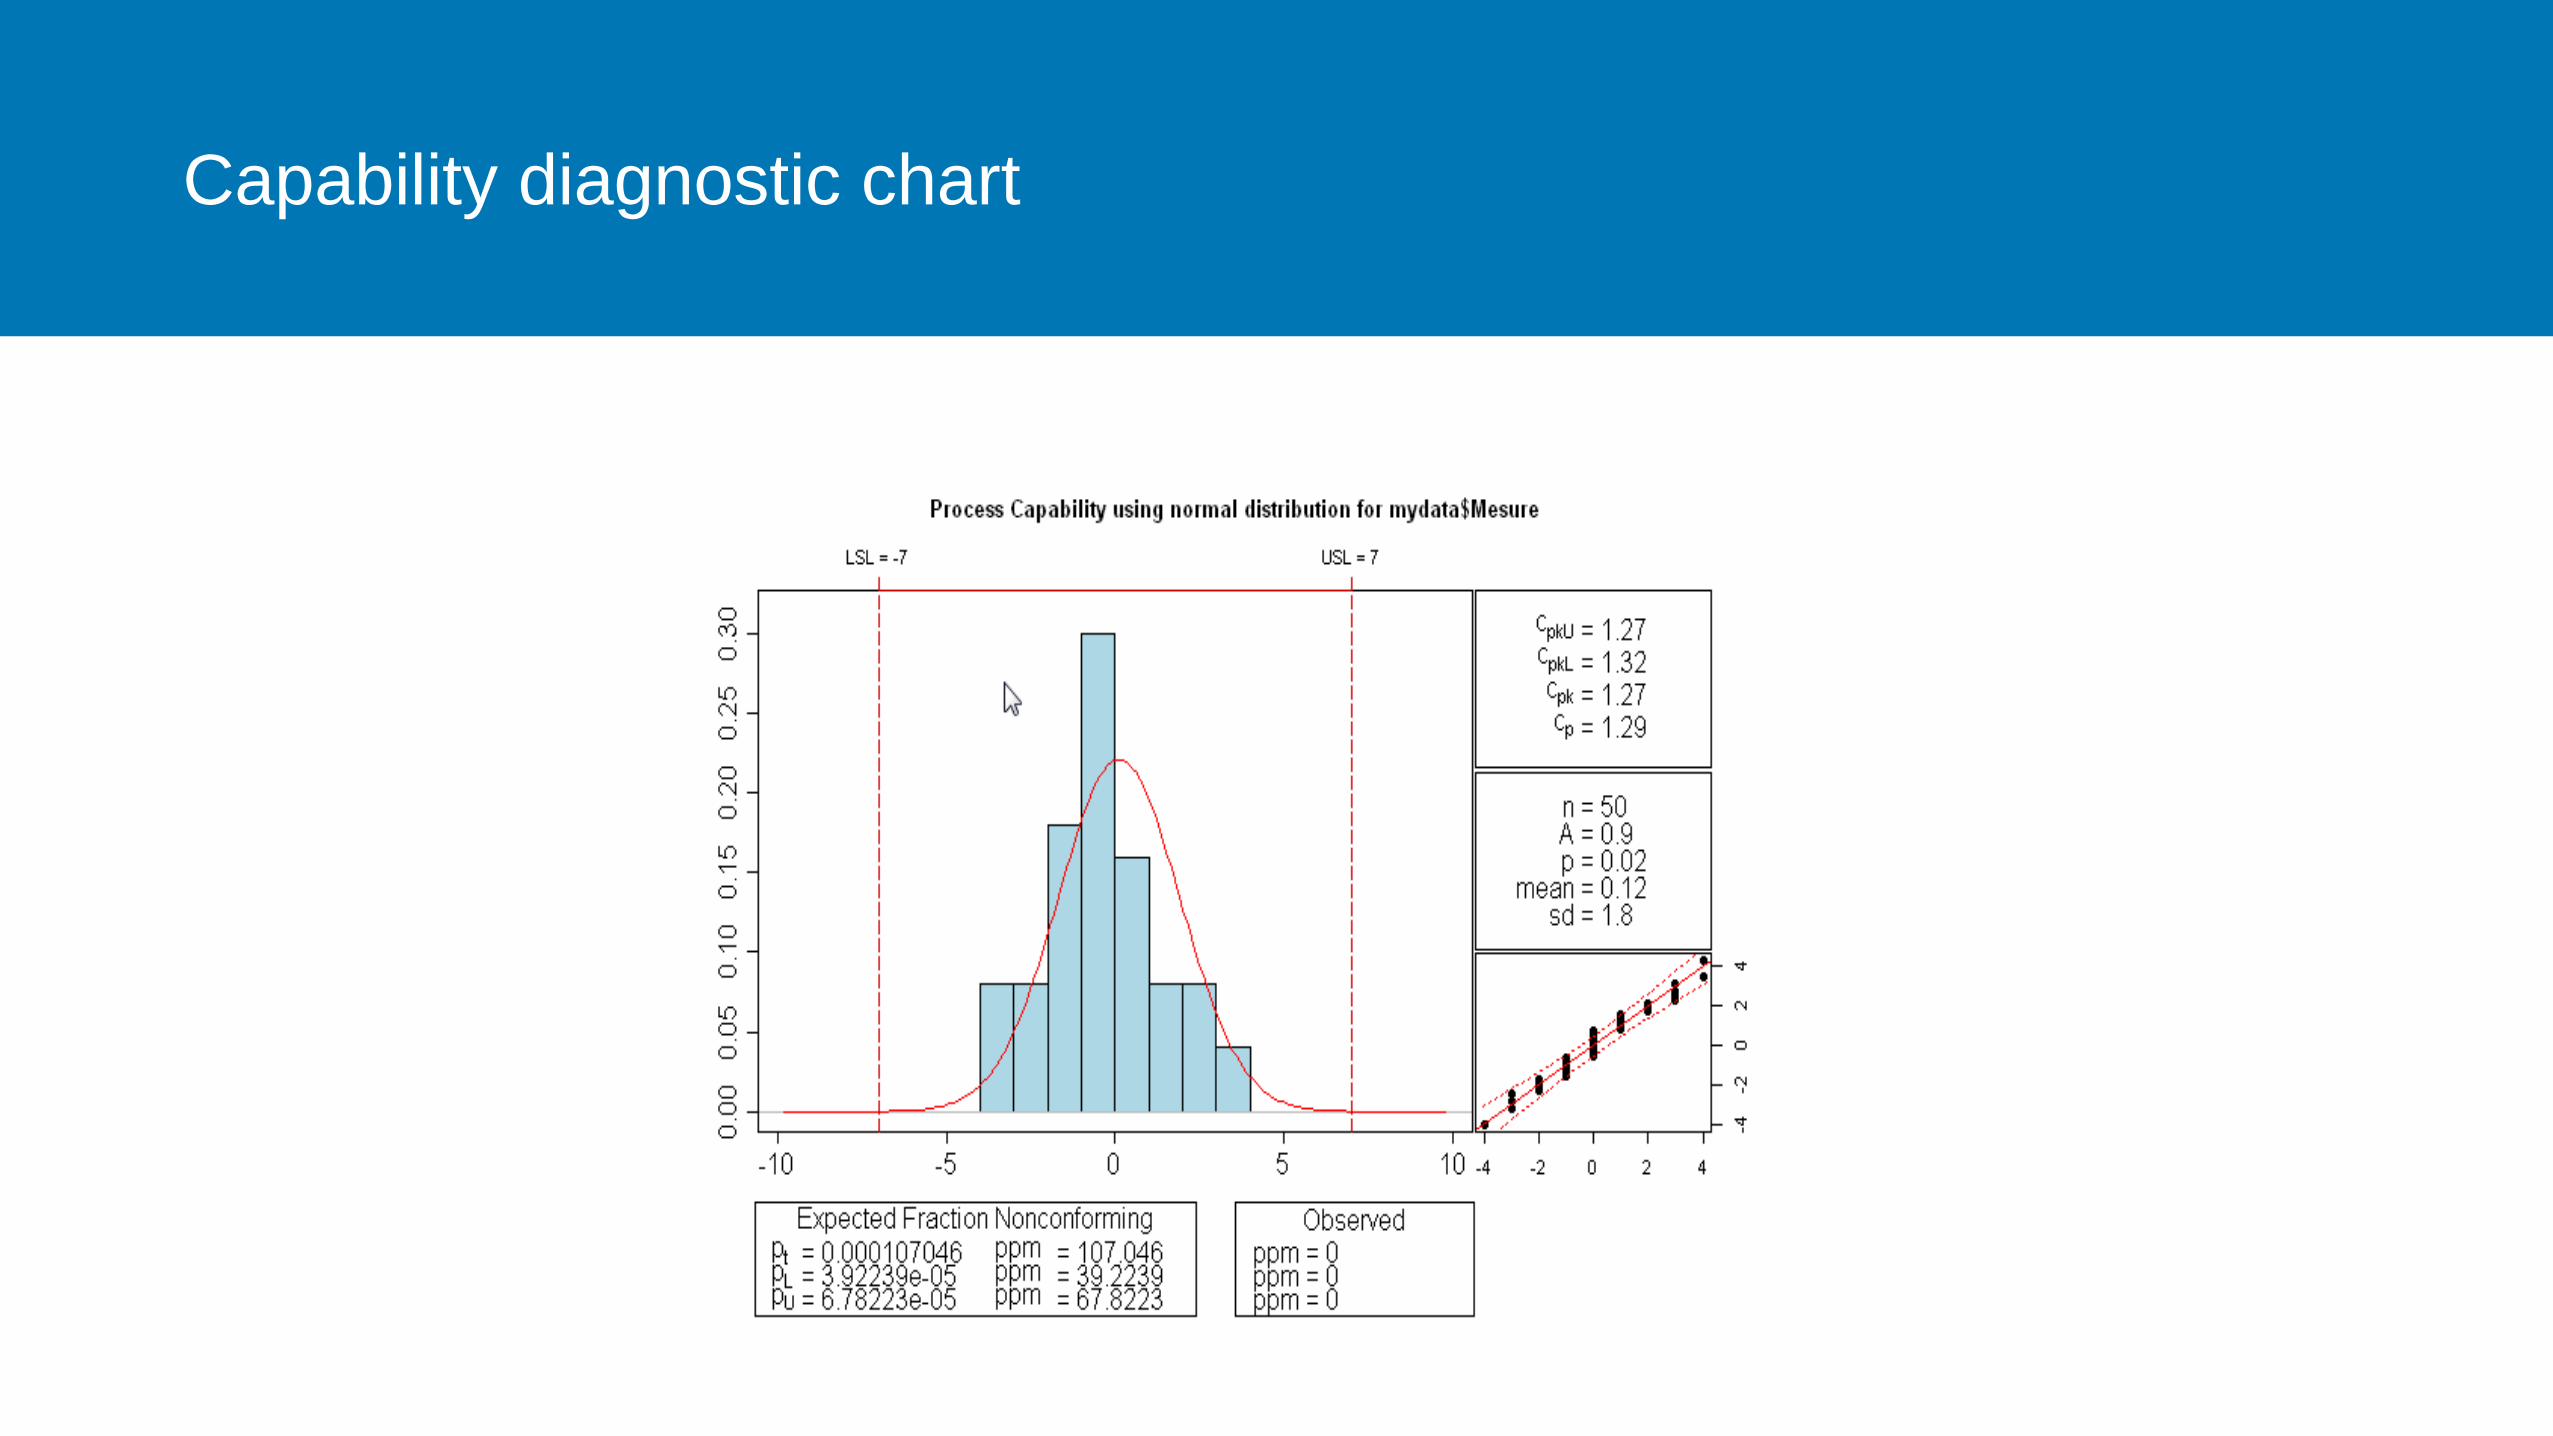
Capability diagnostic chart

Sixpack Analysis chart

Operating Curves chart (OC)
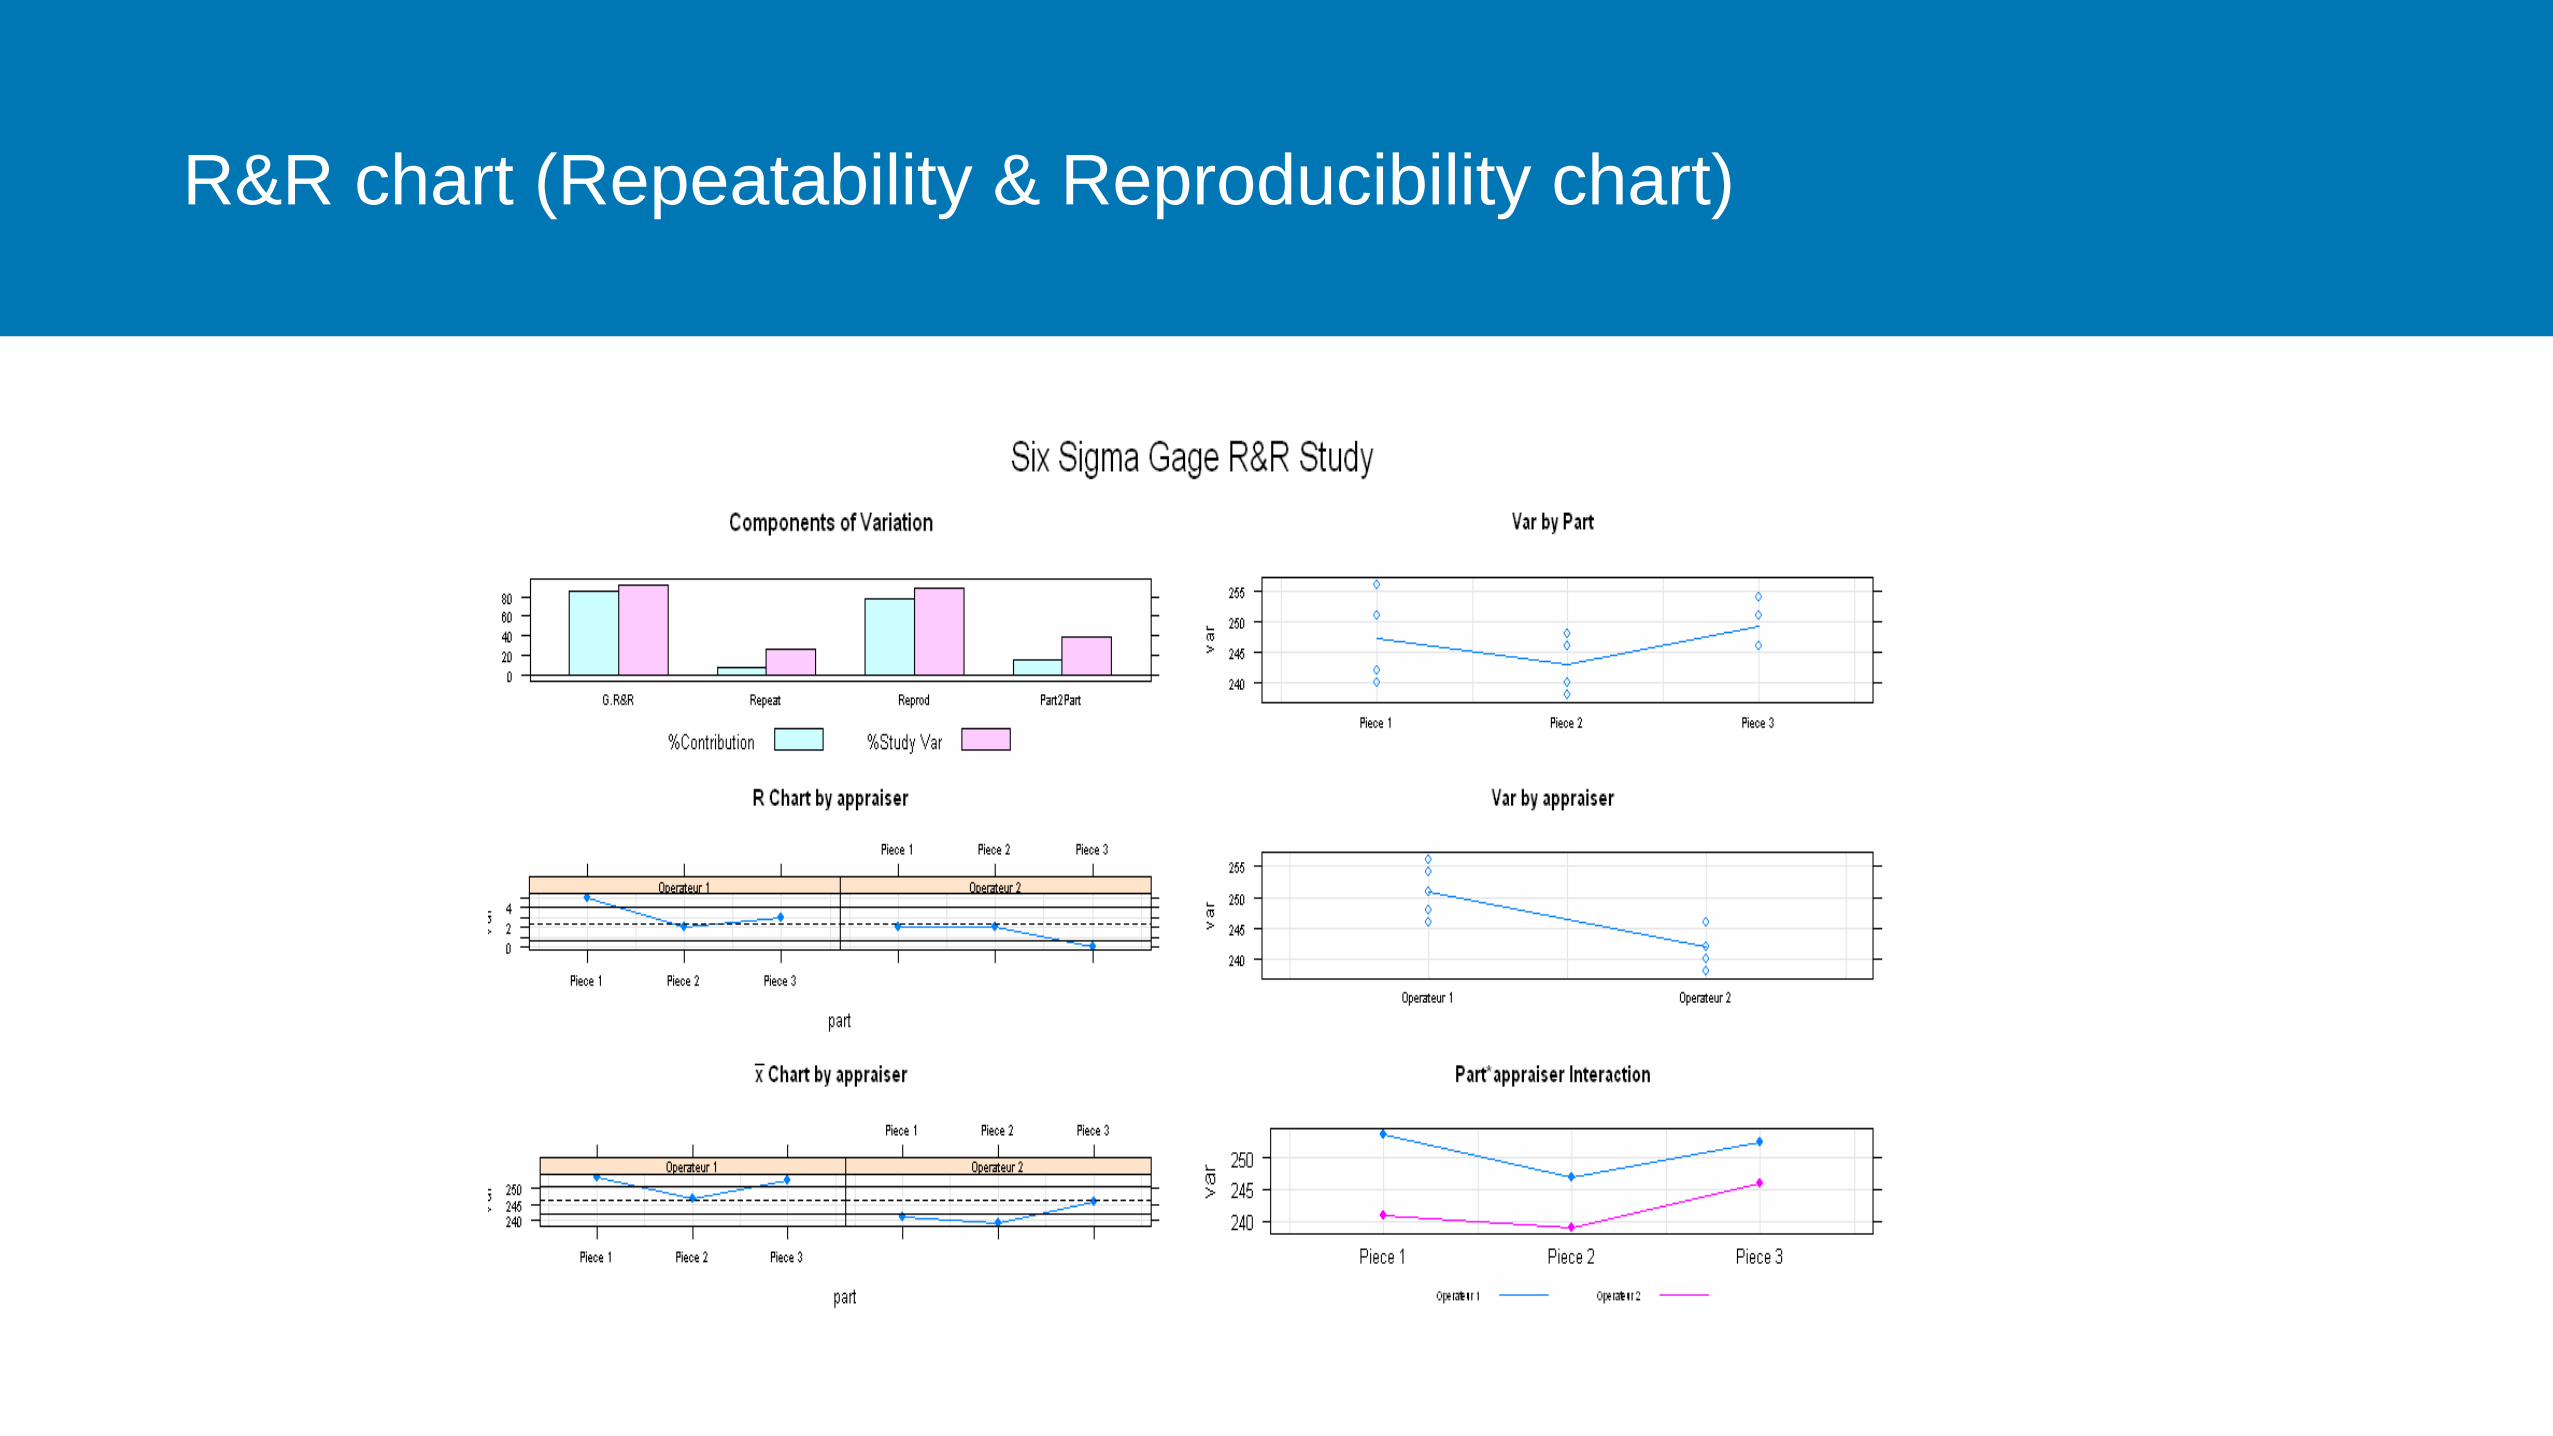
R&R chart (Repeatability & Reproducibility chart)

Pareto chart
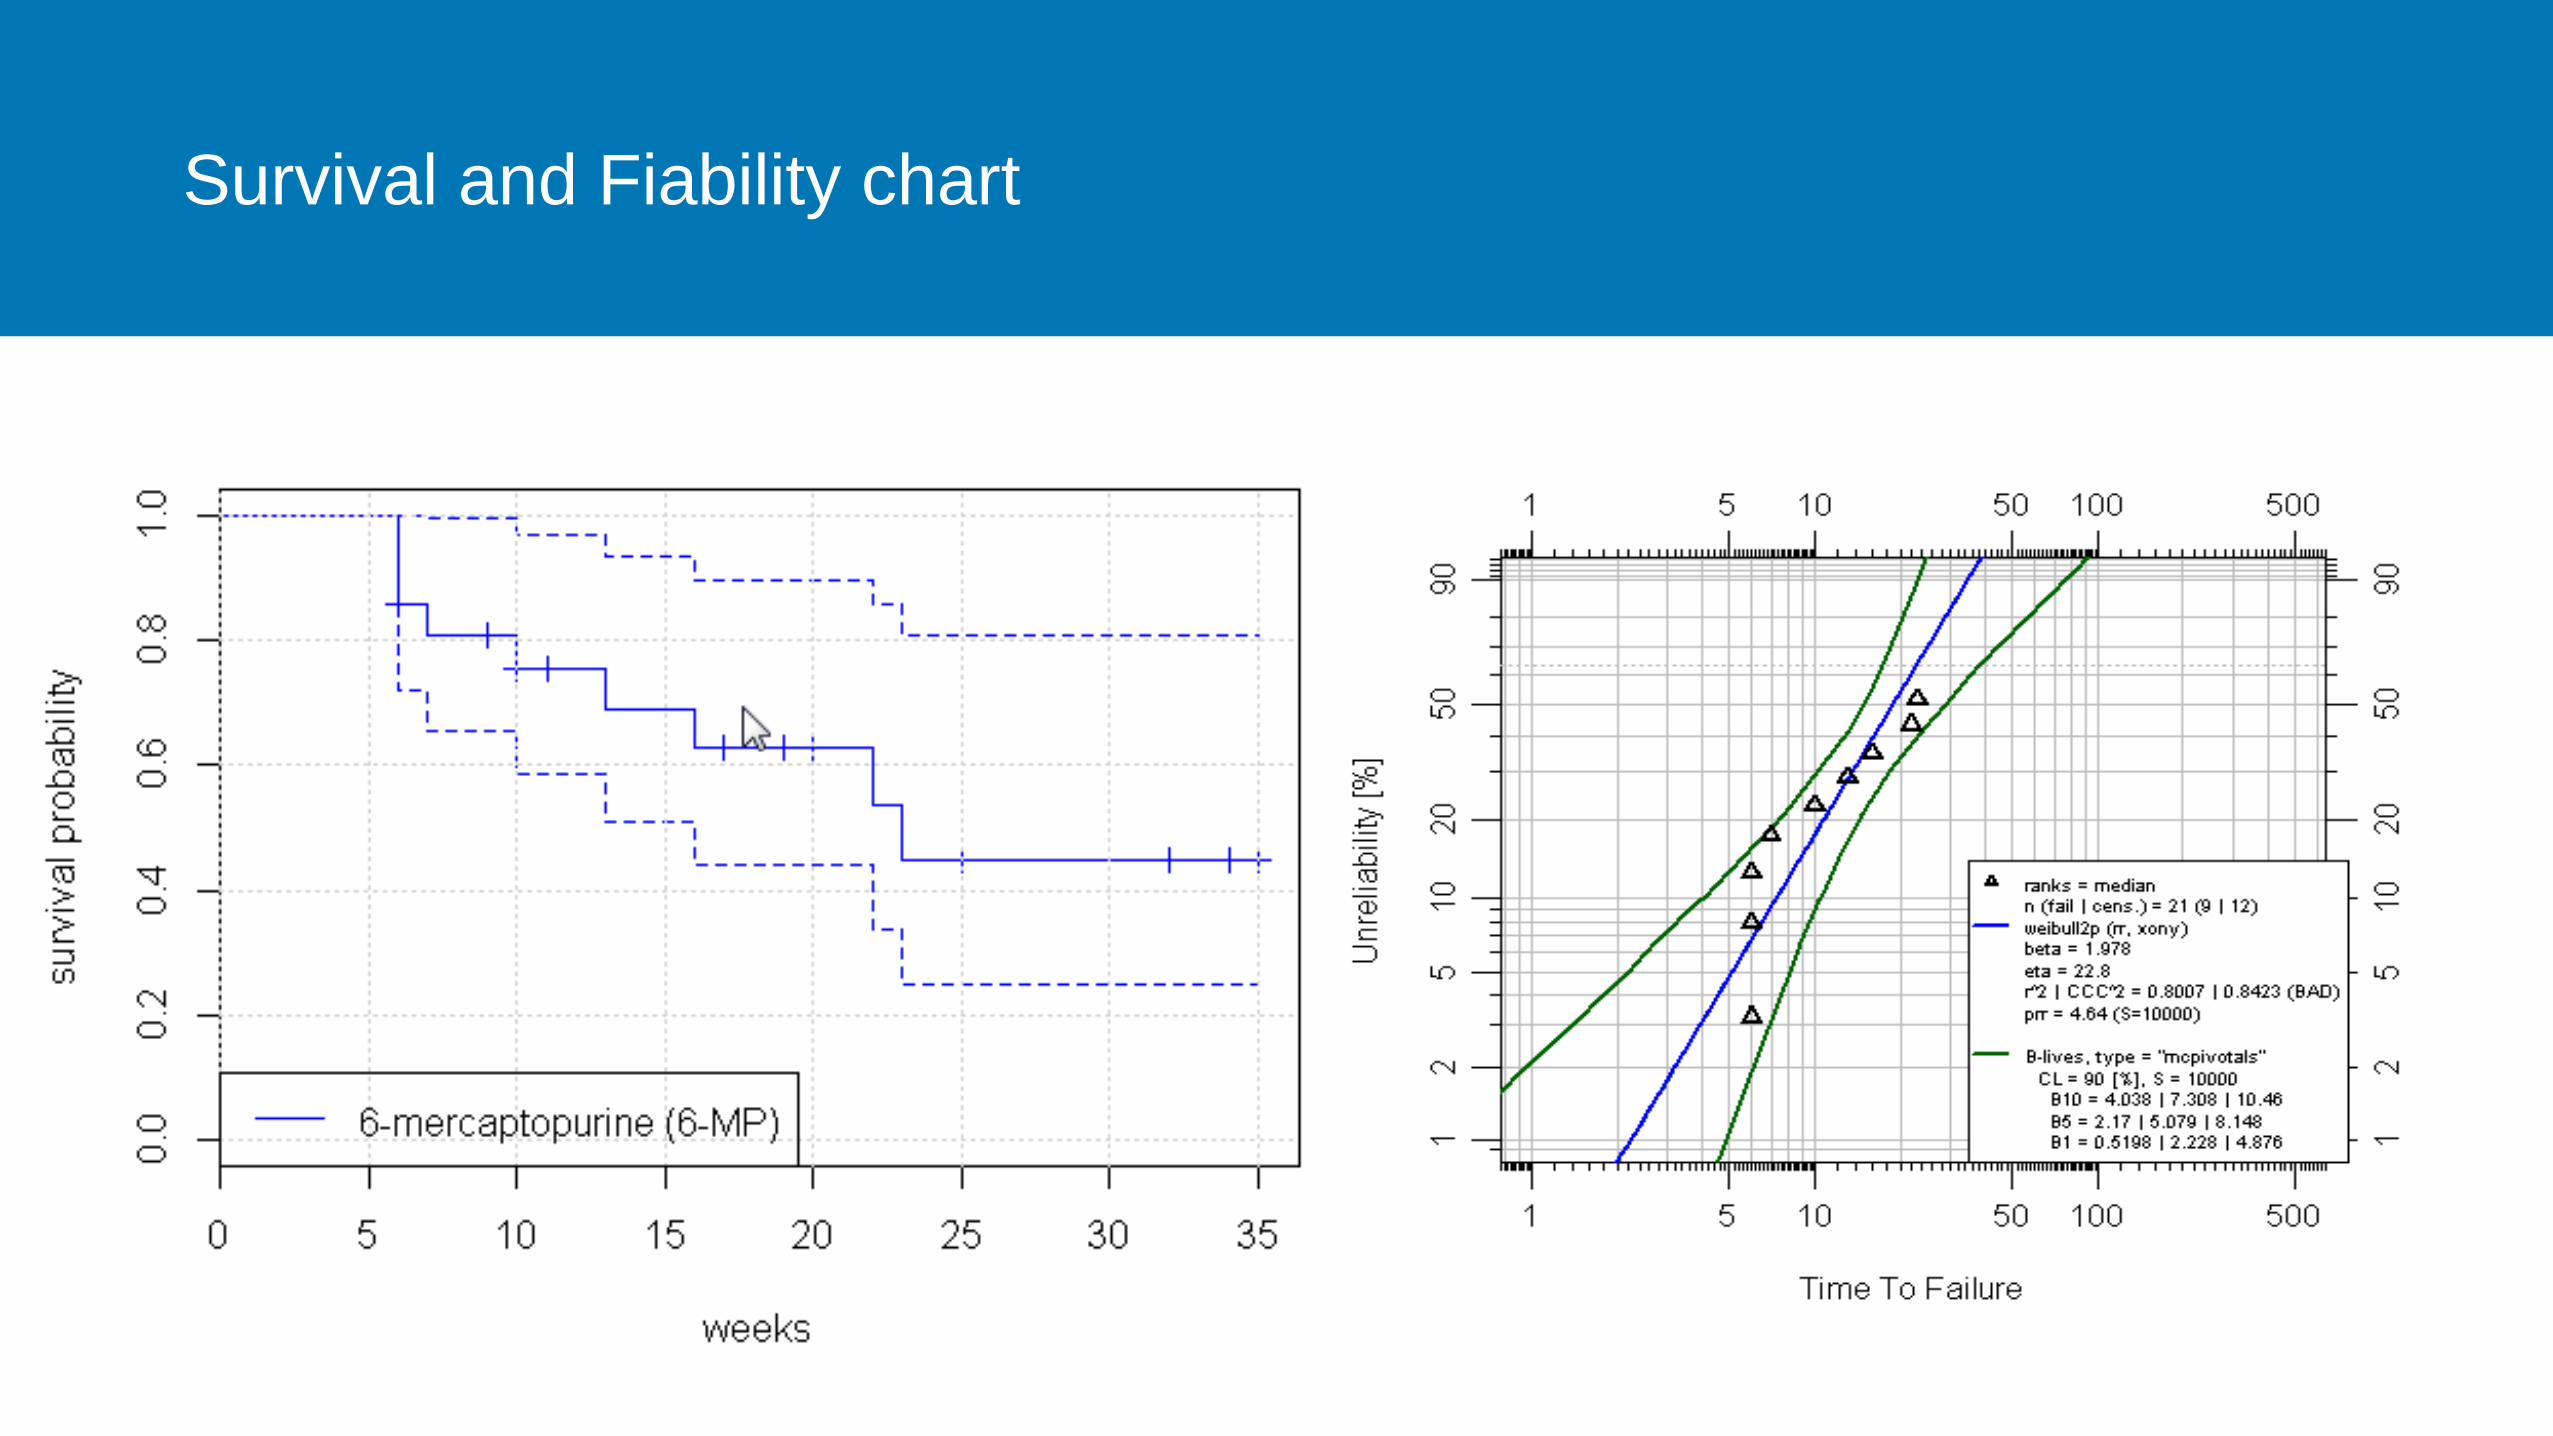
Survival and Fiability chart

Texts/Categories

Text cloud chart

Co-diagram chart

Treemap chart

Dendrogram chart

Cluserting Heat Map chart
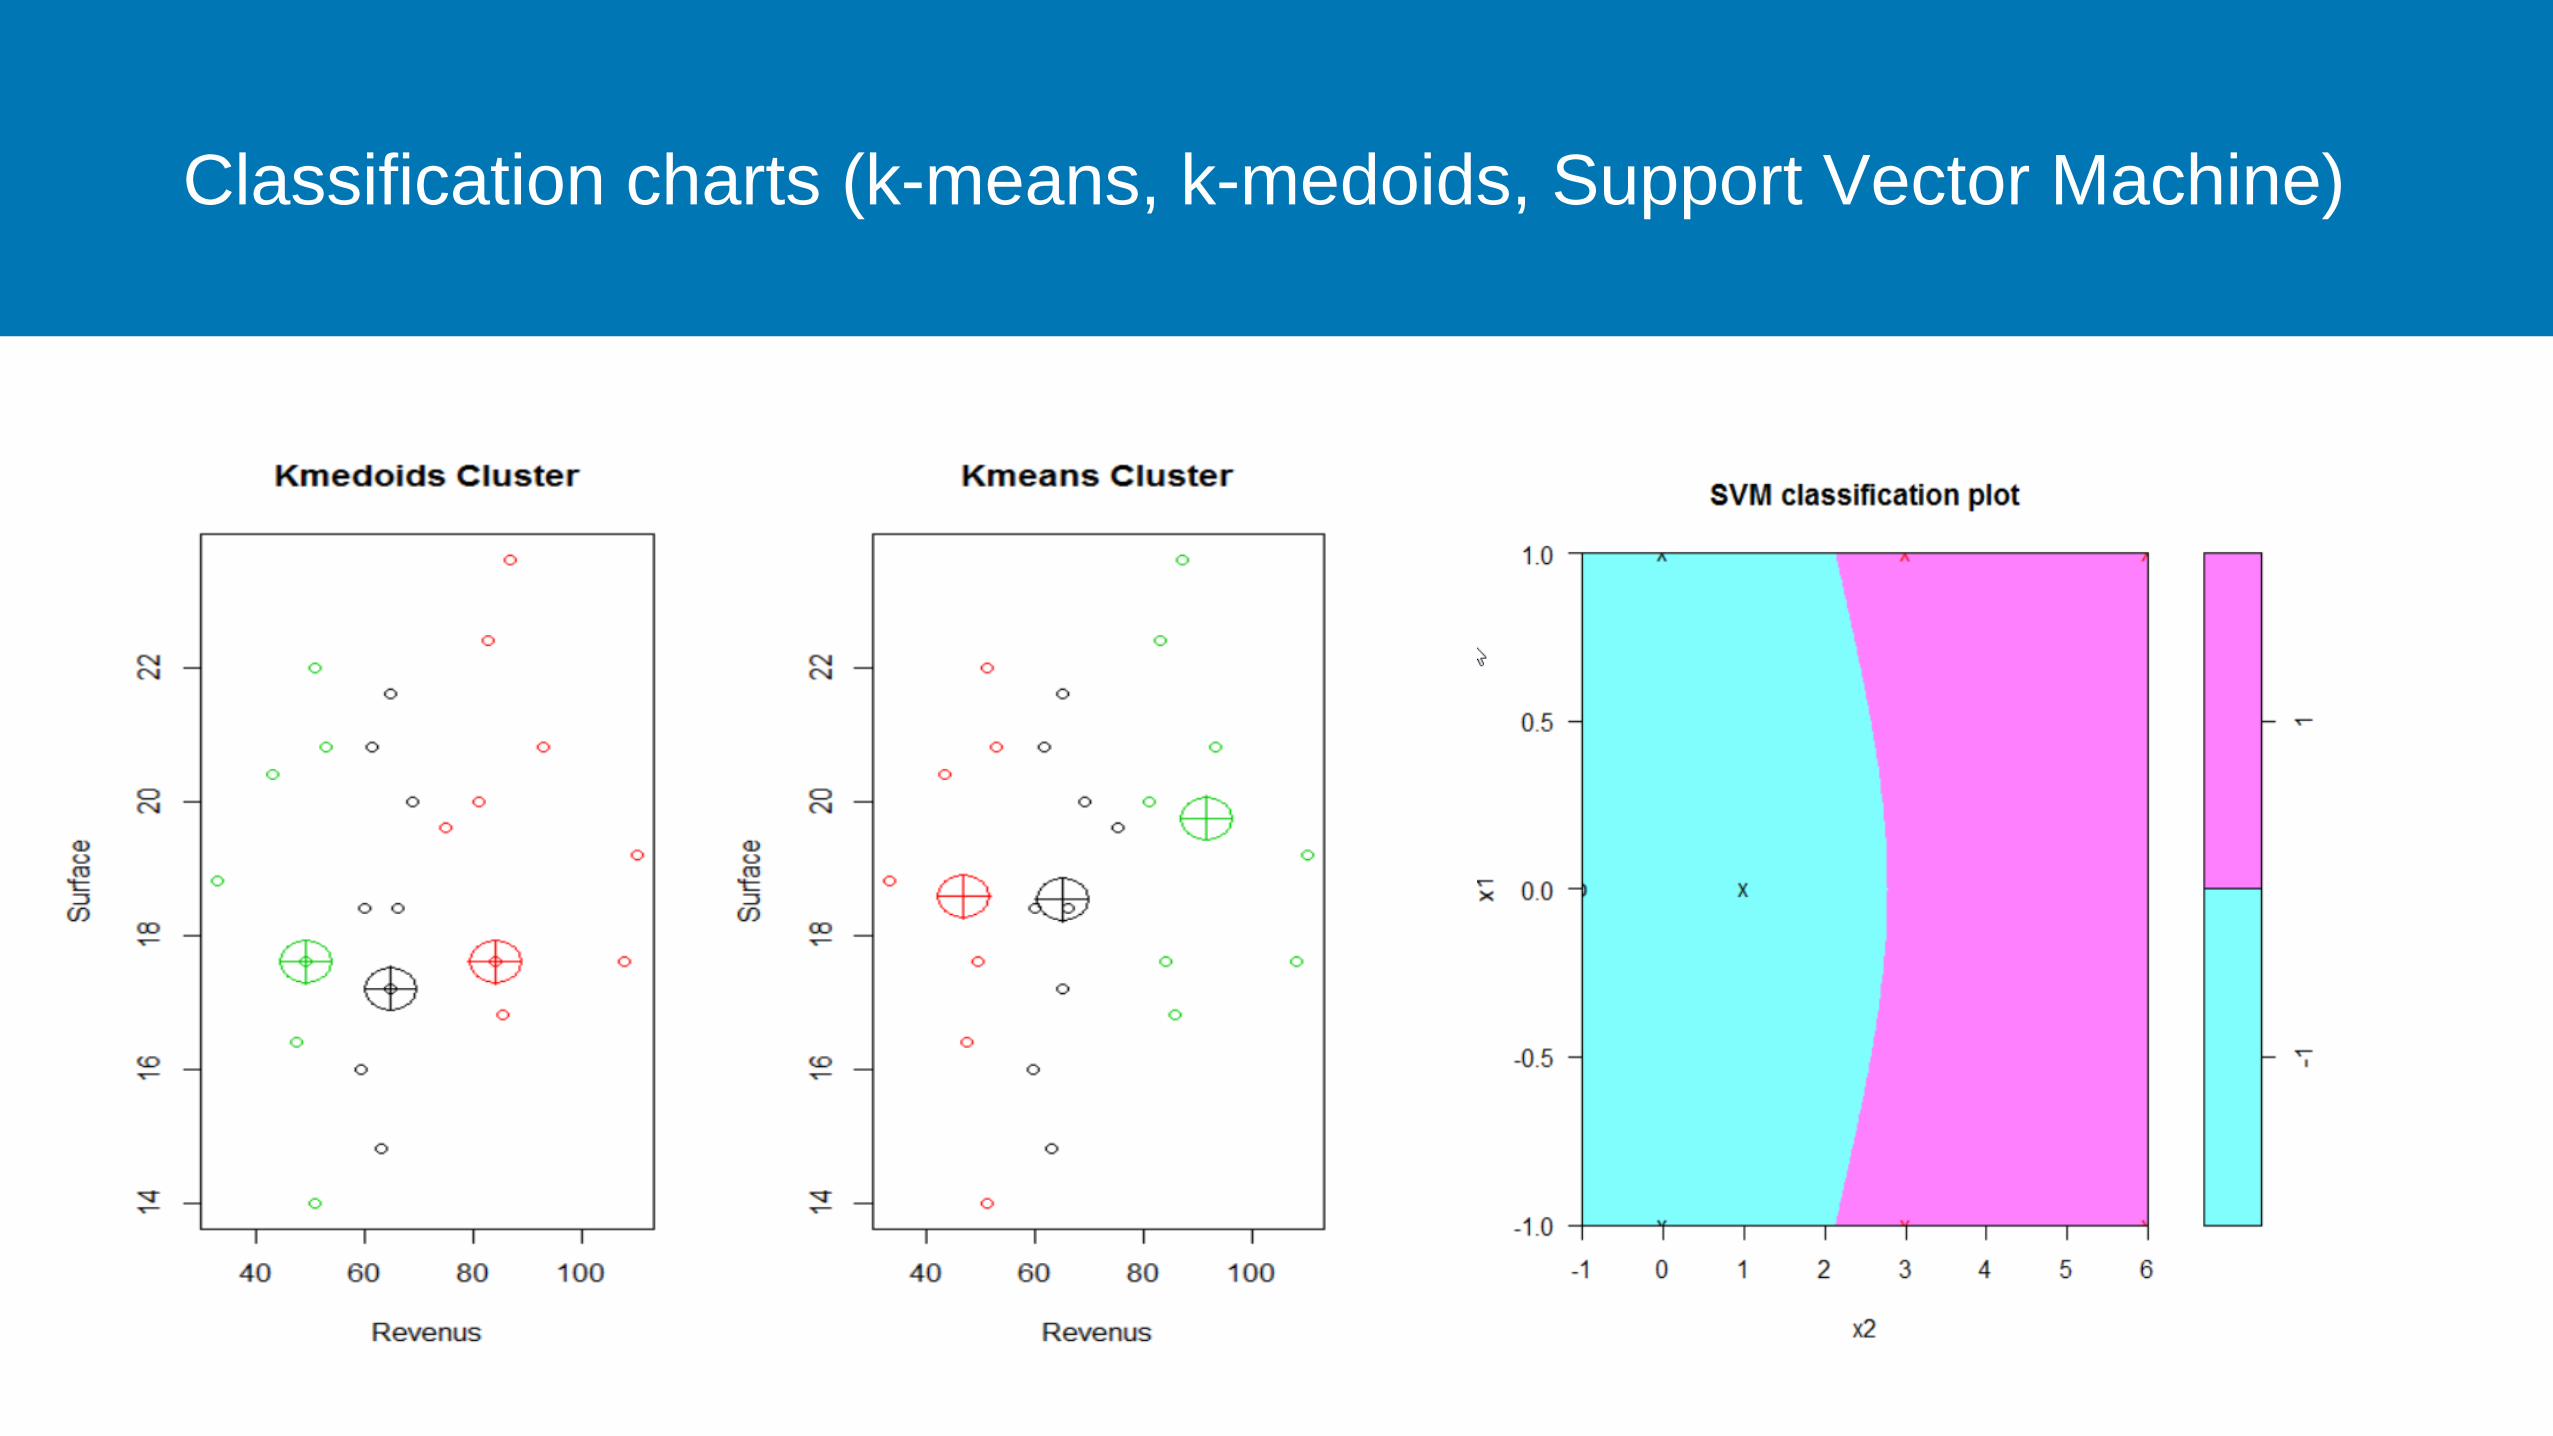
Classification charts (k-means, k-medoids, Support Vector Machine)
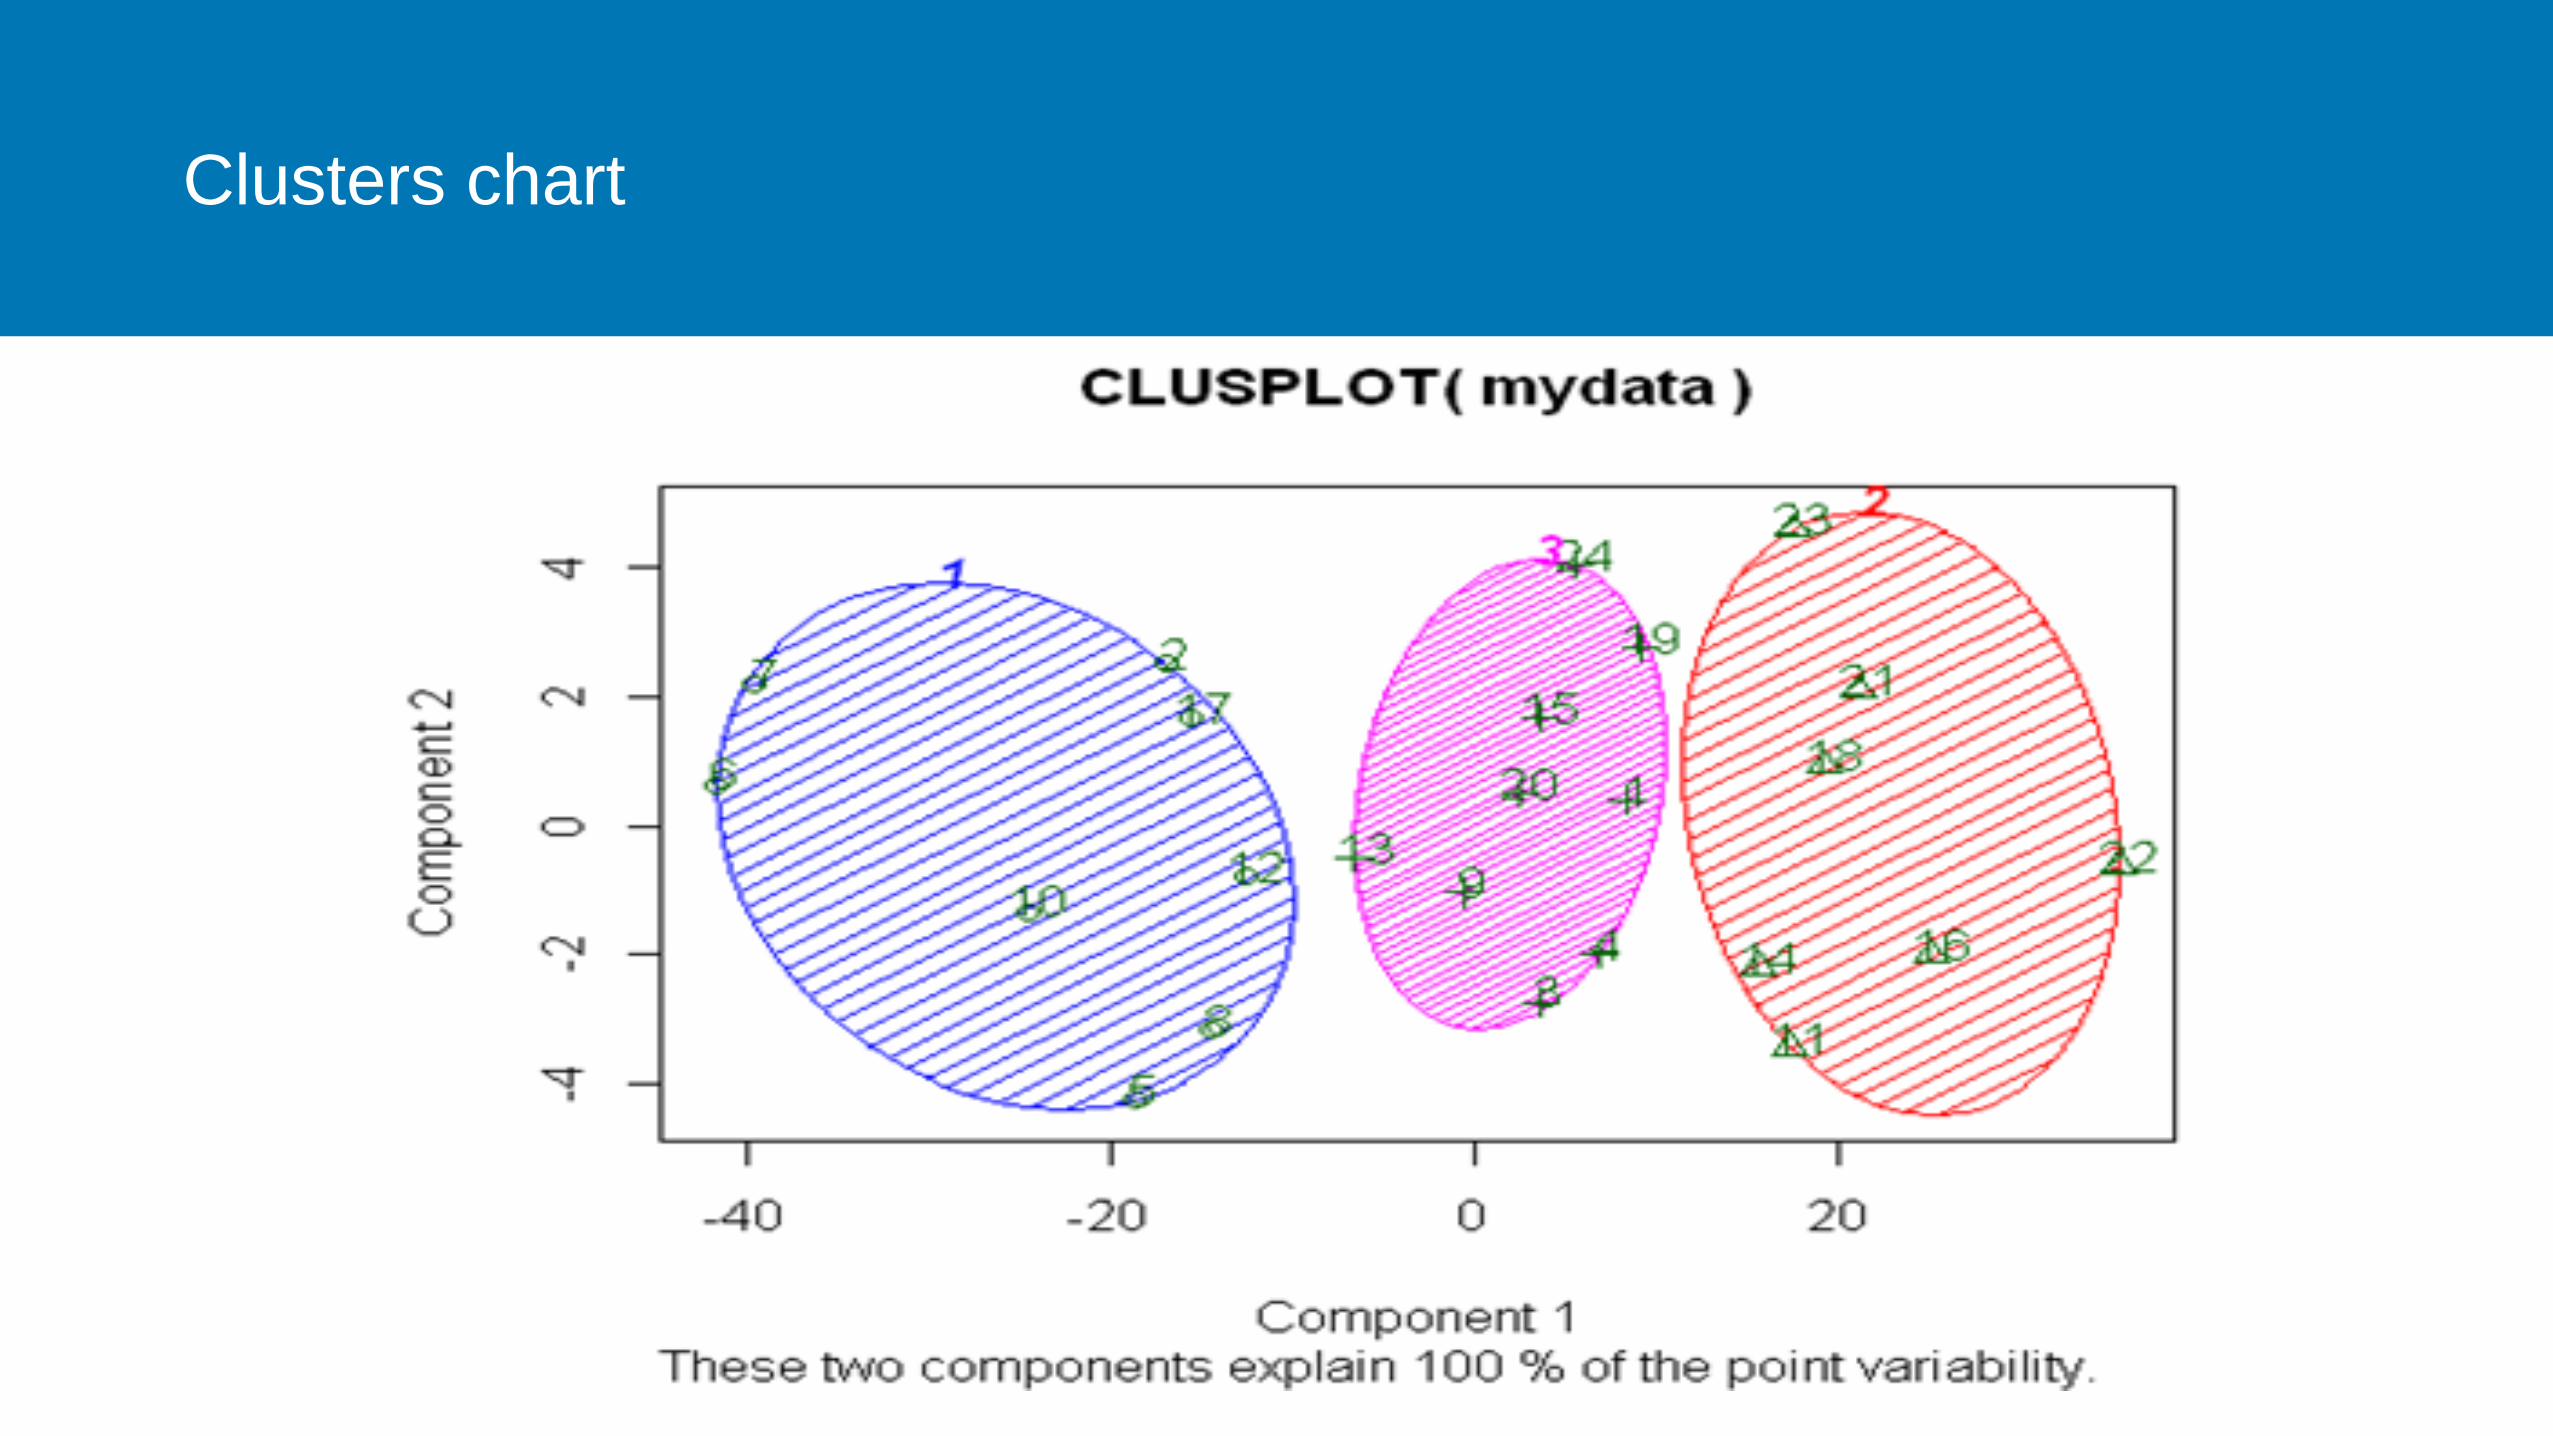
Clusters chart
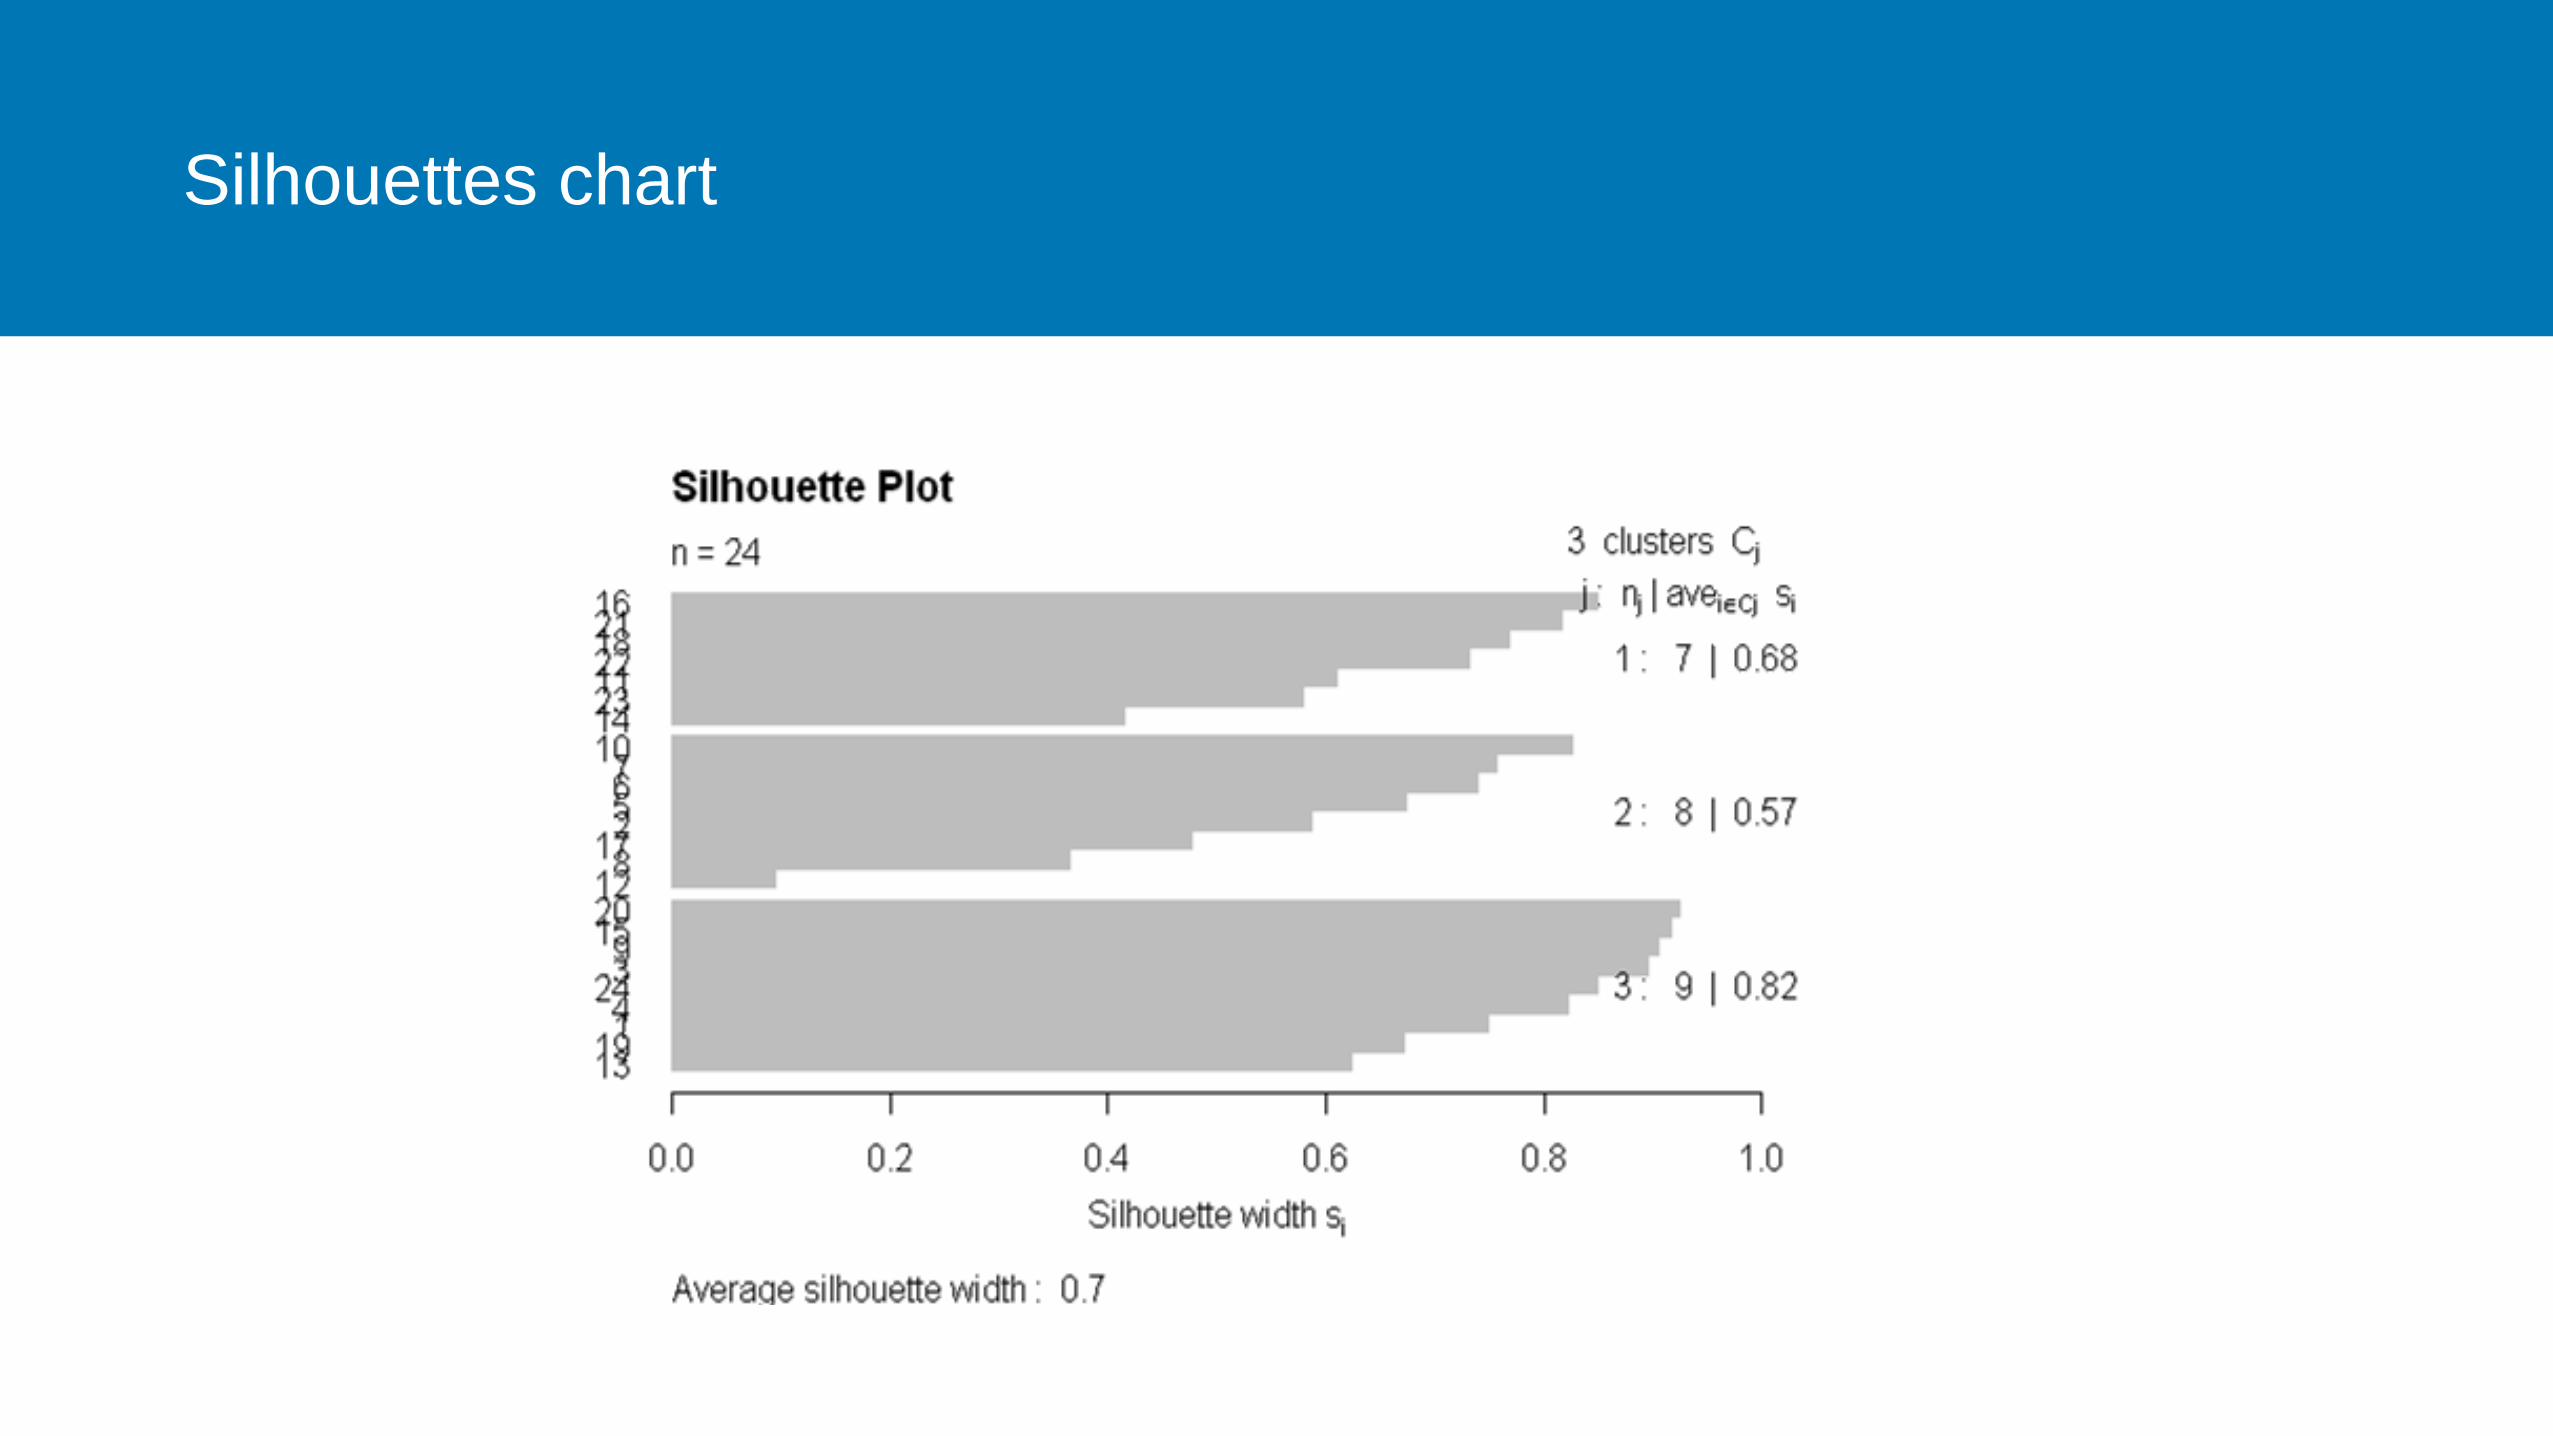
Silhouettes chart

Decision Tree chart

Géostatistiques/SIG

Topographic Map chart
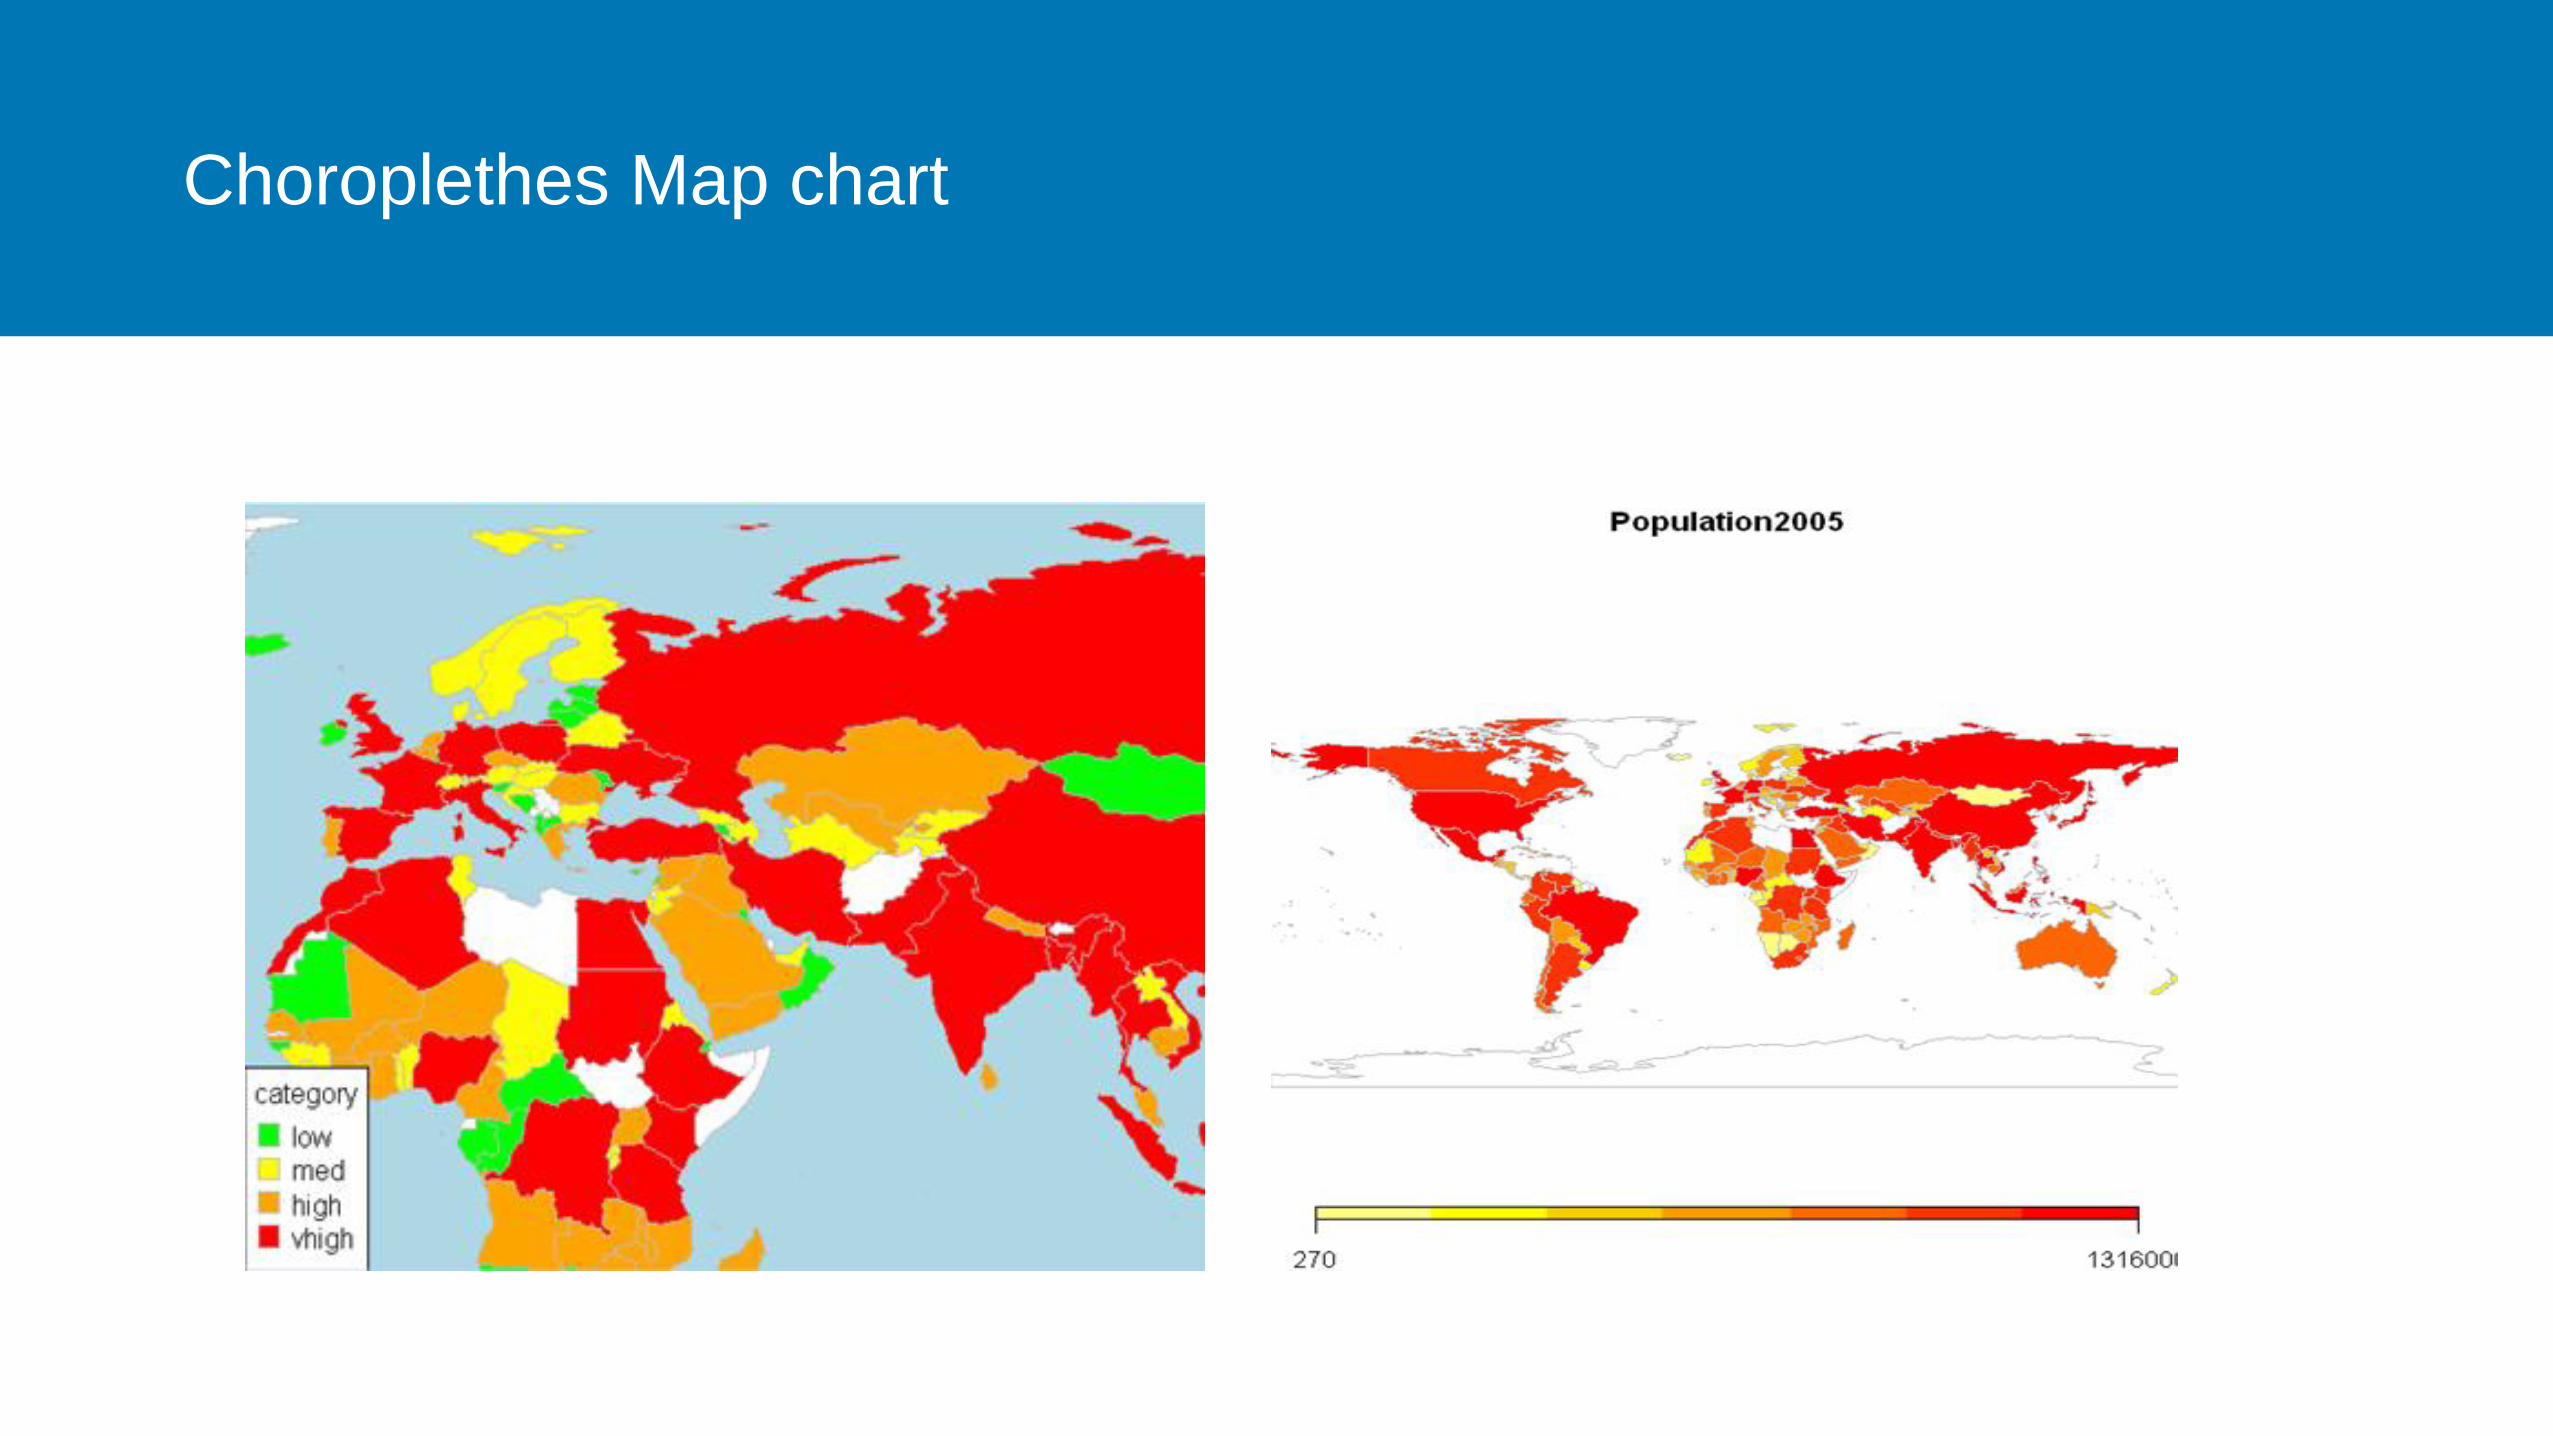
Choroplethes Map chart
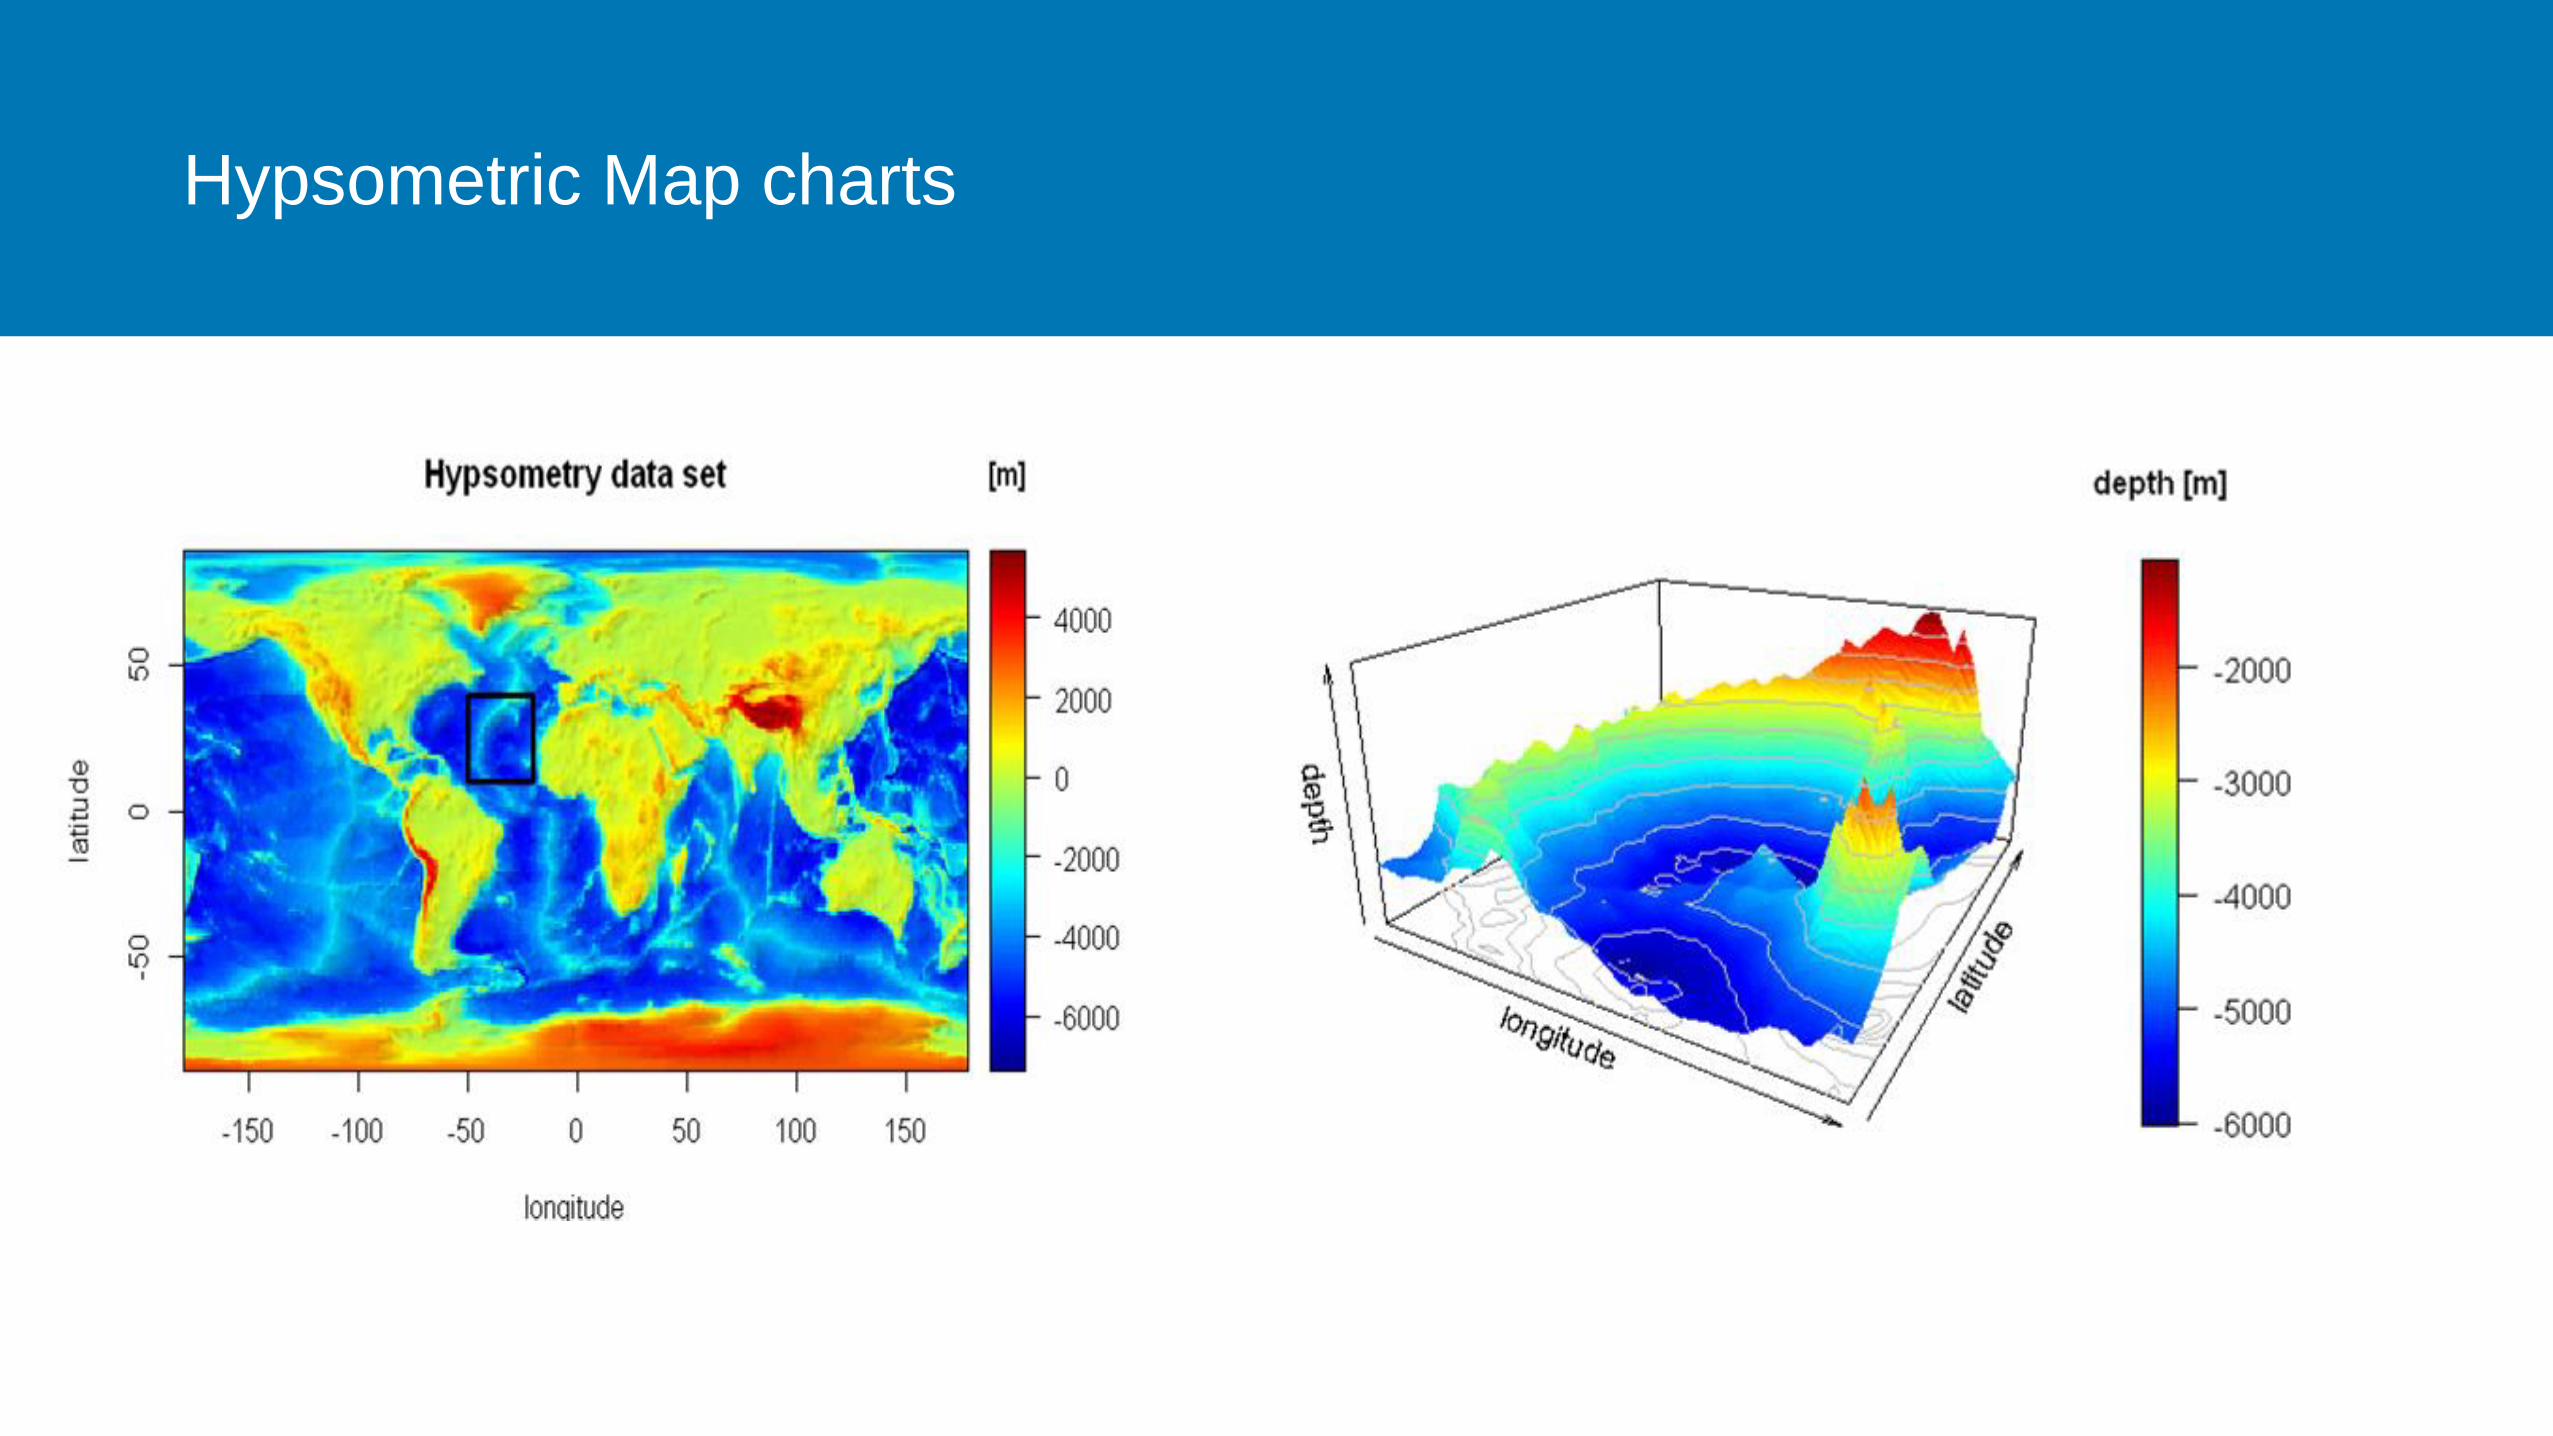
Hypsometric Map charts

Proportional symbols Map chart

Density Map chart
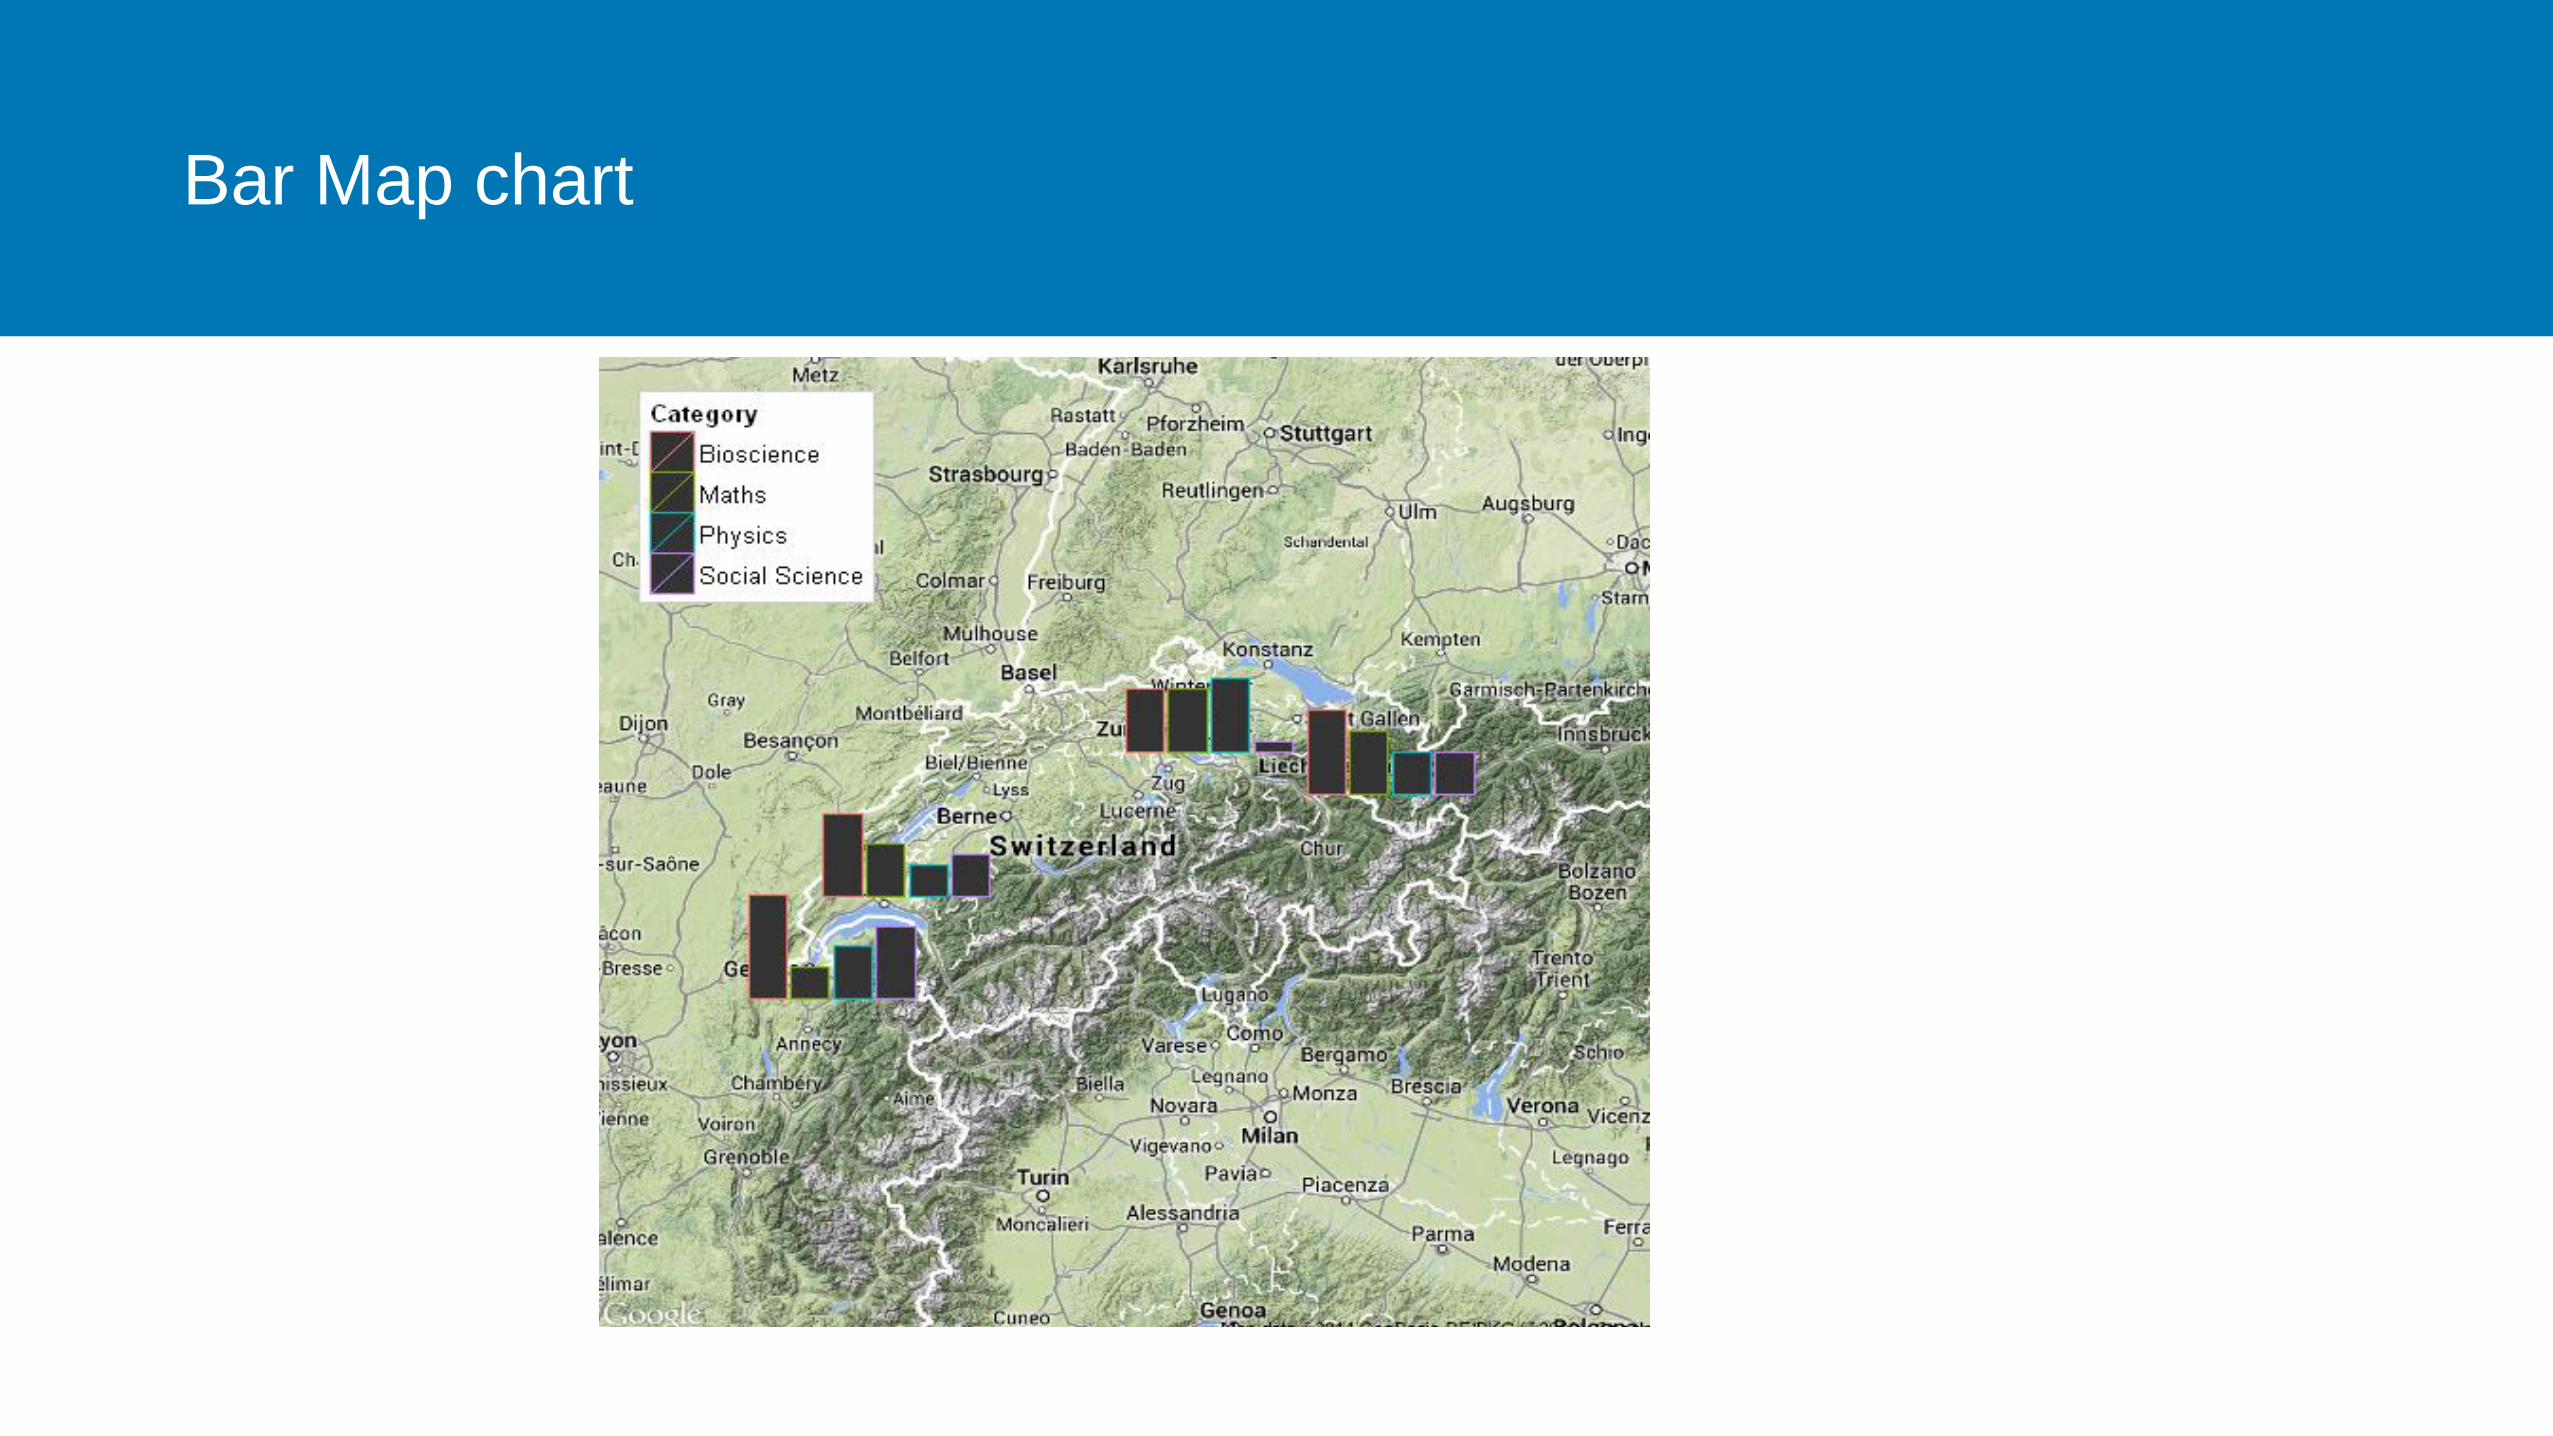
Bar Map chart

Path Map chart
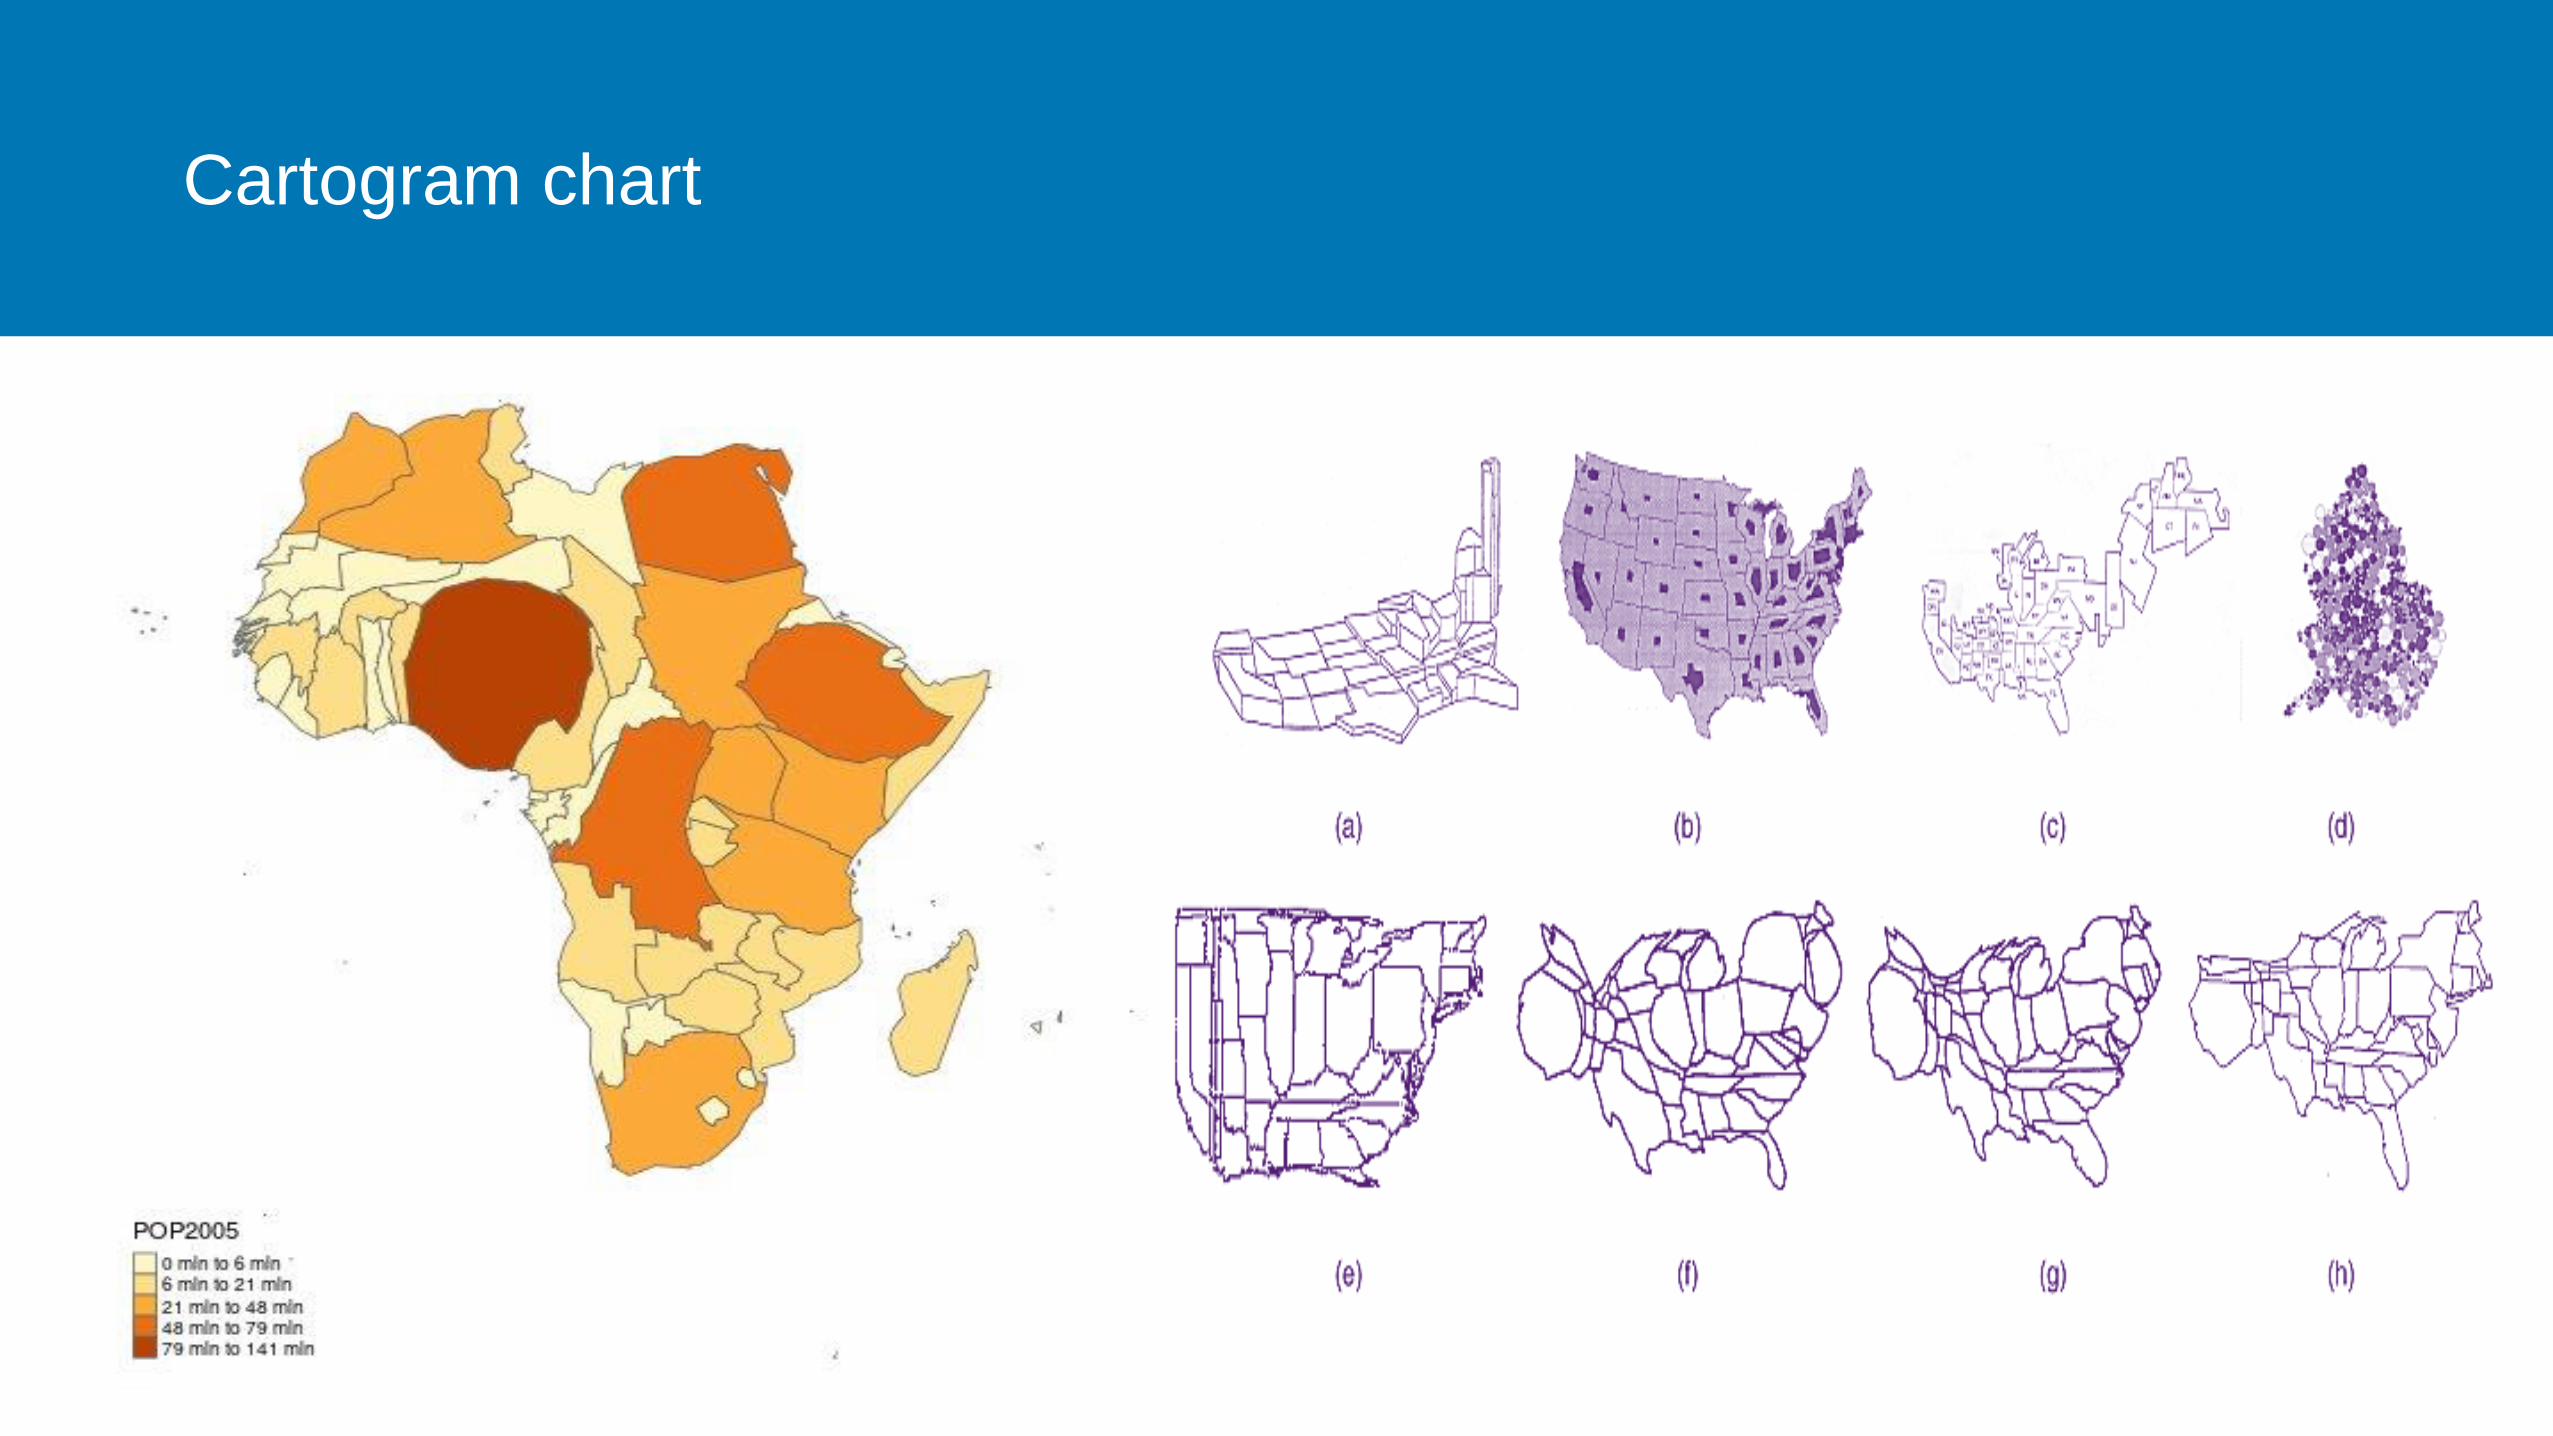
Cartogram chart
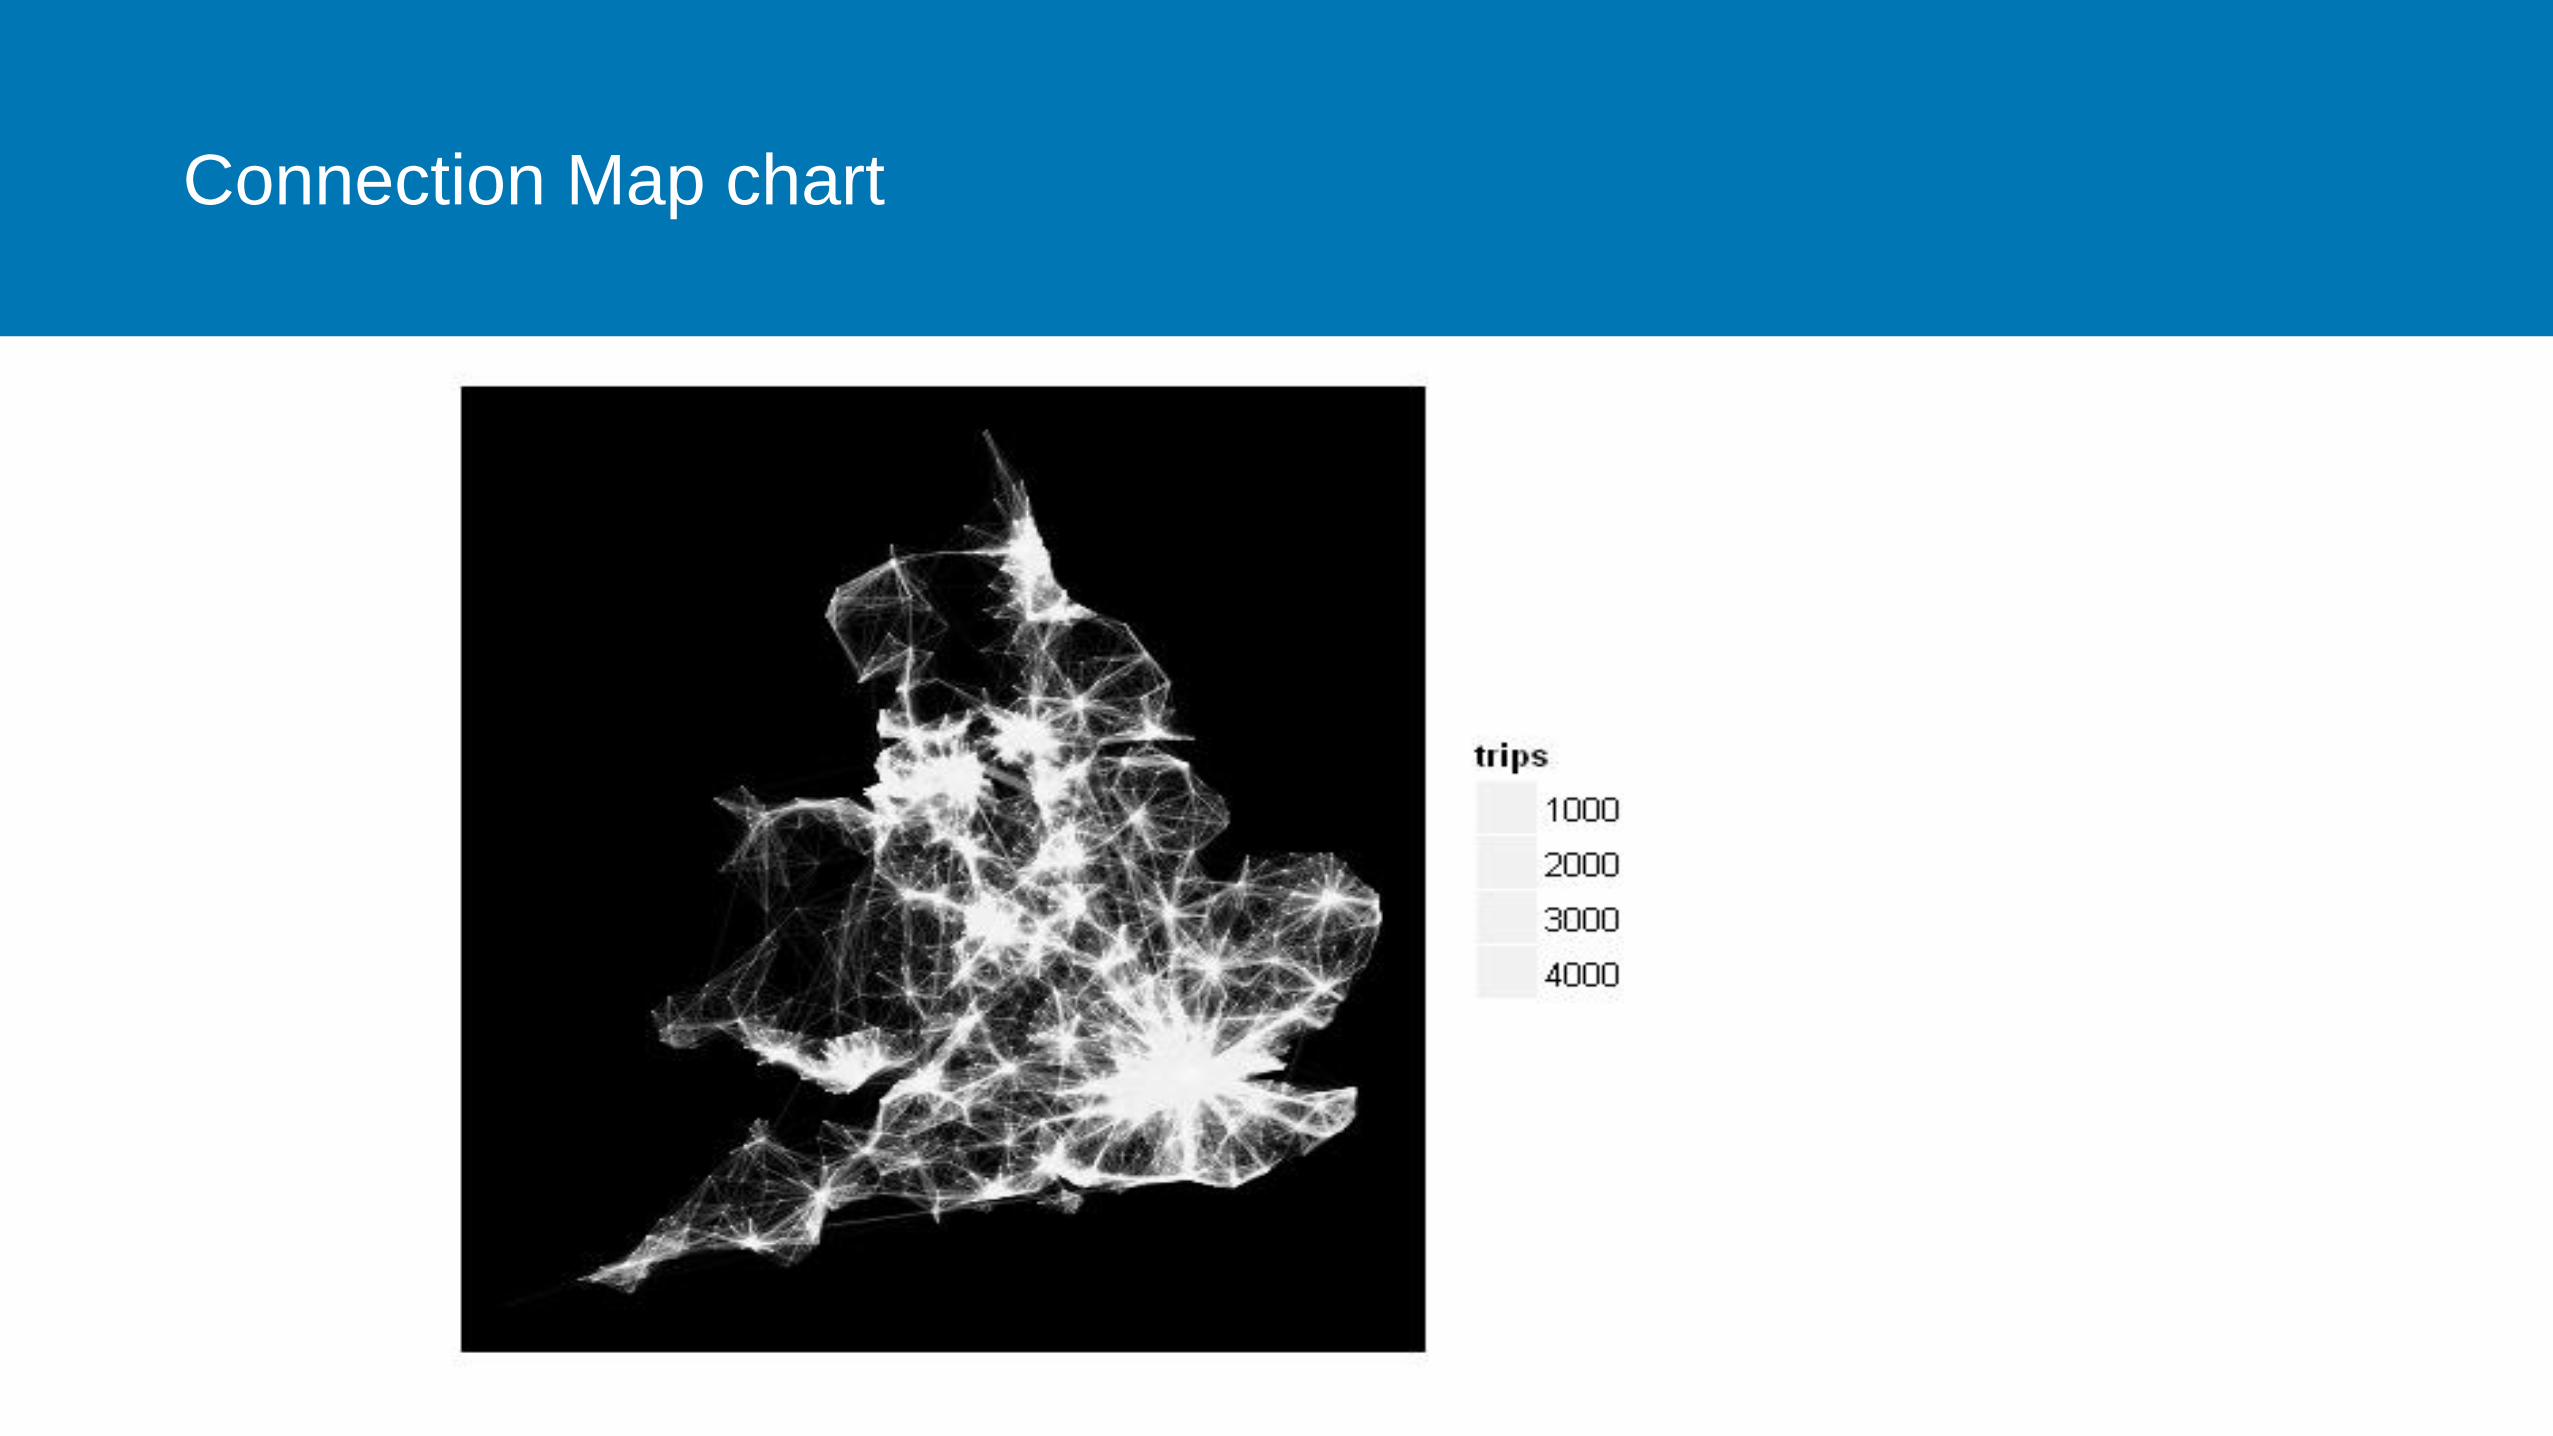
Connection Map chart

Tesselation Map Chart

Biology/Chemistry

Linear Phylogenetic Tree chart

Polar Phylogenetic Tree chart
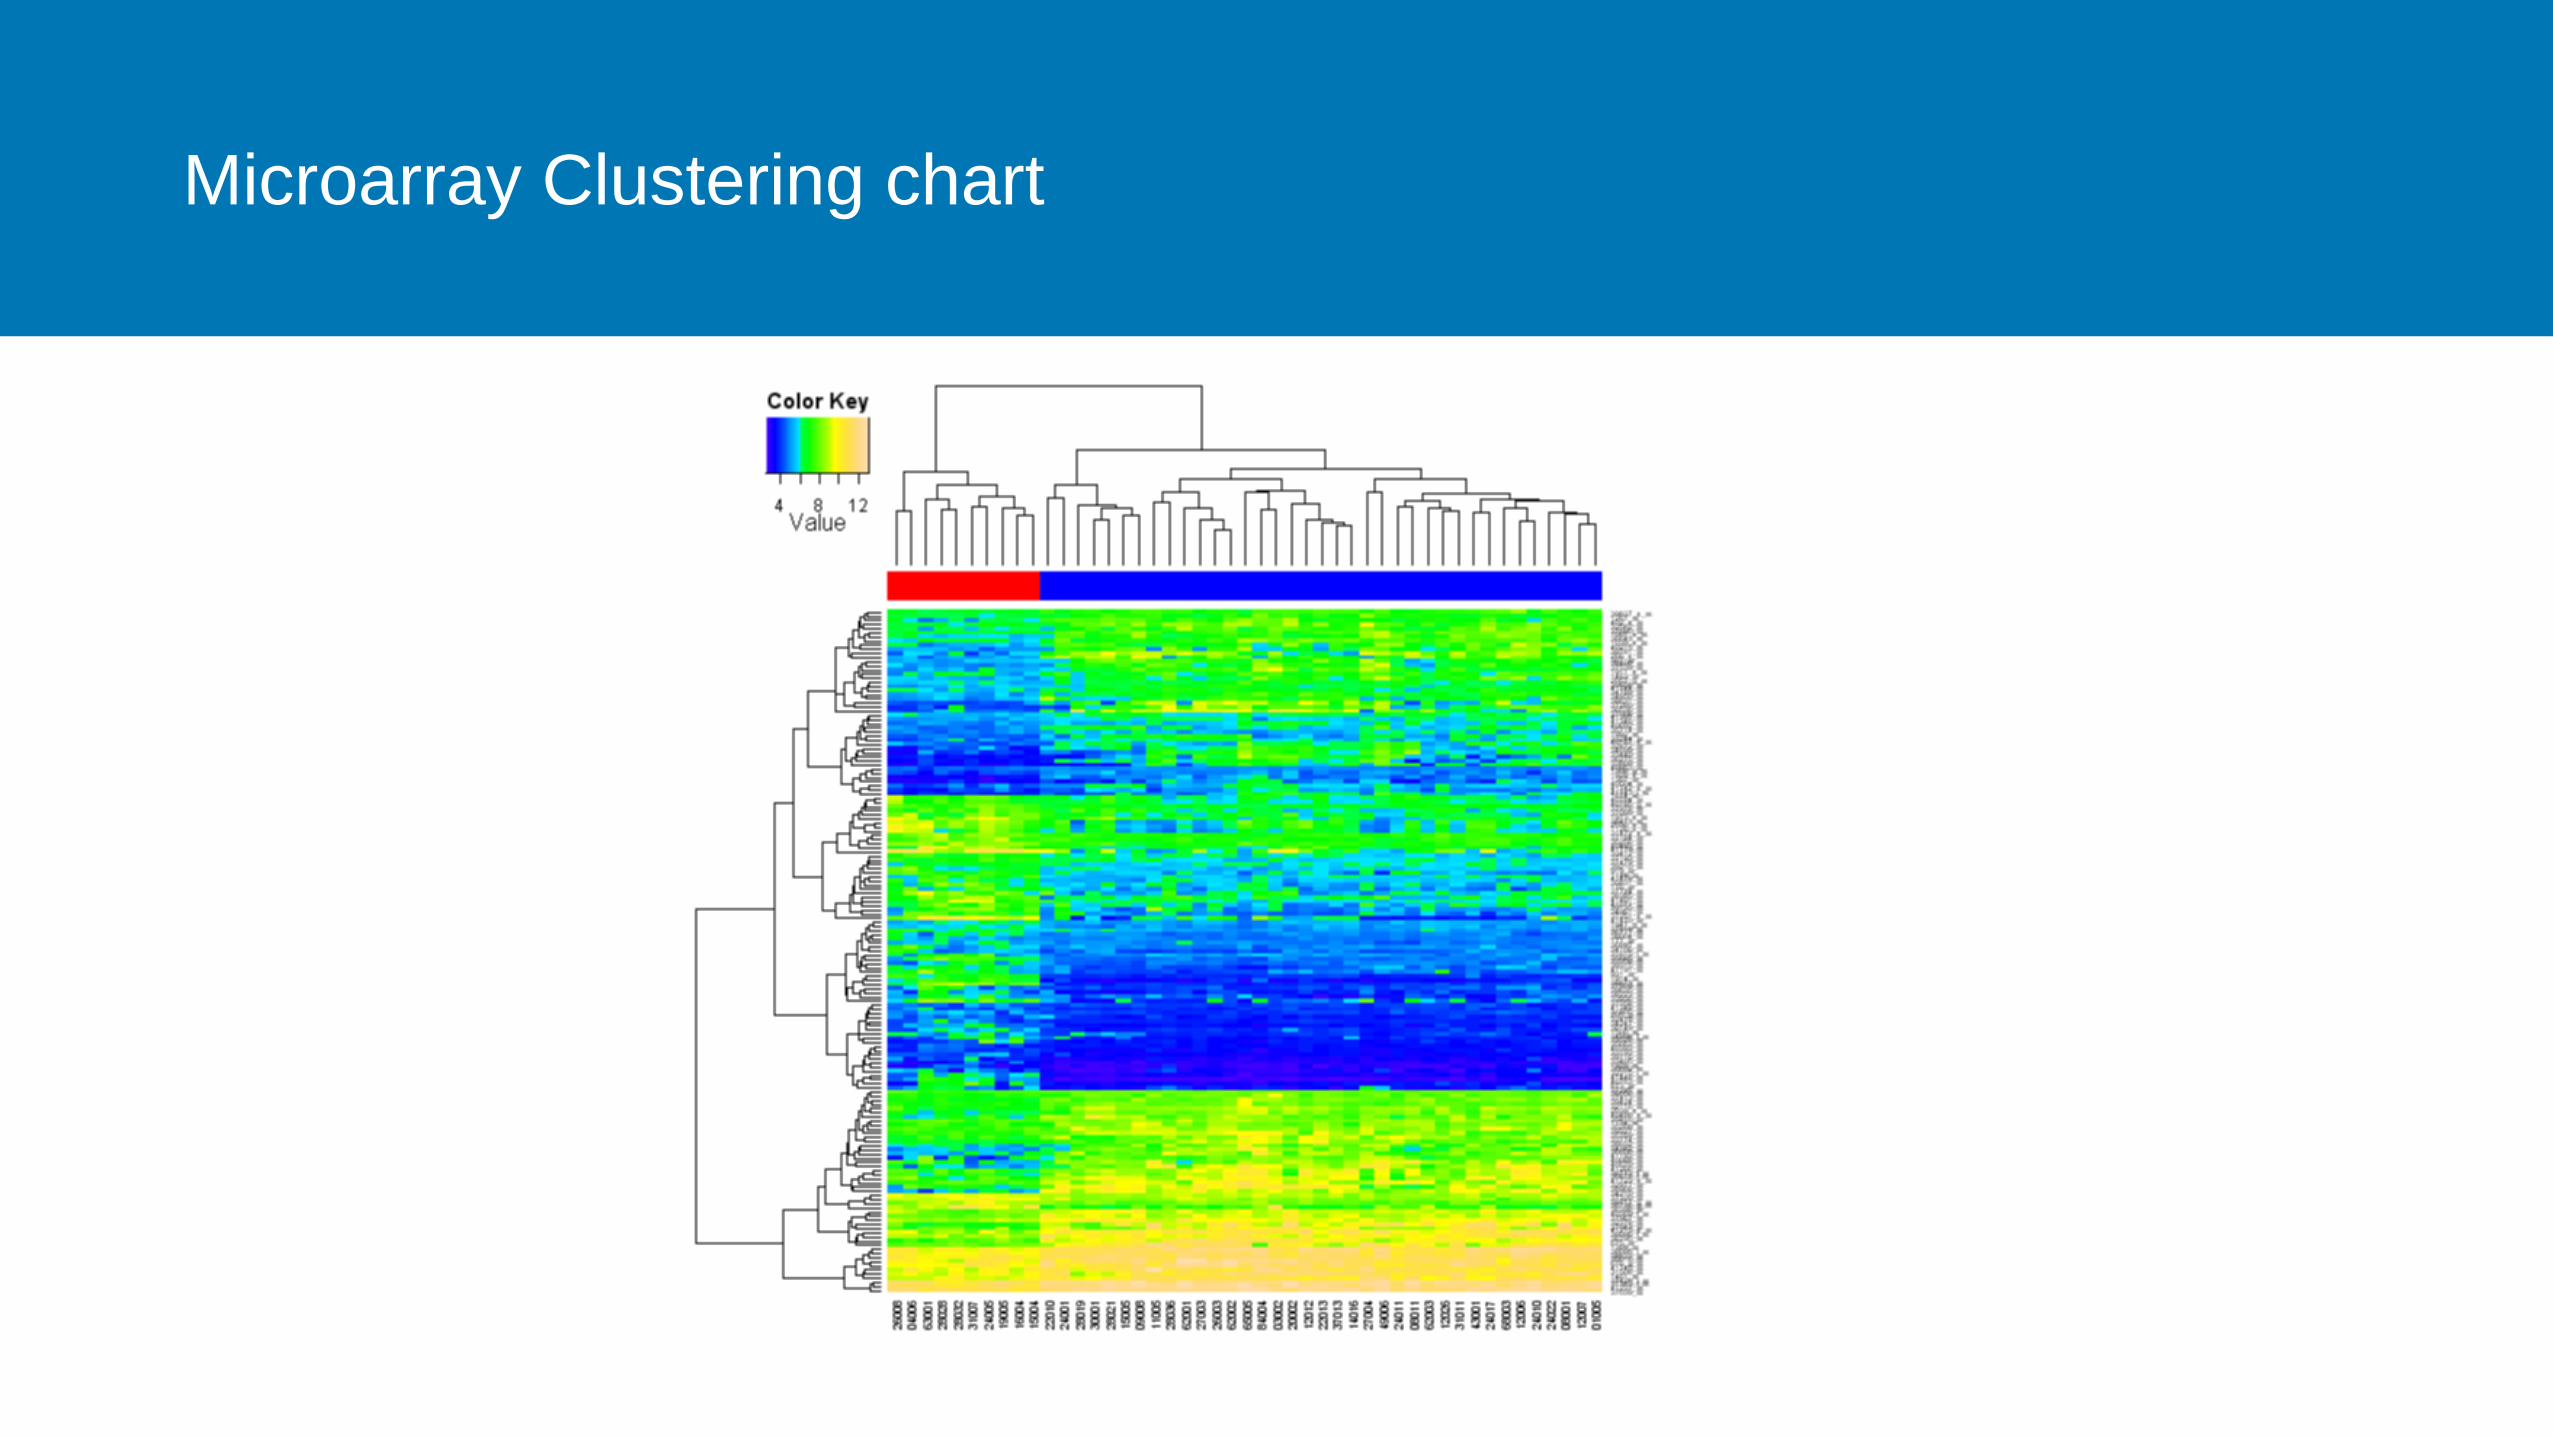
Microarray Clustering chart
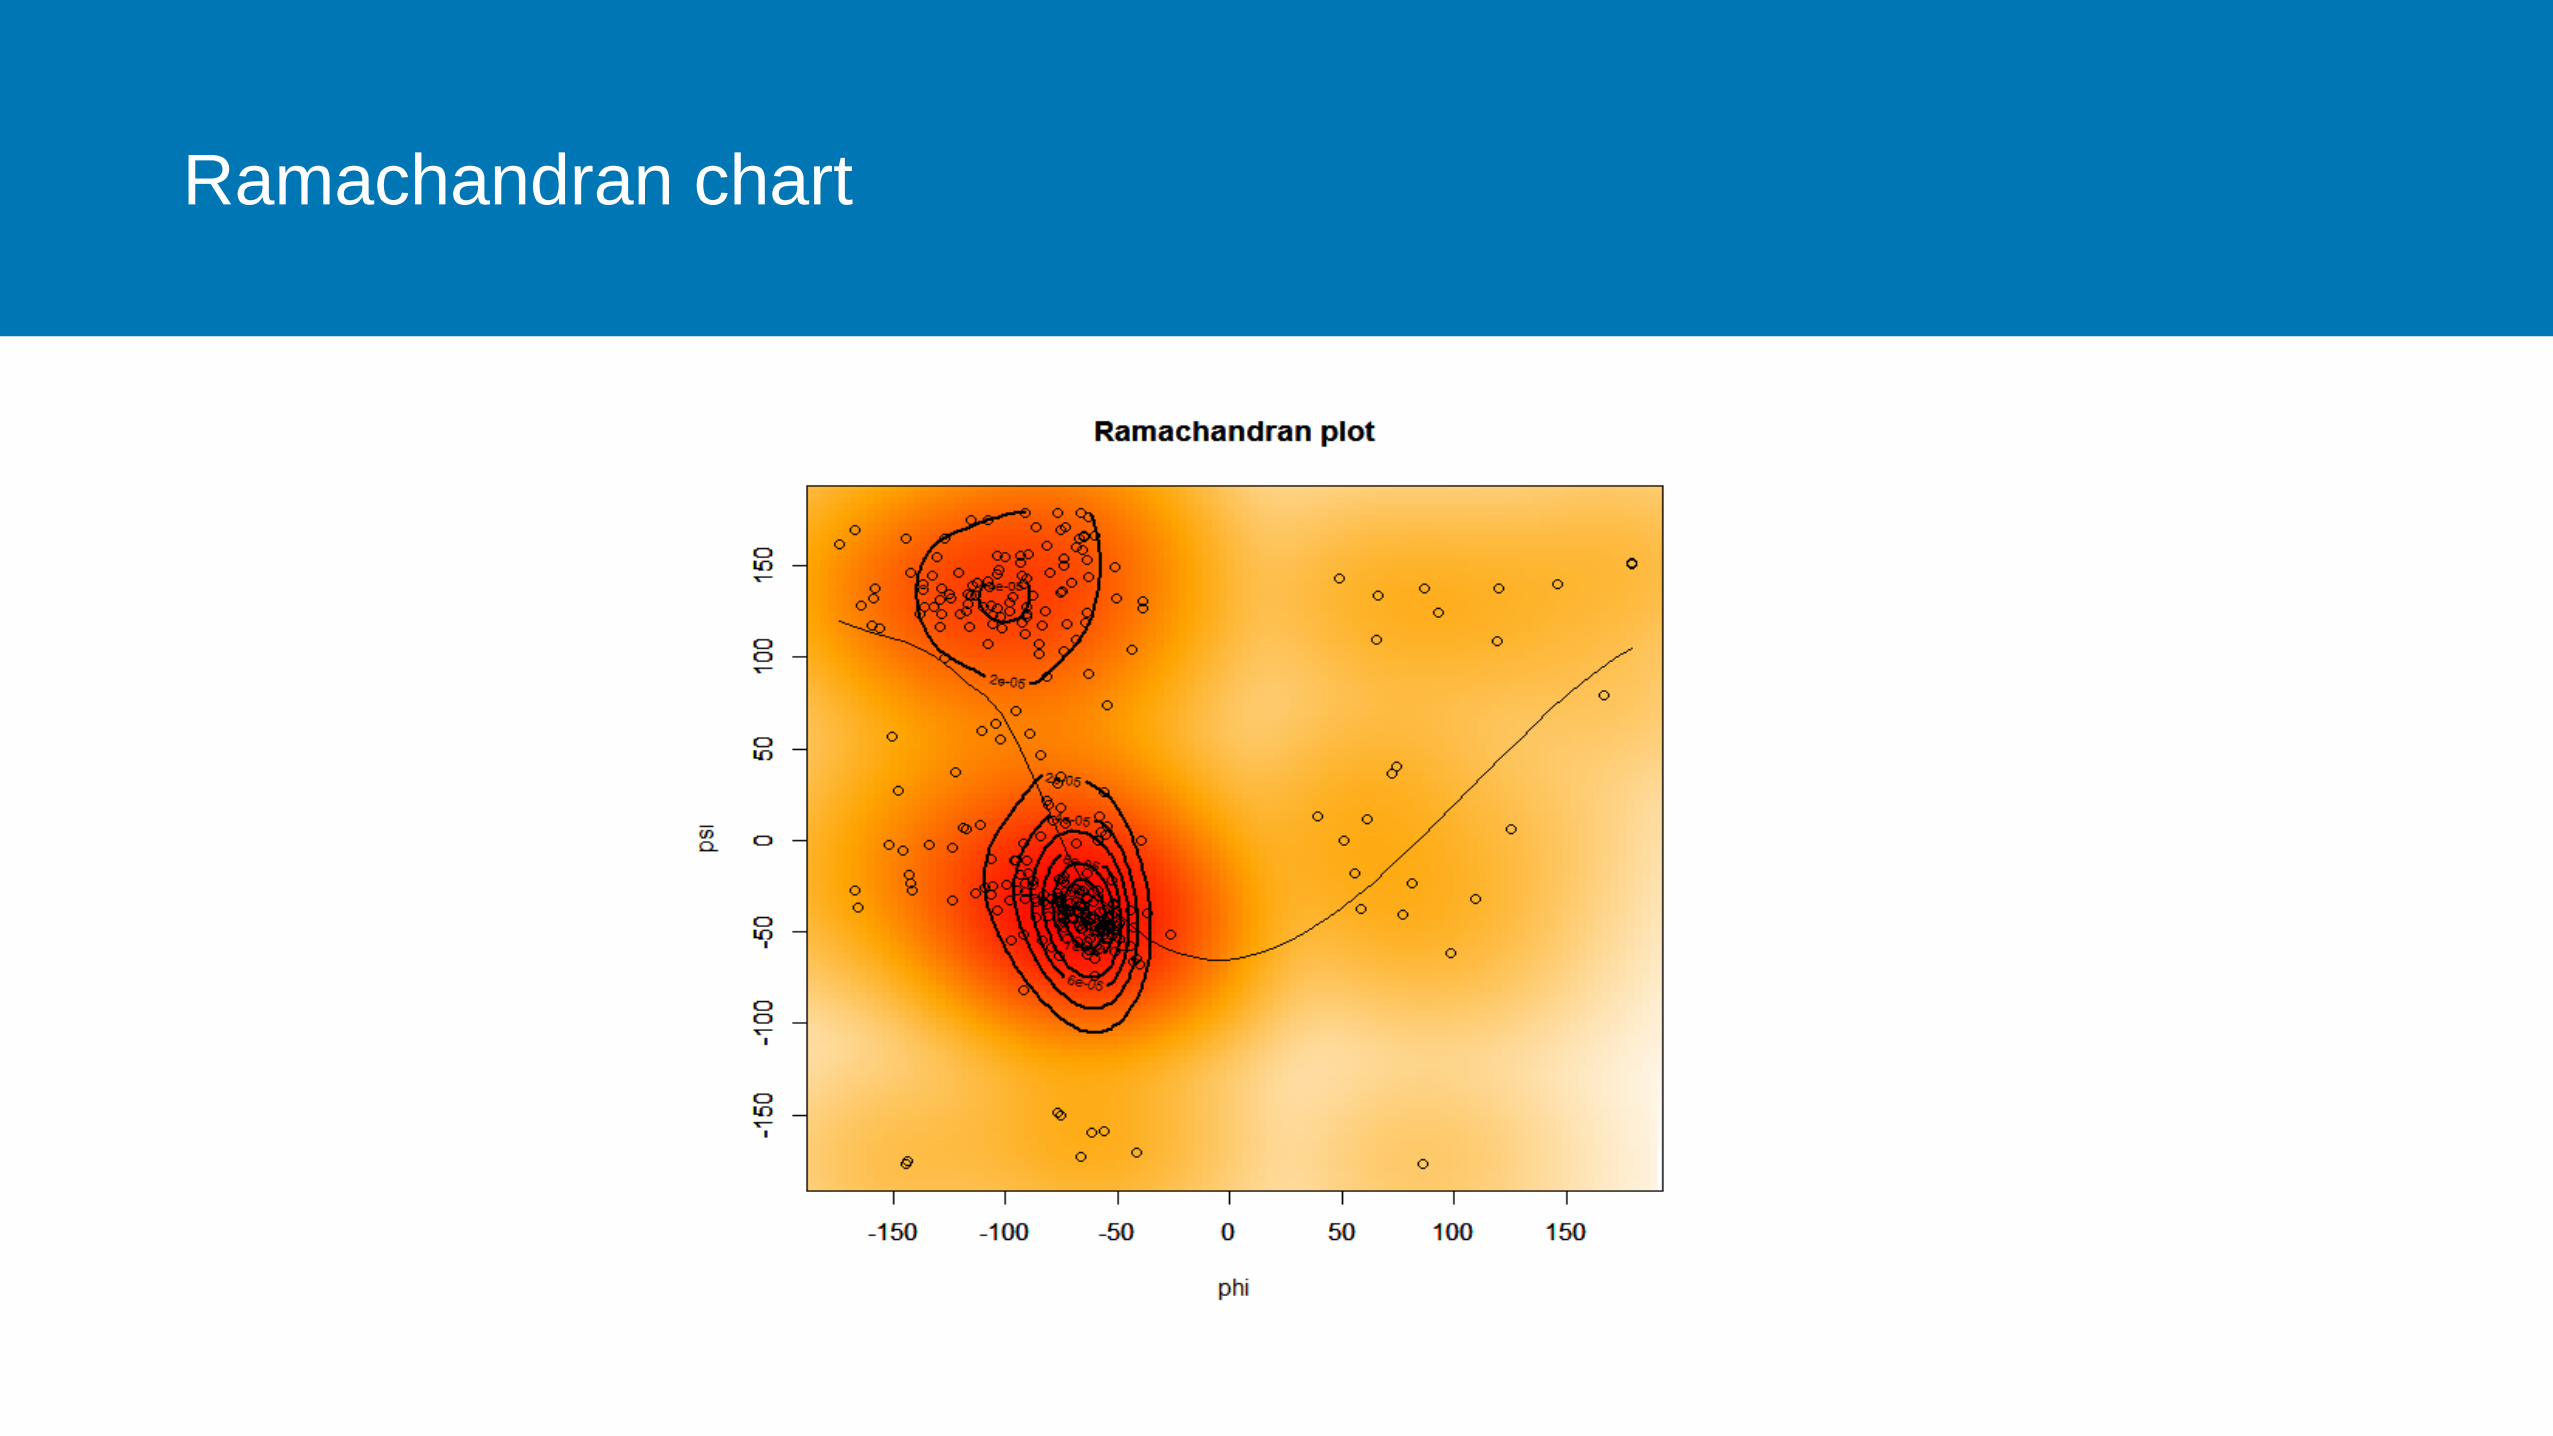
Ramachandran chart

Molecular structures chart

Conclusion


