Embed Size (px)
Citation preview


2 © 2015 Pivotal Software, Inc. All rights reserved. 2 © 2015 Pivotal Software, Inc. All rights reserved.
Internet of Things: Implications for the Enterprise
Rashmi Raghu, Ph.D. Principal Data Scientist

3 © 2015 Pivotal Software, Inc. All rights reserved.
Gene Sequencing
Smart Grids COST TO SEQUENCE ONE GENOME HAS FALLEN FROM
$100M IN 2001
TO $10K IN 2011 TO $1K IN 2014
READING SMART METERS EVERY 15 MINUTES IS 3000X MORE DATA INTENSIVE
Stock Market
Social Media
FACEBOOK UPLOADS 250 MILLION
PHOTOS EACH DAY
Billions of Data Points
Oil Exploration
Video Surveillance
OIL RIGS GENERATE
25000 DATA POINTS PER SECOND
Medical Imaging
Mobile Sensors

4 © 2015 Pivotal Software, Inc. All rights reserved.
Implications for the Enterprise � Organizational – Vision – Preparedness – Execution
� Technical – Data quality & completeness – Heterogeneity of data sources – Technology architecture

5 © 2015 Pivotal Software, Inc. All rights reserved.
Implications for the Enterprise � Organizational – Vision – Preparedness – Execution
� Technical – Data quality & completeness – Heterogeneity of data sources – Technology architecture
Issues in any of these have implications for data science approaches and their effectiveness

6 © 2015 Pivotal Software, Inc. All rights reserved.
Case Studies
Oil Drilling Telecommunications Predictive Maintenance Customer Micro-segmentation

7 © 2015 Pivotal Software, Inc. All rights reserved.
Case Studies
Oil Drilling Telecommunications Predictive Maintenance Customer Micro-segmentation

8 © 2015 Pivotal Software, Inc. All rights reserved.
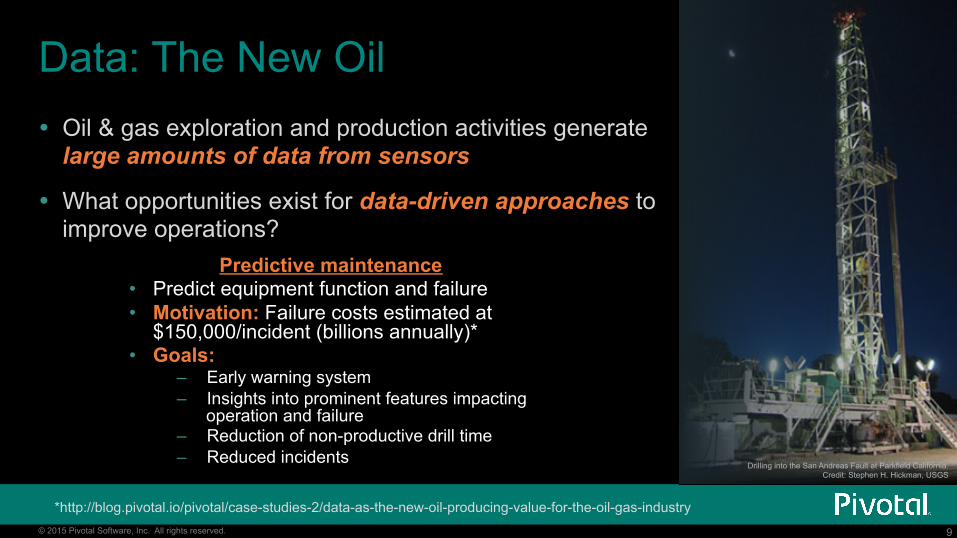
Data: The New Oil � Oil & gas exploration and production activities generate
large amounts of data from sensors
� What opportunities exist for data-driven approaches to improve operations?
Drilling into the San Andreas Fault at Parkfield California. Credit: Stephen H. Hickman, USGS
*http://blog.pivotal.io/pivotal/case-studies-2/data-as-the-new-oil-producing-value-for-the-oil-gas-industry
9 © 2015 Pivotal Software, Inc. All rights reserved.
Data: The New Oil � Oil & gas exploration and production activities generate
large amounts of data from sensors
� What opportunities exist for data-driven approaches to improve operations?
Drilling into the San Andreas Fault at Parkfield California. Credit: Stephen H. Hickman, USGS
*http://blog.pivotal.io/pivotal/case-studies-2/data-as-the-new-oil-producing-value-for-the-oil-gas-industry
Predictive maintenance • Predict equipment function and failure • Motivation: Failure costs estimated at
$150,000/incident (billions annually)* • Goals:
– Early warning system – Insights into prominent features impacting
operation and failure – Reduction of non-productive drill time – Reduced incidents

10 © 2015 Pivotal Software, Inc. All rights reserved.
Predictive Maintenance for Drilling Operations
Integrating & Cleansing
Feature Building Modeling

11 © 2015 Pivotal Software, Inc. All rights reserved.
Primary Data Sources
Integrating & Cleansing
Feature Building Modeling
Integrated Data
Primary data sources
Operator Data ( ~ thousands of records )
• Failure details • Component details • Drill Bit details
Drill Rig Sensor Data ( ~ billions of records )
• Rate of Penetration (ROP) • RPM • Weight on Bit (WOB) …

12 © 2015 Pivotal Software, Inc. All rights reserved.
Primary Data Sources: Challenges
Integrating & Cleansing
Feature Building Modeling
Primary data sources
Operator Data ( ~ thousands of records )
• Failure details • Component details • Drill Bit details
Drill Rig Sensor Data ( ~ billions of records )
• Rate of Penetration (ROP) • RPM • Weight on Bit (WOB) …
Challenges • Failure instances not clearly labeled • Labels may be embedded in reports or comments
Implications • Dependent variable generation also becomes a
machine learning exercise • Accuracy of failure prediction impacted by
accuracy of failure label derivation

13 © 2015 Pivotal Software, Inc. All rights reserved.
Primary Data Sources: Challenges
Well ID Depth Comment Event flag
1 1000 equipment not responding 1
2 2000 TOOH to bit. rubber pieces seen 1
Integrating & Cleansing
Feature Building Modeling
• Dependent variable generation – a machine learning exercise • Text analytics pipeline needed to convert failure reports or comments to event flags
14 © 2015 Pivotal Software, Inc. All rights reserved.
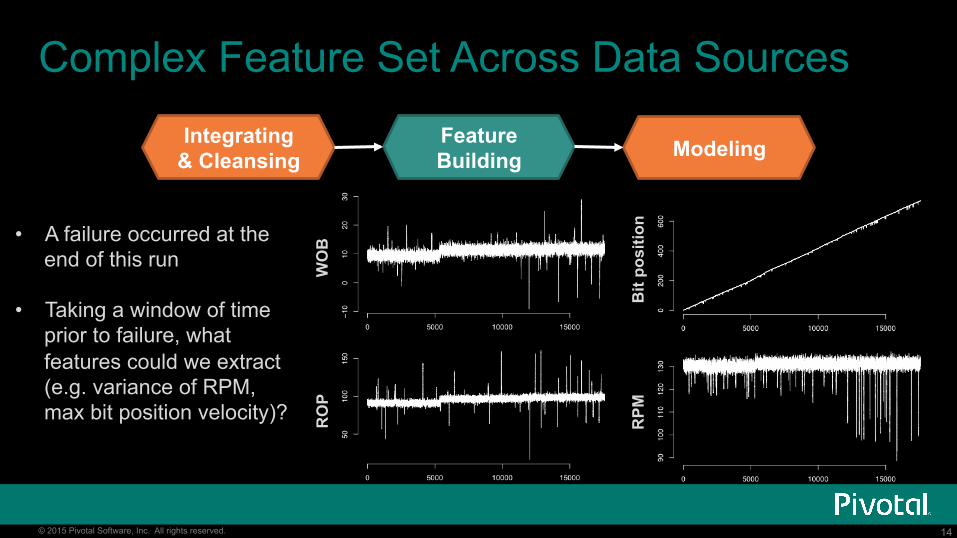
Complex Feature Set Across Data Sources
Integrating & Cleansing
Feature Building Modeling
• A failure occurred at the end of this run
• Taking a window of time prior to failure, what features could we extract (e.g. variance of RPM, max bit position velocity)?
Bit
posi
tion
RPM
RO
P W
OB

15 © 2015 Pivotal Software, Inc. All rights reserved.
Complex Feature Set Across Data Sources
• Depth • Rate of Penetration • Torque • Weight on Bit • RPM • …
• Drill Bit details • Component
details etc. • Failure events • …
Features on Time
Windows
• Mean • Median • Standard Deviation • Range • Skewness • …
Final Set of Features on
Time Windows
• Leverage GPDB / HAWQ (+ MADlib, PL/X) for fast computation of hundreds of features over time windows within billions of rows (or more) of time-series data
Operator data
Drill Rig Sensor
data

16 © 2015 Pivotal Software, Inc. All rights reserved.
Predictive Maintenance App Pipeline
Data Lake
Ingest
Business Levers
Early Warning System Rig Operator Dashboard
Models • Elastic Net Regression • Cox Proportional
Hazards Regression • Decision Trees
Initial data cleansing filters
Wells with failure scores and early
warning indicators
Feedback loop for continuous model improvement Domain
Knowledge
Oil Rig Operator
HAWQ
GPDB PL/X
MADlib
R Python
C Java Perl
Spark + MLlib

17 © 2015 Pivotal Software, Inc. All rights reserved.
Case Studies
Oil Drilling Telecommunications Predictive Maintenance Customer Micro-segmentation

18 © 2015 Pivotal Software, Inc. All rights reserved.
State of Data at Telco Company
Customer Segments
New Data Sources
Multi-Gadget Families Affluent Matures
Thrifty Families High Tech Singles
Budget Singles Seniors
Internet Deep Packet Inspection TV Consumption (Linear)
Video On Demand Consumption

19 © 2015 Pivotal Software, Inc. All rights reserved.
Native Services
Video On Demand TV Internet
Internet Devices
OTT (Over The Top) Services
What is the level of engagement with client’s products (TV, VOD, Internet)?
What are the patterns of device usage behavior?
What is the level of OTT engagement, by segment, and by bandwidth?
Understanding Subscriber Behavior

20 © 2015 Pivotal Software, Inc. All rights reserved.
Newly Identified Behavior-Based Segments S
ubsc
riber
s
Moderates
OTT & Data Heavyweights
Portable OTT Entertainment Seekers
iPhone Heavy
Android Heavy
iPad Heavy
In-Home OTT Entertainment Seekers
In-Home Native Content Seekers
VOD Heavy
TV Heavy

21 © 2015 Pivotal Software, Inc. All rights reserved.
Moderates
OTT & Data Heavyweights
In-Home OTT Entertainment Seekers
Portable OTT Entertainment Seekers - iPhone Heavy
Portable OTT Entertainment Seekers - Android Heavy
Portable OTT Entertainment Seekers - iPad Heavy
In-Home Native Content Seekers - VOD Heavy
In-Home Native Content Seekers - TV Heavy
Cross Behavior-based and Existing Segments New Behavior-Based Segments
Customized Micro-Segments!
Existing Segments
Multi-Gadget Families
Affluent Matures
Thrifty Families
Budget Singles
High Tech Singles
Seniors

22 © 2015 Pivotal Software, Inc. All rights reserved.
Heterogeneous Data Sources � Prevalence of new data sources was
limited but increasing – Rich usage data available on a
subset of the subscribers – Leads to limited applicability of
micro-segments
� Lack of data may be alleviated by expanding data science efforts – Leverage micro-segmentation model to
score a different subset of subscribers (who we have limited data on)
New Data Sources
Internet Deep Packet Inspection TV Consumption (Linear)
Video On Demand Consumption

23 © 2015 Pivotal Software, Inc. All rights reserved.
Driving New Business Value
Upsell and Cross-Sell New Product Offerings Data Monetization

24 © 2015 Pivotal Software, Inc. All rights reserved.
Implications for the Enterprise � Organizational – Vision – Preparedness – Execution
� Technical / Data – Data quality & completeness – Heterogeneity of data sources – Technology architecture
• Data quality & completeness: • Data capture mechanisms can have a lasting impact on ability to solve a
business problem • Heterogeneity of data sources:
• Existence of legacy systems & devices may limit the applicability of new models unless that is taken into account ahead of time
• Feedback to spur upgrading of equipment wherever possible

25 © 2015 Pivotal Software, Inc. All rights reserved.
Implications for the Enterprise � Creating value from IoT requires organizational and technical alignment
� Impacts of these considerations on data science efforts and outcomes are non-trivial
� Specific impacts of data issues include: – Longer time to realization of value – Model accuracy issues – Limited applicability of results – And more …

26 © 2015 Pivotal Software, Inc. All rights reserved.
For further information, checkout … � Pivotal Blog @ http://blog.pivotal.io
� Pivotal Data Science Blog @ http://blog.pivotal.io/data-science-pivotal
� Pivotal Data Product Info, Docs and Downloads @ http://pivotal.io/big-data
� Oil & Gas Use Case Webinar: – Video: https://www.youtube.com/watch?v=dhT-tjHCr9E – Slides: http://www.slideshare.net/Pivotal/data-as-thenewoil
� Blogs: – Oil & Gas Use Case:
http://blog.pivotal.io/pivotal/case-studies-2/data-as-the-new-oil-producing-value-for-the-oil-gas-industry
– Time Series Analysis: http://blog.pivotal.io/tag/time-series-analysis