Embed Size (px)
Citation preview

Sales of Orthopedic Equipment
Xiaomeng (Mina) Chai11/25/2014

Client’s Background
• Client: a large manufacturer of orthopedic equipment in the United States
• Customer base: almost all hospitals over the 50 states

Client’s Products
• Orthopedic parts and equipment
• Medications administered in the process of surgery, rehabilitation, and recovery
The Company Thinks …
• SALES!
– High sales
– Moderate sales (further sales potential)
– Little or no sales (substantial potential gain)

Imagine …
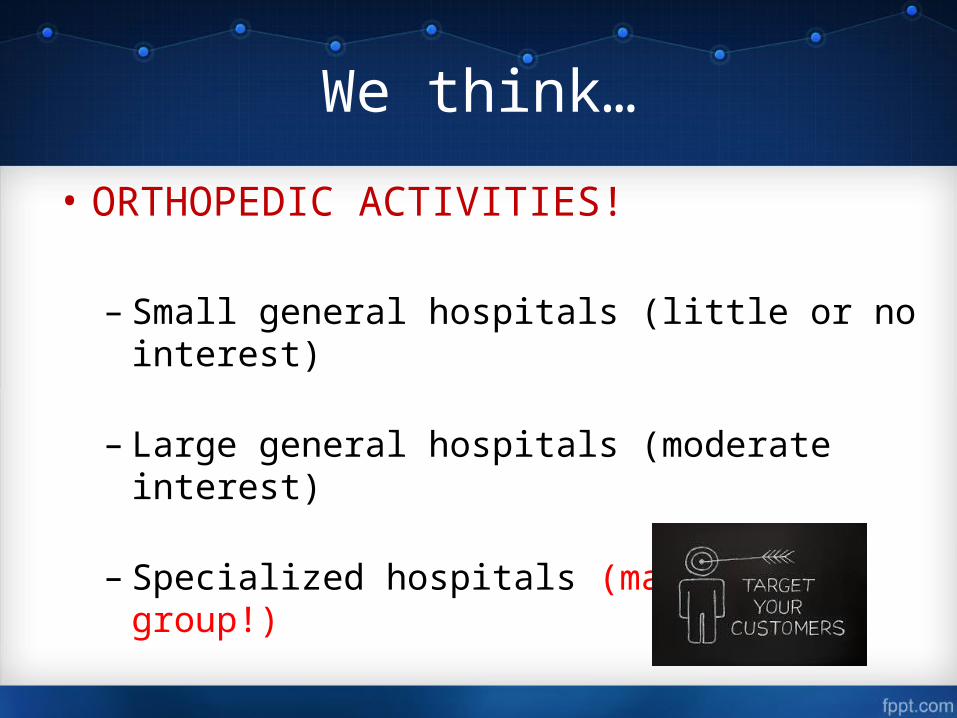
We think…
• ORTHOPEDIC ACTIVITIES!
– Small general hospitals (little or no interest)
– Large general hospitals (moderate interest)
– Specialized hospitals (main target group!)
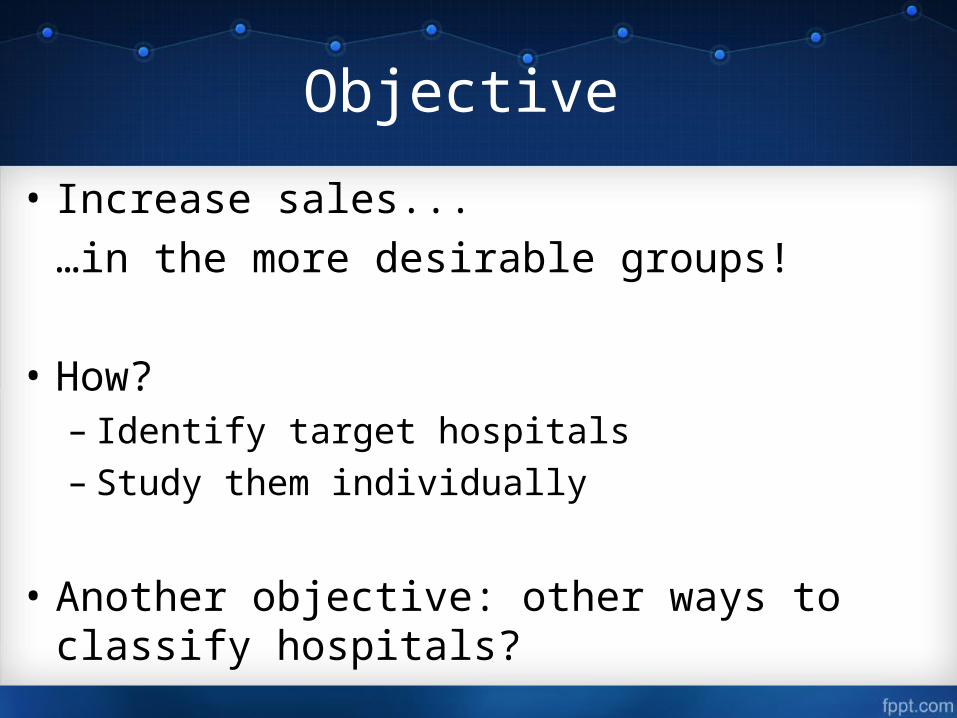
Objective
• Increase sales...
…in the more desirable groups!
• How?– Identify target hospitals– Study them individually
• Another objective: other ways to classify hospitals?
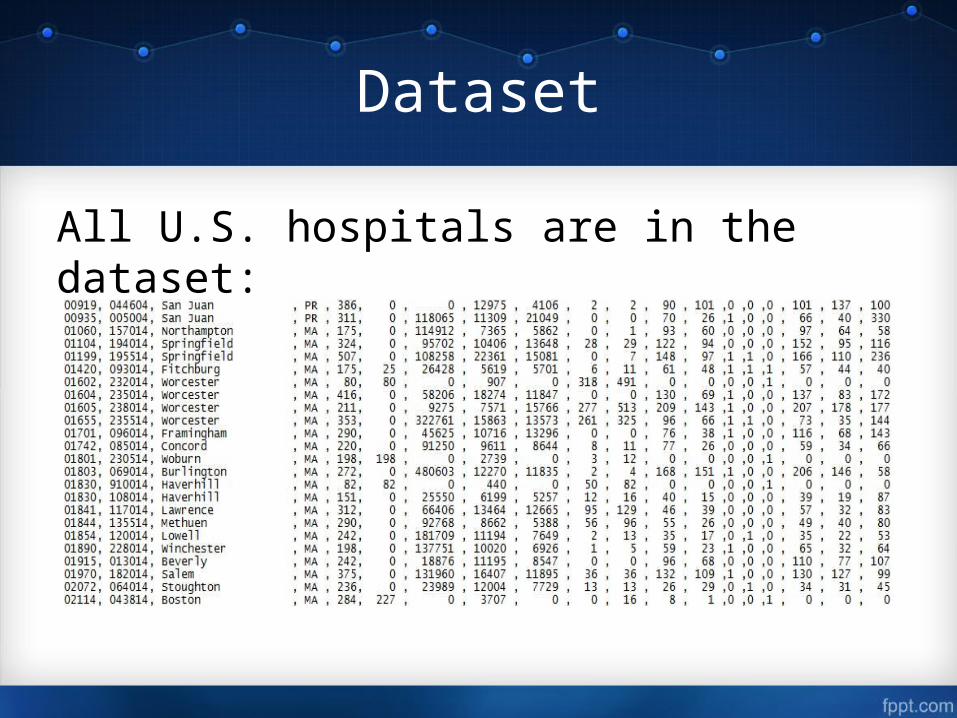
Dataset
All U.S. hospitals are in the dataset:

Variables
A subset of variables is already selected
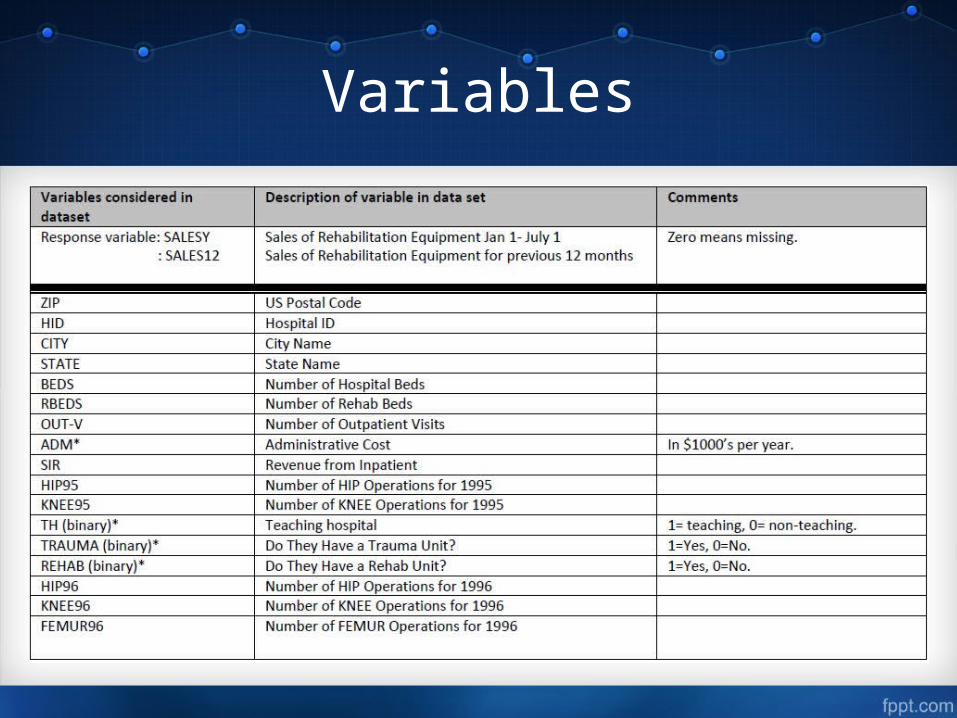
Variables
Methodology
• Data Mining– Dimension Reduction
• Factor Analysis• Principal Component Analysis
– Cluster Analysis• Hierarchical Clustering• Centroid Methods
• Regression analysis

Data Mining
• Overall goal—to extract information from a data set and transform it into an understandable structure for further use. (Wikipedia)
• The objective of data mining is to identify nuggets, small clusters of observations in these data that contain unexpected, yet potentially valuable, information. (The author)
Data Mining
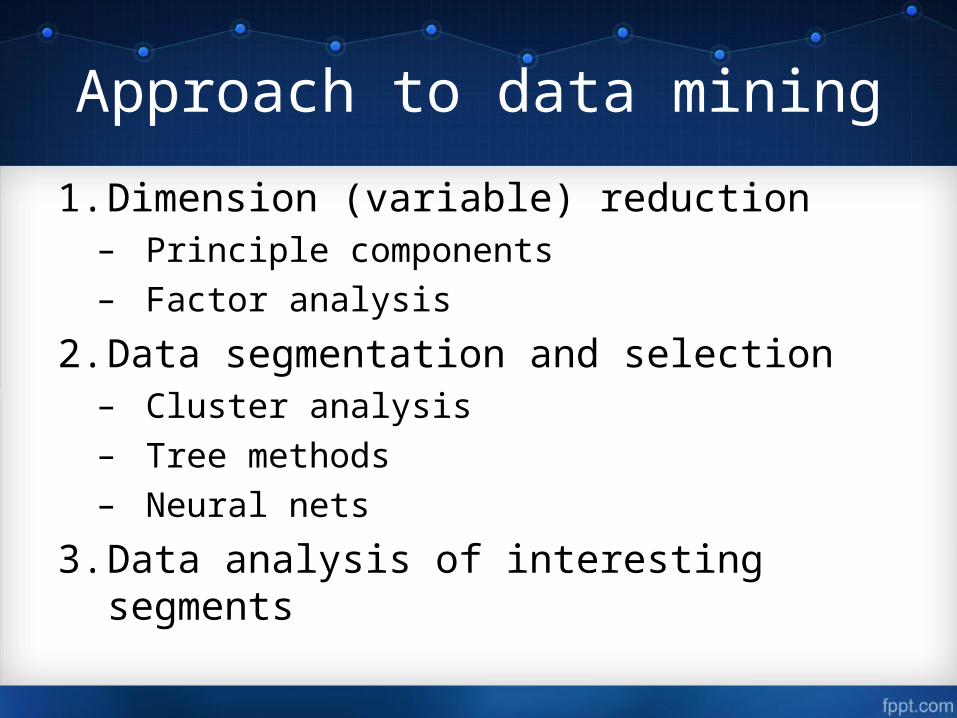
Approach to data mining
1. Dimension (variable) reduction– Principle components– Factor analysis
2. Data segmentation and selection– Cluster analysis– Tree methods– Neural nets
3. Data analysis of interesting segments
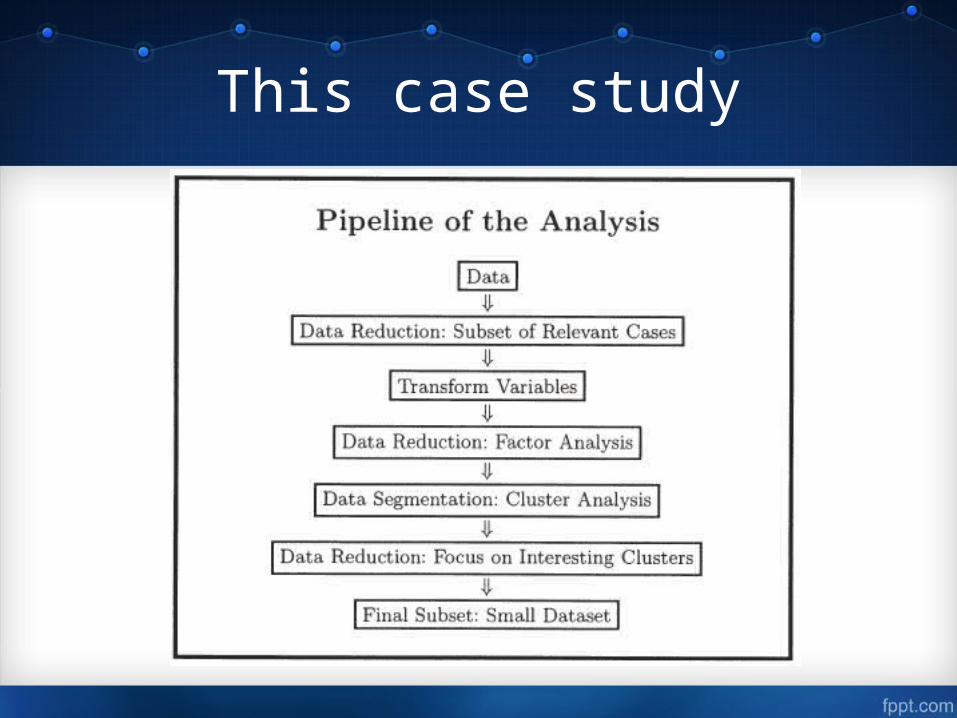
This case study

PART 1:Select Market Segments
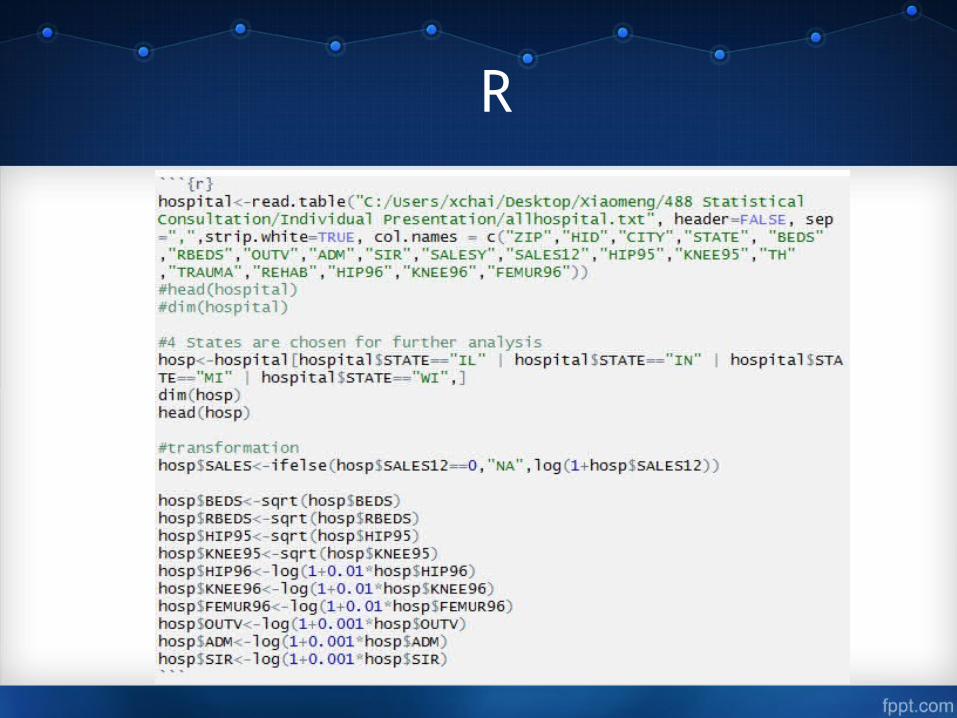
• Find state or group of states (at least 300 hospitals)
– IL, IN, MI, WI are selected (590 hospitals)
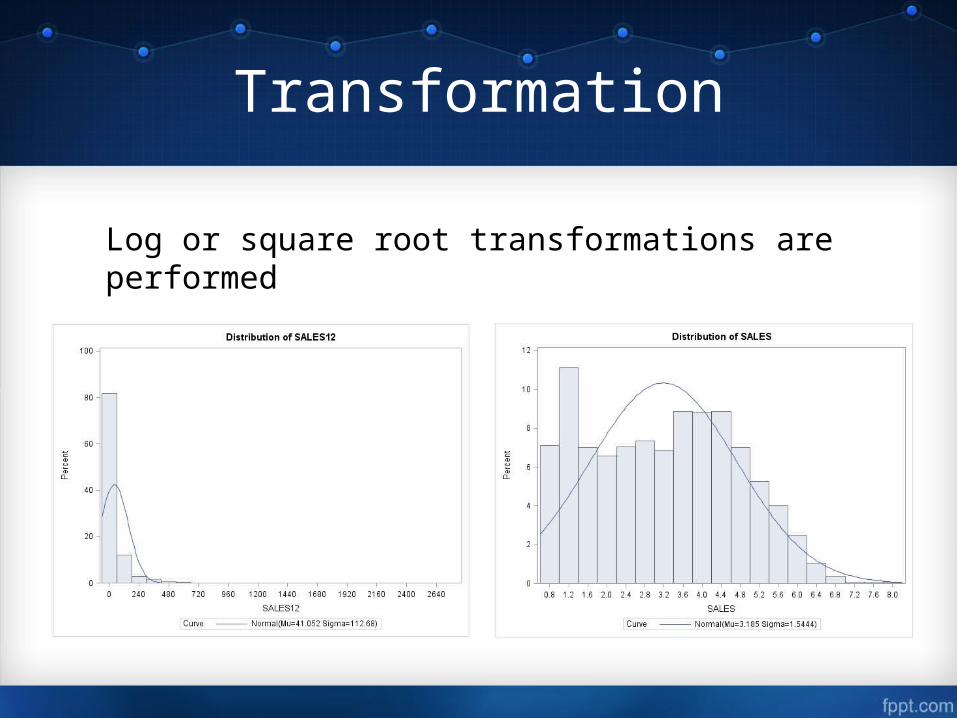
Transformation
Log or square root transformations are performed
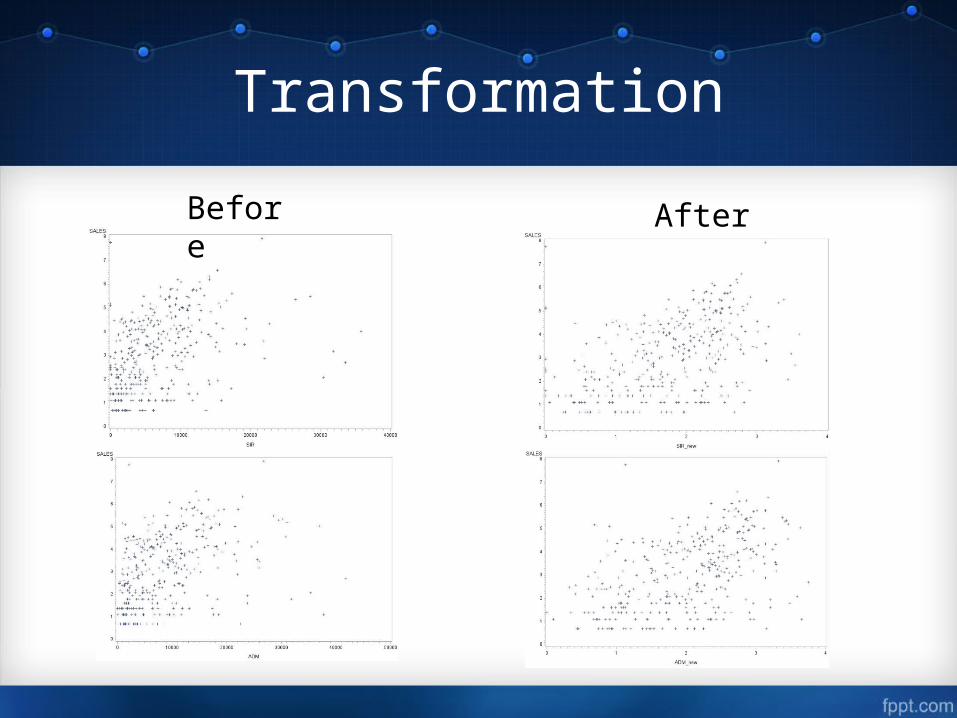
Transformation
Before After
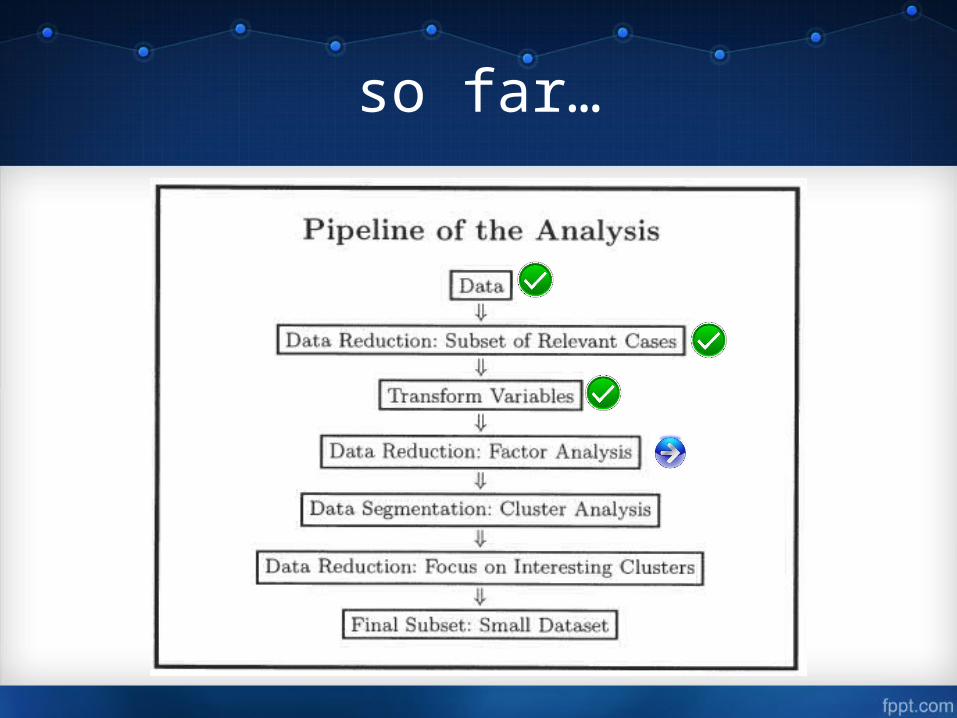
so far…
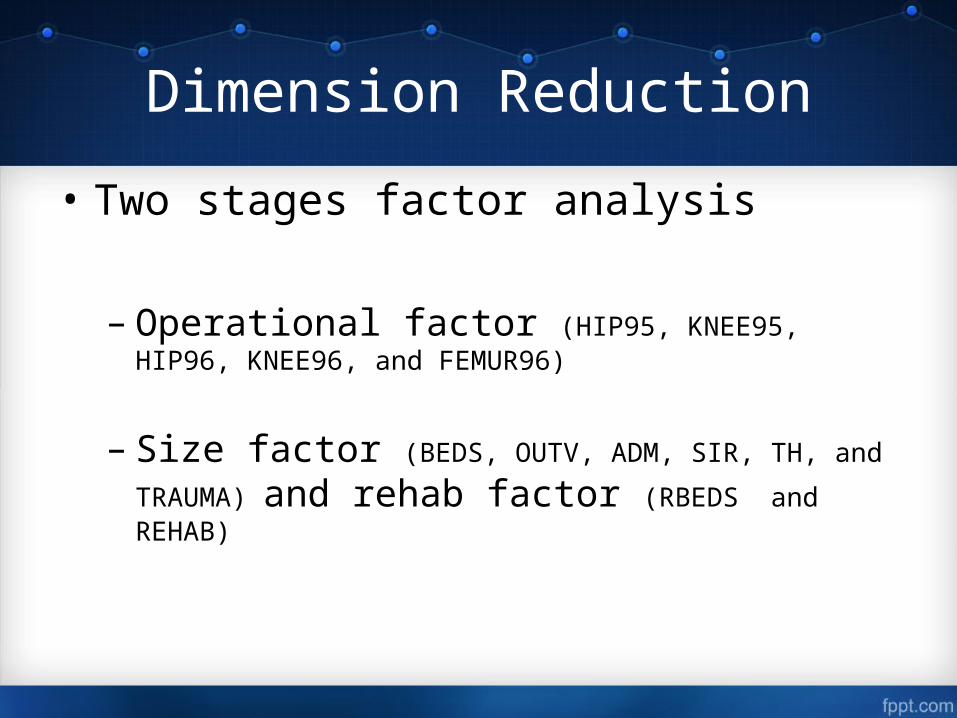
Dimension Reduction
• Two stages factor analysis
– Operational factor (HIP95, KNEE95, HIP96, KNEE96, and FEMUR96)
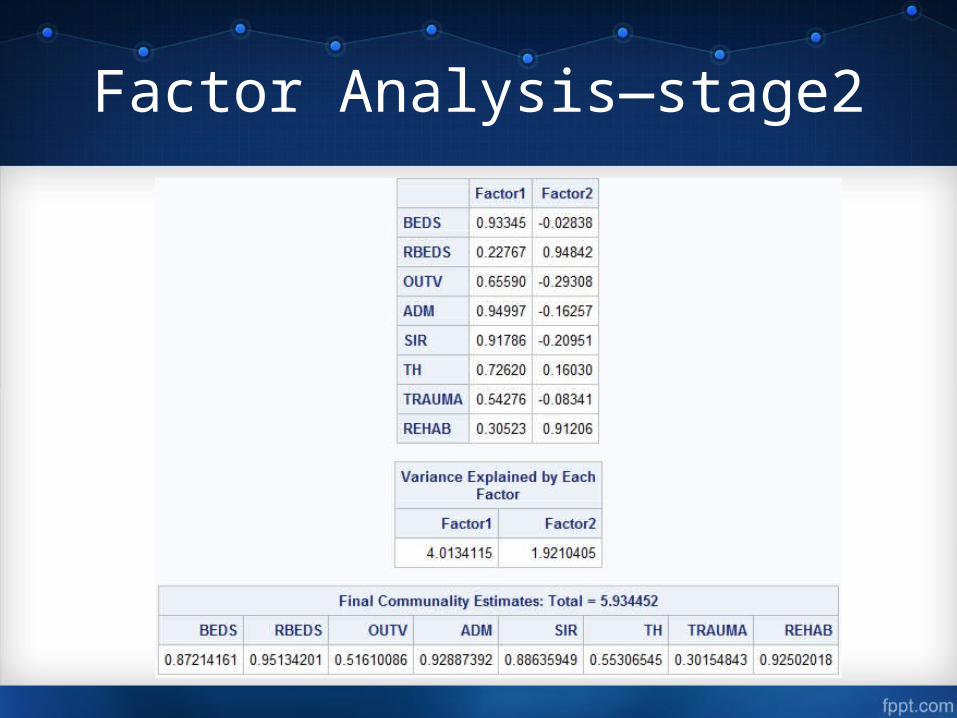
– Size factor (BEDS, OUTV, ADM, SIR, TH, and TRAUMA)
and rehab factor (RBEDS and REHAB)
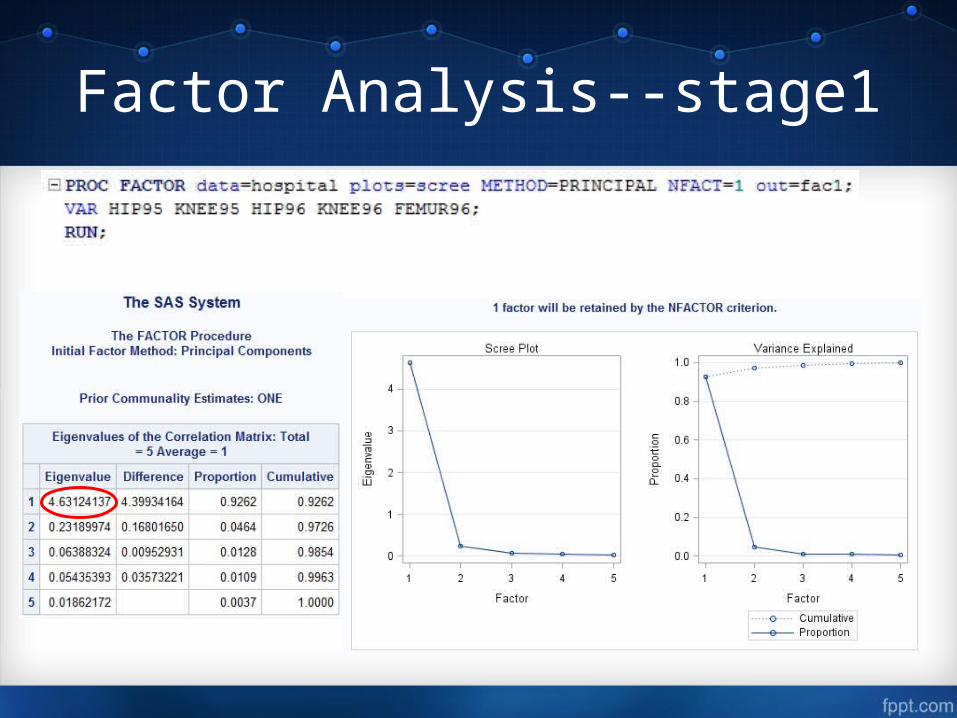
Factor Analysis--stage1
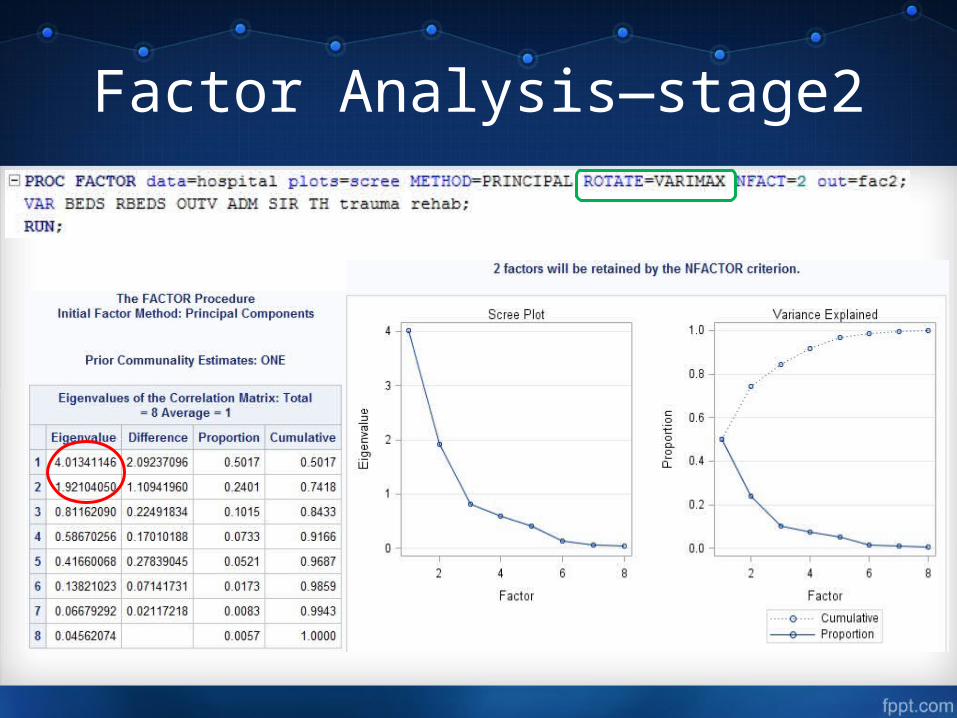
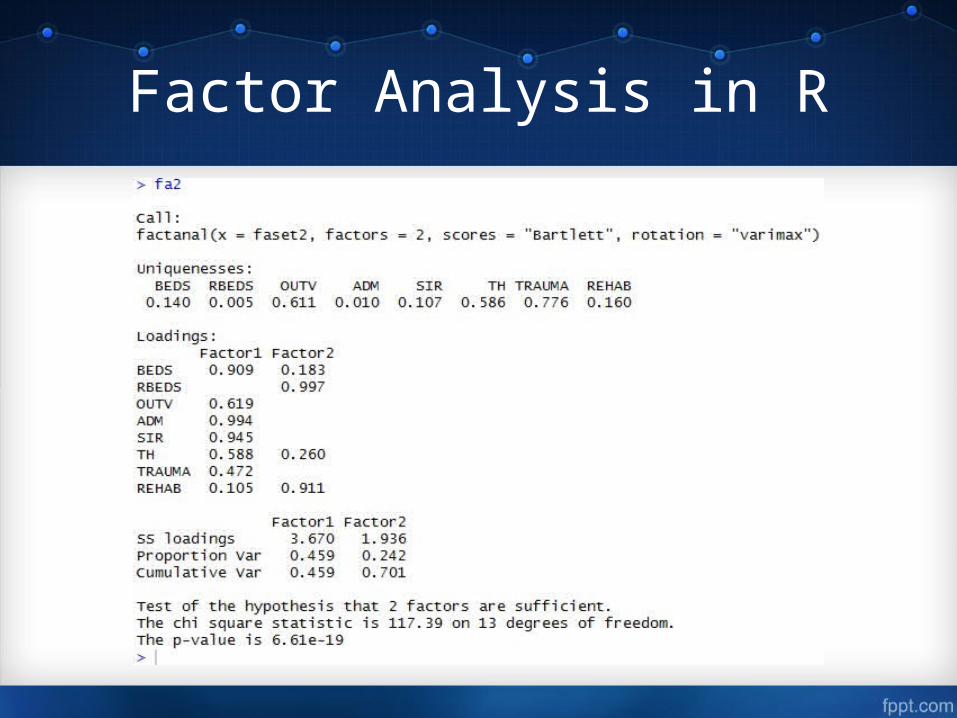
Factor Analysis—stage2
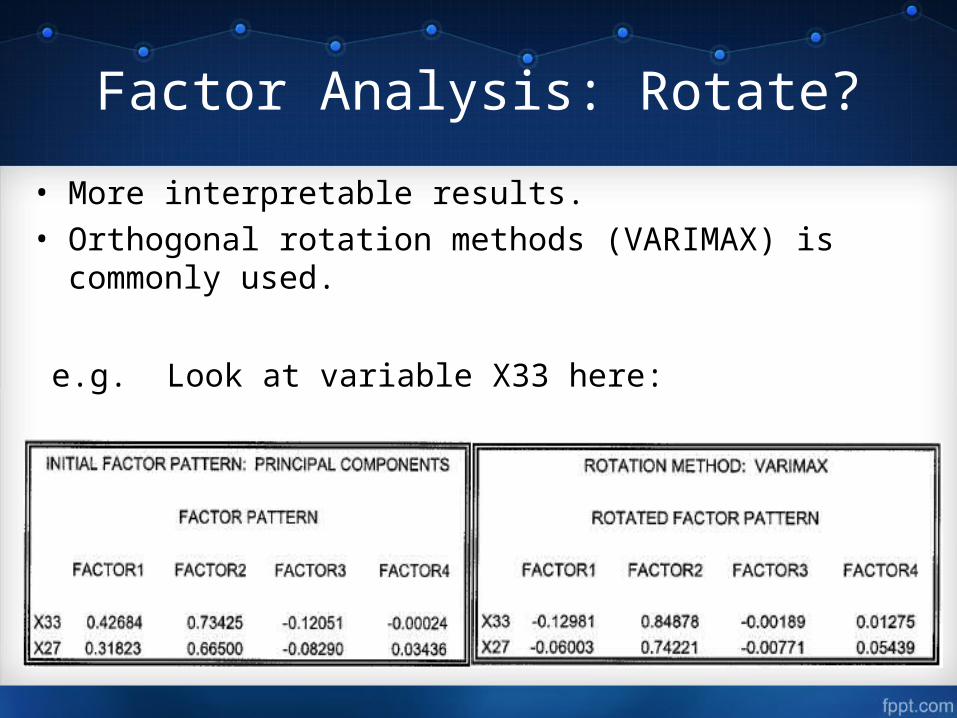
Factor Analysis: Rotate?
• More interpretable results.• Orthogonal rotation methods (VARIMAX) is commonly
used.
e.g. Look at variable X33 here:
Factor Analysis—stage2

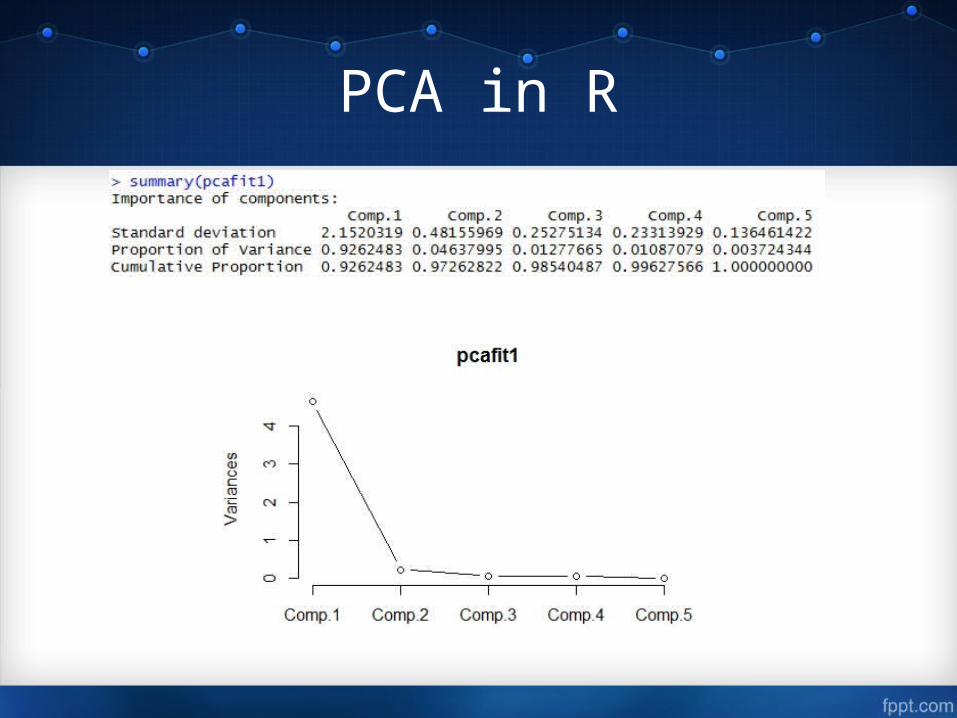
Principal Component Analysis--stage 1
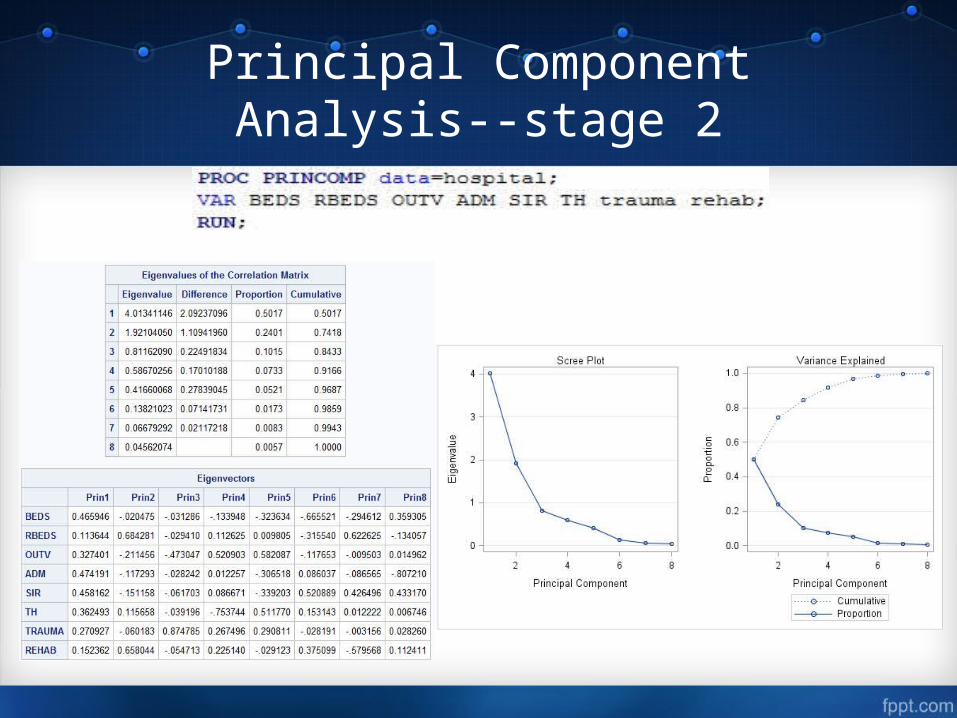
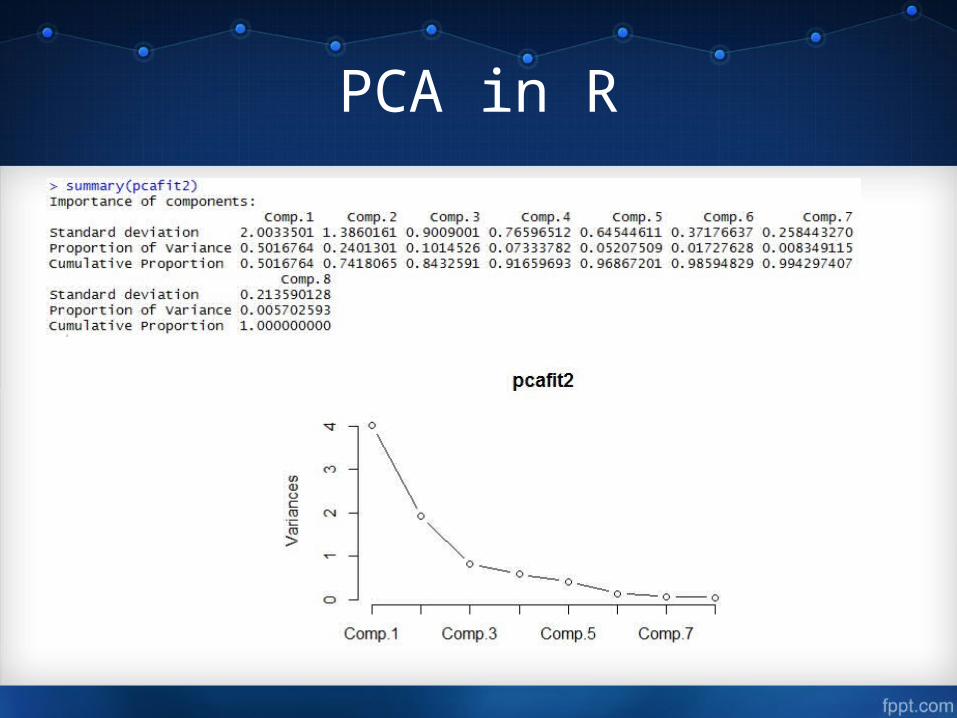
Principal Component Analysis--stage 2
R
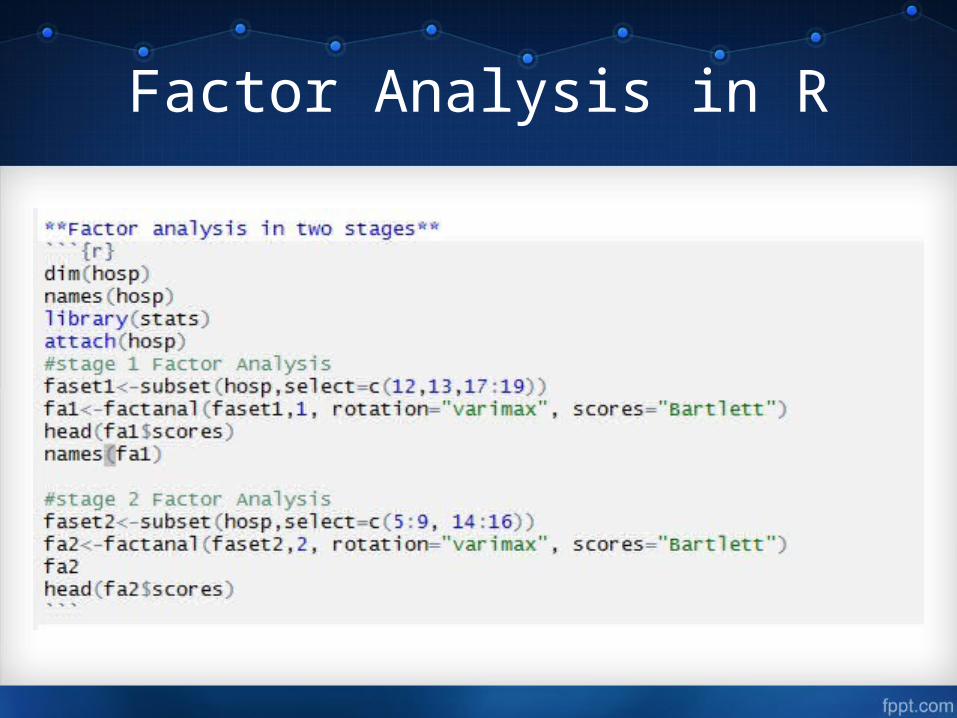
Factor Analysis in R
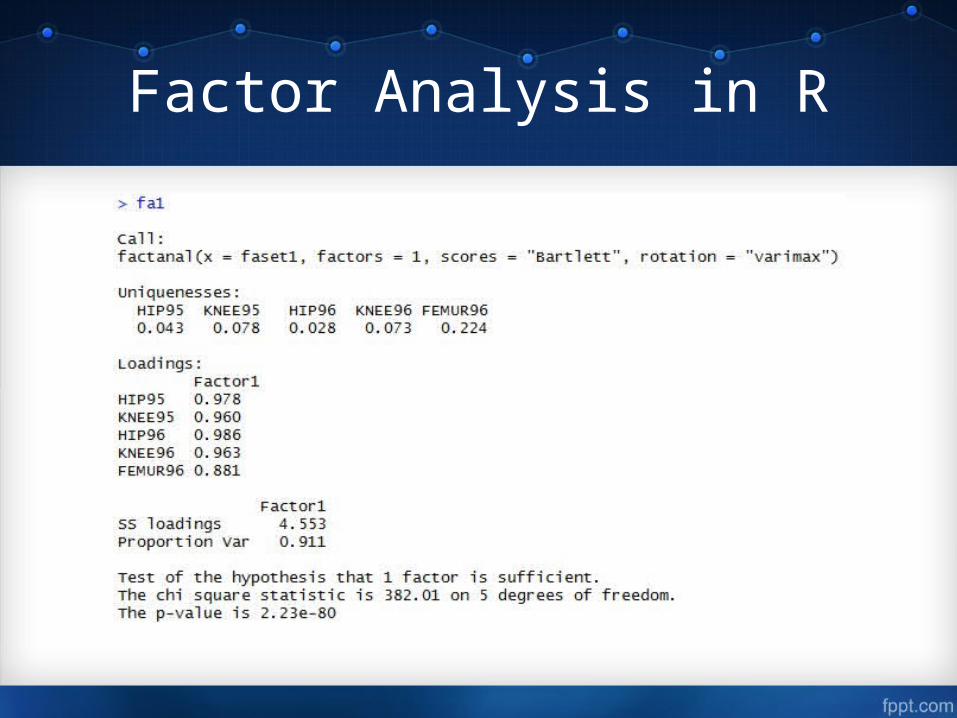
Factor Analysis in R
Factor Analysis in R

PCA in R
PCA in R
PCA in R
PCA in R
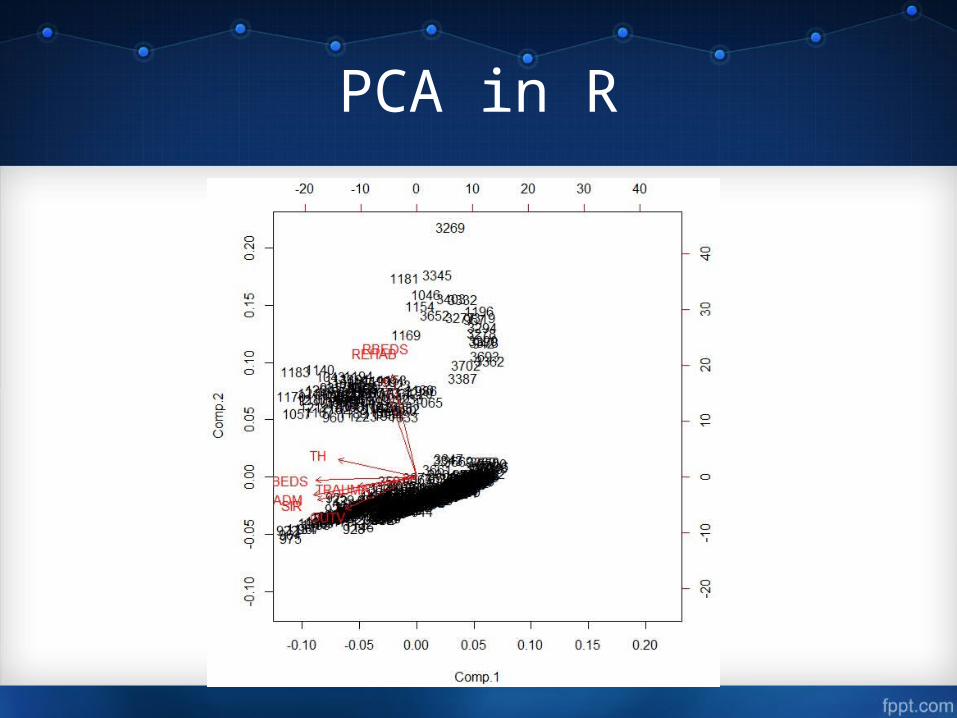
PCA in R
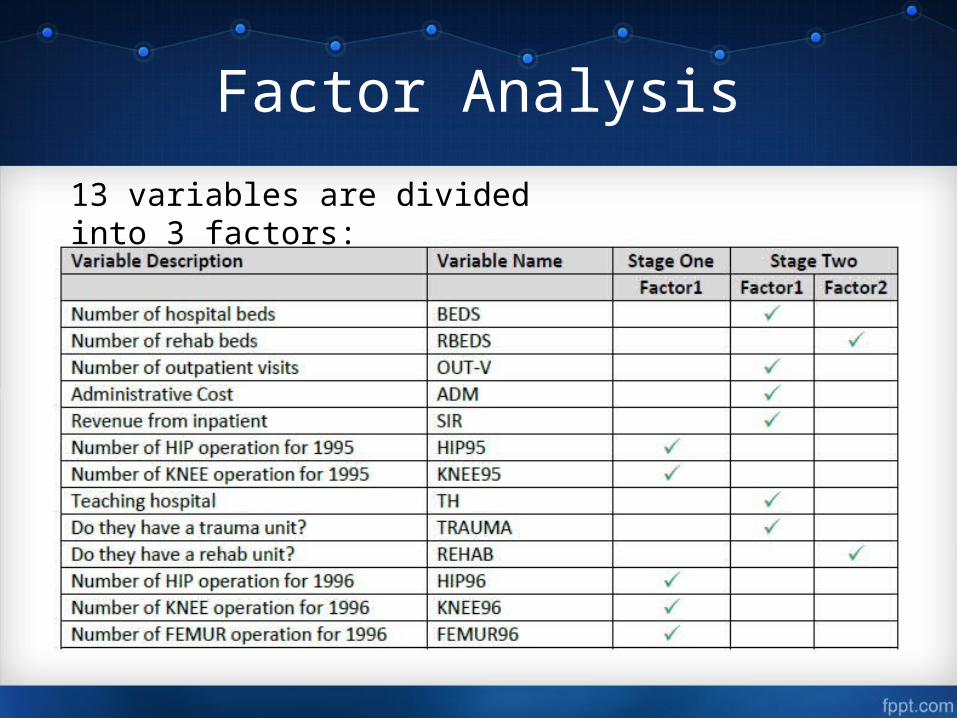
Factor Analysis
13 variables are divided into 3 factors:
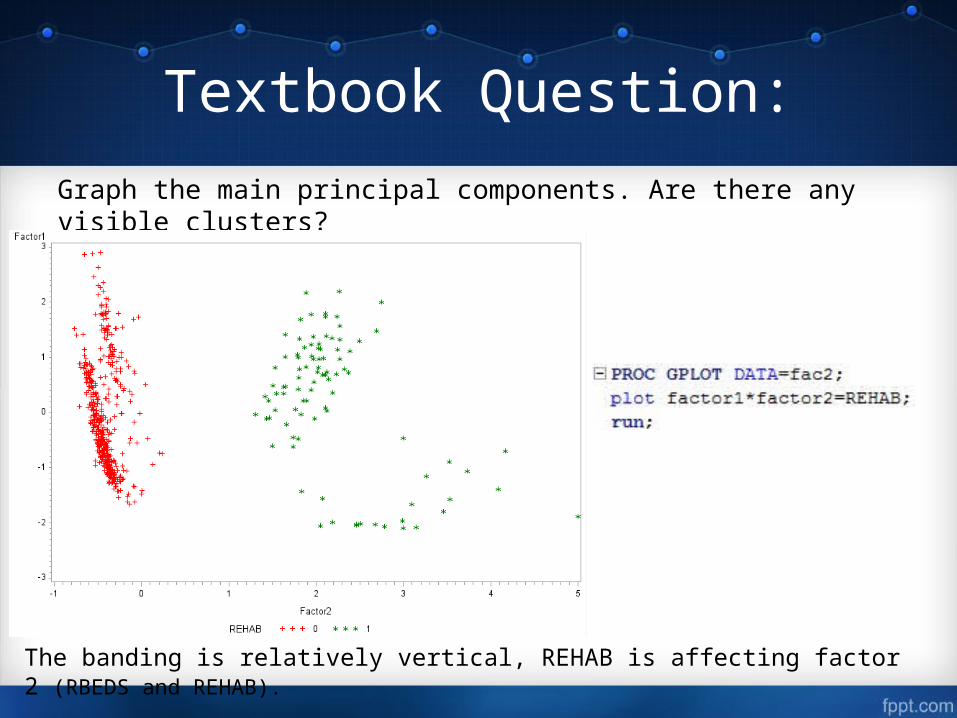
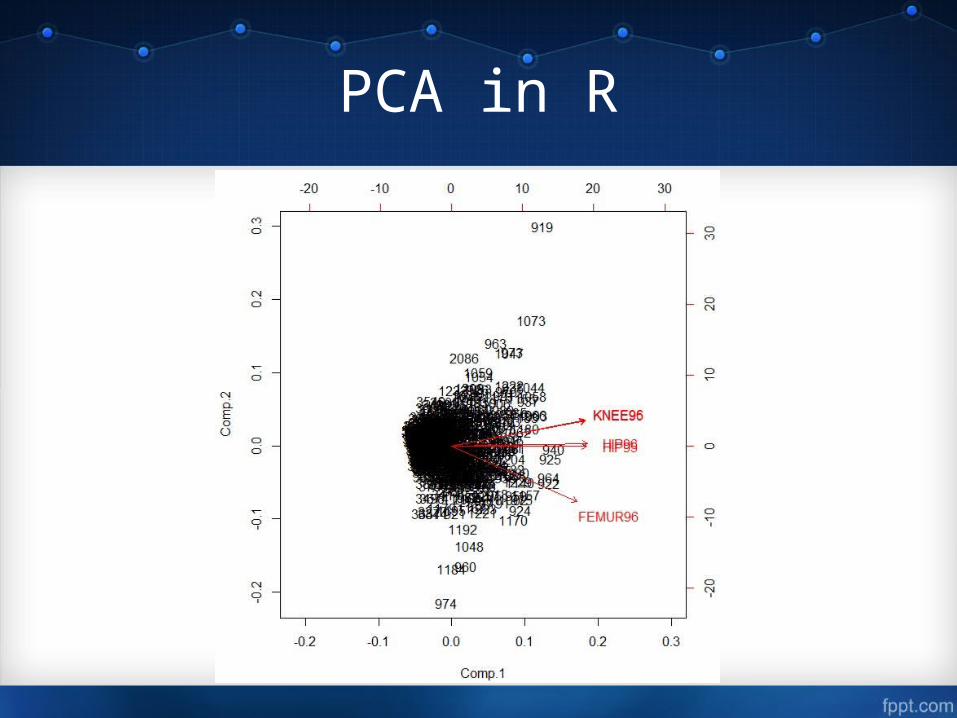
Textbook Question:
Graph the main principal components. Are there any visible clusters?
The banding is relatively vertical, REHAB is affecting factor 2 (RBEDS and REHAB).
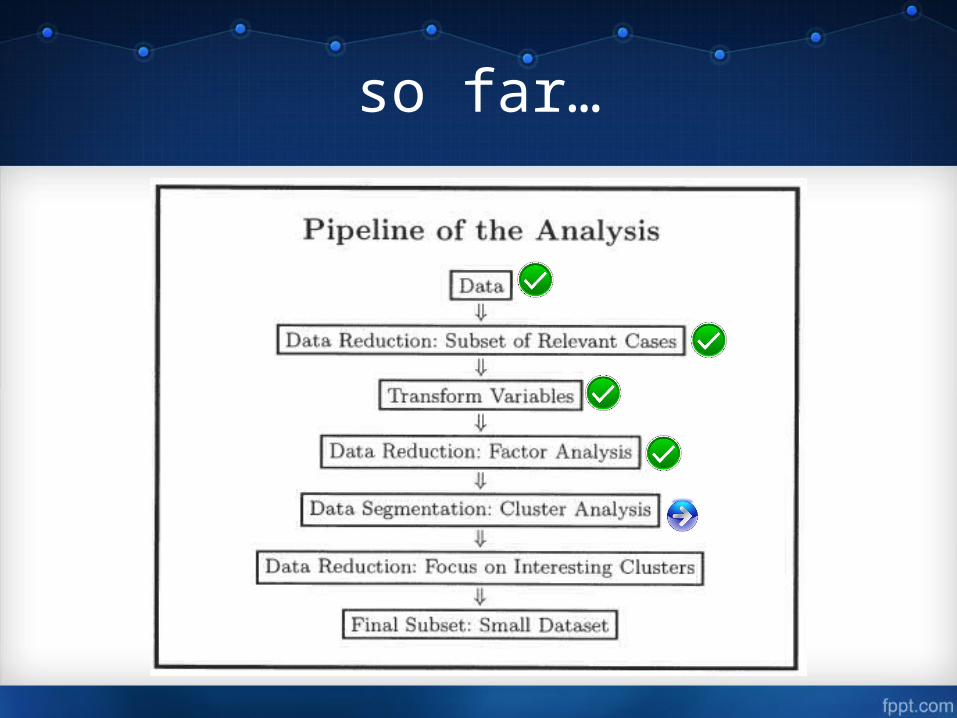
so far…
Cluster Analysis
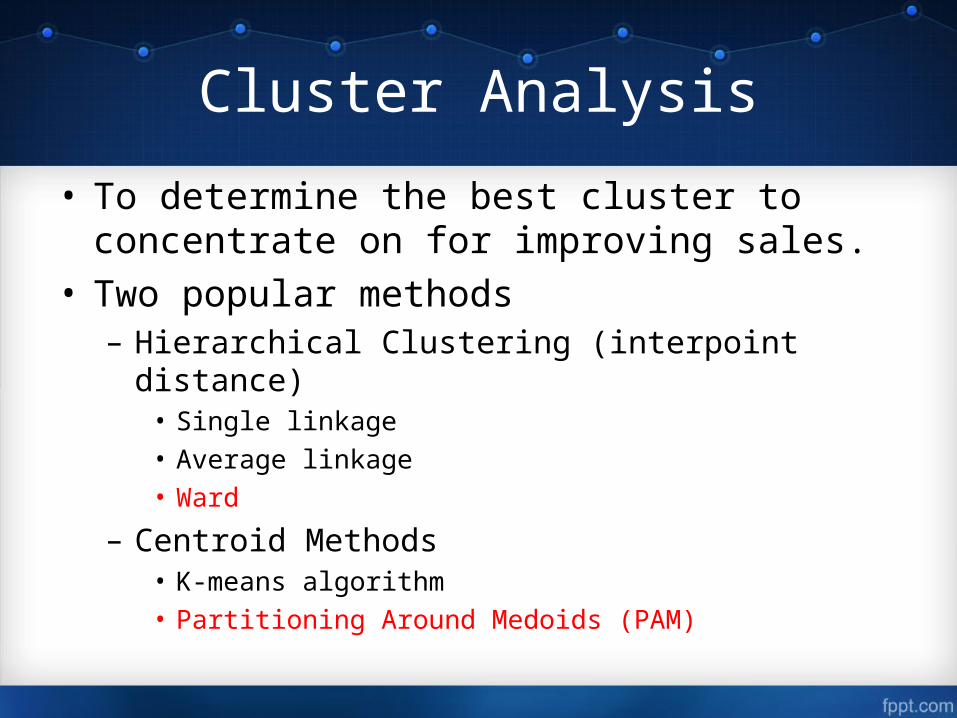
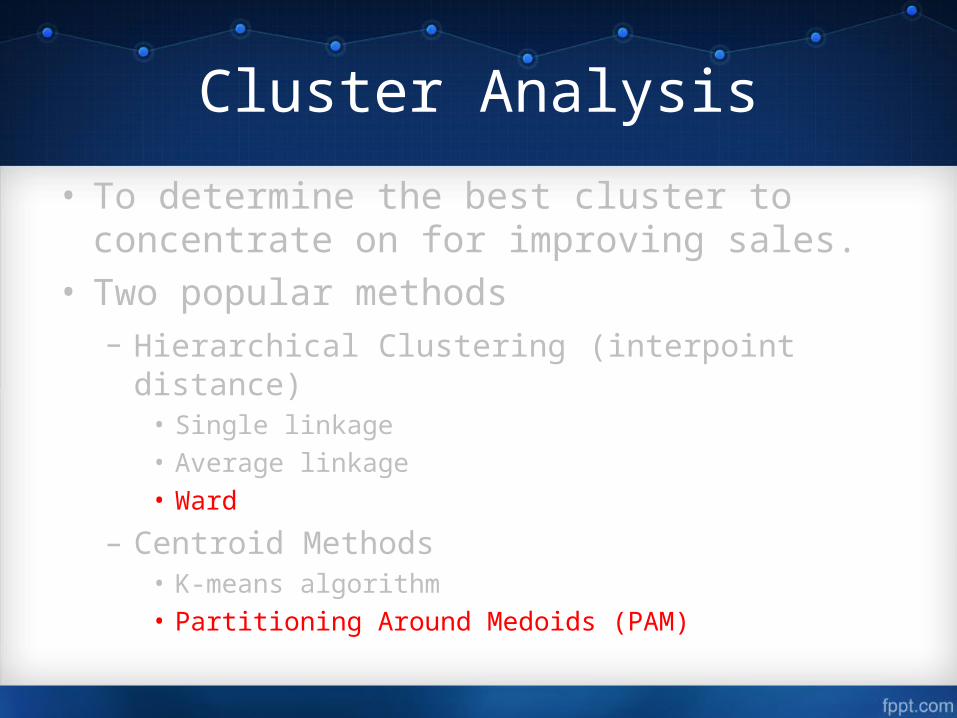
• To determine the best cluster to concentrate on for improving sales.
• Two popular methods– Hierarchical Clustering (interpoint distance)
• Single linkage• Average linkage• Ward
– Centroid Methods• K-means algorithm• Partitioning Around Medoids (PAM)

Cluster Analysis
• Hierarchical Clustering:1. Start with a cluster at each sample point
2. At each stage of building the tree the two closest clusters joint to form a new cluster
Cluster Analysis
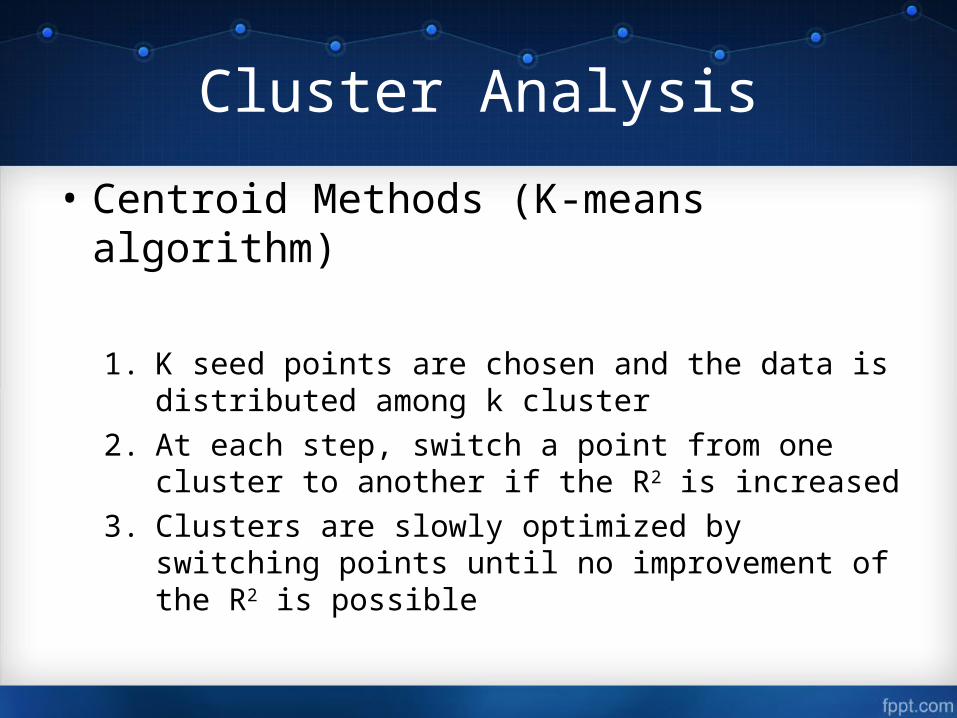
• Centroid Methods (K-means algorithm)
1. K seed points are chosen and the data is distributed among k cluster
2. At each step, switch a point from one cluster to another if the R2 is increased
3. Clusters are slowly optimized by switching points until no improvement of the R2 is possible
Cluster Analysis
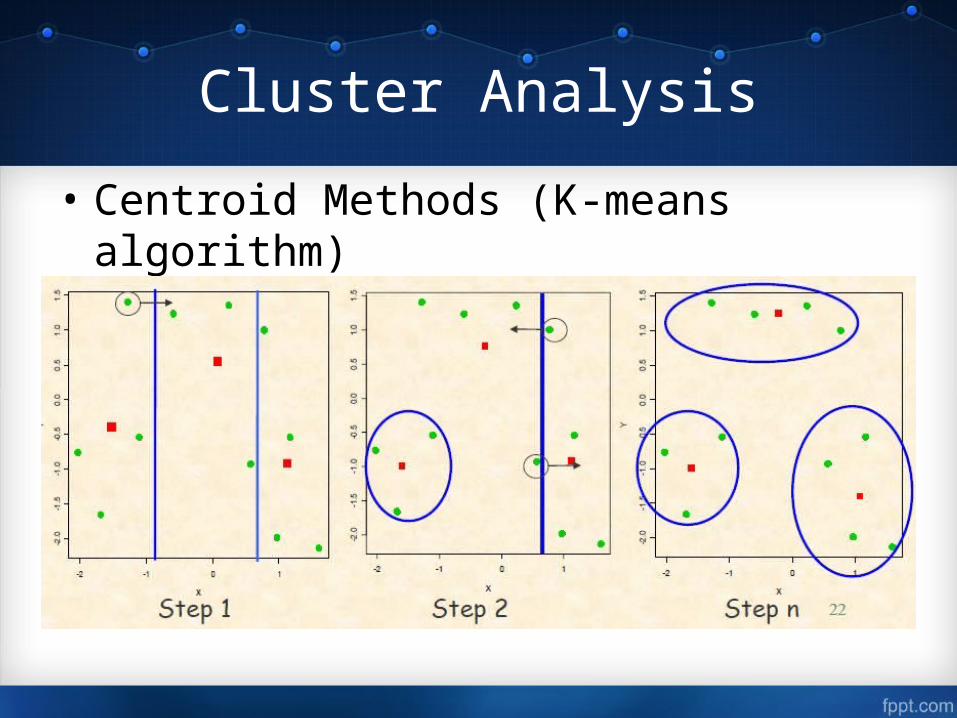
• Centroid Methods (K-means algorithm)
Cluster Analysis
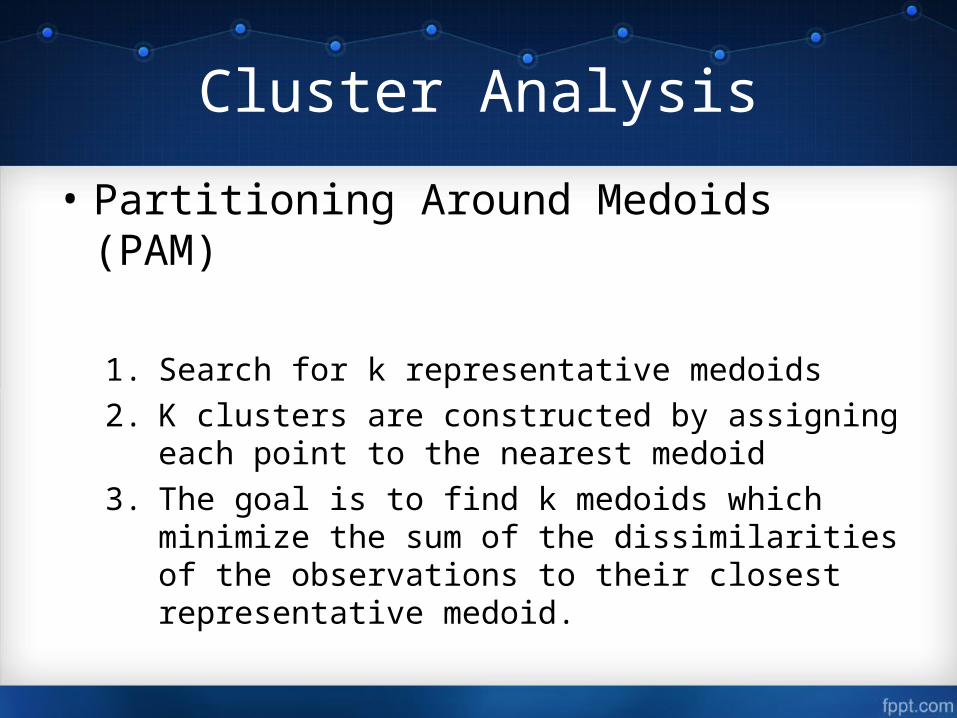
• Partitioning Around Medoids (PAM)
1. Search for k representative medoids
2. K clusters are constructed by assigning each point to the nearest medoid
3. The goal is to find k medoids which minimize the sum of the dissimilarities of the observations to their closest representative medoid.

Cluster Analysis
• PAM VS K-means
– PAM operates on the dissimilarity matrix– PAM minimizes a sum of dissimilarities instead of a
sum of squared Euclidean distances– Silhouette plot (select the optimal number of clusters)
Cluster Analysis
• To determine the best cluster to concentrate on for improving sales.
• Two popular methods– Hierarchical Clustering (interpoint distance)
• Single linkage• Average linkage• Ward
– Centroid Methods• K-means algorithm• Partitioning Around Medoids (PAM)
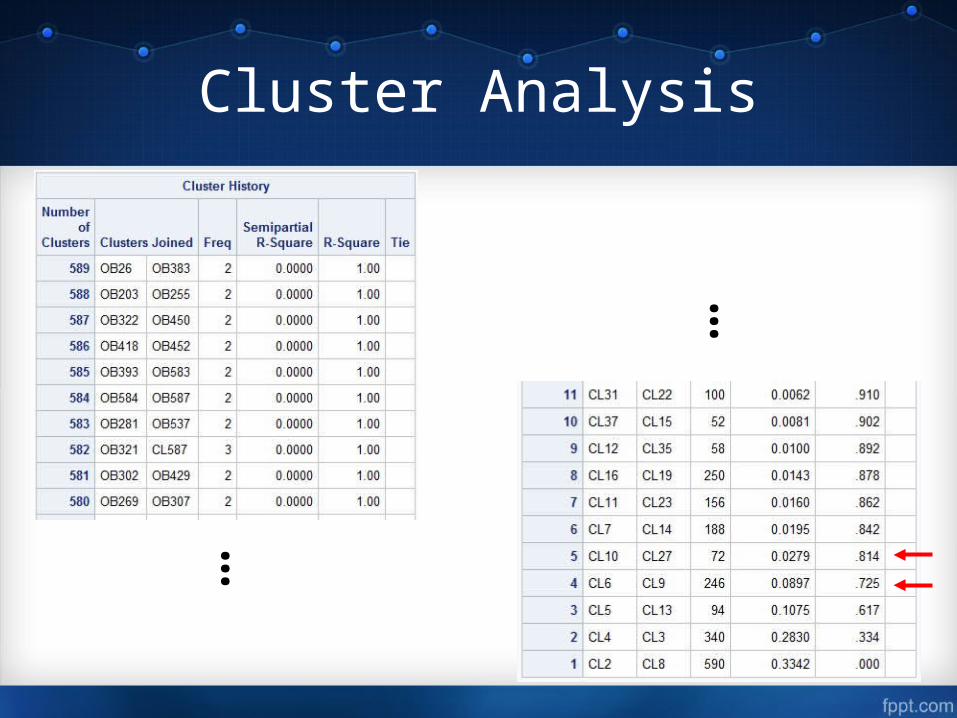
Cluster Analysis
…
…
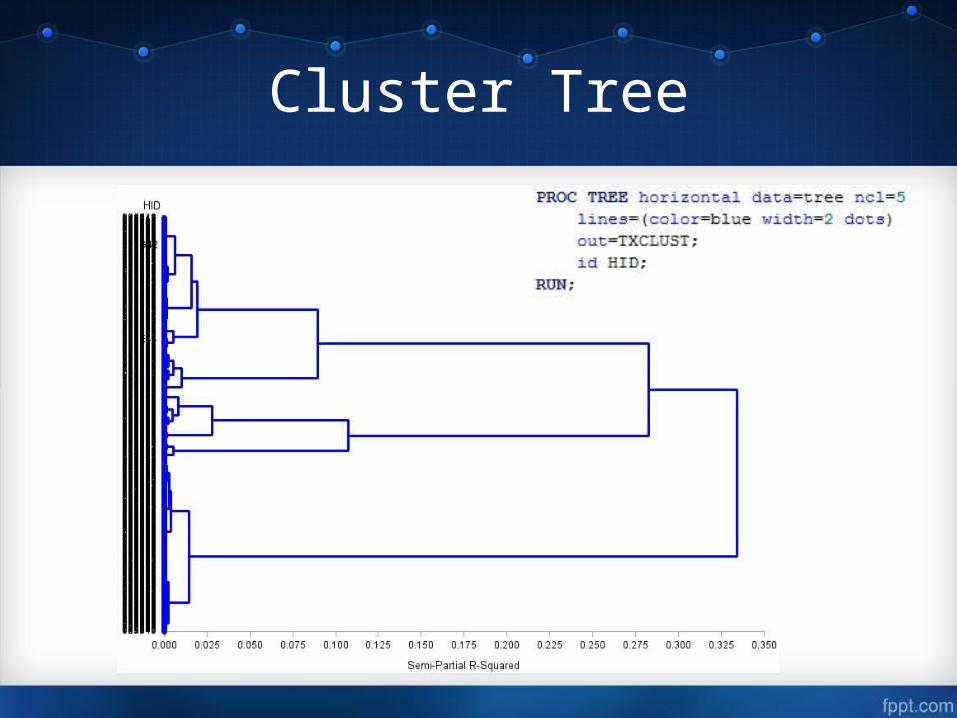
Cluster Tree
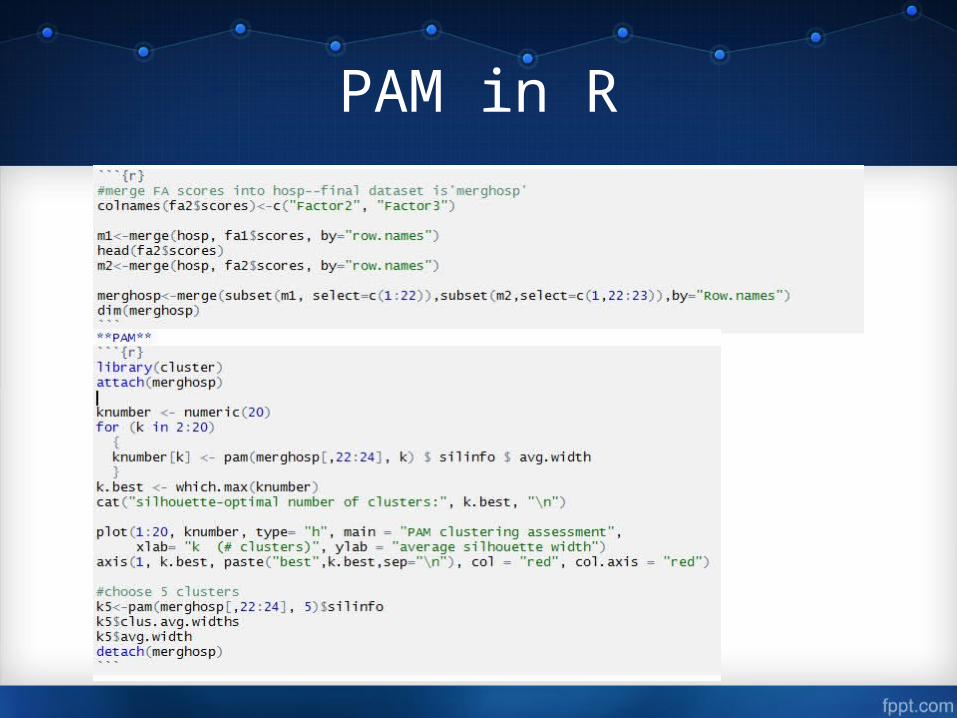
PAM in R

PAM in R
• Silhouette width:
si=(bi-ai)/max(ai,bi)
Large Si (almost 1) are very well clustered
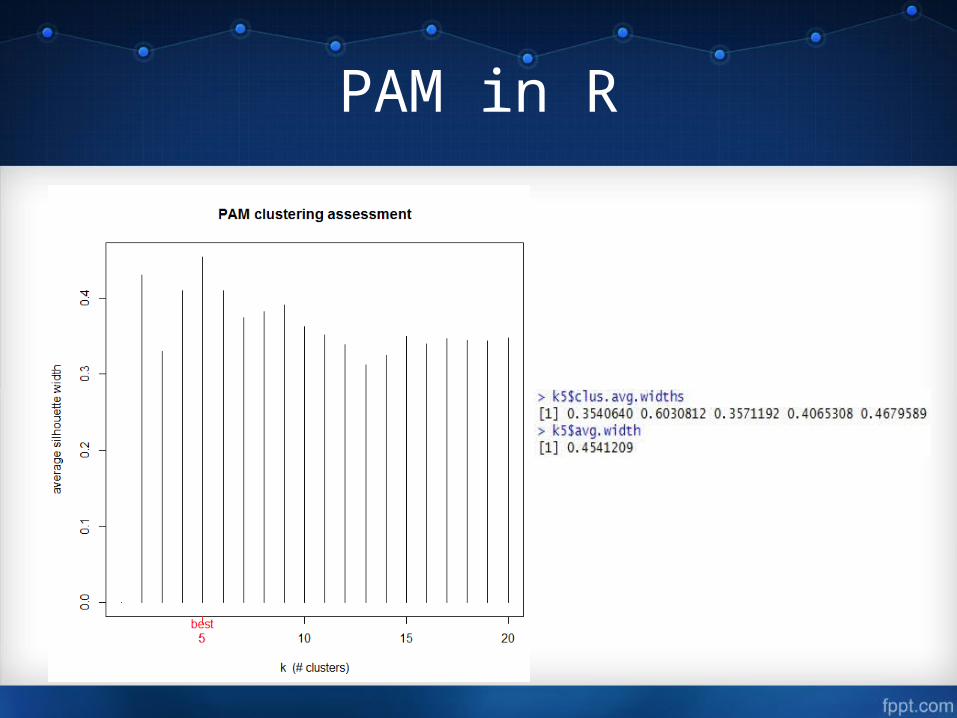
PAM in R
Cluster Analysis
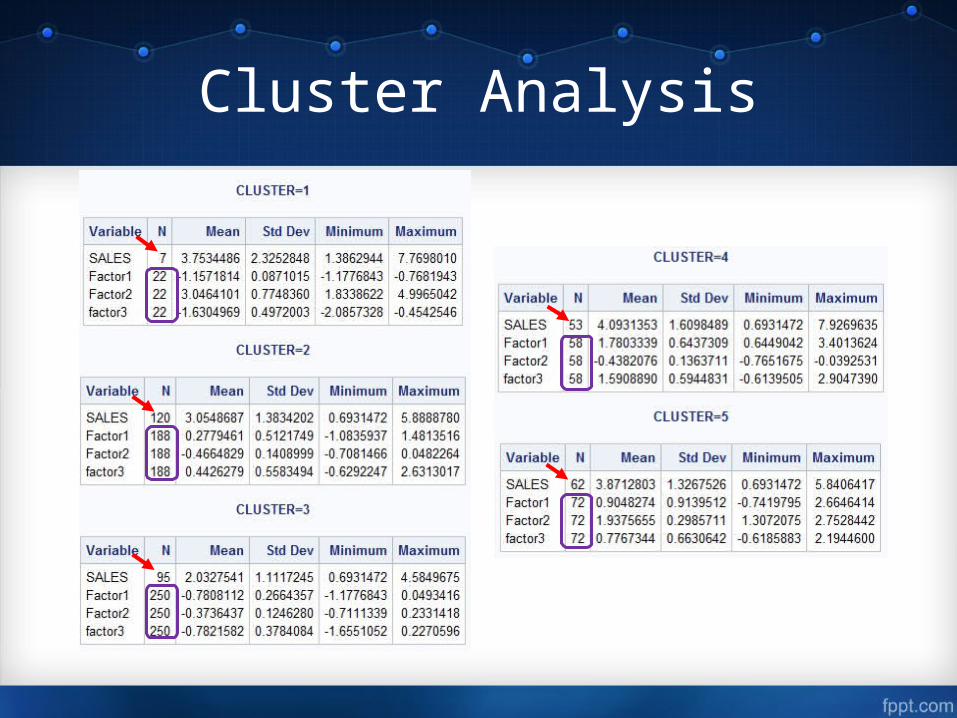
Cluster Analysis
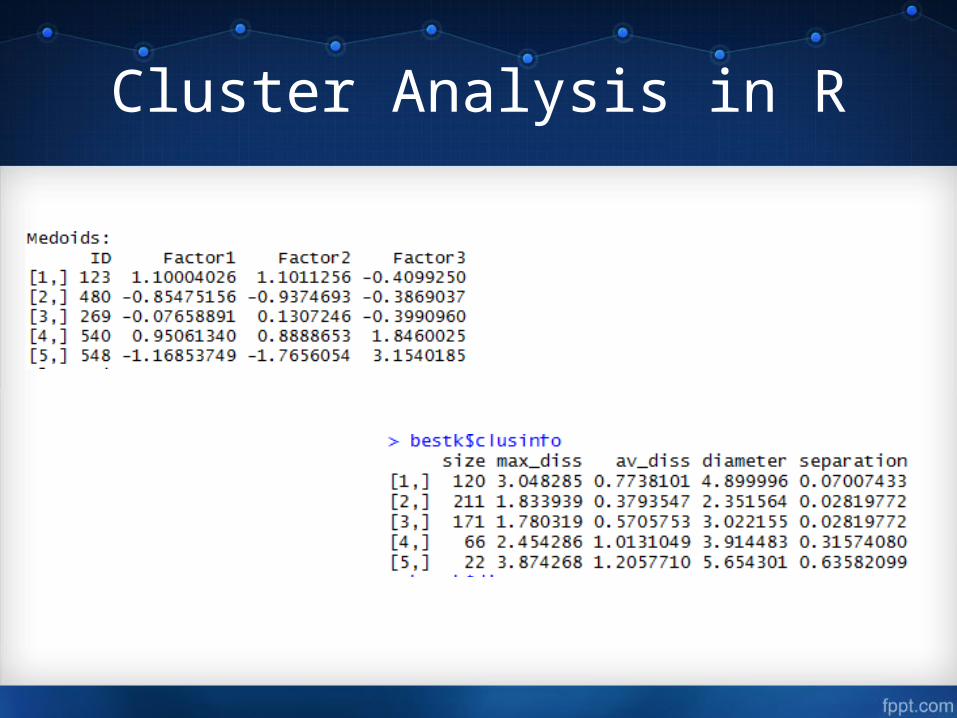
Cluster Analysis in R
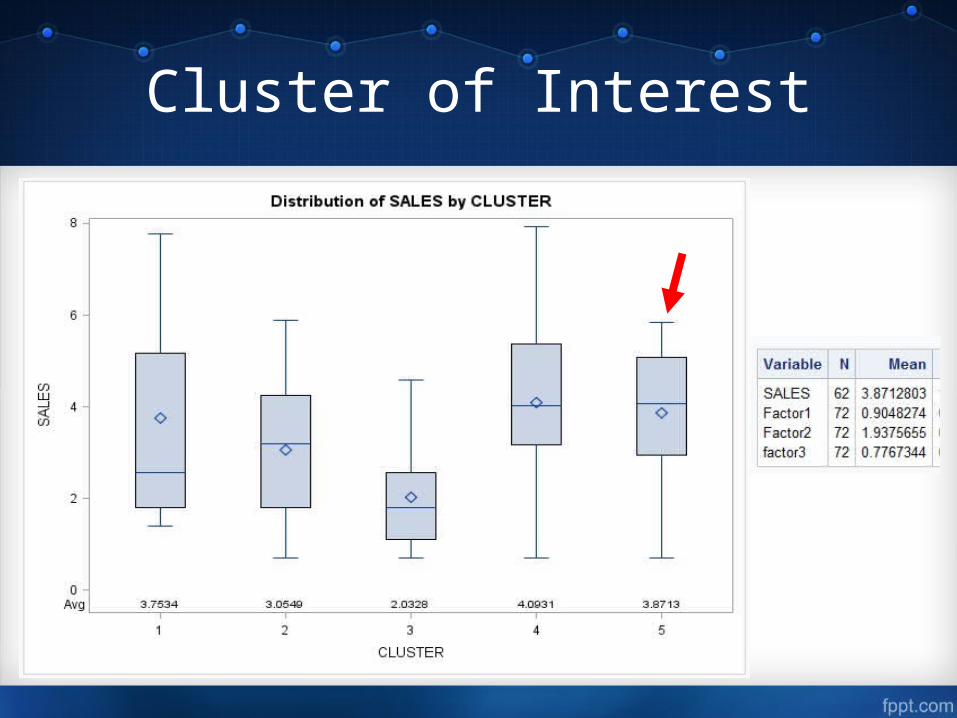
Cluster of Interest
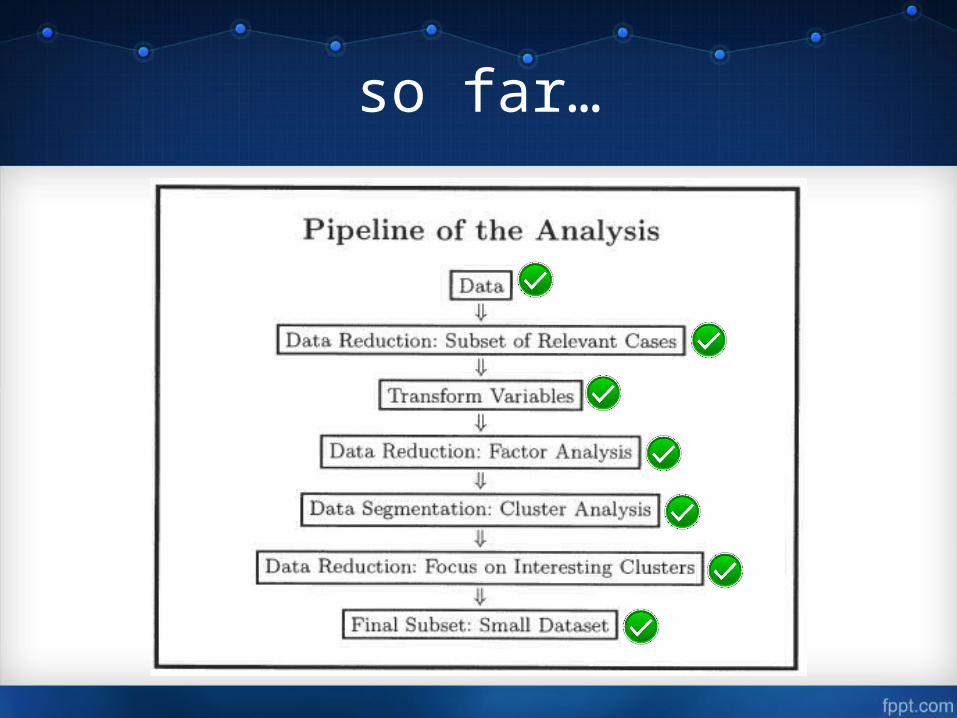
so far…
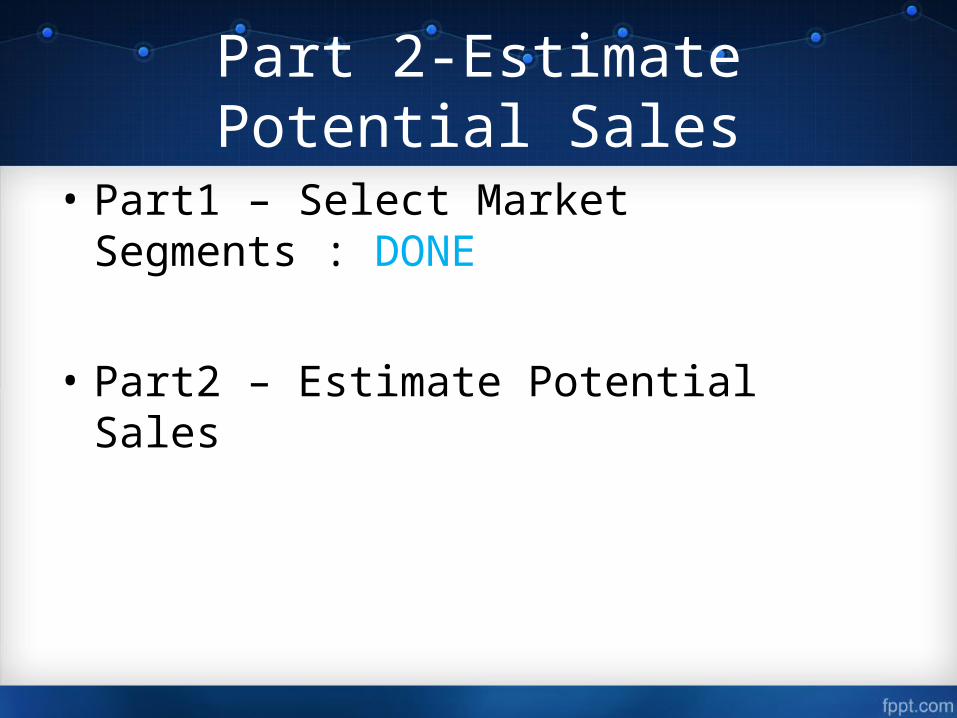
Part 2-Estimate Potential Sales
• Part1 – Select Market Segments : DONE
• Part2 – Estimate Potential Sales
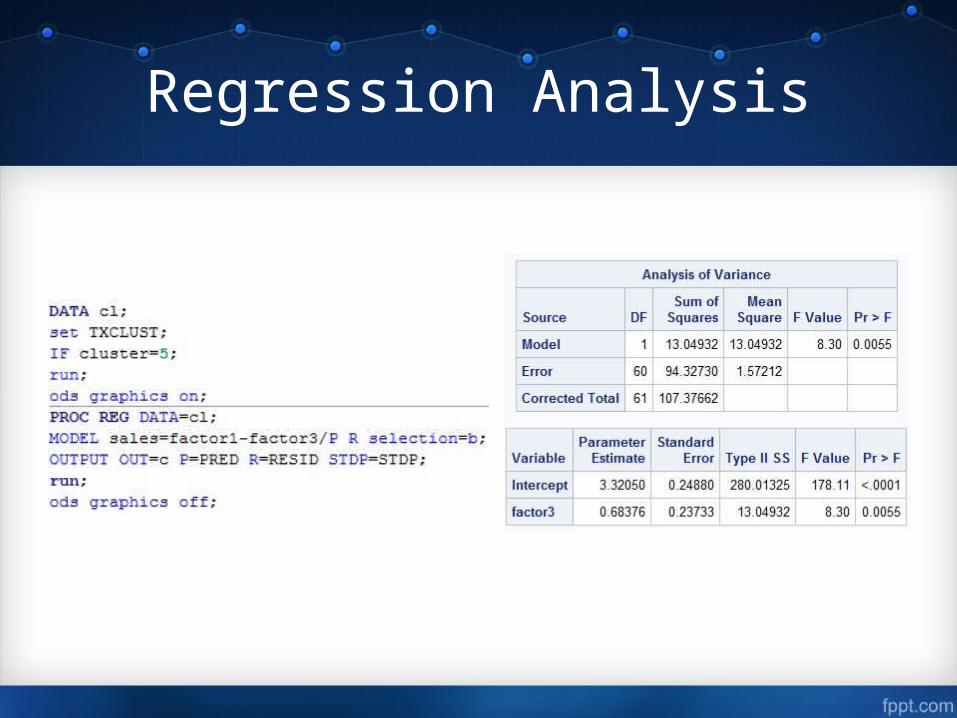
Regression Analysis
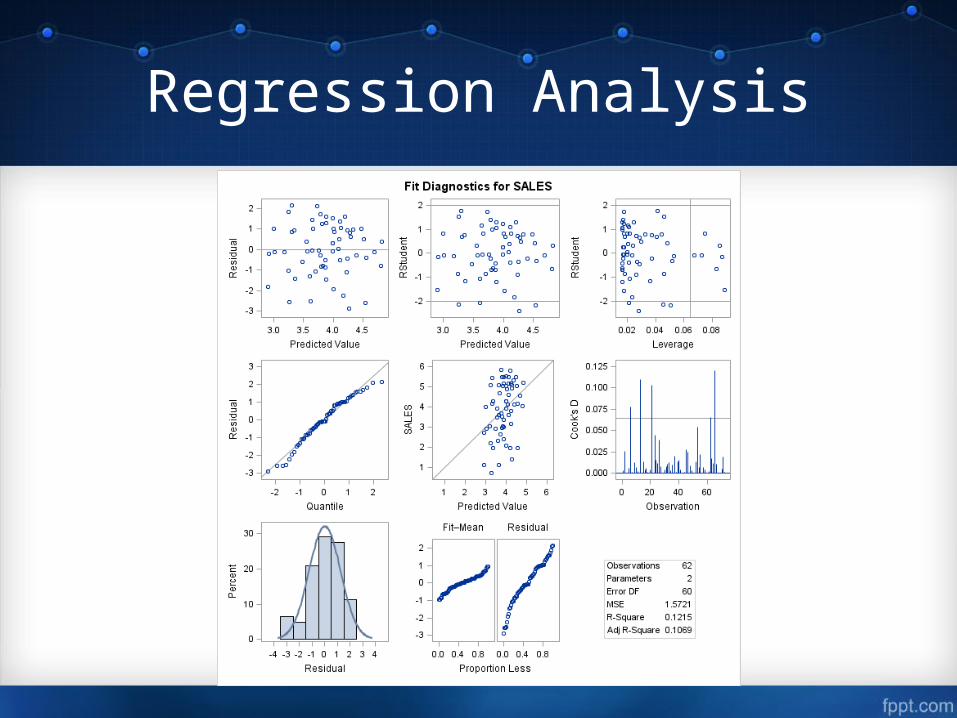
Regression Analysis
Regression Analysis
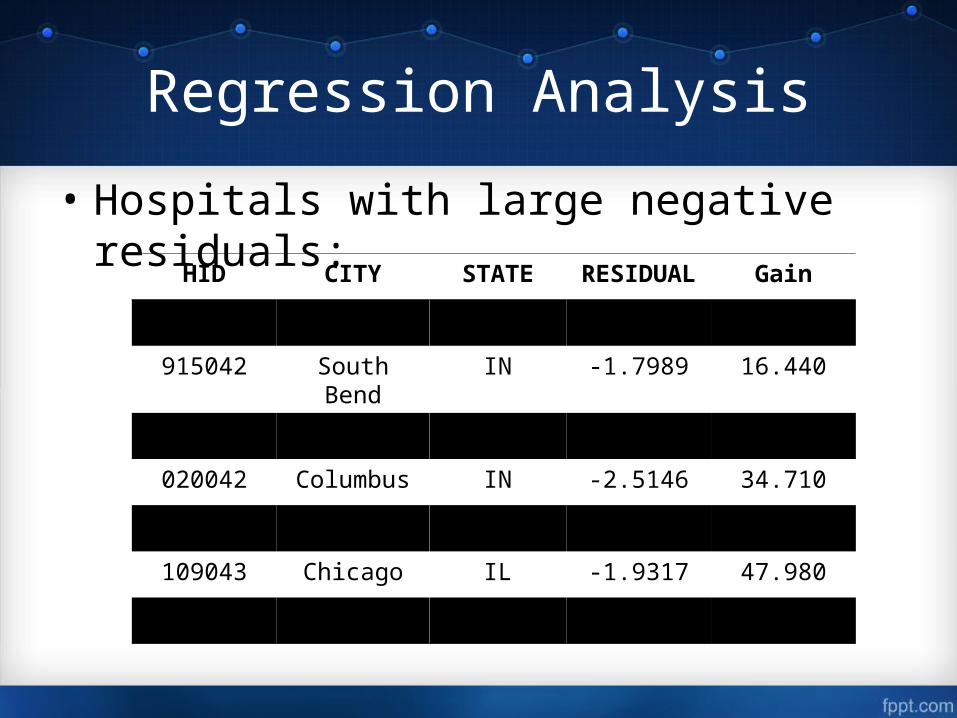
• Hospitals with large negative residuals:
HID CITY STATE RESIDUAL Gain
087043 Chicago IL -2.8766 68.590
915042 South Bend IN -1.7989 16.440
016045 Beloit WI -2.5633 24.893
020042 Columbus IN -2.5146 34.710
078045 Madison WI -2.2309 59.362
109043 Chicago IL -1.9317 47.980
262043 Peoria IL -2.5952 90.593

Thank you and Happy Holiday!