Embed Size (px)
Citation preview

2016 MID-YEAR EDITION
EUROPEAN FUND MARKETDATA DIGEST

2
2016 MID-YEAR EDITIONEUROPEAN FUND MARKET REVIEW
broadridge.com
No part of this document may be distributed, reproduced, or posted without the express written permission of Broadridge Financial Solutions, Inc.
©2016 Broadridge Financial Solutions, Inc. Broadridge and the Broadridge logo are registered trademarks of Broadridge Financial Solutions, Inc.
AUTHOR INFORMATIONJérôme CouteurProduct Manager, [email protected]
Barbara FerraresiProduct Manager, [email protected]
Diana [email protected]
Broadridge Databases Featured:FundFileSalesWatch
Kalie HewittGraphics [email protected]
ABOUT BROADRIDGEBroadridge Financial Solutions, Inc. (NYSE:BR) is the leading provider of investor communications and technology-driven solutions for broker-dealers, banks, mutual funds and corporate issuers globally. Broadridge’s investor communications, securities processing and managed services solutions help clients reduce their capital investments in operations infrastructure, allowing them to increase their focus on core business activities. With over 50 years of experience, Broadridge’s infrastructure underpins proxy voting services for over 90% of public companies and mutual funds in North America, and processes on average $5 trillion in equity and fixed income trades per day. Broadridge employs approximately 7,400 full-time associates in 14 countries.
For more information about Broadridge, please visit www.broadridge.com.

3
2016 MID-YEAR EDITION EUROPEAN FUND MARKET REVIEW
broadridge.com
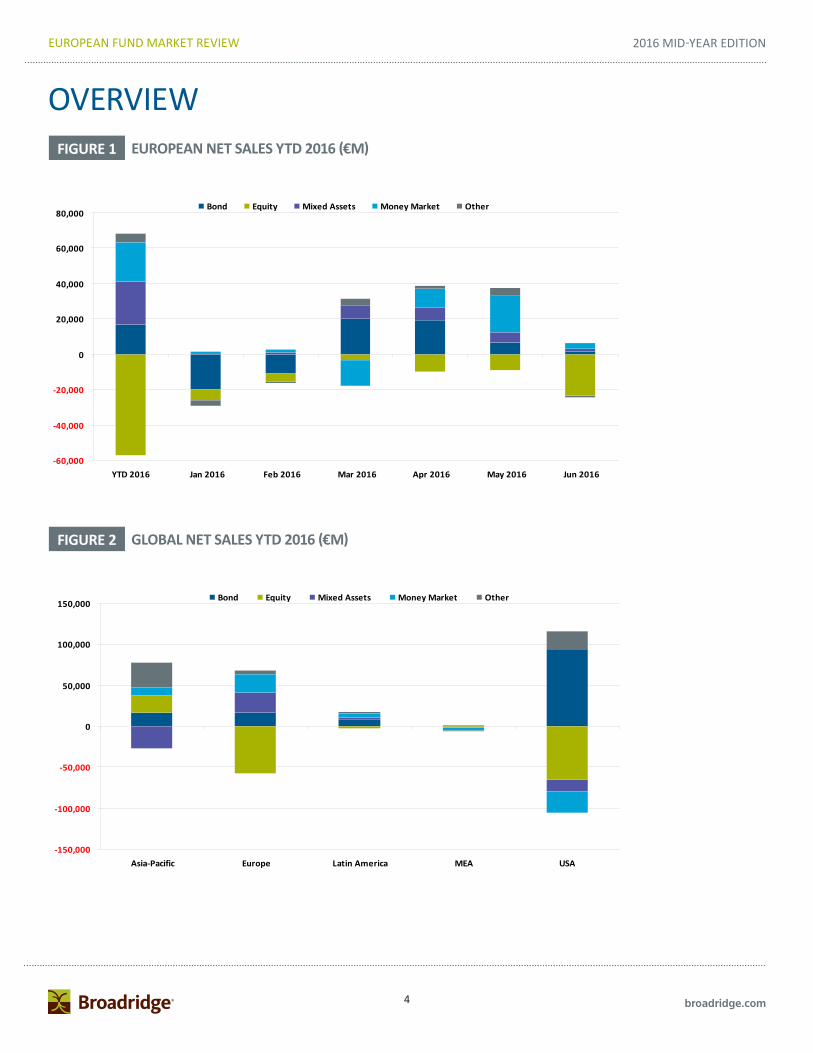
OVERVIEWThe asset management world can change with what seems like the blink of an eye. After a year in which numerous sales records were hit, 2016 began with investors still sulking over the US interest rate rise that occurred in December, but it was the sharp correction to the Chinese bourses that then sent them into an almighty huff. This negative cycle lasted for two months, hitting the global markets broadside on. Ironically, investor portfolios in the Asian region experienced the least pain but this was mainly the result of Japan stepping up its quantitative-easing programme and fuelling demand for ETFs. Europe, though, fared worse than any other region during the first half, weighed down not only by the Chinese crash but also by local issues.
Volatile is the only way to describe the European markets during the first half of 2016. After the investment hiatus that occurred at the start of the year, mainstream retail savers called time on fund investing and seem to have been hiding in deposits ever since. This left institutions and sophisticated investors in control and their appetite became increasingly short term as winter turned to summer. Net flows started the year in redemption over China and they ended the half year in redemption over Brexit. Sandwiched in between there were some good months fuelled by the ECB’s promise to buy high-grade corporate bonds. The front-runners took to the tracks without a moment’s hesitation, pumping money into a variety of corporate and emerging market bond funds. Net sales into long-term funds bounced from redemption to solid inflows between March and May, but then came Brexit and a second bout of derisking in anticipation of the vote. By the end of the first half the gains made in the good months were overwhelmed by the withdrawals and Europe ended the six-month period with net redemptions of €11bn in the long-term asset classes. The Asian region, on the other hand, topped the regional scoreboard with inflows of €40bn, followed by the US with €36bn.
Equities were the Achilles heel of most regional industries. Regardless of market health and periodic rebounds, investors refused to see their attractions and every month to the end of June ended in redemption for this asset class. In fact, by the end of the first half cumulative equity fund redemptions were higher than in any like-for-like period since the financial crisis in 2008. It was not so much a case of investors being risk-off; rather they chose to take risk through fixed income and mixed asset funds. Thus various styles of corporate and global currency bonds scored solid inflows, whilst almost all regional equities – Europe in particular – were sold off. There were two areas of residual equity interest, namely, emerging markets and alternative equity products, both offering the hope of uncorrelated returns.
Mixed asset funds were last year’s arena of bonanza sales flows. This year the asset class has so far maintained its sales strength against all other categories but volumes have plummeted. In the first half of 2015 net inflows soared to €131bn, their best experience on record. In the same period this year, net receipts were a diminutive €24bn. One important factor in their relative demise is the lack of activity by Europe’s large captive banks in sales generation through new product initiatives – another sign that their mainstream savers are out of play.
RELENTLESS RISE OF ETFSMarket volatility in the recent months has shown investors to be pumping money into active funds when they are in a buying frenzy, but passive funds when they are in a more negative cycle. Even so, passive funds continue to generate consistent inflows regardless of market cycle and as investment horizons become more short term their interest in ETFs becomes more noticeable. These behavioural patterns are nowhere more evident than in equities where ETFs, in particular, generated net inflows of €41bn in the first half compared with redemptions of €60bn from their actively managed counterparts.
This is a trend that has been developing over a number of years and cannot be dismissed as temporary. Indeed, the volumes seen so far this year, across all asset classes, represent a 65% increase on the full-year volumes seen in 2015 – and, what’s more, 2015 was a record year for the sales of ETFs.
MARKET SUCCESSIgnoring money market funds, which continue to be the mainstay of French sales success, the spotlight in the first half of the year was on Germany and Switzerland. The German market was very slow to recover from the financial crisis but in the last three years sales volumes have been building progressively. Institutions have played an important role in this momentum, through ETFs, specially designed index tracker funds and, increasingly, renewed interest in real estate funds. Mixed asset funds have also proved to be a popular option, particularly for retail investors and here independent boutiques like Flossbach von Storch have been rising high. Sophisticated investors and institutions are also a feature of the Swiss market and, here, equities retained some of their sparkle although it was institutional index trackers that were the primary driving force.
Much lower down the rankings was Spain and here a warning flag is flying, particularly for cross-border groups that enjoyed huge sales flows via funds of funds in 2015. Spanish banks have once again turned their backs on this product and are instead feeding their captive clients on a new diet of protected and guaranteed funds. Money is being sucked out of funds of funds and cross-border groups, in consequence, are finding the market much more challenging.
THE FALL OF THE GIANTSWith new money hard to find and investors withdrawing from risk-based funds, Europe’s largest groups have taken an inevitable hit. One of the sad rules of asset management is that success breeds profit takers so those with the largest book of assets tend to see the biggest outflows. Not so Nordea, which has been riding the mixed asset wave over the past two years. Its success has not yet peaked and, in fact, troubled investors are herding into its Stable Return fund in numbers not seen since the heady days of Carmignac’s Patrimoine fund. Nordea is not the only success story; bubbling in the background is a battle for alternative mixed asset propositions being fought out between Standard Life and pretenders to the throne, Invesco and Aviva. Aviva has had the best of the sales battle this year, sufficient to rank it second after Nordea. Clearly it is not an even fight because Standard Life is handicapped by its considerable book of legacy assets, but the interplay will be interesting to watch in the coming months.
KEY DATA:TOTAL # OF MASTER GROUPS ........................................................ 1,874TOTAL # OF COMPANIES ................................................................ 2,734TOTAL # OF FUNDS ....................................................................... 34,854FUND LAUNCHES............................................................................... 967FUND CLOSURES ............................................................................ 1,438TOTAL NET ASSETS (JUNE 2016) .......................................... €8,112.9BNASSET GROWTH (YTD 2015) ...................................................... -€198BNESTIMATED NET SALES (YTD 2016) ............................................€11.1BNESTIMATED NET SALES (Q1 2016) ............................................ -€27.8BNESTIMATED NET SALES (Q2 2016) ............................................. €38.9BN
4
2016 MID-YEAR EDITIONEUROPEAN FUND MARKET REVIEW
broadridge.com
OVERVIEW
FIGURE 2 GLOBAL NET SALES YTD 2016 (€M)
-150,000
-100,000
-50,000
0
50,000
100,000
150,000
Asia-Pacific Europe Latin America MEA USA
Bond Equity Mixed Assets Money Market Other
-60,000
-40,000
-20,000
0
20,000
40,000
60,000
80,000
YTD 2016 Jan 2016 Feb 2016 Mar 2016 Apr 2016 May 2016 Jun 2016
Bond Equity Mixed Assets Money Market Other
FIGURE 1 EUROPEAN NET SALES YTD 2016 (€M)

5
2016 MID-YEAR EDITION EUROPEAN FUND MARKET REVIEW
broadridge.com
BEST-SELLING EQUITY FUNDS YTD 2016
FUND EQUITY CLASSIFICATION NET SALES (€M)State Street ACS North America Index Equity North America 3,035.2
Fundsmith Equity Global 2,007.6
Old Mutual Global Equity Absolute Return Alternative 1,917.6
DWS Top Dividende Global Income 1,450.8
iShares Core S&P 500 UCITS ETF (USD) North America 1,379.1
FIGURE 4
BEST SELLERSFIGURE 3
FIGURE 5
BEST-SELLING BOND FUNDS YTD 2016
FUND BOND CLASSIFICATION NET SALES (€M)CS Nova (Lux) Fixed Maturity Bond Fund 2019 Target Maturity Other 2,932.9
Eurizon EasyFund - Treasury EUR T1 Global Currencies 1,970.1
PIMCO GIS Income Global Currencies 1,950.3
Carmignac Sécurité EUR Short-Term 1,922.4
AEAM Dutch Mortgage Asset-backed Securities 1,777.7
BEST-SELLING MIXED FUNDS YTD 2016
FUND MIXED CLASSIFICATION NET SALES (€M)Nordea 1 - Stable Return Asset Allocation 6,135.6
JPMorgan Global Macro Opportunities Asset Allocation Alternative 4,614.3
Invesco Global Targeted Returns Asset Allocation Alternative 1,902.6
Invesco Perpetual Global Targeted Returns Asset Allocation Alternative 1,660.5
Aviva Investors Multi-Strategy Target Return Asset Allocation Alternative 1,379.0
6
2016 MID-YEAR EDITIONEUROPEAN FUND MARKET REVIEW
broadridge.com
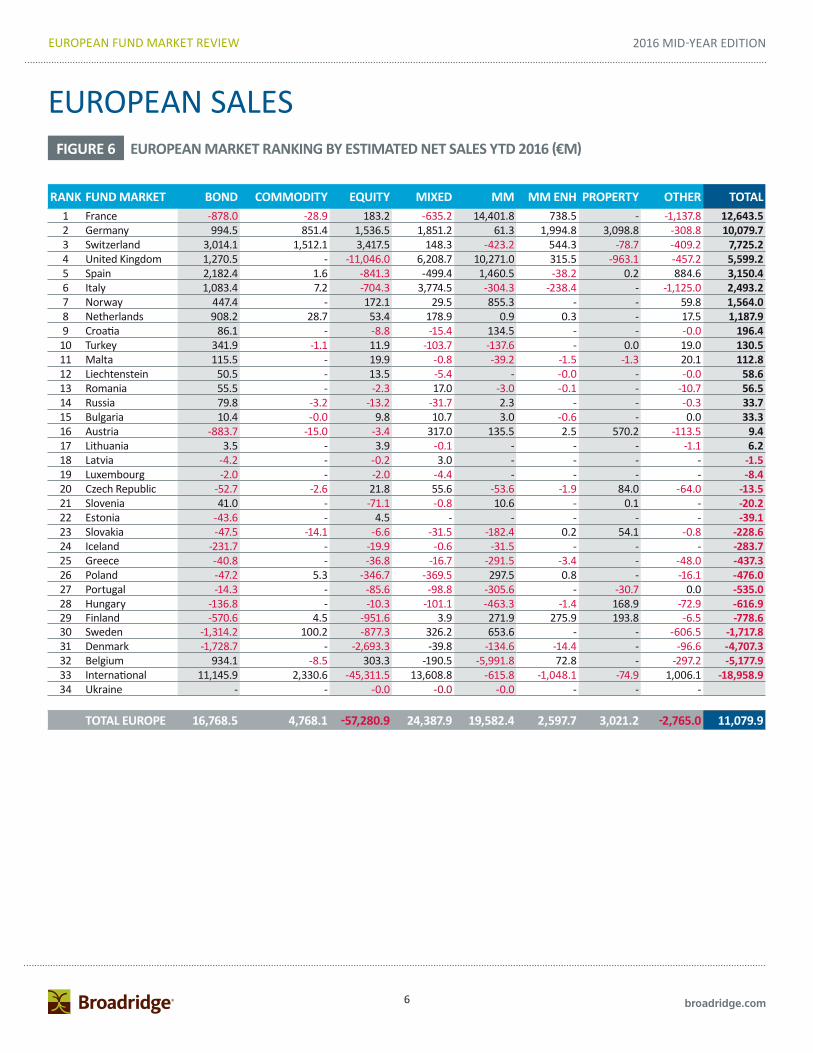
EUROPEAN SALESFIGURE 6 EUROPEAN MARKET RANKING BY ESTIMATED NET SALES YTD 2016 (€M)
RANK FUND MARKET BOND COMMODITY EQUITY MIXED MM MM ENH PROPERTY OTHER TOTAL1 France -878.0 -28.9 183.2 -635.2 14,401.8 738.5 - -1,137.8 12,643.5 2 Germany 994.5 851.4 1,536.5 1,851.2 61.3 1,994.8 3,098.8 -308.8 10,079.7 3 Switzerland 3,014.1 1,512.1 3,417.5 148.3 -423.2 544.3 -78.7 -409.2 7,725.2 4 United Kingdom 1,270.5 - -11,046.0 6,208.7 10,271.0 315.5 -963.1 -457.2 5,599.2 5 Spain 2,182.4 1.6 -841.3 -499.4 1,460.5 -38.2 0.2 884.6 3,150.4 6 Italy 1,083.4 7.2 -704.3 3,774.5 -304.3 -238.4 - -1,125.0 2,493.2 7 Norway 447.4 - 172.1 29.5 855.3 - - 59.8 1,564.0 8 Netherlands 908.2 28.7 53.4 178.9 0.9 0.3 - 17.5 1,187.9 9 Croatia 86.1 - -8.8 -15.4 134.5 - - -0.0 196.4
10 Turkey 341.9 -1.1 11.9 -103.7 -137.6 - 0.0 19.0 130.5 11 Malta 115.5 - 19.9 -0.8 -39.2 -1.5 -1.3 20.1 112.8 12 Liechtenstein 50.5 - 13.5 -5.4 - -0.0 - -0.0 58.6 13 Romania 55.5 - -2.3 17.0 -3.0 -0.1 - -10.7 56.5 14 Russia 79.8 -3.2 -13.2 -31.7 2.3 - - -0.3 33.7 15 Bulgaria 10.4 -0.0 9.8 10.7 3.0 -0.6 - 0.0 33.3 16 Austria -883.7 -15.0 -3.4 317.0 135.5 2.5 570.2 -113.5 9.4 17 Lithuania 3.5 - 3.9 -0.1 - - - -1.1 6.2 18 Latvia -4.2 - -0.2 3.0 - - - - -1.5 19 Luxembourg -2.0 - -2.0 -4.4 - - - - -8.4 20 Czech Republic -52.7 -2.6 21.8 55.6 -53.6 -1.9 84.0 -64.0 -13.5 21 Slovenia 41.0 - -71.1 -0.8 10.6 - 0.1 - -20.2 22 Estonia -43.6 - 4.5 - - - - - -39.1 23 Slovakia -47.5 -14.1 -6.6 -31.5 -182.4 0.2 54.1 -0.8 -228.6 24 Iceland -231.7 - -19.9 -0.6 -31.5 - - - -283.7 25 Greece -40.8 - -36.8 -16.7 -291.5 -3.4 - -48.0 -437.3 26 Poland -47.2 5.3 -346.7 -369.5 297.5 0.8 - -16.1 -476.0 27 Portugal -14.3 - -85.6 -98.8 -305.6 - -30.7 0.0 -535.0 28 Hungary -136.8 - -10.3 -101.1 -463.3 -1.4 168.9 -72.9 -616.9 29 Finland -570.6 4.5 -951.6 3.9 271.9 275.9 193.8 -6.5 -778.6 30 Sweden -1,314.2 100.2 -877.3 326.2 653.6 - - -606.5 -1,717.8 31 Denmark -1,728.7 - -2,693.3 -39.8 -134.6 -14.4 - -96.6 -4,707.3 32 Belgium 934.1 -8.5 303.3 -190.5 -5,991.8 72.8 - -297.2 -5,177.9 33 International 11,145.9 2,330.6 -45,311.5 13,608.8 -615.8 -1,048.1 -74.9 1,006.1 -18,958.9 34 Ukraine - - -0.0 -0.0 -0.0 - - -
TOTAL EUROPE 16,768.5 4,768.1 -57,280.9 24,387.9 19,582.4 2,597.7 3,021.2 -2,765.0 11,079.9

7
2016 MID-YEAR EDITION EUROPEAN FUND MARKET REVIEW
broadridge.com
FIGURE 7 TOP 25 SECTORS IN EUROPE (€M)
FIGURE 8 TOP AND BOTTOM FIVE SECTORS BY SALES YTD 2016 (€M)
ALL SECTOR RANKING
RANK FUND SECTOR ENS YTD 20161 Asset Allocation Alternative 18,852.8 2 Money Market EUR 17,630.6 3 Equities Alternative 11,530.1 4 Money Market GBP 11,513.1 5 Bonds Global Corporates 8,600.3 6 Bonds Global Currencies 8,143.8 7 Fund of Funds Bonds 7,422.4 8 Bonds USD 6,237.0 9 Equities Emerging Markets 5,463.1
10 Bonds EUR Corp. Inv. Grade 5,445.4 11 Asset Allocation 5,350.5 12 Commodities 4,768.1 13 Derivatives 3,798.5 14 Asset-backed Securities 3,107.0 15 Bonds Emerging Markets 3,021.6 16 Real Estate 3,021.2 17 Short Term Dynamic 2,919.1 18 Target Maturity Other 2,811.8 19 Bonds Inflation Linked 2,592.4 20 Speciality 2,591.3 21 Bonds EUR Short-Term 2,493.8 22 Bonds Asian Currencies 2,402.3 23 Fund of Funds Asset Allocation 2,348.5 24 Fund of Funds Balanced 2,280.4 25 Bonds USD Corp. Inv. Grade 2,089.4
REST -128,218.0 TOTAL 18,216.2
-15,000
-10,000
-5,000
0
5,000
10,000
15,000
20,000
Asset AllocAlt
MM Euro Eq Alt MM GBP Bnd GlCorp
Bnd USDCorp HY
MM USD Eq Europe Eq Japan Bnd Flex
Note: Includes funds of funds.

8
2016 MID-YEAR EDITIONEUROPEAN FUND MARKET REVIEW
broadridge.com
Eq Europe
Eq UK
Eq Global
Eq UK IncEq EurolandAsset Alloc Alt
Real Est
Eq Japan Asset AllocEq Europe Ex UK
DerivativesEq Alt
Bnd Flex
Conv Bnd & Ops
Mix Dyn
Eq Switz
Bnd Eur Sh-T
Bnd USD
Bnd USD Corp HY Bnd Gl Corp
Commod
Bnd Em MktEq Em Mkt
Bnd Eur
-35,000
-30,000
-25,000
-20,000
-15,000
-10,000
-5,000
0
5,000
10,000
-15,000 -10,000 -5,000 0 5,000 10,000 15,000 20,000
Sales contribution (€m)
Perf
orm
ance
con
trib
utio
n (€
m)
FIGURE 9 SECTOR POSITIONING BY SALES AND PERFORMANCE CONTRIBUTION TO ASSET GROWTH YTD 2016 (€M)
Note: Excludes money market funds and funds launched/merged in 2016

9
2016 MID-YEAR EDITION EUROPEAN FUND MARKET REVIEW
broadridge.com
RANK MASTER GROUP NAT # FUNDS ENS YTD 20161 Nordea SE 250 10,096.9 2 Aviva GB 162 6,420.0 3 BlackRock US 504 6,179.8 4 Cr Suisse CH 347 5,096.7 5 Intesa SP IT 529 4,779.4 6 State Street US 183 4,399.9 7 VR/Union DE 426 3,973.0 8 Vanguard US 60 3,760.6 9 KBC BE 951 3,541.5
10 ORIX / Robeco JP 85 3,449.9 11 Pictet CH 126 2,614.9 12 Northern Trust US 24 2,578.0 13 MMC/Mercer US 49 2,292.0 14 Legal & General GB 72 2,209.8 15 Fundsmith GB 2 2,018.4 16 Bridgewater US 3 1,957.6 17 Aegon NL 74 1,855.3 18 Flossbach von Storch AG DE 15 1,663.7 19 Winton Capital GB 6 1,585.4 20 New York Life / Candriam US 149 1,518.3 21 Old Mutual ZA 121 1,471.5 22 Algebris GB 4 1,446.2 23 Den Norske NO 61 1,252.5 24 Swiss Life CH 56 1,212.6 25 Dimensional US 25 1,156.4
TOP 25 4,284 78,530.3 REST 23,816 -89,630.6 TOTAL 28,100 -11,100.3
FIGURE 10 TOP EUROPEAN MASTER GROUPS BY SALES YTD 2016 (€M)
PAN-EUROPEAN MASTER GROUPS SALES
Note: Excludes money market funds.
FIGURE 11 MARKET SHARE OF LEADING MASTER GROUPS BY SALES YTD 2016 (€M)
-120,000
-100,000
-80,000
-60,000
-40,000
-20,000
0
20,000
40,000
Top 5 6-15 16-25 26-35 Rest
10
2016 MID-YEAR EDITIONEUROPEAN FUND MARKET REVIEW
broadridge.com
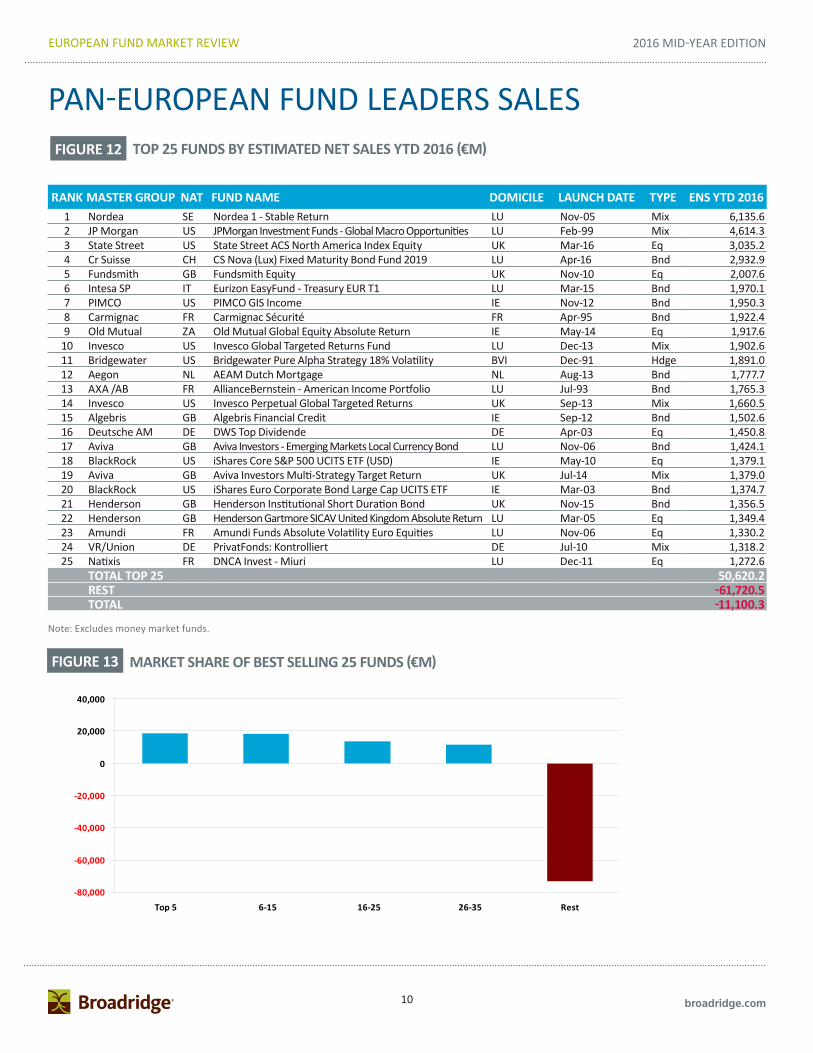
FIGURE 12 TOP 25 FUNDS BY ESTIMATED NET SALES YTD 2016 (€M)
PAN-EUROPEAN FUND LEADERS SALES
RANK MASTER GROUP NAT FUND NAME DOMICILE LAUNCH DATE TYPE ENS YTD 20161 Nordea SE Nordea 1 - Stable Return LU Nov-05 Mix 6,135.6 2 JP Morgan US JPMorgan Investment Funds - Global Macro Opportunities LU Feb-99 Mix 4,614.3 3 State Street US State Street ACS North America Index Equity UK Mar-16 Eq 3,035.2 4 Cr Suisse CH CS Nova (Lux) Fixed Maturity Bond Fund 2019 LU Apr-16 Bnd 2,932.9 5 Fundsmith GB Fundsmith Equity UK Nov-10 Eq 2,007.6 6 Intesa SP IT Eurizon EasyFund - Treasury EUR T1 LU Mar-15 Bnd 1,970.1 7 PIMCO US PIMCO GIS Income IE Nov-12 Bnd 1,950.3 8 Carmignac FR Carmignac Sécurité FR Apr-95 Bnd 1,922.4 9 Old Mutual ZA Old Mutual Global Equity Absolute Return IE May-14 Eq 1,917.6
10 Invesco US Invesco Global Targeted Returns Fund LU Dec-13 Mix 1,902.6 11 Bridgewater US Bridgewater Pure Alpha Strategy 18% Volatility BVI Dec-91 Hdge 1,891.0 12 Aegon NL AEAM Dutch Mortgage NL Aug-13 Bnd 1,777.7 13 AXA /AB FR AllianceBernstein - American Income Portfolio LU Jul-93 Bnd 1,765.3 14 Invesco US Invesco Perpetual Global Targeted Returns UK Sep-13 Mix 1,660.5 15 Algebris GB Algebris Financial Credit IE Sep-12 Bnd 1,502.6 16 Deutsche AM DE DWS Top Dividende DE Apr-03 Eq 1,450.8 17 Aviva GB Aviva Investors - Emerging Markets Local Currency Bond LU Nov-06 Bnd 1,424.1 18 BlackRock US iShares Core S&P 500 UCITS ETF (USD) IE May-10 Eq 1,379.1 19 Aviva GB Aviva Investors Multi-Strategy Target Return UK Jul-14 Mix 1,379.0 20 BlackRock US iShares Euro Corporate Bond Large Cap UCITS ETF IE Mar-03 Bnd 1,374.7 21 Henderson GB Henderson Institutional Short Duration Bond UK Nov-15 Bnd 1,356.5 22 Henderson GB Henderson Gartmore SICAV United Kingdom Absolute Return LU Mar-05 Eq 1,349.4 23 Amundi FR Amundi Funds Absolute Volatility Euro Equities LU Nov-06 Eq 1,330.2 24 VR/Union DE PrivatFonds: Kontrolliert DE Jul-10 Mix 1,318.2 25 Natixis FR DNCA Invest - Miuri LU Dec-11 Eq 1,272.6
TOTAL TOP 25 50,620.2 REST -61,720.5 TOTAL -11,100.3
Note: Excludes money market funds.
FIGURE 13 MARKET SHARE OF BEST SELLING 25 FUNDS (€M)
-80,000
-60,000
-40,000
-20,000
0
20,000
40,000
Top 5 6-15 16-25 26-35 Rest

11
2016 MID-YEAR EDITION EUROPEAN FUND MARKET REVIEW
broadridge.com
PRODUCT THEMES
FIGURE 14
FIGURE 15
TOP 10 MASTER GROUPS BY SALES YTD 2016 (€M)
TOP 10 FUNDS BY SALES YTD 2016 (€M)
RANK MASTER GROUPS NAT ASSETS JUNE 2016 ENS YTD 20161 BlackRock US 220,599.4 9,530.0 2 State Street US 16,586.1 1,291.0 3 Vanguard US 18,399.9 828.6 4 Deutsche Börse DE 3,124.0 796.2 5 Swisscanto CH 6,993.9 414.8 6 Amundi FR 19,471.7 407.7 7 Deka DE 7,036.1 345.7 8 UBS CH 24,515.3 239.1 9 Commerzbank DE 7,280.8 220.6
10 Morgan Stanley US 385.8 214.4 TOTAL TOP 10 324,393.1 14,288.1 TOTAL 460,398.5 12,004.6
RANK MASTER GROUPS FUND NAME ENS YTD 20161 BlackRock iShares Core S&P 500 UCITS ETF (USD) 1,379.1 2 BlackRock iShares Euro Corporate Bond Large Cap UCITS ETF 1,374.7 3 BlackRock iShares S&P 500 Minimum Volatility UCITS ETF 1,123.7 4 BlackRock iShares Euro High Yield Corporate Bond UCITS ETF 1,070.8 5 BlackRock iShares Physical Gold ETC 1,056.8 6 BlackRock iShares Core MSCI World UCITS ETF 1,035.5 7 BlackRock iShares $ Corporate Bond UCITS ETF 1,030.0 8 BlackRock iShares Core MSCI Emerging Markets IMI UCITS ETF 990.1 9 Amundi Amundi ETF MSCI Emerging Markets UCITS ETF 829.6
10 Deutsche Börse Xetra-Gold 796.2 TOTAL TOP 10 10,686.5 TOTAL 12,004.6
EXCHANGE TRADED FUNDS

12
2016 MID-YEAR EDITIONEUROPEAN FUND MARKET REVIEW
broadridge.com
RANK MASTER GROUPS FUND NAME ENS YTD 20161 State Street State Street ACS North America Index Equity 3,035.2 2 Vanguard Vanguard Emerging Markets Stock Index 853.5 3 Den Norske DNB Global Indeks 612.7 4 Vanguard Vanguard FTSE Developed World II Common Contractual 580.7 5 Royal London Royal London FTSE 350 Tracker Trust 501.4 6 Vanguard Vanguard Global Bond Index 492.7 7 Cr Suisse CSIF Switzerland Total Market Index Blue 489.9 8 BlackRock BlackRock Emerging Markets Government Bond Index 422.9 9 Vanguard Vanguard US Government Bond Index 422.4
10 Northern Trust Northern Trust World Custom ESG Equity Index 420.0 TOTAL TOP 10 7,831.4 TOTAL 18,217.4
PRODUCT THEMES
FIGURE 16
FIGURE 17
TOP 10 MASTER GROUPS BY SALES YTD 2016 (€M)
TOP 10 FUNDS BY SALES YTD 2016 (€M)
RANK MASTER GROUPS NAT ASSETS JUNE 2016 ENS YTD 20161 State Street US 30,675.9 4,138.1 2 Vanguard US 68,663.6 3,169.3 3 UBS CH 59,766.4 2,783.9 4 Northern Trust US 8,360.6 2,388.6 5 Cr Suisse CH 57,545.6 2,118.9 6 Swisscanto CH 26,970.2 1,259.6 7 Legal & General GB 23,398.5 1,000.2 8 Den Norske NO 1,591.0 786.6 9 MMC/Mercer US 4,632.3 582.8
10 KutxaBank ES 1,247.3 391.0 TOTAL TOP 10 282,851.2 18,619.0 TOTAL 542,520.7 18,217.4
INDEX TRACKING FUNDS

13
2016 MID-YEAR EDITION EUROPEAN FUND MARKET REVIEW
broadridge.com
Active80%
ETFs6%Index
Tracking14%
Active84%
index11%
ETFs5%
PRODUCT THEMES
FIGURE 18 MARKET SHARE OF PASSIVE FUNDS BY ASSETS
ACTIVE VS. PASSIVE
FIGURE 19 HISTORICAL NET SALES (€M)
-100,000
-50,000
0
50,000
100,000
150,000
200,000
250,000
300,000
350,000
2013 2014 2015 2016 YTD
Active Index Tracking ETFs
Note: Excludes money market funds.
AS OF JUNE 2016AS OF JUNE 2013

14
2016 MID-YEAR EDITIONEUROPEAN FUND MARKET REVIEW
broadridge.com
RANK MASTER GROUPS FUND NAME ENS YTD 20161 Old Mutual Old Mutual Global Equity Absolute Return 1,917.6 2 Henderson Henderson Gartmore SICAV United Kingdom Absolute Return 1,349.4 3 Amundi Amundi Funds Absolute Volatility Euro Equities 1,330.2 4 Natixis DNCA Invest - Miuri 1,272.6 5 Schroders Schroder ISF-European Alpha Absolute Return 877.8 6 Henderson Henderson UK Absolute Return 743.7 7 Nordea Nordea 1 - Stable Equity Long/Short 644.5 8 Innocap InRIS UCITS PLC-R Parus 592.7 9 UBS UBS Equity Opportunity Long Short 563.4
10 BNP Paribas THEAM Quant - Equity Europe Income Defensive 522.8 TOTAL TOP 1O 9,814.7 TOTAL 11,530.1
PRODUCT THEMES
FIGURE 20
FIGURE 21
TOP 10 MASTER GROUPS BY SALES YTD 2016 (€M)
TOP 10 FUNDS BY SALES YTD 2016 (€M)
RANK MASTER GROUPS NAT ASSETS JUNE 2016 ENS YTD 20161 Old Mutual ZA 7,204.5 2,123.0 2 Henderson GB 6,329.8 2,041.1 3 Amundi FR 3,465.0 1,726.4 4 Natixis FR 3,261.6 1,386.7 5 Exane FR 3,596.4 848.0 6 BNP Paribas FR 1,426.0 658.8 7 Nordea SE 1,491.6 644.5 8 Deutsche AM DE 2,140.9 589.1 9 Schroders GB 3,481.2 556.8
10 Innocap CA 1,160.2 545.1 TOTAL TOP 1O 33,557.3 11,119.6 TOTAL 100,405.0 11,530.1
EQUITIES ALTERNATIVE

15
2016 MID-YEAR EDITION EUROPEAN FUND MARKET REVIEW
broadridge.com
PRODUCT THEMES
FIGURE 22
FIGURE 23
TOP 10 MASTER GROUPS BY SALES YTD 2016 (€M)
TOP 10 FUNDS BY SALES YTD 2016 (€M)
RANK MASTER GROUPS NAT ASSETS JUNE 2016 ENS YTD 20161 BlackRock US 9,724.5 1,177.5 2 PIMCO US 13,615.7 1,032.5 3 JP Morgan US 4,635.1 968.9 4 Pioneer IT 1,222.3 735.8 5 UBS CH 2,255.2 699.9 6 Legal & General GB 2,830.9 580.3 7 Den Norske NO 2,095.3 550.6 8 KBC BE 1,391.6 491.7 9 Schroders GB 2,466.3 424.5
10 Azimut IT 2,242.8 402.7 TOTAL TOP 1O 42,479.7 7,064.5 TOTAL 88,244.9 8,600.3
RANK MASTER GROUPS FUND NAME ENS YTD 20161 JP Morgan JPMorgan Funds - Global Corporate Bond 976.3 2 PIMCO PIMCO GIS Global Investment Grade Credit 888.1 3 Pioneer Pioneer Funds - Global Subordinated Bond 706.8 4 Legal & General LGIM Global Corporate Bond 580.3 5 Den Norske DnB Global Credit 550.6 6 BlackRock iShares Global Corporate Bond EUR Hedged UCITS ETF 521.8 7 BlackRock BlackRock Global Funds - Global Corporate Bond 413.1 8 Storebrand Storebrand Global Kreditt IG 362.6 9 KBC KBC Bonds Strategic Corporate Bonds 359.2
10 Schroders Schroder Advanced Beta Global Corporate Bond 341.0 TOTAL TOP 1O 5,699.7 TOTAL 8,600.3
BONDS GLOBAL CORPORATES

16
2016 MID-YEAR EDITIONEUROPEAN FUND MARKET REVIEW
broadridge.com
Next 10 sectors
34%
16-25 sectors
15%
Top 5 sectors
36%
Rest15%
RANK FUND SECTOR # FUNDS ENS YTD 20161 Fund of Funds Bonds 6 5,214.42 Asset Allocation Alternative 50 4,717.53 Target Maturity Other 14 4,509.64 Bonds Global Currencies 29 4,471.25 Asset Allocation 77 4,217.36 Fund of Funds Asset Allocation 72 3,186.77 Equities North America 15 2,926.88 Target Maturity Euroland 18 2,609.89 Guaranteed Fund 20 2,416.1
10 Short Term Dynamic 1 2,153.211 Protected Fund 49 2,153.112 Mixed Assets Balanced 27 1,916.813 Equities Global 46 1,716.514 Derivatives 10 1,584.015 Life Cycle 11 1,394.416 Bonds Global Corporates 11 1,256.917 Equities Alternative 33 1,252.718 Asset-backed Securities 4 1,248.019 Mixed Assets Conservative 21 1,234.520 Bonds Emerging Markets 7 891.321 Equities Emerging Markets 13 867.222 Bonds EUR 18 831.923 Equities Europe 34 785.824 Bonds Global High Yield 9 685.725 Bonds Flexible 10 652.2
TOP 25 605 54,893.8TOTAL 970 64,585.2
PRODUCT DEVELOPMENT
FIGURE 24
FIGURE 25
TOP 25 SECTORS OF NEW FUNDS YTD 2016 (€M)
MARKET SHARE OF LEADING SECTORS OF NEW FUNDS
NEW FUNDS BY SECTOR

17
2016 MID-YEAR EDITION EUROPEAN FUND MARKET REVIEW
broadridge.com
CROSS-BORDER PROGRESS
FIGURE 26 TOP 25 INTERNATIONAL GROUPS BY SALES YTD 2016 (€M)
Note: Excludes money market funds.
RANK MASTER GROUP NAT # FUNDS ASSETS JUNE 2016 ENS YTD 20161 Nordea SE 91 62,551.8 10,288.1 2 BlackRock US 423 406,268.7 6,107.3 3 Aviva GB 29 17,479.0 5,164.3 4 ORIX / Robeco JP 66 43,383.0 3,311.7 5 Vanguard US 49 74,076.1 3,218.9 6 Cr Suisse CH 119 20,314.1 3,050.4 7 KBC BE 80 16,572.2 2,510.2 8 Old Mutual ZA 40 11,636.3 2,416.0 9 Pictet CH 92 58,875.5 2,350.8
10 MMC/Mercer US 49 25,128.1 2,292.0 11 Bridgewater US 3 38,563.6 1,957.6 12 Northern Trust US 16 5,783.8 1,682.1 13 Winton Capital GB 6 31,937.1 1,585.4 14 New York Life / Candriam US 93 22,175.9 1,540.5 15 Algebris GB 4 2,507.4 1,446.2 16 State Street US 150 39,142.0 1,073.9 17 Dimensional US 18 9,550.8 988.8 18 Innocap CA 6 2,149.6 988.0 19 T Rowe Price US 37 10,198.7 955.6 20 Muzinich US 14 14,286.0 884.0 21 Carmignac FR 20 45,515.1 877.6 22 AQR Capital US 10 3,627.5 815.3 23 BMO CA 44 7,554.1 808.1 24 Jupiter GB 19 10,985.0 656.0 25 ABN AMRO NL 10 840.4 642.5
TOP 25 1,488 981,101.5 57,611.4 REST 8,248 2,343,205.5 -74,906.4 TOTAL 9,736 3,324,306.9 -17,295.0
GROUP WINNERS
FIGURE 27 MARKET SHARE OF LEADING MASTER GROUPS BY SALES (€M)
-100,000
-80,000
-60,000
-40,000
-20,000
0
20,000
40,000
Top 5 6-15 16-25 26-35 Rest

For more information please contact us [email protected] or phoneus at +1 617 960 2598 (North America)or +44 207 551 3287 (UK, Europe and Asia).
Account for sales across the globe
Learn how to find opportunities for growth across the globe with Broadridge Global Market Intelligence. Increased visibility into total net assets for more than 80,000 global portfolios, to include 11,000 cross border funds. Our leading FundFile and SalesWatch products provide a unique picture into domestic and cross border sales by country.
FundFile - global sales and asset data across 80,000 global fund portfolios
SalesWatch - cross border sales and assets across Europe and Asia
Mutual Funds and ETFs by distribution channel in the United States
Performance and expense data for global funds
Looking for Growth Opportunities in Global Markets?
© 2016 Broadridge Financial Solutions, Inc., Broadridge and the Broadridge logo are registered trademarks of Broadridge Financial Solutions, Inc.
18
2016 MID-YEAR EDITIONEUROPEAN FUND MARKET REVIEW
broadridge.com
CROSS-BORDER PROGRESS
-10,000
-8,000
-6,000
-4,000
-2,000
0
2,000
4,000
6,000
8,000
AU BE FR DEU IT NL SP SWE CH UK
Domestic Foreign
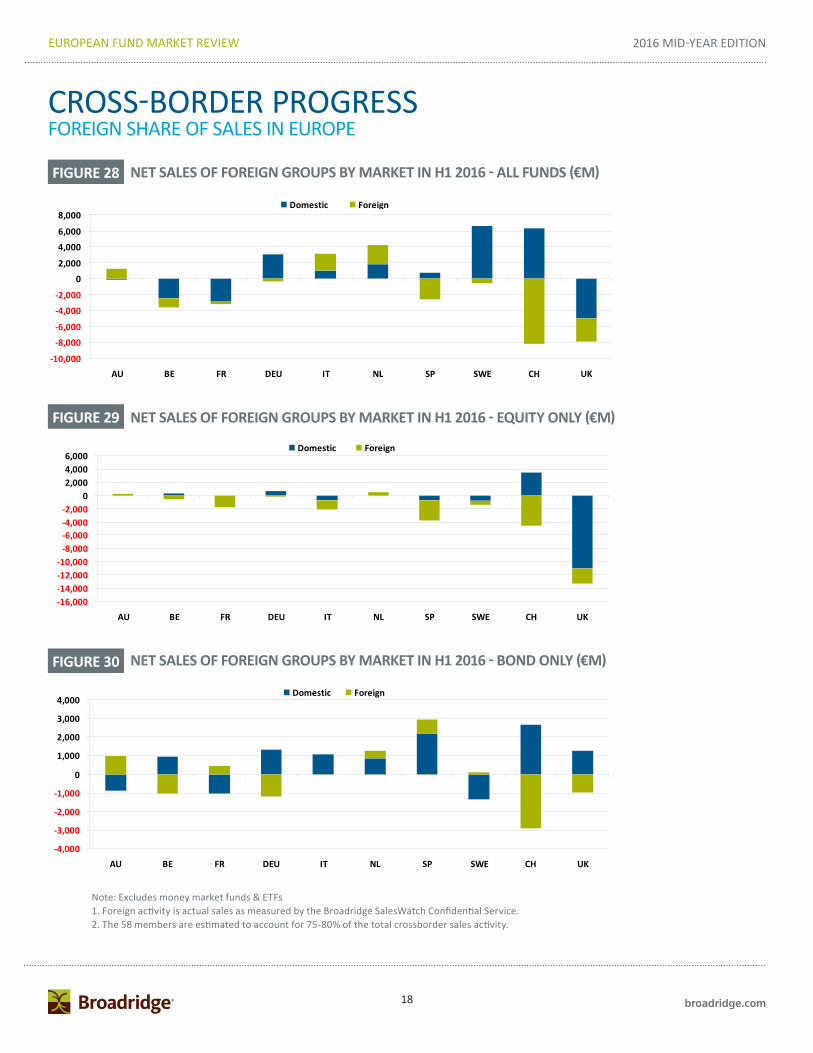
FIGURE 28 NET SALES OF FOREIGN GROUPS BY MARKET IN H1 2016 - ALL FUNDS (€M)
ItalyNetherlandsSpainSwedenSwitzerland
United Kingdom
-16,000 -14,000 -12,000 -10,000
-8,000 -6,000 -4,000 -2,000
02,0004,0006,000
AU BE FR DEU IT NL SP SWE CH UK
Domestic Foreign
FIGURE 29 NET SALES OF FOREIGN GROUPS BY MARKET IN H1 2016 - EQUITY ONLY (€M)
-4,000
-3,000
-2,000
-1,000
0
1,000
2,000
3,000
4,000
AU BE FR DEU IT NL SP SWE CH UK
Domestic Foreign
FIGURE 30 NET SALES OF FOREIGN GROUPS BY MARKET IN H1 2016 - BOND ONLY (€M)
Note: Excludes money market funds & ETFs1. Foreign activity is actual sales as measured by the Broadridge SalesWatch Confidential Service.2. The 58 members are estimated to account for 75-80% of the total crossborder sales activity.
FOREIGN SHARE OF SALES IN EUROPE

19
2016 MID-YEAR EDITION EUROPEAN FUND MARKET REVIEW
broadridge.com
CROSS-BORDER PROGRESS
FIGURE 31 TOP 5 DOMESTIC AND FOREIGN SECTORS IN THE MAJOR MARKETS
Note: Excludes money market funds & ETFs
FRANCEDOMESTIC ENS H1 2016 FOREIGN REAL SALES H1 2016
1 Equities Alternative 1,713.0 Asset Allocation Confidential2 Protected Fund 1,409.5 Asset Allocation Alternative3 Bonds Global Currencies 479.9 Asset-backed Securities4 Fund of Funds Equities Emerging Markets 448.6 Bonds Alternative5 Target Maturity Other 354.0 Bonds Asian Currencies
GERMANYDOMESTIC ENS H1 2016 FOREIGN REAL SALES H1 2016
1 Real Estate 3,098.8 Bonds EUR Confidential2 Asset Allocation Alternative 2,379.6 Fund of Funds Balanced3 Bonds EUR 2,160.6 Bonds USD4 Fund of Funds Balanced 1,397.0 Mixed Assets Income5 Mixed Assets Conservative 1,231.0 Asset Allocation Alternative
ITALYDOMESTIC ENS H1 2016 FOREIGN REAL SALES H1 2016
1 Bonds Global Currencies 3,115.0 Asset Allocation Confidential2 Mixed Assets Conservative 1,493.7 Asset Allocation Alternative3 Asset Allocation 1,298.4 Equities Alternative4 Life Cycle 1,161.5 Bonds EUR Short-Term5 Bonds Emerging Markets 845.4 Bonds Global Corporates
SWITZERLANDDOMESTIC ENS H1 2016 FOREIGN REAL SALES H1 2016
1 Bonds CHF 1,410.3 Asset Allocation Confidential2 Equities Switzerland 1,242.4 Asset-backed Securities3 Equities North America 1,044.0 Bonds Global Corporates4 Bonds Emerging Markets 875.2 Target Maturity Other5 Bonds Global Corporates 874.8 Bonds EUR Corp. Inv. Grade
UNITED KINGDOMDOMESTIC ENS H1 2016 FOREIGN REAL SALES H1 2016
1 Asset Allocation Alternative 5,403.6 Bonds Global Corporates Confidential2 Equities North America 2,515.1 Bonds EUR Short-Term3 Bonds Global Currencies 1,128.3 Equities Alternative4 Equities Alternative 1,121.8 Bonds Emerging Markets - Local Currency5 Bonds Inflation Linked 765.8 Asset Allocation Alternative
DOMESTIC VS. FOREIGN SECTORS
20
2016 MID-YEAR EDITIONEUROPEAN FUND MARKET REVIEW
broadridge.com
FOOTNOTES1. All data is at June 2016 unless otherwise stated.2. ‘International’ fund market. Broadridge defines an International fund as a fund
that sources less than 80% of its assets from any single country. Some fund groups have domestic and international funds.
3. ‘Domestic’ fund market. If a fund sources more than 80% of its assets from a single country then the fund is allocated to that market regardless of its domicile.
4. Funds of funds have been excluded from all charts and tables (to avoid double-counting) unless otherwise stated. Therefore a market total is the sum of all the investment categories excluding the three funds of funds categories (in-house, ex-house and hedge).
5. The investment category ‘other’ includes a variety of different product categories. For most markets, especially Belgium, Spain and France, the figure comprises guaranteed funds, but there are also derivatives and other speciality funds in the ‘other’ category.
6. Property funds are open-ended property funds only.7. Master group. Analysis that aggregates the European mutual fund assets under the
umbrella of their parent company name. ENS stands for estimated net sales.8. ETFs are included in broadridge’s database on mutual funds, but this excludes
exchange-traded commodity products that are not mutual funds.9. References to foreign activity relate to actual sales as measured by Broadridge’s
SalesWatch confidential service. The 58 SalesWatch members are estimated to account for 75-80% of total cross-border sales activity.
The following report is based on the unique fund flows information delivered throughBroadridge FundFile, our leading global fund flows database. The charts and tables inthis report reflect only the tip of the iceberg in terms of the depth and breadth availablefrom Broadridge FundFile. The report offers a high-level overview of European fundflow activity for 2016 year to date.
Broadridge FundFile enables deep fund flows analysis of all key geographical markets,covering Asia Pacific, Latin America, the Middle East and Africa, and the U.S., anddelivers a truly global fund flows solution. By gradually building the international reachof its global sales data and maintaining its high quality and ease of use over the pastten years, FundFile has become the unparalleled source of data and analysis, withinformation on more than 100,000 funds.
The cross-border dimension of the European funds industry–the “international” fundmarket–can truly be assessed only with Broadridge SalesWatch, a unique cooperativeand confidential benchmarking service that allows leading fund groups to track theircross-border sales and assets against their competitors’ by country, distributionchannel, institutional versus retail activity, and both gross and net sales. This servicenow counts 58 of the leading asset managers among its members. (Some sample datataken from the tool can be seen on pages 18 and 19 of the current report).
ABOUT THE REPORT

For more information please contact us [email protected] or phoneus at +1 617 960 2598 (North America)or +44 207 551 3287 (UK, Europe and Asia).
As product line-ups, fund structures, Investor bases and geographies expand, the complexities of fee calculations increase. Broadridge’s services and solutions help organisations with the calculations of dynamic and complex fee schedules. Our automated end to end solution reduces revenue loss, fee leakage and improves revenue forecasts; providing clients the access, visibility and control they need to operate with confidence.
Global oversight of relations and contracts
Multifaceted vendor management strategies
Transparency into expenses, allocations and cash flow
Increased profitability and performance
Gain Transparency into Expenses, Allocations and Cash Flow
© 2016 Broadridge Financial Solutions, Inc., Broadridge and the Broadridge logo are registered trademarks of Broadridge Financial Solutions, Inc.