Embed Size (px)
Citation preview

Group 4Valeria IvanovaMegan McDanielZach HartlineJia LiuSheng-Kai Chen (Ken)

DEMOGRAPHICS
Marital Status
SingleMarried Other
79 % 16 %
Other
5 %
1.4 %
6.5 %
15.2 %
37.3 %
33.7 %
5.2 %
6 %
71 %
19-29
30-40
41-51
52-62
63-73
74-84
85+
Age
Home Ownership StatusHomeowner Renter Other
Other
94 % 5 % 1 %
92 %
8 %Female Male
Family Size

High School - 8.%Technical Degree - .3%
Associates Degree - 12%Some College - 1%
Bachelor’s Degree - 47%Master’s Degree - 26.%
Doctorate - 5.%Other - .2%
1 % 3 % 3 % 92 % > 1 %Apartment Condo Townhouse Single Family
HouseMulti Family
House
Housing
DEMOGRAPHICS
EducationHousehold Income
2 %11 %12 %37 %37 %
Unemployed & Searching
Self-EmployedHomemaker
EmployedRetired
Employment Status
19 %
17 %
23 %
12 %
12 %
7 %
7 %2 %
< 20
$80 - 99
$60 - 79 $100 -119
$120- 139
$140- 159
$160- 179
$180 - 199
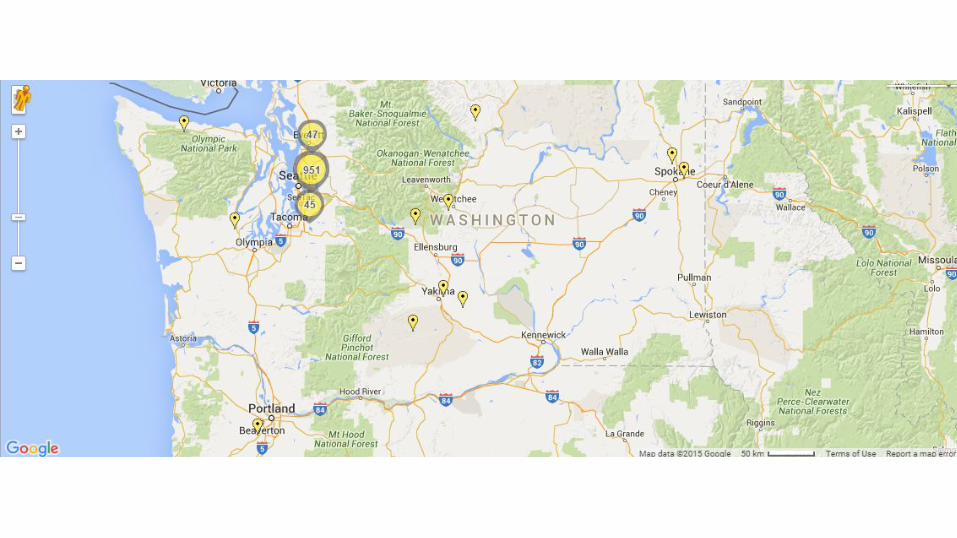
ZipCode98072 - 12% - Woodinville 98077 - 7% - Woodinville
19 %98052 - 8.5% - Redmond
98034 - 6.7% - Kirkland98033 - 5% - Kirkland
11.7 %98011 - 5% - Bothell44 %
OBJECTIVE: WHO SPENDS THE MOST PER VISIT ?
41- 51mean: 3.54
On average, Molbak's customers spend $ 59.5
Other: $59Income $/per
visit
Satisfaction
Marital Status:

AGE
Ho: There is no significant difference between the group’s meansHa: The means of at least two groups are significantly different
Reject Ho.
Sig value less than 0.05. The means of at least 2 groups are statistically significant. The test result shows that there are 3 groups with statistically different means. The mean in spending per visit in age 85+ is the lowest, and the mean in spending per visit in group age 41-51 is the highest.
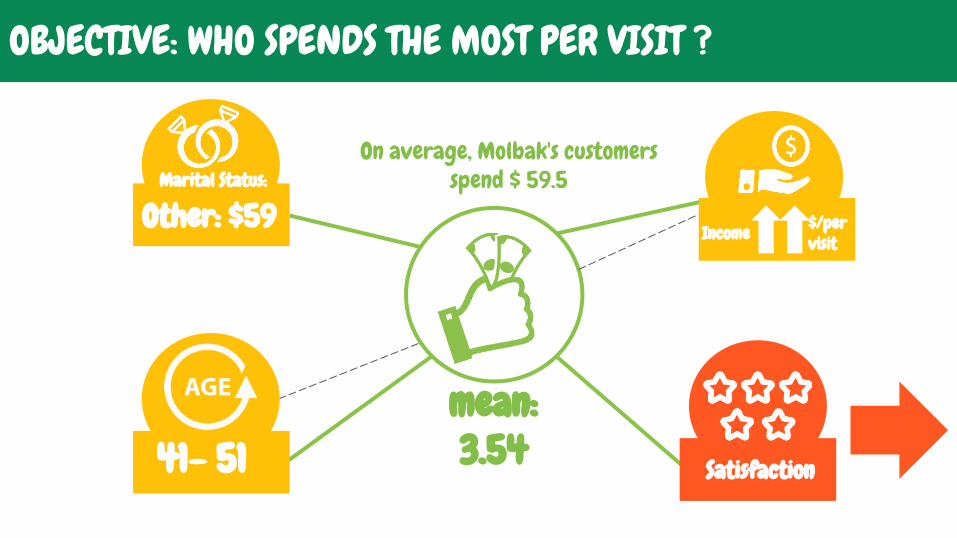
Ho: There is no significant difference between the meansHa: The means of at least two groups are significantly different
Reject Ho. Sig value less than .05. At least two groups have statistically significant means. Group “Other” have the highest mean in spending per visit = 3.90
Marital Status

Ho: There is no significant difference between the meansHa: The means of at least two groups are significantly different
Reject Ho.
The Sig value of .000 is less than 0.05. The mean of at least two groups are significantly different. The group with income of less than 19,999 spends the least per visit and the groups with income of 180,000-199,000 spends the most per visit.
Also, the Linear Regression test indicates that there is a positive correlation between income and amount spent per visit. As the income level increases, the amount spent per visit increases as well.
INCOME
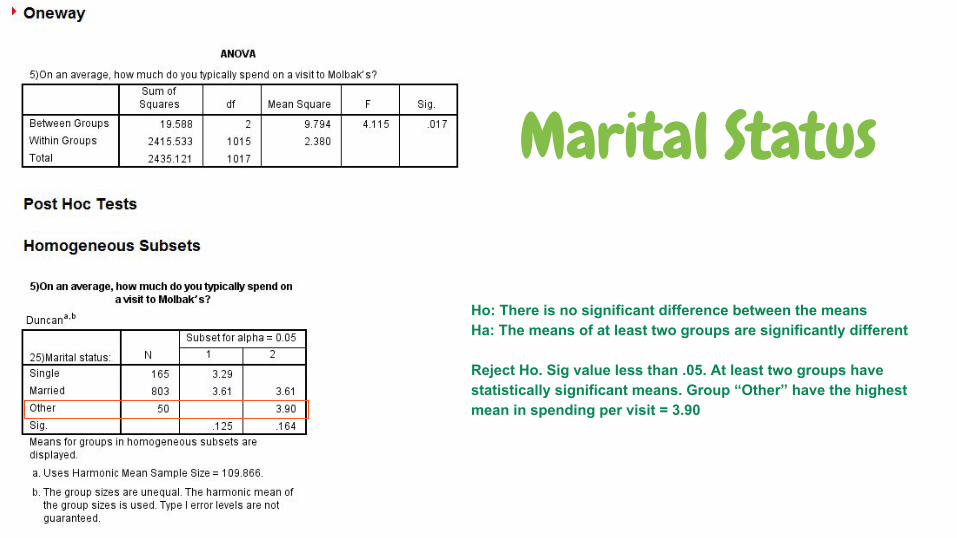
Satisfaction factors affecting amount spent per visit
As satisfaction for prices increases, the amount spent
per visit increases
As satisfaction for location decreases the amount spent
per visit increases
Price Location
Meaning- customers who are dissatisfied with location-
spend more per visit

Ho: No AssociationHa: Statistically Significant Association
Sig value less than 0.05
Reject Ho for the following categories:
1. Satisfaction with Molbaks Prices,
2. Satisfaction with Location:
Fail to Reject Ho for other categories
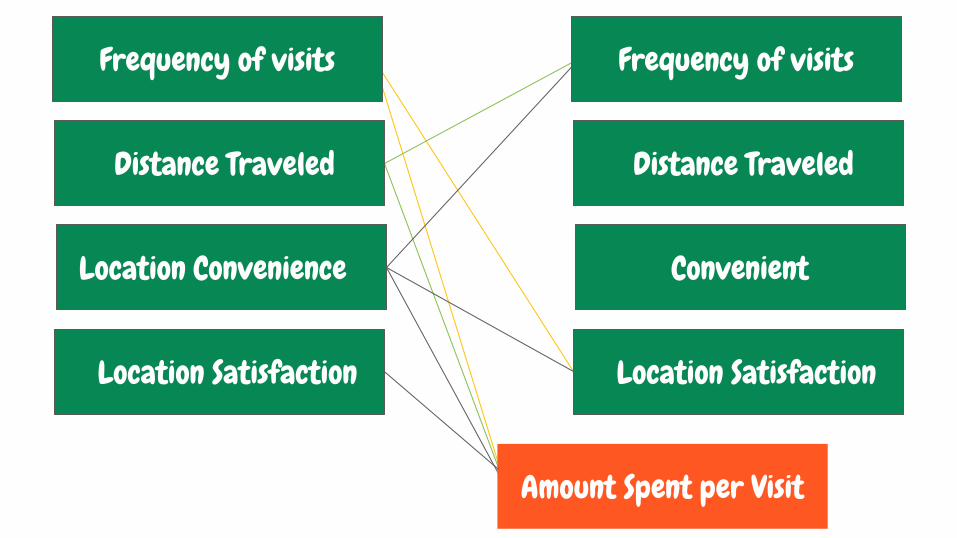
Frequency of visits
Distance Traveled
Location Convenience
Location Satisfaction
Frequency of visits
Distance Traveled
Convenient
Location Satisfaction
Amount Spent per Visit

Customers Who Spend the Most Per Visit are:
41-51 years old ( 15% of surveyed customers)
Customers who are DISSATISFIED with location
Customers who travel the longest ( 21+ miles) to get to Molbak's
Customers who DO NOT find location of Molbak’s Convenient Customers Who Visit Store Less
Often
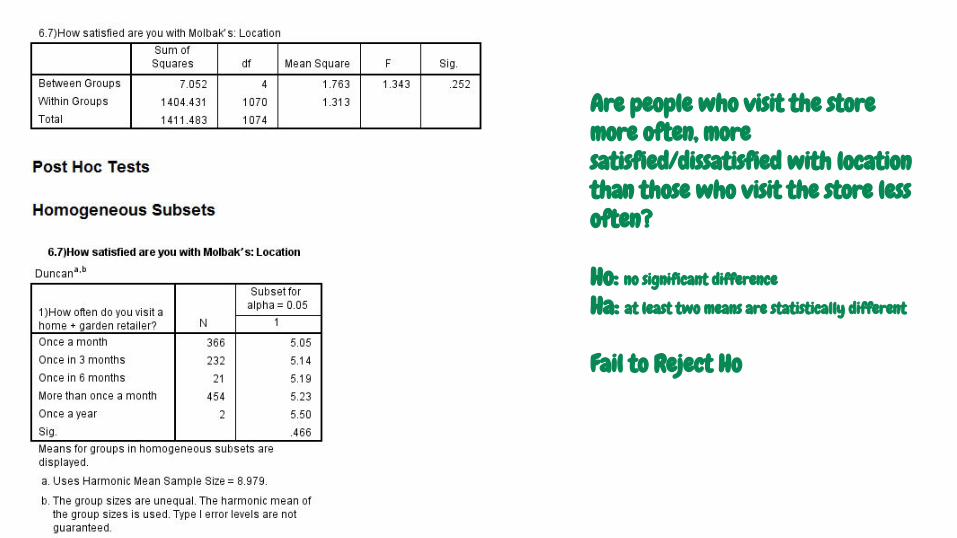
Are people who visit the store more often, more satisfied/dissatisfied with location than those who visit the store less often?
Ho: no significant difference
Ha: at least two means are statistically different
Fail to Reject Ho

Do people who drive the furthest, spend more per visit ?
Ho: no significant difference between groups means
Ha: at least two means are statistically different
Reject Ho
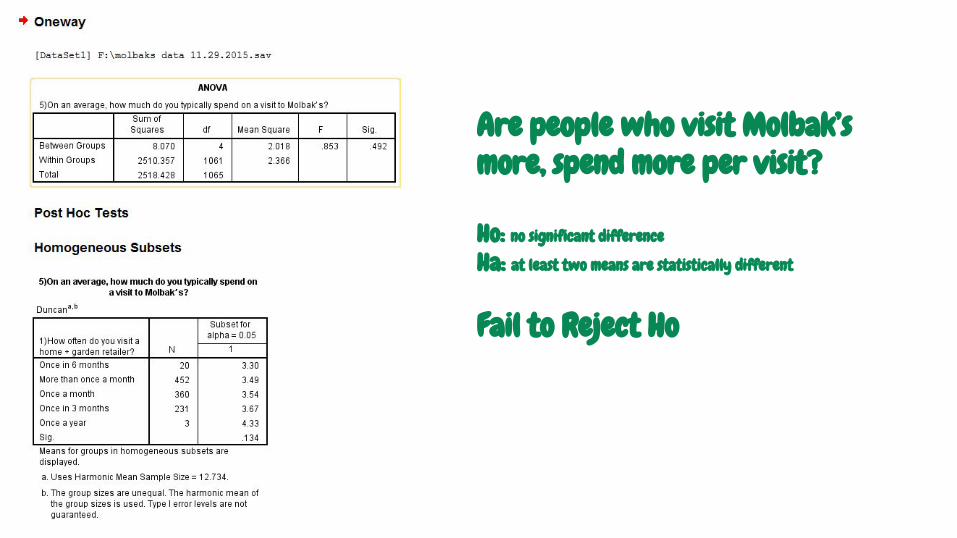
Are people who visit Molbak’s more, spend more per visit?
Ho: no significant difference
Ha: at least two means are statistically different
Fail to Reject Ho

People who travel the furthest visit less often - once in 3 month
Do people who drive further visit the store more often ?
Ho: no significant difference between groups means
Ha: at least two groups’ means are statistically different
Reject Ho

Do people who find it more inconvenient to get to stores, spend more per visit?
Ho: no significant difference between the group
Ha: at least two groups means are statistically different
Reject Ho

Do people who find it more inconvenient to get to store, visit Molbak’s more frequently ?Ho: no significant difference between groups
Ha: at least two groups means are statistically different
Reject Ho

Do people who find it more inconvenient to get to Molbak’s, are less satisfied with Molbaks location ?
Ho: no significant difference
Ha: at least two means are statistically different
Reject Ho

Customers Who Spend the Most Per Visit are:
41-51 years old ( 15% of surveyed customers)
Customers who are DISSATISFIED with location
Customers who travel the longest ( 21+ miles) to get to Molbak's
Customers who do not find location of Molbak’s Convenient Customers Who Visit Store Less
Often

What Brings Them to the Store ?
# 1 - People who travel the furthest have the highest level of satisfaction with Molbak's prices compared to other groups (4.18)
#2- People who travel the furthest have the highest interest mean in all categories of Molbak’s products, except Edible Plants
Statistically different from other groups in the following categories: a. Garden Supplies ( 4.62) b. Fountains ( 3.13) c. Gift Items (4.79)
#3 People who travel the further = have lowest interest in Molbak’s services
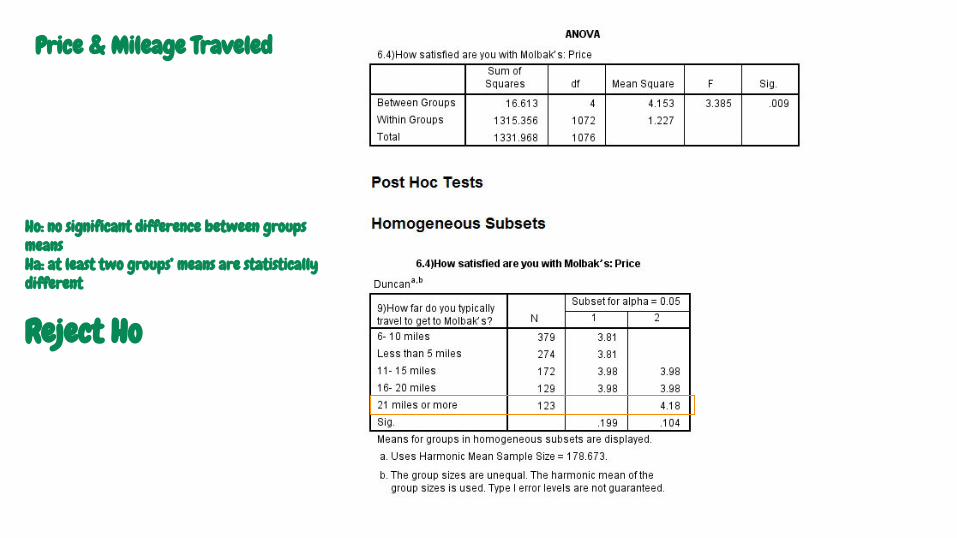
Price & Mileage Traveled
Ho: no significant difference between groups meansHa: at least two groups’ means are statistically different
Reject Ho

Ho: No Significant difference between the groups meanHa: At least 2 group’s mean are statistically significantly different The result indicates that we Reject Ho in the following
interest categories : Garden Supplies, Fountains, Gift Items. We Fail to Reject Ho in all of the other interest categories.


Customers who are dissatisfied with a location, rate it important for the Molbak’s to expand in the following:If Molbak’s were to Expand:
Ho: There is no significant difference between the means
Ha: The means of at least two groups are significantly different
Reject Ho in the following 1) Importance of expansion in Location Closer to Your Home
2) Importance of Satellites Plant Stores. The mean of at least two groups across the following categories were
significantly different. Sig Value is less than 0.05.
Fail to Reject Ho in the following: Importance of expansion in Seasonal Pop up Stores. There is no significant
difference between the means of interest in expansion in Seasonal Pop up Stores across different groups.

If Molbak’s were to Expand:
Ho: There is no significant difference between the meansHa: The means of at least two groups are significantly different
Reject Ho. Sig value is less than 0.05. There are four groups with statistically different meant. Group 1: drive less than 5 mile, mean on 2.09. Group 2: drive 6-10 mile mean 3.13. Group 3: drive 11-15, 16- 20 miles with mean of 4.48 & 4.83. Group 4: drive 21 miles or more with mean of 5.22
Based on the miles traveled, how do customers rate in importance of expansion on the following category: Location closer to your home ?


OBJECTIVE: HOW DID YOU HEAR ABOUT MOLBAKS ?
3.2%1.3% 5.2%1.6%0.6% 0.8%
Based on the data 61.7% of people first heard about Molbak’s from friends
25.6%

H0 = no associationHa = statistically significant association The Asymptotic Sig value is 0.000, since it is less than 0.05, we reject the h0; therefore, age and how customers first came to hear about Molbak’s are associated. Looking at the frequency table, one can see that most people no matter the age hear about Molbak’s from friends and family.

OBJECTIVE: HOW WOULD YOU LIKE TO HEAR FROM MOLBAK’S ?
20.16%
Based on the data 95% of people like to hear from about Molbak’s from Email
6.6% 13.47% 28.1%
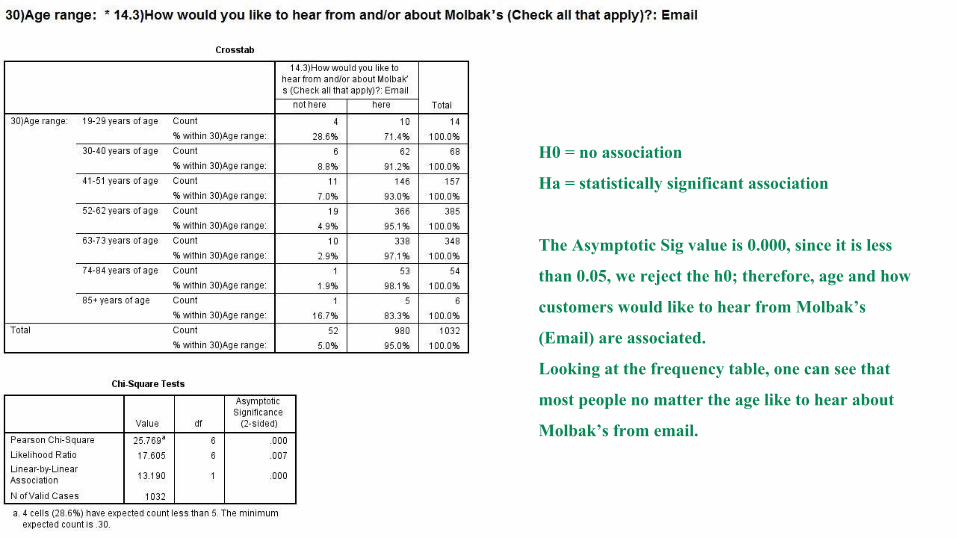
H0 = no association
Ha = statistically significant association
The Asymptotic Sig value is 0.000, since it is less
than 0.05, we reject the h0; therefore, age and how
customers would like to hear from Molbak’s
(Email) are associated.
Looking at the frequency table, one can see that
most people no matter the age like to hear about
Molbak’s from email.
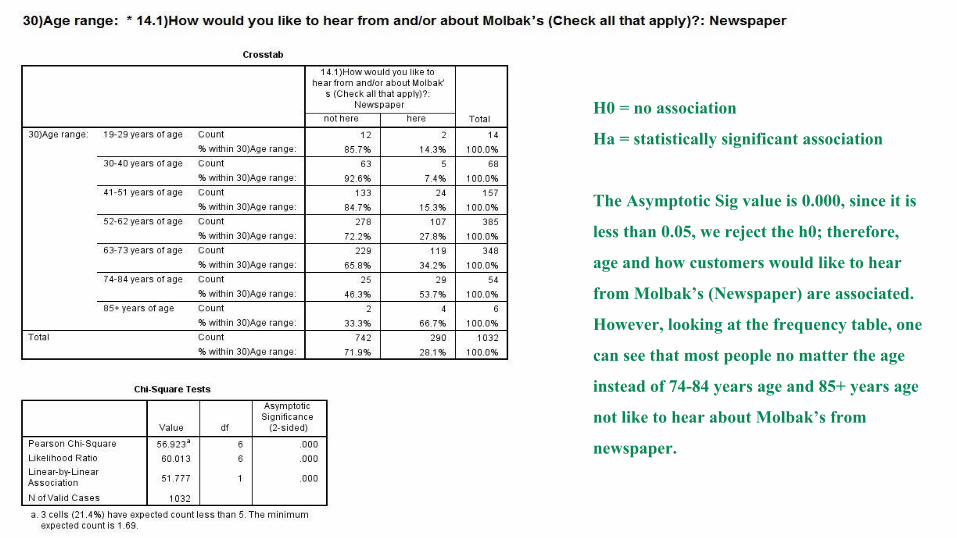
H0 = no association
Ha = statistically significant association
The Asymptotic Sig value is 0.000, since it is
less than 0.05, we reject the h0; therefore,
age and how customers would like to hear
from Molbak’s (Newspaper) are associated.
However, looking at the frequency table, one
can see that most people no matter the age
instead of 74-84 years age and 85+ years age
not like to hear about Molbak’s from
newspaper.

H0 = no association
Ha = statistically significant association
The Asymptotic Sig value is 0.000, since it is less
than 0.05, we reject the h0; therefore, age and how
customers would like to hear from Molbak’s
(Social Media) are associated.
However, looking at the frequency table, one can
see that most people no matter the age not like to
hear about Molbak’s from social media.

H0 = no association
Ha = statistically significant association
The Asymptotic Sig value is 0.000, since it is less
than 0.05, we reject the h0; therefore, age and
how customers would like to hear from Molbak’s
(Mobile App) are associated.
However, looking at the frequency table, one can
see that most people no matter the age not like to
hear about Molbak’s from mobile app.
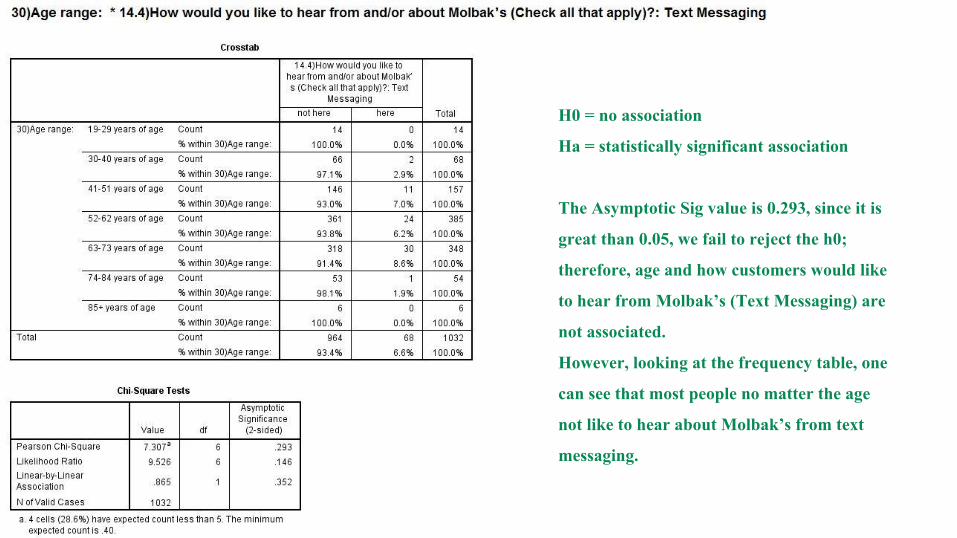
H0 = no association
Ha = statistically significant association
The Asymptotic Sig value is 0.293, since it is
great than 0.05, we fail to reject the h0;
therefore, age and how customers would like
to hear from Molbak’s (Text Messaging) are
not associated.
However, looking at the frequency table, one
can see that most people no matter the age
not like to hear about Molbak’s from text
messaging.

OBJECTIVE: HOW WOULD YOU PREFER TO RECEIVE PROMOTIONS AND COUPONS FROM MOLBAK’S?
17.6%8.2%
According to the data, on average 97.8% customers prefer to receive promotions
and coupons through email!
9.6% 10.9%

H0 = no association
Ha = statistically significant association
The Asymptotic Sig value is 0.712, since it is
greater than 0.05, we fail to reject the h0;
therefore, age and how customers prefer to
receive promotions and coupons from Molbak’s
(Email) are not associated.
Looking at the frequency table, one can see that
most people no matter the like to receive
promotions and coupons from Molbak’s from
email.
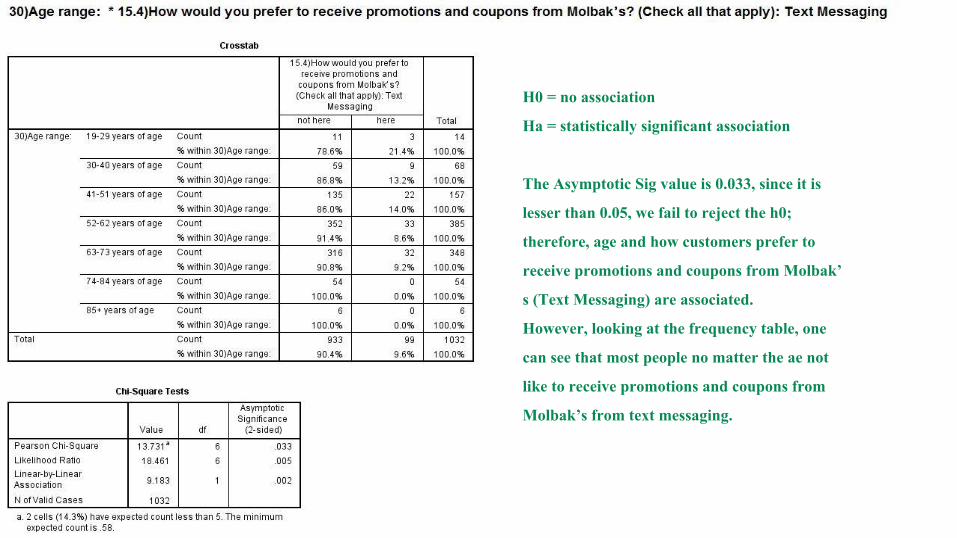
H0 = no association
Ha = statistically significant association
The Asymptotic Sig value is 0.033, since it is
lesser than 0.05, we fail to reject the h0;
therefore, age and how customers prefer to
receive promotions and coupons from Molbak’
s (Text Messaging) are associated.
However, looking at the frequency table, one
can see that most people no matter the ae not
like to receive promotions and coupons from
Molbak’s from text messaging.

H0 = no association
Ha = statistically significant association
The Asymptotic Sig value is 0.000, since it is
lesser than 0.05, we reject the h0; therefore,
age and how customers prefer to receive
promotions and coupons from Molbak’s
(Newspaper) are associated.
However, looking at the frequency table, one
can see that most people no matter the age
instead of 85+ age group not like to receive
promotions and coupons from Molbak’s from
newspaper.
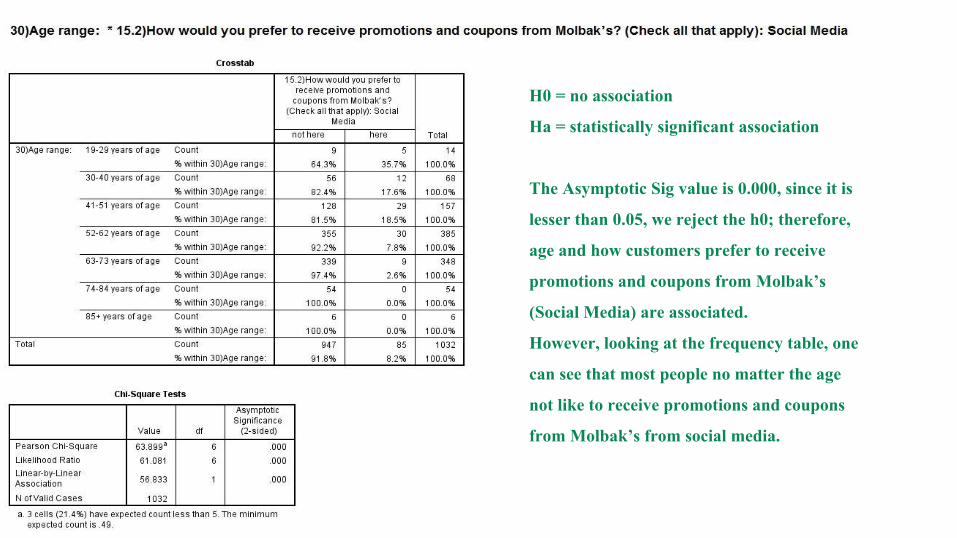
H0 = no association
Ha = statistically significant association
The Asymptotic Sig value is 0.000, since it is
lesser than 0.05, we reject the h0; therefore,
age and how customers prefer to receive
promotions and coupons from Molbak’s
(Social Media) are associated.
However, looking at the frequency table, one
can see that most people no matter the age
not like to receive promotions and coupons
from Molbak’s from social media.

H0 = no association
Ha = statistically significant association
The Asymptotic Sig value is 0.000, since it is
lesser than 0.05, we fail to reject the h0;
therefore, age and how customers prefer to
receive promotions and coupons from Molbak’s
(Mobile App) are associated.
However, looking at the frequency table, one can
see that most people no matter the ae not like to
receive promotions and coupons from Molbak’s
from text mobile app.

Thank you !
Questions ?