Embed Size (px)
Citation preview

ISEI5, Santa Barbara, Dec. 4-6, 2006
Visual Exploration of Alternative Taxonomies through Concepts
Martin Graham & Jessie KennedyNapier University, Edinburgh, UK
Laura DowneyLTER, University of New Mexico, USA
Taxonomic difficulties
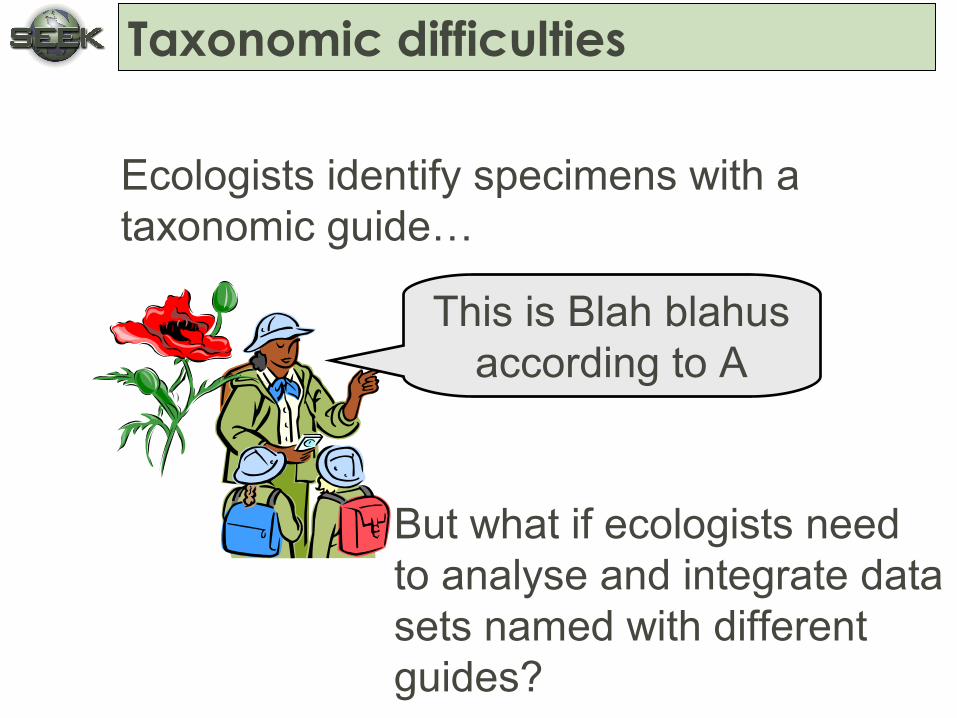
This is Blah blahus according to A
Ecologists identify specimens with a taxonomic guide…
But what if ecologists need to analyse and integrate data sets named with different guides?
Integrating data sets by names may cause errors due to different taxonomists giving different definitions to the same names
One solution is to use concepts* and the relationships defined between them by taxonomic experts to allow integration of data sets*(c.f. Monday’s talk by Kennedy)
Taxonomic difficulties

Concepts are more accurate…
Blah Blahus
Blah Namus
Blah
Family
Gah Blahus
Gah
Blah Extrus
Blah Namus
Blah
Family
Gah Blahus
Gah
Blah Blahus
Blah Namus
Blah
Family
Gah Blahus
Gah
Blah Blahus
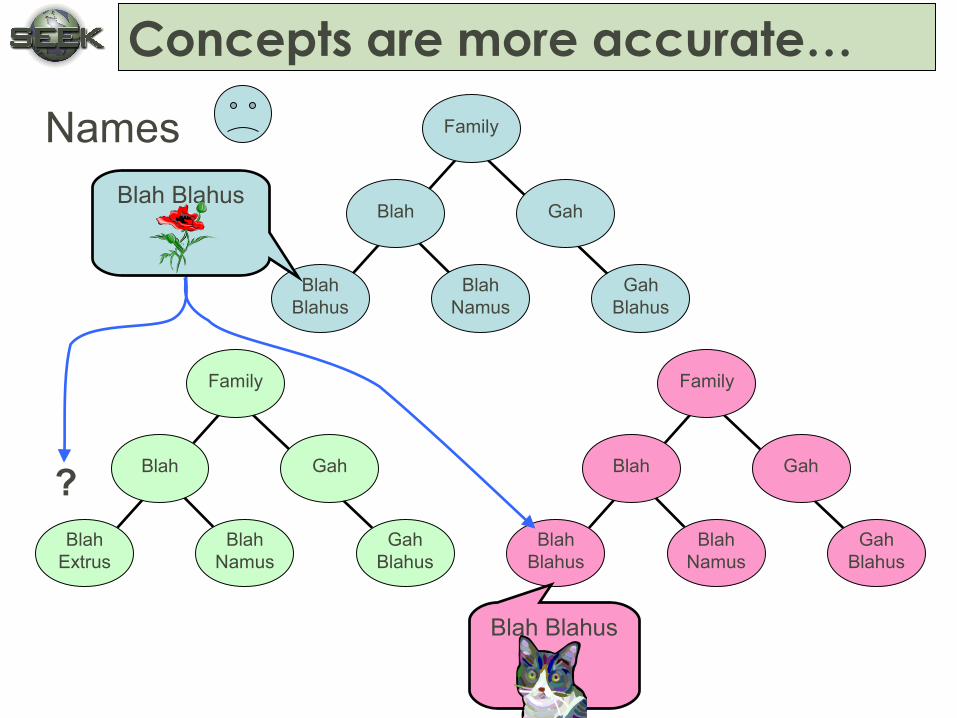
Concepts are more accurate…
Names
Blah Blahus
Blah Namus
Blah
Family
Gah Blahus
Gah
Blah Extrus
Blah Namus
Blah
Family
Gah Blahus
Gah
Blah Blahus
Blah Namus
Blah
Family
Gah Blahus
Gah
Blah Blahus
?
Blah Blahus

Concepts are more accurate…
Concepts
Blah Blahus
Blah Namus
Blah
Family
Gah Blahus
Gah
Blah Extrus
Blah Namus
Blah
Family
Gah Blahus
Gah
Blah Blahus
Blah Namus
Blah
Family
Gah Blahus
Gah
Gah BlahusBlah Namus
Blah Blahus
Blah Namus
Includes according to Jones
Includes according to Jones
Congruent according to Smith

Visualisation
• Need to show concept relationships
• A solution: Information visualisation
• Display information intuitively
• Used when information has no physical origin– Complement to scientific visualisation where data
is rooted in physical measurements– Taxonomies are usually represented using a
hierarchical format
• Not just pretty pictures, also detailed interaction with displayed data sets

Our Visualisation

Concept interaction
• Lines are used for concept relationships as relations are not 1:1. There may be several related concepts per taxonomy.

Concept interaction
• Line colouring indicates type of relationship…– Blue = everything in this concept matches...– White = something in this concept matches…
– Thus a blue-blue line is a congruent match (everything matches everything)
– A blue-white line means everything in a concept matches something in another concept (an includes relationship)
Concept interaction
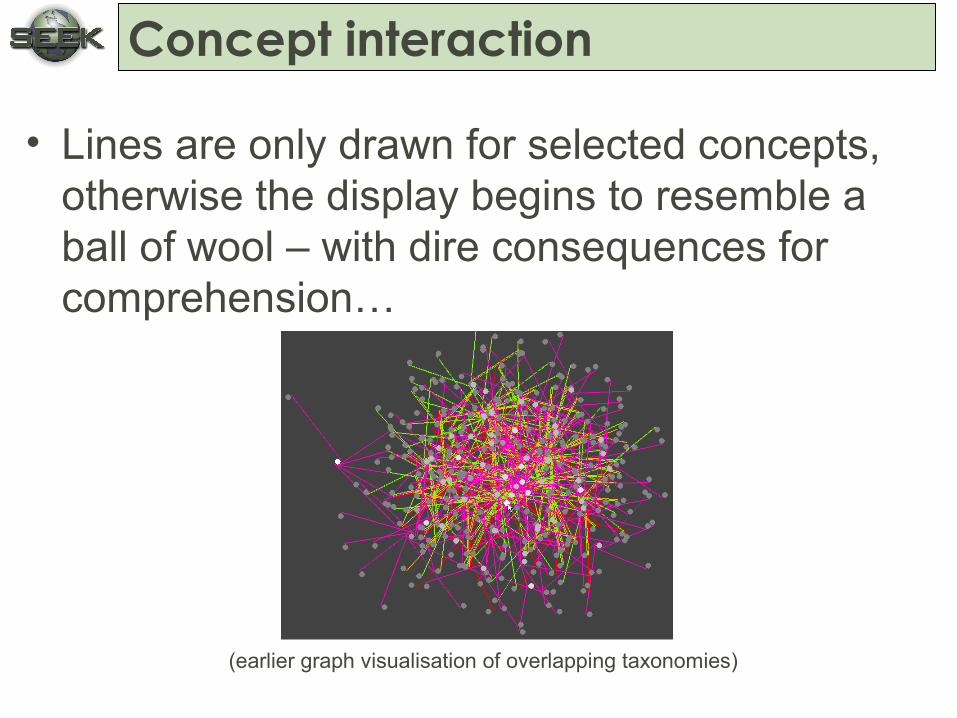
• Lines are only drawn for selected concepts, otherwise the display begins to resemble a ball of wool – with dire consequences for comprehension…
(earlier graph visualisation of overlapping taxonomies)

Example – Ranunculus texensis
Deducing relationships
• Conclusions can be drawn from following relationships as long as the overall relationship makes logical sense
• This means that a taxonomy does not need concept relationships mapped to all other possibly related taxonomies– Relationships in some cases can be deduced via
intermediate taxonomies

Feedback
• Feedback from demonstrations with 4 sets of potential users– Observers composed of Taxonomists, Ecologists,
Publishers, Collection Managers…– Taxonomists/Ecologists most keen, see scope for
concepts– Produced list of changes / requirements for tool
(some of which have been incorporated already)• Geography data
• Filter relations by type
Conclusion
• Concept data is more accurate than names for integrating ecological data sets
• A graphical tool to display and explore these relationships could therefore be beneficial
• Feedback from observers so far is generally positive, but especially for conveying concept relationship data
• Still looking for feedback - volunteers for demos or user testing welcome
m.graham @ napier.ac.uk