Embed Size (px)
Citation preview

INTRODUCTIONChapter 1

- (singular sense) statistics is a science that deals with techniques for collecting, presenting, analyzing, and drawing conclusions from data.
- (plural sense) numerical descriptions by which we enhance the understanding of data.
1.1 What is Statistics?

Philippines in Figures
Population(August 2007)
88.57M
Projected Population (2010) 94.01M
Inflation Rate (October 2011) 5.2%
Balance of Trade (August 2011)
$-804M
Exports (August 2011) $4.053B
Imports (August 2011) $4.926B
Unemployment (July 2011) 7.1%
Underemployment (July 2011)
19.1%s Office
Simple Literacy (2000) 92.3%
Functional Literacy (2008) 86.4%
Average Family Income (2009)
P206,000
GNP (Q4 2010) P2,760.1B
GDP (Q4 2010) P2,421.9B
Source: National Statistic

Statistics plays a vital role in almost all fields Economics Agriculture Market Research Engineering Education Computer Science Biology Chemistry Physics Veterinary Medicine Psychology
1.2 Role of Statistics

Variables- Any characteristic that can take on different
values for different individuals as far as the group is concerned.
Example: age, sex, height, weight, degree program
Constant- Any characteristic that is of the same for
every member of the group as far as the group is concerned
1.3 Variables

Quantitative (Numerical) Variable- A variable that quantifies an element of a
population.- Example:
height, weight, age, distance
Qualitative (Categorical) Variables- A variable that categorizes or describes an
element of a population.- Example:
Gender, Degree Program, Civil Status
1.3 Variables

Continuous Variable- can take on an infinite number of values; A
variable that can assume an uncountable number of values; can assume any value along a line interval, including every possible value between any two values;associated with measurement
Ex: height, weight, length of time to finish an
exam, temperature
1.3 Variables
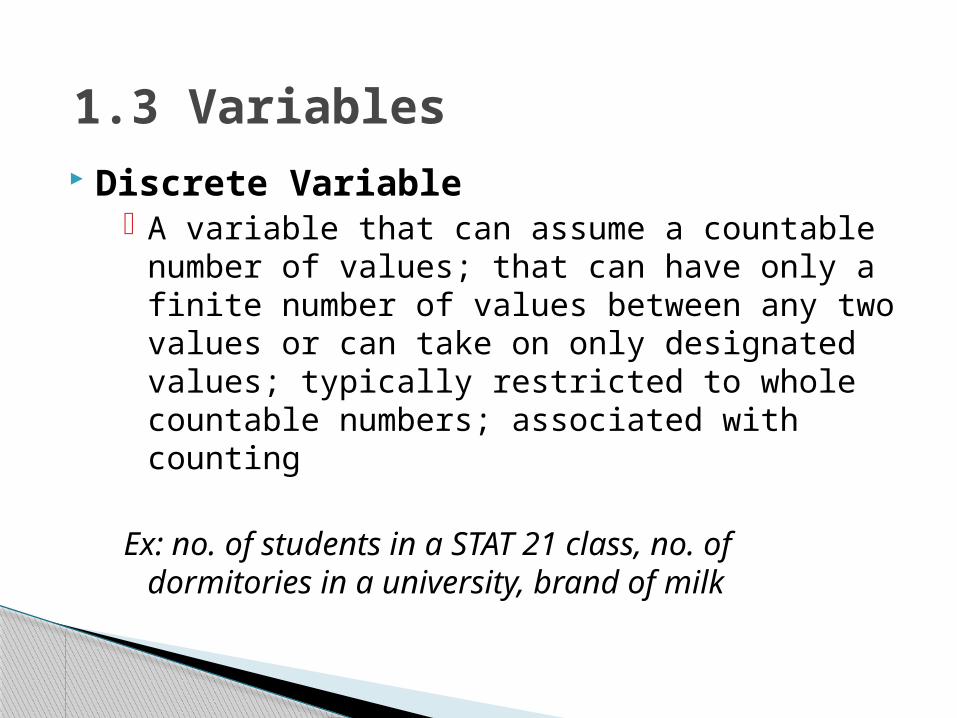
Discrete Variable- A variable that can assume a countable
number of values; that can have only a finite number of values between any two values or can take on only designated values; typically restricted to whole countable numbers; associated with counting
Ex: no. of students in a STAT 21 class, no. of dormitories in a university, brand of milk
1.3 Variables

1. Nominal Scale- classifies different objects into categories based upon
some defined characteristics.Data categories are mutually exclusive (an object can
belong to only one category).Data categories have no logical order.
Example: Sex, Degree Program, Religion
2. Ordinal Scale- Classifies different objects into order (rank)
Data categories are mutually exclusive.Data categories have some logical order.Data categories are scaled according to the amount
of the particular characteristic they possess.
Example: Job Position, Military Rank, Grading System
1.4 Scales of Measurement

3. Interval Scale (Equal Unit Scale)Data categories are mutually exclusive.Data categories have a logical order.Data categories are scaled according to the amount
of the characteristic they possess.Equal differences in the characteristic are
represented by equal differences in the numbers assigned to the categories.
The point zero is just another point on the scale.
Example: Temperature, IQ, GPA, Achievement Test Score
1.4 Scales of Measurement

4. RatioData categories are mutually exclusive.Data categories have a logical order.Data categories are scaled according to the amount
of the characteristic they possess.Equal differences in the characteristic are
represented by equal differences in the numbers assigned to the categories.
The point zero reflects an absence of the characteristic.
Example: Height, Weight, Area, Length
1.4 Scales of Measurement

1. Classify the following variables asqualitative or quantitative
a. Choice of diet (vegetarian, nonvegetarian)b. Time spent in browsing the web last weekc. Ownership of laptop (yes, no)d. Educational attainment (elem grad, HS grad,
college grad)e. Distance from boarding house to university
gymf. Opinion on the verdict on CJ Corona (approve,
undecided, disapprove)
Exercise

2. Classify the following variables according to scale of measurement
a. Choice of diet (vegetarian, nonvegetarian)b. Time spent in browsing the web last weekc. Ownership of laptop (yes, no)d. Educational attainment (elem grad, HS grad,
college, grad)e. Educational attainment (defined as the number of
years in schooling)f. Distance from boarding house to university gymg. Attitude towards RH Bill (favor, neutral, oppose)
Exercise

Population- includes all members of some defined groupExample: All the residents of Baybay
All the VSU students for SY 2013-2014
Sample- a subset of a population
Parameter: Descriptive measure of population
Ex: mean (μ), standard deviation (σ)
Statistic: Descriptive measure of sample
Ex: mean ( ), standard deviation (s)
1.5 Populations and Samples
x

Sampling is the process of selecting a small number of elements from a larger defined target group of elements such that the information gathered from the small group will allow judgments to be made about the larger groups; -the process of selecting a number of individuals for a study in such a way that the individuals represent the larger group from which they were selected.
Why sample?it is not always feasible to gather information on all
members of a population.
1.6 Basic Sampling Techniques
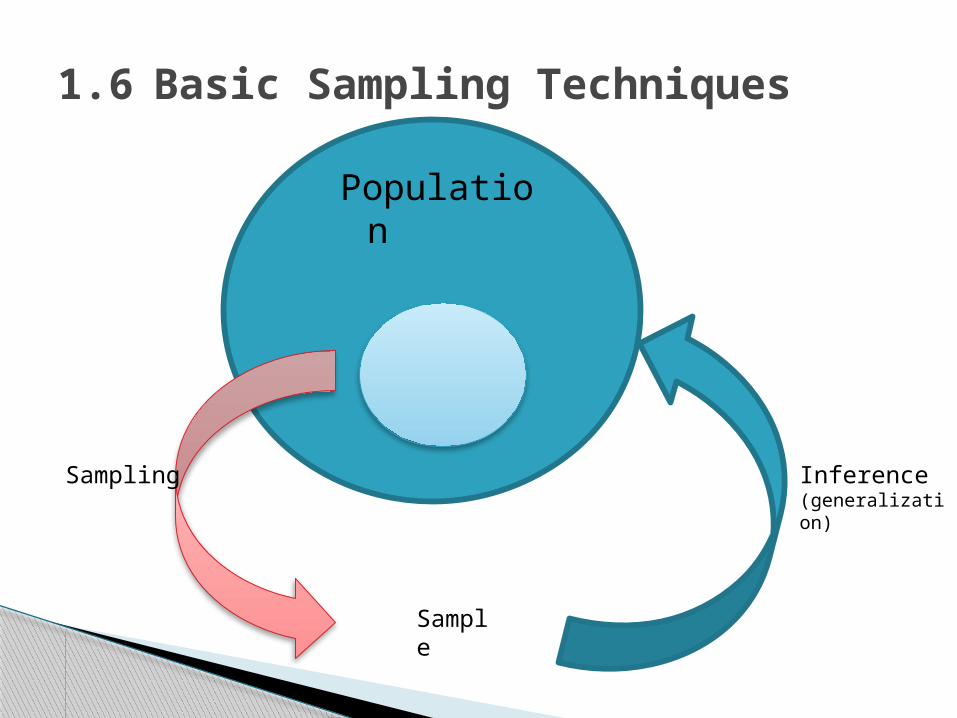
Population
1.6 Basic Sampling Techniques
Sample
Sampling Inference(generalization)

Probability samplingall elements in the population has a known chance of being included in the sample
Ex: Simple random sampling, systematic sampling, cluster sampling, stratified sampling
Non-probability samplingelements in the sample are selected on the basis of their availability or based on the
researcher’s judgment
Ex: convenience sampling, quota sampling
1.6 Basic Sampling Techniques
Simple Random Sampling Each element in the population has a known
and equal probability of selection.Each possible sample of a given size (n) has a
known and equal probability of being the sample actually selected.
This implies that every element is selected independently of every other element.
Maybe done with replacement or without replacement.
1.6 Basic Sampling Techniques

Systematic Sampling The sample is chosen by selecting a random
starting point and then picking every k element in succession from the sampling frame.
The sampling interval, k, is determined by dividing the population size N by the sample size n and rounding to the nearest integer.
When the ordering of the elements is related to the characteristic of interest, systematic sampling increases the representativeness of the sample.
If the ordering of the elements produces a cyclical pattern, systematic sampling may decrease the representativeness of the sample.
1.6 Basic Sampling Techniques

Cluster SamplingThe target population is first divided into mutually
exclusive and collectively exhaustive subpopulations, or clusters.
Then a random sample of clusters is selected, based on a probability sampling technique such as SRS.
For each selected cluster, either all the elements are included in the sample (one-stage) or a sample of elements is drawn probabilistically (two-stage).
Elements within a cluster should be as heterogeneous as possible, but clusters themselves should be as homogeneous as possible. Ideally, each cluster should be a small-scale representation of the population.
1.6 Basic Sampling Techniques

Stratified SamplingThe elements within a stratum should be as
homogeneous as possible, but the elements in different strata should be as heterogeneous as possible.
The stratification variables should also be closely related to the characteristic of interest.
Finally, the variables should decrease the cost of the stratification process by being easy to measure and apply.
In proportionate stratified sampling, the size of the sample drawn from each stratum is proportionate to the relative size of that stratum in the total population.
1.6 Basic Sampling Techniques

Descriptive StatisticsUse of numerical information to summarize, simplify,
and present data.Organize and summarize data for clear presentation
and easy interpretationComputation of measures of location and variationConstruction of tables and graphs
Inferential statistics techniques that use sample data to make general
statements about a population making decisions and drawing conclusions about populations
allows meaningful generalizations only if the subjects in the sample are representative of the population
Estimation and hypotheses testing
1.7 Descriptive Statistics and Inferential Statistics

Classify the following statements either descriptive or inferential in nature.
1. As of July 2011 the unemployment rate of the Philippines
is at 7.1%.2. Students with good mathematical background are
expected to perform well in STAT 21.3. A survey was conducted using a random sample of 2000
respondents. One of the questions in the survey is about the attitude of the respondents on the RH bill.
a. Of the 2000 respondents, 78% are opposed and 20% are in favor. The rest are undecided.
b. Majority of the Filipinos are in favor of the RH bill.
1.7 Descriptive Statistics and Inferential Statistics

1.8: The Summation Notation
N
iNi XXXX
121 ...
where: i is the index of the summation Xi is the summand 1 is the lower limit of the summation N is the upper limit of the summation.
-The Greek letter sigma, or Σ, is used to stand for summation-The expression ΣX means "add all the scores for variable X." -- Formally, if there are N observations on X represented by X1, X2, ..., XN

Example:
)1(
)( 22
nn
XXn ii
Consider the scores on the first quiz of a small class.
6, 7, 7, 7, 8, 8, 8, 9, 10
Compute:
1)
2)
3)
n
iiX
3
n
Xn
ii
1

Rules on summation1. When there are two variables X and Y, ΣX
indicates the sum of the X’s, and ΣY refers to the sum of the Y’s.
i X Y
1 2 5
2 6 6
3 4 -3
4 10 11
5 12 10
6 3 -9
ΣX=37 ΣY=20
1.8: The Summation Notation

2. When two variables (X and Y) are multiplied together, the product is represented by the expression XY. The expression ΣXY means "sum the products of X and Y."
1.8: The Summation Notation
i X Y XY
123
234
413
83
12
-X = 9 -Y = 8 -XY = 23

3. The squared value of a score is represented by the symbol X2. The expression ΣX2 means "sum of the squared scores."
1.8: The Summation Notation
i X X2
1234
3142
91164
-X = 10 -X2 = 30

4. When two variables (X and Y) are added together, the sum is represented by the expression X + Y. The expression Σ(X + Y) means "sum the sums of X and Y." This is equivalent to the expression ΣX + ΣY.
1.8: The Summation Notation
i X Y X + Y
123
234
413
647
-X = 9 -Y = 8 -(X+Y) = 17

5. When a constant value, C, is added to every score, it is necessary to use parentheses to represent the sum of these new scores, Σ(X + C).
C=4
1.8: The Summation Notation
i X X + 4
123
146
58
10
-(X+4) = 23

6. If a constant value, C, is multiplied to every score, the sum is represented by the expression ΣCX.
C=2
1.8: The Summation Notation
I X 2X
123
135
2610
-X = 9 -2X = 18

7. If a constant value, C, is to be added n times, the expression is and this is just equal to NC.
Example: (C = 4, N = 10)
40)10(44
44444444444
10
1
10
1
i
i
1.8: The Summation Notation

8. If a and b are constants, then
Example: (a = 5, b = 10)
1.8: The Summation Notation
N
ii
N
i
N
iiii YbXabYaX
11 1
i X Y 5X 10Y 5X + 10Y
123
234
413
101520
401030
502550
-X = 9 Y = 8 -(5X+10Y) = 125


![Chapter 1: Getting Started with Alteryx · Chapter 1 [ 42 ] Chapter 4: Writing Fast and Accurate. Chapter 1 [ 43 ] Chapter 1 [ 44 ]](https://img.dokumen.tips/doc/110x75/5e903c60f316447eb43c0e7a/chapter-1-getting-started-with-alteryx-chapter-1-42-chapter-4-writing-fast.jpg)


![Chapter 1: Qlik Sense Self-Service Model€¦ · Qlik Sense. Graphics Chapter 1 [ 4 ] Graphics Chapter 1 [ 5 ] Graphics Chapter 1 [ 6 ] Graphics Chapter 1 [ 7 ] Chapter 3: Security](https://img.dokumen.tips/doc/110x75/603a754026637d7e176f5238/chapter-1-qlik-sense-self-service-model-qlik-sense-graphics-chapter-1-4-graphics.jpg)