Embed Size (px)
Citation preview

WIK-Consult GmbH
The Value of Network Neutrality to European Consumers
A study commissioned by BEREC

1
WIK-Consult GmbH
Imprint
April 2015 A study commissioned by the Body of European Regulators for Electronic Communications (BEREC)
Contact: BEREC Zigfrīda Annas Meierovica bulvāris № 14, 2nd floor LV-1050 Rīga Republic of Latvia berec(at)berec.europa.eu Tel: +371 66 117 590 The study was conducted by WIK-Consult, Deloitte and YouGov
Authors: Dr René Arnold [project manager] r.arnold(at)wik-consult.com Tel: +49 2224 92 25 25 WIK-Consult: Dr Martin Waldburger Deloitte: Valentina Cilli
Sebastiaan van der Peijl Patrick Wauters
YouGov: Bastian Morasch
Frieder Schmid Dr Anna Schneider
Contact: WIK-Consult GmbH Rhöndorfer Str. 68 53604 Bad Honnef Germany info(at)wik-consult.com Tel: +49 2224 9225 0 Fax: +49 2224 9225 63 Acknowledgements: The authors of this study would like to thank BEREC and in particular the Ecodem drafters team for their most helpful and constructive comments throughout the whole project. We would like to express our gratefulness to Ben Wallis, who has served as the project manager at BEREC for this project. He has without doubt done an incredible job in negotiating the various positions and managing the project from start to finish. Furthermore, we would like to thank Tom Wicken, who supported the proofreading and writing up of this summary report. From our side, we would like to thank our assistants Johanna Bott, Luise Schmidt and Serpil Taş for supporting us in the layout process of this document. Furthermore, we would like to acknowledge the valuable feedback from our expert reviewers Sophie Boerman, Guillermo Beltrà and Ellen Wauters. We are particularly grateful to Natali Helberger, who served as our external reviewer throughout the whole project. Picture credits: jackfrog (cover), contrastwerkstatt (pp. 9, 13), Petair (pp. 9, 27), Nejron Photo (pp. 9, 61), shock (p. 9) – fotolia.com
2
WIK-Consult GmbH
What is the role of the Internet in consumers’
lives?
The importance of the Internet to consumers is
clearly reflected in their attitude that equal and
unrestricted access to the Internet is a human
right. Their freedom online is most important to
consumers. Therefore, it is not surprising that one
of the statements that received the highest levels
of agreement in the survey was “Everybody should
have the right to receive all the content and
applications that are offered online”. Also, it
should be noted that despite their awareness of
potential dangers on the web, consumers’
attitudes about the Internet were overwhelmingly
positive. Only a few can imagine living without it.
Are consumers aware of network neutrality
and traffic management practices?
If one considers only consumers’ awareness of the
two terms “network neutrality” and “traffic
management”, the result is obvious and easy to
foresee. Awareness of these terms among the
general population of Internet users is minute. In
fact, most people have very little knowledge about
how the Internet works in the first place which in
turn impedes their understanding and
conceptualisation of how data traffic might be
managed in any way. In this respect, our study
concurs with other studies that have explored
consumers’ awareness of these specific terms.
However, our results highlight that consumers’
awareness of network neutrality cannot be
captured by solely examining their understanding
of the term. As their awareness of the issue
depends on multiple dimensions, it has to be
approached as a topic embedded in their view on
the Internet and the role the Internet plays in their
lives. Our results indicate that consumers care very
little for the technicalities of data transport and
have a very limited idea of the role that Internet
Service Providers (ISPs) fulfil. What they care
about, however, is their own quality of experience,
commonly thought of as unrestricted, high-quality
and reliable access to the content and applications
they want to seek out online. Thus, consumers’
awareness of network neutrality is not tied to
traffic management practices per se; instead, it is
tied to their immediate experience of traffic
management’s effects.
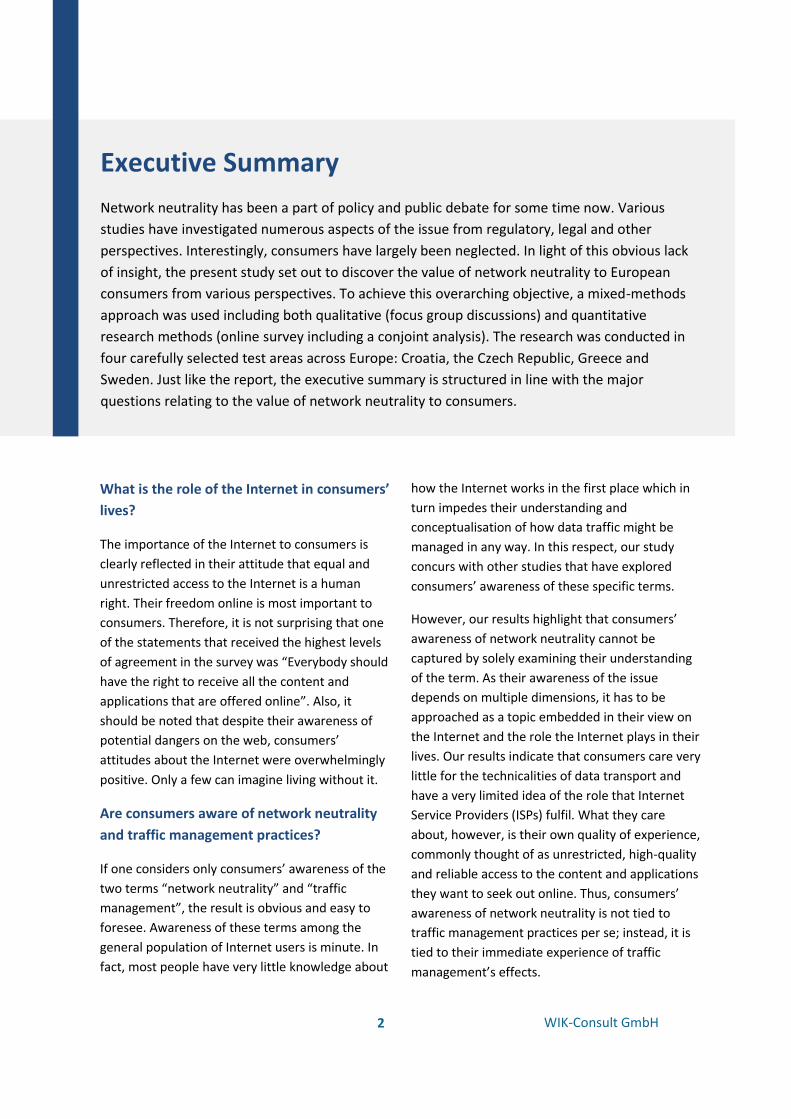
Executive Summary
Network neutrality has been a part of policy and public debate for some time now. Various
studies have investigated numerous aspects of the issue from regulatory, legal and other
perspectives. Interestingly, consumers have largely been neglected. In light of this obvious lack
of insight, the present study set out to discover the value of network neutrality to European
consumers from various perspectives. To achieve this overarching objective, a mixed-methods
approach was used including both qualitative (focus group discussions) and quantitative
research methods (online survey including a conjoint analysis). The research was conducted in
four carefully selected test areas across Europe: Croatia, the Czech Republic, Greece and
Sweden. Just like the report, the executive summary is structured in line with the major
questions relating to the value of network neutrality to consumers.
3
WIK-Consult GmbH
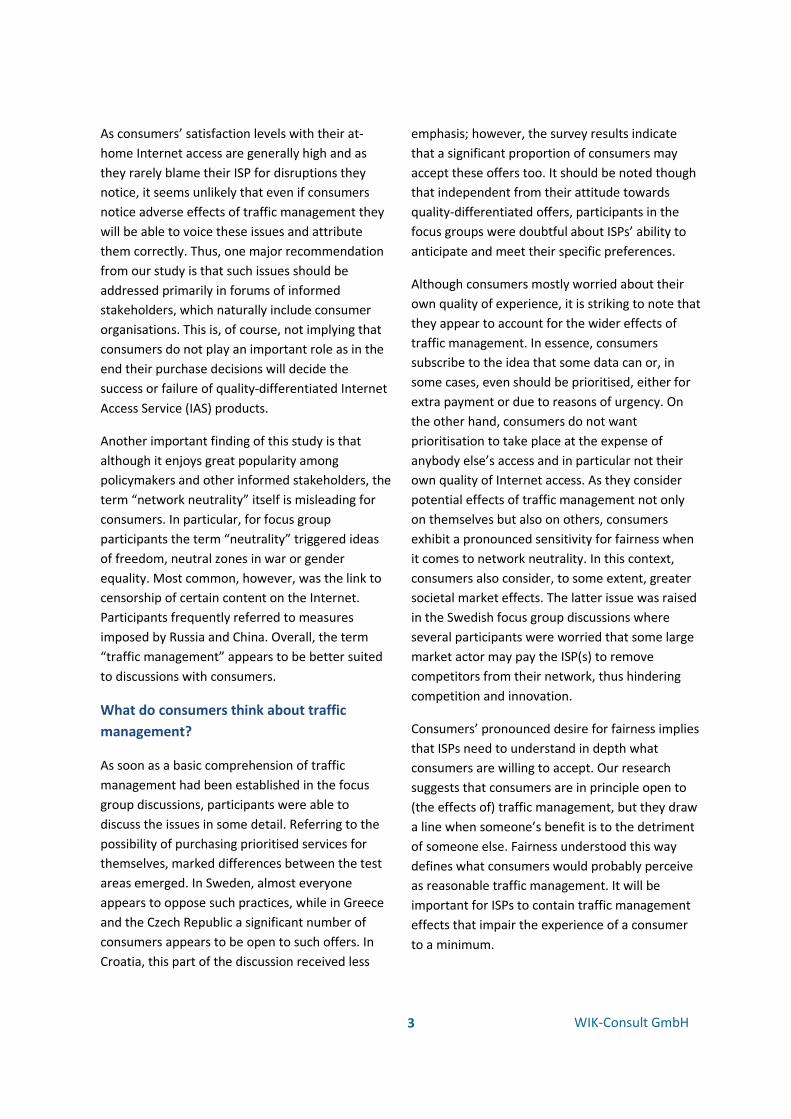
As consumers’ satisfaction levels with their at-
home Internet access are generally high and as
they rarely blame their ISP for disruptions they
notice, it seems unlikely that even if consumers
notice adverse effects of traffic management they
will be able to voice these issues and attribute
them correctly. Thus, one major recommendation
from our study is that such issues should be
addressed primarily in forums of informed
stakeholders, which naturally include consumer
organisations. This is, of course, not implying that
consumers do not play an important role as in the
end their purchase decisions will decide the
success or failure of quality-differentiated Internet
Access Service (IAS) products.
Another important finding of this study is that
although it enjoys great popularity among
policymakers and other informed stakeholders, the
term “network neutrality” itself is misleading for
consumers. In particular, for focus group
participants the term “neutrality” triggered ideas
of freedom, neutral zones in war or gender
equality. Most common, however, was the link to
censorship of certain content on the Internet.
Participants frequently referred to measures
imposed by Russia and China. Overall, the term
“traffic management” appears to be better suited
to discussions with consumers.
What do consumers think about traffic
management?
As soon as a basic comprehension of traffic
management had been established in the focus
group discussions, participants were able to
discuss the issues in some detail. Referring to the
possibility of purchasing prioritised services for
themselves, marked differences between the test
areas emerged. In Sweden, almost everyone
appears to oppose such practices, while in Greece
and the Czech Republic a significant number of
consumers appears to be open to such offers. In
Croatia, this part of the discussion received less
emphasis; however, the survey results indicate
that a significant proportion of consumers may
accept these offers too. It should be noted though
that independent from their attitude towards
quality-differentiated offers, participants in the
focus groups were doubtful about ISPs’ ability to
anticipate and meet their specific preferences.
Although consumers mostly worried about their
own quality of experience, it is striking to note that
they appear to account for the wider effects of
traffic management. In essence, consumers
subscribe to the idea that some data can or, in
some cases, even should be prioritised, either for
extra payment or due to reasons of urgency. On
the other hand, consumers do not want
prioritisation to take place at the expense of
anybody else’s access and in particular not their
own quality of Internet access. As they consider
potential effects of traffic management not only
on themselves but also on others, consumers
exhibit a pronounced sensitivity for fairness when
it comes to network neutrality. In this context,
consumers also consider, to some extent, greater
societal market effects. The latter issue was raised
in the Swedish focus group discussions where
several participants were worried that some large
market actor may pay the ISP(s) to remove
competitors from their network, thus hindering
competition and innovation.
Consumers’ pronounced desire for fairness implies
that ISPs need to understand in depth what
consumers are willing to accept. Our research
suggests that consumers are in principle open to
(the effects of) traffic management, but they draw
a line when someone’s benefit is to the detriment
of someone else. Fairness understood this way
defines what consumers would probably perceive
as reasonable traffic management. It will be
important for ISPs to contain traffic management
effects that impair the experience of a consumer
to a minimum.

4
WIK-Consult GmbH
The resulting key questions are of course just how
sensitive consumers really are to violations of what
they consider fair, whether they would actually
attribute the reason for a violation to their ISP’s
behaviour, and if they translate any dissatisfaction
into action (for instance, switch to another
provider). The study of these questions deserves
further attention from research as the respective
insights may help define consumer-driven, clear-
cut boundaries between reasonable and
unreasonable traffic management.
Would consumers care about traffic
management in their purchase decisions?
How consumers’ attitudes towards network
neutrality are reflected in their purchase criteria
was tested in a conjoint analysis (ACA). Previous
studies employing similar approaches exhibit some
shortcomings that this study overcomes by testing
a broad range of IAS product attributes and by
building on insights from the preceding focus
group discussions in order to select and phrase the
network neutrality-related attributes for the
conjoint analysis in a way that actually resonates
with respondents.
The conjoint analysis tested ten product attributes
for IAS, out of which five referred to typical
product attributes, such as price or download
speed. The remaining five product attributes
revolved around applications that may or may not
be affected by deviations from network neutrality,
such as prioritisation or throttling.
With regard to the product attributes that are
relevant to consumers’ purchase decisions,
network neutrality-related attributes scored
relatively high. This result deviates from previous
studies, which tended to find network neutrality-
related attributes to be of less importance to
consumers. Download speed, data caps and video
streaming came out as the group of second most
important purchase decision criteria behind price.
Out of these three product attributes, data caps
and video streaming both relate to network
neutrality: the data caps included zero-rated
applications and the video streaming attribute
offered different levels of normal (unmanaged),
prioritised, slowed down and blocked access. It is
our assumption that the previous studies would
have found network neutrality to play a much
more prominent role had it been presented to
consumers in a way that they could easily relate to.
Can transparent information about traffic
management make a difference?
It is a widely held view that increasing
transparency about network neutrality and traffic
management practices by giving consumers (fair
and neutral) information affects consumer
behaviour. Our study is the first that tests this idea
with regard to network neutrality and consumers’
purchase choice criteria. To this end, half of the
respondents in each test area saw an information
package in the form of a short animated video that
introduced to them how the Internet works and
traffic management practices and their effects. It
was found that the test and control groups of
respondents differed markedly in their knowledge
about how the Internet works in general and traffic
management practices in particular. However,
there was almost no measurable effect on
purchase choice criteria.
This finding is very interesting in the specific
debate on network neutrality, but also bears
importance for other related fields of
policymaking. In our case, both the focus group
discussions and the survey found that there are
strong preconceptions about the nature of the
Internet and thus attitudes towards network
neutrality. As highlighted in the above, the
individual’s quality of experience and unrestricted
access to content and applications are seen as
non-negotiable by consumers. Consequently, it is
not surprising that transparency about how the

5
WIK-Consult GmbH
Internet works and the rationale behind as well as
the effects of traffic management alone had little if
any effect on consumers’ behaviour. If a noticeable
change in consumer behaviour had been our
objective for this study, we would have had to test
different (persuasive) framings for the information
package. In fact, this represents a major avenue for
future research that is relevant to policymakers,
National Regulatory Agencies (NRAs), ISPs and
content and application providers alike. Although
for different reasons, all these stakeholders ought
to be interested in understanding which persuasive
messages are likely to resonate with consumers
given their strong pre-existing attitudes towards
the issue.
What are consumers’ preferences?
To understand consumers’ preferences as regards
the product attributes of IAS, one has to analyse
the specific part-worth utilities of the individual
levels represented for each attribute. While the
results for the five commonly tested product
attributes were in line with previous studies, the
results of the network neutrality-related attributes
merit some further discussion.
The data cap attribute represents one of the two
most relevant network neutrality-related
attributes for consumers’ purchase decisions.
Generally, offers without any data caps were
clearly preferred to those that included one. This is
not surprising, given that this is the most common
type of offer found in the market for IAS at home
today. Naturally, consumers are unlikely to want
the additional concern of a data cap limiting their
at-home data consumption.
As regards zero-rating of specific applications, our
results indicate that consumers exhibit some
consciousness of their own data consumption:
zero-rated applications appear to create value to
consumers only if they are likely to reach the
overall data cap. So, zero-rating of specific
applications has almost no effect when it is offered
combined with a data cap of 50 GB. However,
zero-rating and within that in particular zero-rating
of one’s favourite video application had a
significant (positive) effect on the part-worth utility
when it was linked to a data cap of 10 GB. Again,
this finding calls for more in-depth research into
this matter. For instance, it will be interesting to
know what combination of data cap and zero-
rating may offer most value to consumers,
whether there are combinations that lead to
consumer dynamics in the market for IAS, and
whether this would have a significant impact on
competition and innovation.
The part-worth utilities for the remaining network
neutrality-related attributes also showed some
surprising results. The attributes related to the
levels of access to different Internet applications
(video streaming, VoIP, P2P, online gaming) were
featured in the questionnaire in such a way as to
not exclude one another. Consequently, the most
rational behaviour for any respondent would have
been to show a preference for prioritised service
across all four applications at the lowest price. In
this light, the consistent preference for normal
access across all applications is surprising and
merits further investigation. It should be noted
that the relative part-worth utility of normal access
was usually slightly higher than the one of
prioritised access, but significantly higher than the
one for restricted access. Blocked access was
always clearly the least preferred level.
As we can rule out fundamental methodological
issues, several other explanations seem possible. A
first potential explanation is that normal access
referring essentially to the best-effort Internet as
consumers know it in their respective country
should be understood as a must-be quality. In light
of the focus group results indicating that
unrestricted access to any content or applications
is the core characteristic of the Internet and is
often equated to network neutrality, this
explanation seems sensible. However, it fails to
6
WIK-Consult GmbH
explain why normal is consistently preferred over
prioritised access.
This aspect may be better explained by consumers’
concept of fairness as regards network neutrality,
which transpired from the focus group discussions
and has been highlighted above. More likely,
consumers at this point simply lack the knowledge
about what prioritisation actually means for their
own quality of experience given the lack of such
offer in the market. Consequently, consumers may
have quite simply opted for the most familiar
option as they were doubtful about the actual
benefit of prioritised access. This explanation is
supported by the fact that most respondents were
quite satisfied with their current IAS. Finally, it may
be argued that respondents already accounted for
the long-term effects of the prioritised level such
as less innovation or foreclosure on the Internet.
Given the small role such arguments played in the
focus group discussions and also the fact that part-
worth utilities did not differ between the test and
control groups of respondents, this explanation
seems unlikely. In sum, to answer the key
underlying question of “Do consumers actually
prefer the best-effort Internet, or do they rather
prefer the Internet they know over an Internet
they have not yet experienced?”, more research
has to be undertaken.
How do consumer characteristics influence
preferences?
Besides this in-depth analysis of preferences for
specific levels within product attributes, it was also
possible to identify four mutually exclusive
consumer segments from the preference patterns
captured in the conjoint analysis. As these four
segments were built from the choice data, it is not
surprising that they show significant differences in
their choices. However, they also shed light on
what may actually drive these differences, namely
both socio-demographic variables and attitudes
towards the Internet – or, in essence, the role of
the Internet in one’s life. These underlying
variables appear to be consistently attached to the
respective segments across test areas. This clearly
highlights that such underlying variables actually
drive choices, not the market environment.
However, the market environment is very likely to
shape the size of the respective segments in each
test area.
Are consumers inclined to switch due to
traffic management practices?
To answer this question, one first and foremost
has to keep in mind that consumers in all four test
areas exhibit little inclination to switch in general
as they are satisfied with their current IAS or see
little if any better offer. It should be noted that
Greece, probably due to the financial crisis, has
been experiencing elevated levels of switching
over recent years.
Most interesting in the context of this study,
however, is the question of whether consumers
would be inclined to switch due to their ISP
introducing quality-differentiated IAS. Although
there was a high agreement from respondents in
the survey on items that referred to exactly this
question, they should be interpreted carefully. In
fact, the agreement shows that the majority of
respondents expect people to switch providers if
two conditions are met, namely if they disagree
with the traffic management practices of their ISP,
and if they are informed that these practices take
place. Knowing that satisfaction is a key
contributor to customer loyalty and knowing that
satisfaction in all test areas is higher than average
in the EU, one would doubt that awareness about
and disagreement with certain traffic management
practices alone would give sufficient reason for
consumers to actually switch providers. Given the
importance of one’s own quality of experience,
switching due to the introduction of such services
may happen on a large scale only if consumers are
dissatisfied with their quality of experience, and
7
WIK-Consult GmbH
attribute the reason for impaired quality to their
ISP. We mentioned earlier that consumers tend
not to blame their ISP when experiencing major
disruptions and are usually not too bothered about
minor disruptions.
It should be noted that the identified consumer
segments show marked differences as regards
their propensity to switch due to traffic
management-related issues. In general, two of the
identified consumer segments, active multimedia
users and dynamic private and business users,
would be more likely to switch providers as a result
of certain traffic management practices than the
other two segments, conservative brand users and
pragmatic average users, although there are
occasional exceptions to this pattern. In Croatia,
dynamic private and business users would be the
least likely to switch if access to online gaming was
restricted, and in the Czech Republic, active
multimedia users would be the least likely to
switch if access to VoIP was restricted.
What is the monetary value of network
neutrality to consumers?
In order to further analyse the value of network
neutrality offers to consumers, the relationship
between price and the network neutrality-related
attributes was investigated. This was done by
systematically varying the price as well as the
levels of access to certain types of applications.
By simulating offers with different price points and
different levels of access to P2P, VoIP services,
video streaming and online gaming, utility scores
for these offers were calculated.
The results of the analysis can give an indication of
the monetary value that consumers attach to
different levels of the network neutrality-related
attributes tested as part of the conjoint analysis.
For instance, in Croatia, utility scores for video
streaming are slightly lower for prioritised access
than for normal access, at the same price point.
Scores for slowed down access are even lower, and
blocked access scores lowest. Thus, the option of
blocked access at 150 kuna (kn) is below the utility
level of the option of normal access at kn 240.
These findings are mirrored in the other test areas,
with only minor differences. In sum, they indicate
that consumers’ willingness to pay is significantly
reduced if the service exhibits adverse effects of
deviations from network neutrality.
Will a quality-differentiated service pay off
for ISPs?
Taken together, these insights indicate that there
is a trade-off for ISPs that intend to offer quality-
differentiated services. If they were to introduce
offers with deviations from network neutrality,
they might gain additional revenue from
consumers who purchase prioritised services, but
they are also likely to lose consumers who strictly
oppose such measures, or otherwise they would
have to give them a strong incentive to stay
through a discount on their monthly price.
Interestingly, many participants in the focus
groups, even if they were inclined to purchase
products with the prioritisation of certain services,
had severe doubts as to whether ISPs would
actually be able to provide them with a
personalised product that matched their own
individual preferences. In our survey, we
introduced only a limited number of non-neutral
attribute levels for specific applications. Contrary
to the indications from the focus groups,
respondents were able and willing to choose from
these offers. This indicates that ISPs can be
successful making standardised offers for quality-
differentiated services which are likely to resonate
at least with certain consumer segments.
What is next?
The study has explored the value of network
neutrality to consumers from numerous
perspectives and has identified many novel

8
WIK-Consult GmbH
insights into the issue. However, as it is the first comprehensive study of its kind, it is not surprising that it
raises almost as many questions as it was able to answer. More research into the consumer perceptions is
needed as we have highlighted above. Furthermore, this study emphasises the need for more consumer-
oriented insights over and above the network neutrality debate to be used in policymaking.

9
WIK-Consult GmbH
Consumers understand the Internet as a space for
information and social interaction, not as a platform for
data transport. They are not only unaware of network
neutrality, but find the term misleading.
Quality of experience is most important to consumers.
Free, unrestricted and reliable access to high quality of
content and communication is what they care about.
Network neutrality-related attributes make up around
50% of consumers’ purchase decisions. There are
different consumer segments that show distinct
purchase behaviour.
Consumers want fair play. In addition to their own
quality of experience, they care about the quality of
experience of others. Some may thus be skeptical about
quality-differentiated services.
10
WIK-Consult GmbH
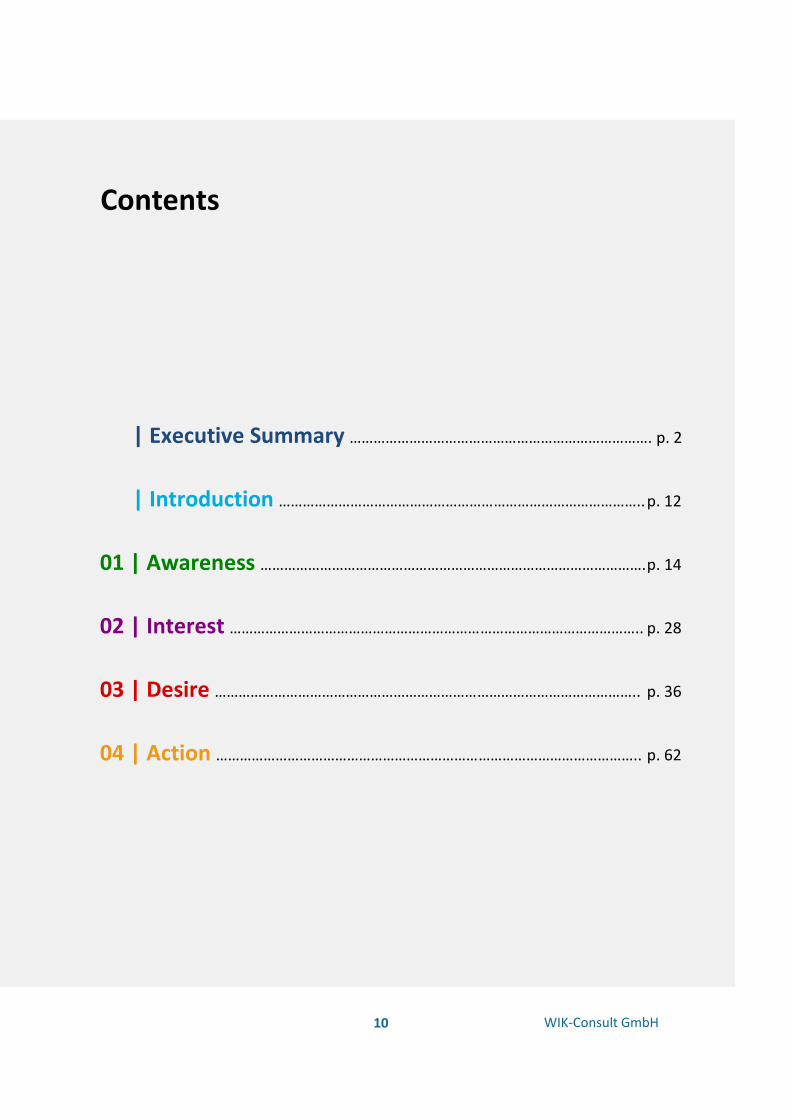
Contents
| Executive Summary …………………………………………………………………. p. 2
| Introduction ……………………………………………………………………………….. p. 12
01 | Awareness ……………………………………………………………………………………. p. 14
02 | Interest ………………………………………………………………………………………….. p. 28
03 | Desire …………………………………………………………………………………………….. p. 36
04 | Action …………………………………………………………………………………………….. p. 62

11
WIK-Consult GmbH
The qualitative and quantitative research of this study was conducted
in four carefully selected test areas.
Sweden
Czech Republic
Croatia
Greece

12
WIK-Consult GmbH
Introduction
BEREC’s1 recognition of network neutrality as a key policy priority in 2010 has led to various
related activities, for instance fact-finding on traffic management practices and an assessment of
Internet Protocol (IP) interconnection. These activities have given European regulators a solid
basis for understanding issues around network neutrality, but much more in relation to the
supply side of Internet Access Service (IAS) than the demand side. How do consumers
understand and conceptualise network neutrality? Do consumers value aspects of network
neutrality in their purchase choice for IAS offers? BEREC commissioned an extensive study to
answer these questions.
1
Body of the European Regulators of Electronic Communications, http://berec.europa.eu/.
This document is the summary report for this
study. The summary report provides a concise
overview of the major results of the research
conducted by WIK-Consult, Deloitte and YouGov
on behalf of BEREC. In addition to this report,
there is a full results report that contains all results
as well as all methodological notes in full detail.
Furthermore, the full results report contains an
annex that reproduces all relevant documents
used during the research project, such as the
discussion guide for the focus groups and the
questionnaire for the online survey in English as
well as in all four test area languages.
Whereas the full results report is structured
according to the qualitative and quantitative parts
of the research, the summary report combines the
insights gained from the focus group discussions
and the survey. The summary report is structured
according to the major perspectives that emerged
from our research related to the relevance of
network neutrality to European consumers. These
perspectives refer to (1) consumers’ awareness of
network neutrality and traffic management as
such; (2) their interest in the issue itself as well as
the (potential) effects of traffic management
practices; (3) the outcomes and IAS product
attributes they desire; and (4) consumers’ action
as manifested in their propensity to switch
providers due to (adverse) effects of deviations
from network neutrality as well as their willingness
to pay for quality-differentiated services.

13
WIK-Consult GmbH
2 Summary document published at:
http://stakeholders.ofcom.org.uk/binaries/research/broadband- research/1145655/traffic-research.pdf
The Internet means the world to consumers. It is a place where they find
information and social interaction. They are unaware of technical details
of data transport.
14
WIK-Consult GmbH
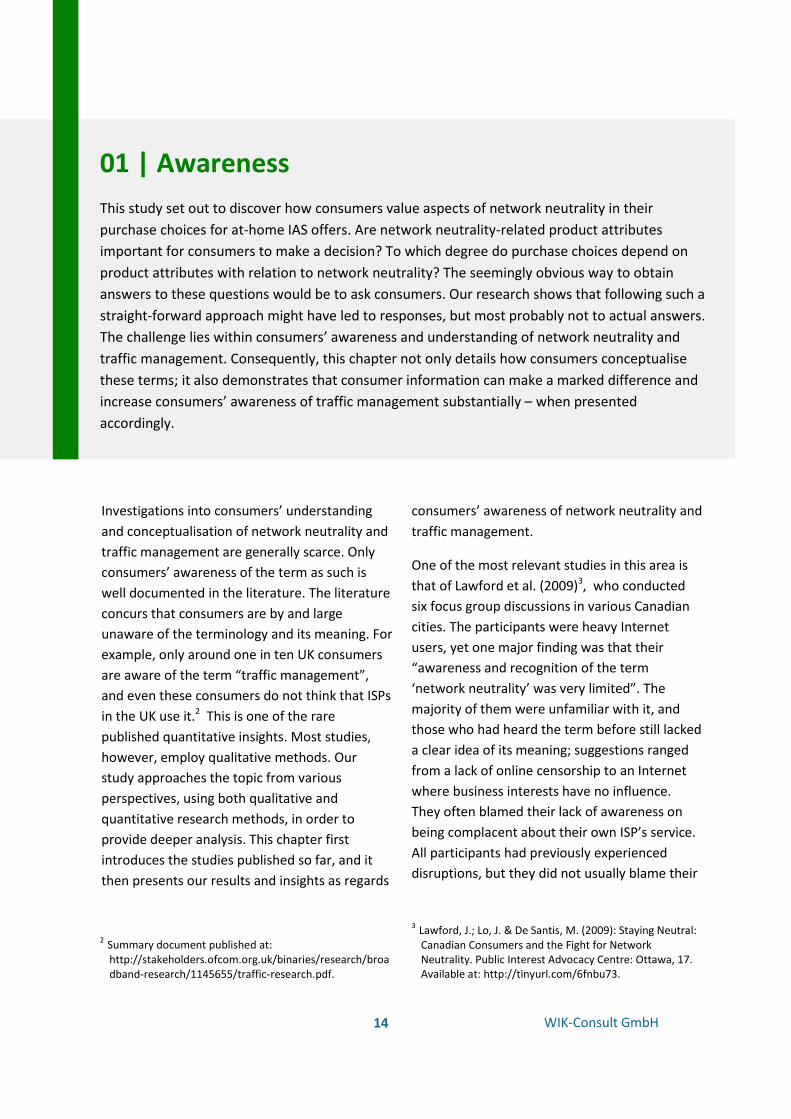
01 | Awareness
This study set out to discover how consumers value aspects of network neutrality in their
purchase choices for at-home IAS offers. Are network neutrality-related product attributes
important for consumers to make a decision? To which degree do purchase choices depend on
product attributes with relation to network neutrality? The seemingly obvious way to obtain
answers to these questions would be to ask consumers. Our research shows that following such a
straight-forward approach might have led to responses, but most probably not to actual answers.
The challenge lies within consumers’ awareness and understanding of network neutrality and
traffic management. Consequently, this chapter not only details how consumers conceptualise
these terms; it also demonstrates that consumer information can make a marked difference and
increase consumers’ awareness of traffic management substantially – when presented
accordingly.
Investigations into consumers’ understanding
and conceptualisation of network neutrality and
traffic management are generally scarce. Only
consumers’ awareness of the term as such is
well documented in the literature. The literature
concurs that consumers are by and large
unaware of the terminology and its meaning. For
example, only around one in ten UK consumers
are aware of the term “traffic management”,
and even these consumers do not think that ISPs
in the UK use it.2 This is one of the rare
published quantitative insights. Most studies,
however, employ qualitative methods. Our
study approaches the topic from various
perspectives, using both qualitative and
quantitative research methods, in order to
provide deeper analysis. This chapter first
introduces the studies published so far, and it
then presents our results and insights as regards
consumers’ awareness of network neutrality and
traffic management.
One of the most relevant studies in this area is
that of Lawford et al. (2009)3, who conducted
six focus group discussions in various Canadian
cities. The participants were heavy Internet
users, yet one major finding was that their
“awareness and recognition of the term
‘network neutrality’ was very limited”. The
majority of them were unfamiliar with it, and
those who had heard the term before still lacked
a clear idea of its meaning; suggestions ranged
from a lack of online censorship to an Internet
where business interests have no influence.
They often blamed their lack of awareness on
being complacent about their own ISP’s service.
All participants had previously experienced
disruptions, but they did not usually blame their
2 Summary document published at: http://stakeholders.ofcom.org.uk/binaries/research/broadband-research/1145655/traffic-research.pdf.
3 Lawford, J.; Lo, J. & De Santis, M. (2009): Staying Neutral: Canadian Consumers and the Fight for Network Neutrality. Public Interest Advocacy Centre: Ottawa, 17. Available at: http://tinyurl.com/6fnbu73.
15
WIK-Consult GmbH
ISP for these and instead thought the problem
lay with their own hardware and/or software, or
another server. These views can also be seen in
Kenny and Dennis (2013)4. Once participants
were made aware of network neutrality, they
showed great interest in it. Many were
concerned about what they had learned about
traffic management practices, and opposed the
idea of the unnecessary throttling or
prioritisation of certain content. Almost all of
them saw ISPs’ interest in profit as an
insufficient reason for traffic management.
Quail and Larabie (2010)5 presented similar
findings from a single focus group discussion
with communication studies students at a
Canadian university. Their participants were also
largely unaware of network neutrality, despite
the fact that they studied communications.
When provided with information about it, they
understood the concept and engaged more in
the focus group discussion than before.
Generally, they also seemed concerned about
the influence that business interests might have
on the Internet, which they thought of as a
public utility.
The present study was conducted in four
carefully selected European countries to enable
examination of various market environments
across different socioeconomic backgrounds. It
comprises both qualitative and quantitative
research, which complement each other and
enable a better interpretation of both sets of
results. This allows the study to provide an in-
depth and detailed exploration of consumers’
understanding of network neutrality and its
importance to them. Furthermore, the impact of
an educational information package was tested
in order to assess whether an improved
understanding of how traffic management works
has an effect on consumers’ perceptions and
evaluation of network neutrality.
An important insight the present study was able
to confirm is that consumers’ awareness of
network neutrality cannot be captured by solely
examining their understanding of the term.
Consumers’ awareness of network neutrality
depends on multiple dimensions. This means
that one has to approach consumers’ awareness
of network neutrality as a topic embedded in
their view on the Internet and the role the
Internet plays in their lives. In the present study,
the focus group discussions in particular were
able to shed light on these aspects.
In each group, a breadth of subjects were
covered ranging from general thoughts that
participants have about the Internet, the role it
plays in their lives and their immediate
experiences with it, to an in-depth discussion on
network neutrality.6 At the start of the
discussion about network neutrality, participants
were asked to come up with words that they
associated with the term (at first without being
given a definition of the term). It became
apparent that the term “network neutrality”
itself was a major obstacle to their correct
understanding of the concept. On the whole,
they found it challenging to find word
associations with the term and also struggled to
engage in the discussion afterwards. Being given
a definition of the term “network neutrality” did
not help participants to overcome these
4 Kenny, R. & Dennis, A. (2013): Consumer Lock-in for Fixed Broadband. Communications Chambers.
5 Quail, C. & Larabie, C. (2010): Network Neutrality: Media Discourses and Public Perception. Global Media Journal – Canadian Edition 3(1), 31–50.
6 The full discussion guide for the focus groups (in English and the respective test area languages) can be found in the Full Results Report.

16
WIK-Consult GmbH
challenges. As was the case with previous
studies, these difficulties were due to the fact
that with very few exceptions, participants were
completely unaware of the term and had
difficulty understanding its meaning and its
potential impact.
It was almost immediately clear that the word
“neutrality” in particular easily misled
participants into discussing democratic
concepts, sometimes neutral zones in war, or
even gender equality. When they tried to come
up with ideas related to the Internet, they found
it easier to approach the issue from a
perspective familiar to them, which meant
referring to the content and applications that
they themselves use the Internet to access.
Within that, the role of the ISP remained largely
unclear to them.
This points to the Internet being an experience
good (Nelson, 1970)7 for consumers, which
means that consumers’ own experiences when
using their IAS are what shape their perceptions
of its quality. It follows that their awareness of
traffic management practices is also likely to
develop through experiencing these practices
themselves. Consequently, it is important to
separate consumers’ inability to define network
neutrality from the fact that they may have
experienced the effects of traffic management.
It might be difficult for consumers to determine
whether any effect they notice originates from
traffic management or from another reason, but
what consumers most certainly are able to do is
rate an effect’s impact on the perceived quality
of Internet experience.
7 Nelson, P. (1970): Information and Consumer Behavior. The Journal of Political Economy, 311–329.
Figure 1 – Satisfaction with current ISP in test areas
More than 50 % of consumers are satisfied with their IAS.
5%
4%
6%
4%
9%
9%
8%
9%
9%
8%
11%
9%
15%
13%
18%
16%
22%
22%
25%
23%
18%
18%
17%
13%
13%
19%
9%
16%
0% 10% 20% 30% 40% 50% 60% 70% 80% 90% 100%
Croatia(N=1020)
Czech Republic (N=1032)
Greece(N=1028)
Sweden(N=1122)
0 (Very dissatisfied) 1 2 3 4 5 6 7 8 9 10 (Very satisfied)

17
WIK-Consult GmbH
In essence, experienced quality is a key factor for consumers’ satisfaction with their IAS. Therefore,
in order to understand if and how consumers might become aware of traffic management practices,
it is necessary to start by exploring consumer satisfaction with their IAS.
The results of the survey8 conducted in the four test areas show that current levels of consumer
satisfaction with ISPs are high across all the test areas, with around half of the respondents reporting
a level of satisfaction of 8/10 or above for their home Internet access, and on average less than 5%
giving a rating of 2/10 or less. Generally, respondents with a faster download speed are more
satisfied than those with a lower speed. Respondents in the Czech Republic gave the highest
Figure 2 – Experience of disruptions: losing home connection entirely
Losing connection
entirely – I never
experienced this
Losing connection
entirely – Less than
once per week
Losing connection
entirely – About once a
week
Sweden (N=1122) 18% 45% 12%
Greece (N=1028) 22% 43% 14%
Czech Republic
(N=1032) 10% 59% 14%
Croatia (N=1020) 12% 42% 19%
8 The survey methodology used, detailed sample characteristics and the full questionnaire (in English and the respective test area languages) can be found in the Full Results Report.
18
WIK-Consult GmbH
satisfaction ratings, despite the fact that in the focus groups, participants often complained about
poor-quality services. However, they also stated that they were used to a bad-quality service and
were aware that they could purchase a better, more expensive solution, but preferred to stay with a
low-cost option; hence, their satisfaction could be a result of the low price that they are paying. The
focus group discussions also showed that the factors that contribute to a lack of satisfaction are
mostly technical problems, such as slow connections and disruptions, as well as insufficient or non-
existent support from the providers’ customer service department. In fact, good customer service
appears to be the most important driver of customer loyalty.
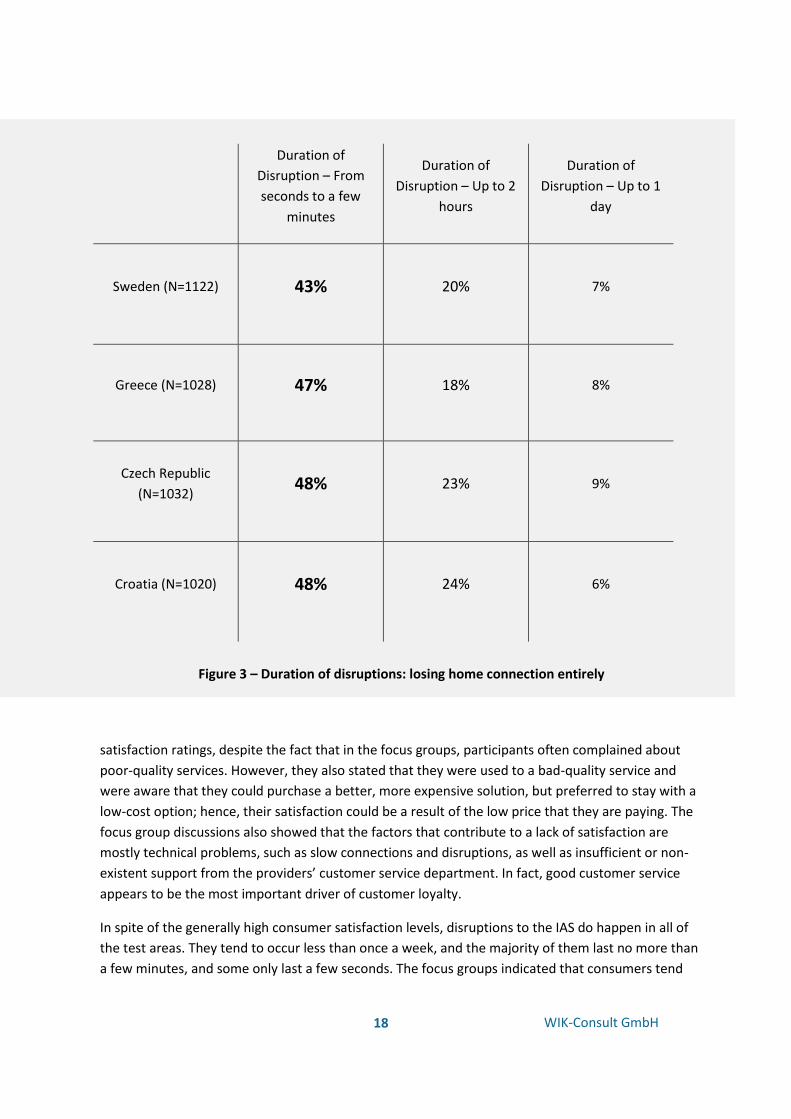
In spite of the generally high consumer satisfaction levels, disruptions to the IAS do happen in all of
the test areas. They tend to occur less than once a week, and the majority of them last no more than
a few minutes, and some only last a few seconds. The focus groups indicated that consumers tend
Figure 3 – Duration of disruptions: losing home connection entirely
Duration of
Disruption – From
seconds to a few
minutes
Duration of
Disruption – Up to 2
hours
Duration of
Disruption – Up to 1
day
Sweden (N=1122) 43% 20% 7%
Greece (N=1028) 47% 18% 8%
Czech Republic
(N=1032) 48% 23% 9%
Croatia (N=1020) 48% 24% 6%
19
WIK-Consult GmbH
not to be overly bothered by such disruptions.
Severe disruptions during which the connection
is completely lost for more than a day are rare;
between 2% (Croatia, Czech Republic and
Sweden) and 3% (Greece) of respondents have
experienced these. For such disruptions, the
focus group discussions showed that it was the
response of the ISP that had the most impact on
consumers’ overall satisfaction.
As has also been reported in other studies,
participants mostly attribute disruptions to
insufficient network capacity at peak times, or
more commonly to malfunctions of their own
equipment or servers elsewhere on the web.
They only rarely blame ISPs, and in fact are more
likely to blame them for not reacting
appropriately. It is important to note that
participants very rarely suggest traffic
management practices as a possible source of
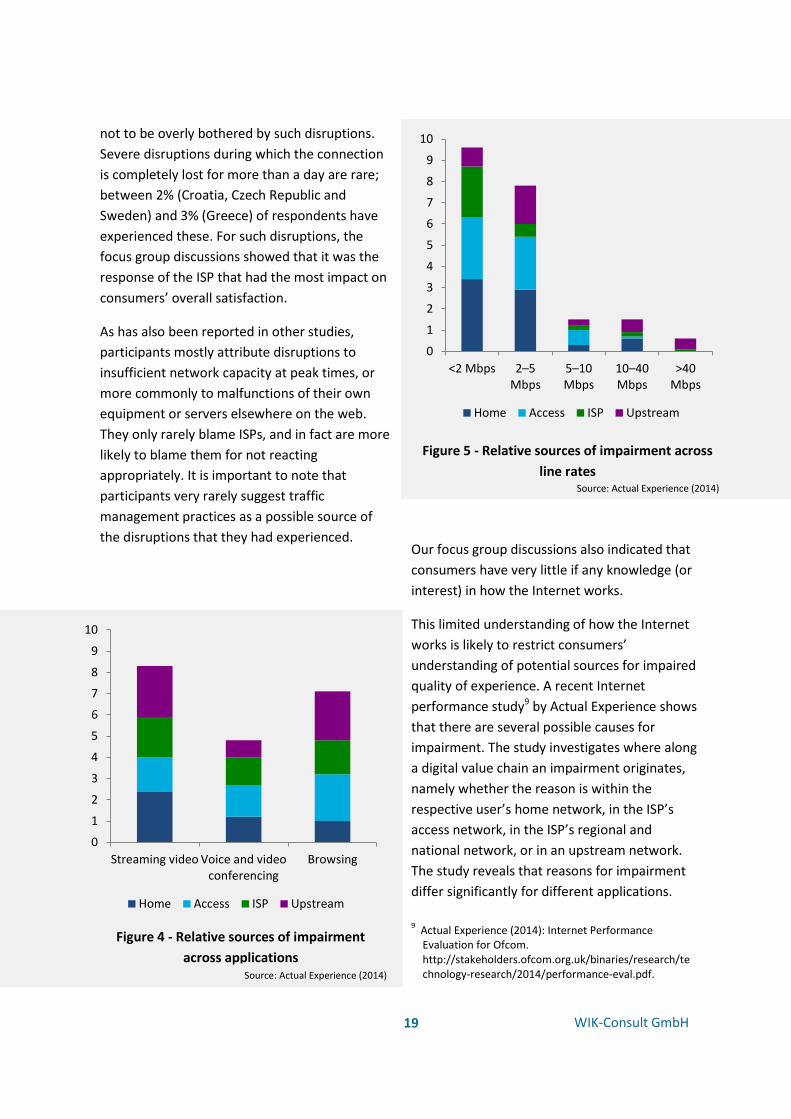
the disruptions that they had experienced. Our focus group discussions also indicated that
consumers have very little if any knowledge (or
interest) in how the Internet works.
This limited understanding of how the Internet
works is likely to restrict consumers’
understanding of potential sources for impaired
quality of experience. A recent Internet
performance study9 by Actual Experience shows
that there are several possible causes for
impairment. The study investigates where along
a digital value chain an impairment originates,
namely whether the reason is within the
respective user’s home network, in the ISP’s
access network, in the ISP’s regional and
national network, or in an upstream network.
The study reveals that reasons for impairment
differ significantly for different applications.
0
1
2
3
4
5
6
7
8
9
10
<2 Mbps 2–5 Mbps
5–10 Mbps
10–40 Mbps
>40Mbps
Home Access ISP Upstream
Figure 4 - Relative sources of impairment
across applications Source: Actual Experience (2014)
Figure 5 - Relative sources of impairment across
line rates Source: Actual Experience (2014)
9 Actual Experience (2014): Internet Performance
Evaluation for Ofcom. http://stakeholders.ofcom.org.uk/binaries/research/technology-research/2014/performance-eval.pdf.
0
1
2
3
4
5
6
7
8
9
10
Streaming video Voice and videoconferencing
Browsing
Home Access ISP Upstream

20
WIK-Consult GmbH
Network neutrality issues should be addressed
among informed stakeholders
Traffic management may affect consumers’ access to content and applications, as well as their
quality of experience. However, the focus group results show that consumers are unlikely to
attribute minor disruptions in particular, such as the slow loading of websites, a stuttering video
stream or unclear VoIP transmission, to traffic management. Instead, they will attribute such
disruptions to problems with their own devices, their own lack of skills to configure them
correctly or peak time reductions in server capacity. Severe disruptions such as loss of access to
the Internet for more than a day rarely occur at all, as reported by participants. If they occur,
participants attribute them to faulty wires, broken routers or generally bad infrastructure. The
latter attribution was particularly prevalent in Croatia and the Czech Republic. The role of the ISP
or traffic management practices hardly registers with consumers at all.
In light of these results, issues arising from the adverse effects of traffic management are
unlikely to be recognised as such by consumers or attributed to the actual cause. This renders it
unlikely that consumers will address these issues with their ISP even if they notice adverse
effects. Therefore, there is a role to play for NRAs who can detect these adverse effects and act
to resolve them when it is in consumers’ interest for them to do so. Should any network
neutrality issues occur, the task of resolving them should reside with informed stakeholders such
as NRAs, ISPs, content providers and consumer organisations.
It is important to add that this research did not find any immediate need to address specific
network neutrality issues. Neither the focus group discussions nor the survey identified
widespread occurrences of adverse effects stemming from deviations from network neutrality.
Satisfaction levels with their IASs are generally high among consumers. It should be noted that
the study did not intend to investigate such incidences objectively, for example by employing
technical measurement tools.
In the long term, consumers will nonetheless play an important role in the success of quality-
differentiated services as the purchase decision lies with them. Our results indicate that the
specific effects of introducing such services are difficult to foresee for ISPs and will require
further market research. In fact, introducing them may be a difficult trade-off for ISPs as some
consumers indicated that they would be inclined to switch if their ISP introduced services that
deviate from network neutrality.
21
WIK-Consult GmbH
The figures 4 and 5 shows two effects in this
context. First, the relative importance for a
specific source of impairment varies from one
application to another. For instance, if an
impairment occurs while streaming video or
browsing, upstream networks are more likely to
be the reason for the impairment than they are
for disruptions when using a voice application.
Second, impairments are more frequent for
video streaming and browsing than for voice.
The Actual Experience study also shows that the
relative sources for impairments vary depending
on the speed of an IAS. For instance, access
networks are hardly ever the cause of an
impairment at higher speeds, while they are
often the source for speeds up to 10 Mbps.
The results of our study clearly show that
consumers’ satisfaction is linked to their
experiences of disruptions, and their ISP’s
response to these problems. Where there has
been a lack of severe disruptions, there is a
generally high level of satisfaction. Furthermore,
the results show that consumers are likely to
incorrectly attribute the cause of at least some
of the disruptions that they experience to
factors other than their ISP, which is actually the
likely source of impairment according to data
from the Actual Experience study.
In short, consumers are not only unaware of the
term network neutrality, but they also do not
realise that traffic management could be a
possible cause of disruptions they notice in their
day-to-day usage of the Internet. Even if their
own quality of experience suffers, they are likely
to attribute the cause of these two factors to
something other than the interference of their
ISP. However, given the generally high
satisfaction and low levels of disruptions that
they experience, this is not particularly
concerning.
Nevertheless, it is relevant to explore how
consumers conceptualise network neutrality in
order to approach the overarching research
objective of finding out how they evaluate it. As
described above, participants in the focus group
discussions quickly linked the term to general
political and societal issues. When prompted to
interpret it in terms of the Internet, the topics
that came up most frequently were the absence
of online censorship and the idea of free access
to all content for everyone. Some participants in
Croatia, Greece and Sweden even thought that
only one ISP would be available, and that ideally
this provider would be state-controlled, meaning
that the Internet would be free for everyone as
it would be paid for by taxes.
Later the moderator read participants a
definition of network neutrality, and they were
then given written information about the
potential effects of deviations from it. Once the
link was made to how the Internet works, they
often thought that the term meant that all ISPs
would have to conform to the same set of rules,
and therefore would provide the same quality of
experience to every user.
Interestingly, the majority of participants in the
focus groups were convinced that network
neutrality does not exist today. Again, they
linked this fact predominantly to the censorship
of particular online content. They frequently
gave examples of certain countries where the
Internet in their opinion is not neutral, or in
other words, where it is censored in some way.
They also expressed the strong belief that search
engine ranking results and including adverts in
them is evidence that network neutrality does
not currently exist. In essence, participants by
and large had great difficulty comprehending
the term and drawing the right linkages.
Although they found the explanations generally
22
WIK-Consult GmbH
65%
78%
62%
68%
Croatia(N=1020)
Czech Republic(N=1032)
Greece(N=1028)
Sweden(N=1122)
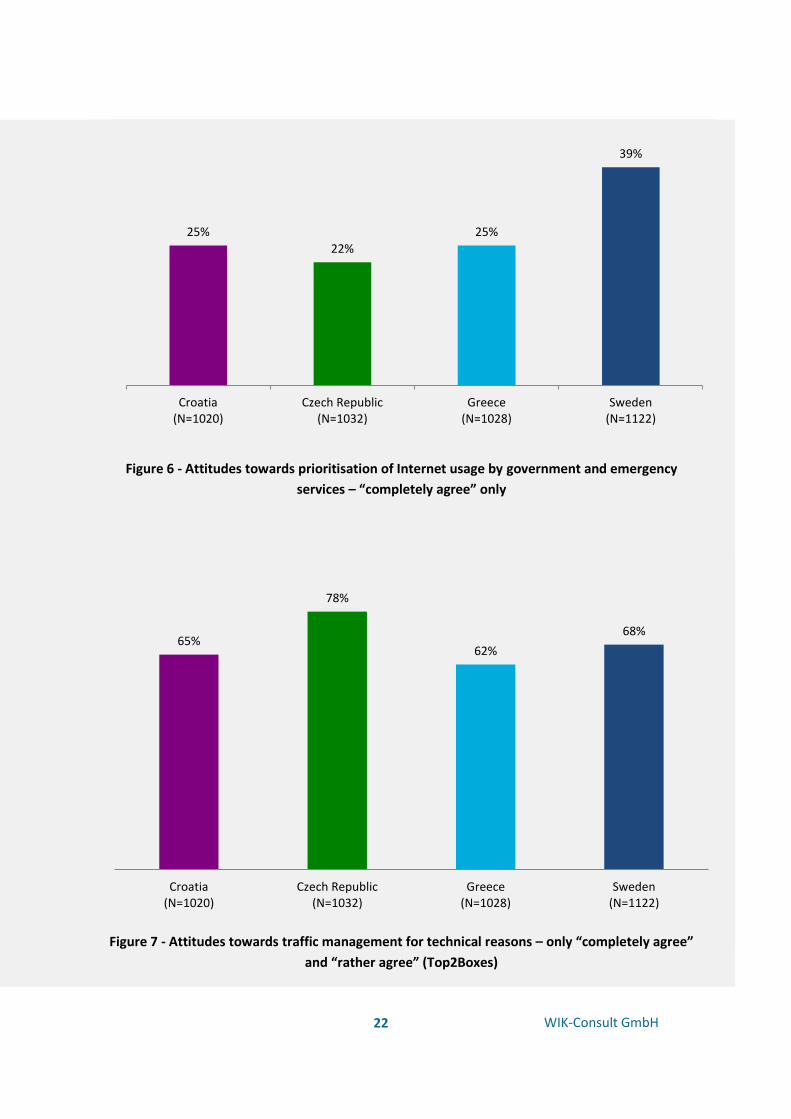
Figure 6 - Attitudes towards prioritisation of Internet usage by government and emergency
services – “completely agree” only
25%
22%
25%
39%
Croatia(N=1020)
Czech Republic(N=1032)
Greece(N=1028)
Sweden(N=1122)
Figure 7 - Attitudes towards traffic management for technical reasons – only “completely agree”
and “rather agree” (Top2Boxes)

23
WIK-Consult GmbH
helpful, most participants agreed that they were
rather cumbersome and boring.
When the topic of the throttling and
prioritisation of specific applications was
stressed in the focus group discussions,
participants doubted that prioritised services are
available for most consumers and that it would
be possible to customise such services. If they
were available and the service quality could be
guaranteed, consumers in Greece and the Czech
Republic would accept private users receiving
them as long as they paid more for them. In
Croatia, this issue was a less important part of
the focus group discussions. However, the
results of the survey indicate that many
Croatians may also accept such practices.
Participants in Sweden classed such services as
undemocratic and contrary to the fundamental
idea of the Internet being a free medium. They
felt that everyone should have unrestricted and
good-quality access to it.
The prioritisation of certain important data, such
as that of the government and the emergency
services, was accepted by consumers in all four
test areas. This feeling was particularly strong in
the Swedish focus group discussions. The survey
results support this finding with 39% of Swedish
respondents strongly agreeing with this idea.
Meanwhile, participants disapproved of any type
of blocking. Unsurprisingly, consumers support
traffic management measures that keep their
Internet experience stable. This was particularly
pronounced in the Czech Republic where the
participants in the focus groups reported
generally bad quality of their Internet access at
home.
Generally, participants could not understand
how providers would be able to manage the
data traffic. Should they choose a prioritised
service, it would be very important to them to
be able to make their own individual choices
regarding the applications and services that are
prioritised. However, they expressed doubt that
they would be able to find a provider that could
offer them a contract that met their exact
needs. Furthermore, they remained generally
fearful that traffic management could be used
without them realising. Some showed a fear of
being spied on as a result of the analysis of
Internet traffic that ISPs would have to perform
to ensure that the right types of traffic are
prioritised.
To sum up, the findings from the focus group
discussions support the conclusions of previous
studies about consumers’ awareness and
understanding of network neutrality and
deviations from it. However, the focus group
discussions also highlighted that awareness may
be raised through prompting consumers to
consider the specific effects of traffic
management. Furthermore, our insights show
that approaching consumers with written
information only may not be sufficient as
participants found the explanations given to
them cumbersome and boring. Even after
reading them, they often had great difficulty
comprehending the term network neutrality.
As a result of these findings, the information
package was developed in the form of a short
video clip, which gave a figurative and vivid
illustration of how the Internet works, as well as
an explanation of network neutrality and the
possible effects of deviations from this principle.
The video’s main objective was to present the
appropriate amount of information: too much or
too little information would have limited the
video’s effectiveness. The video started by
addressing the effects of traffic management
that are likely to resonate with consumers, given
24
WIK-Consult GmbH
Consumer information should relate to
applications and content
For consumers, the Internet is primarily about high-quality and reliable access to content and
applications. They are not particularly concerned with how the data is transported, unless they
directly experience any adverse consequences as a result of this. The role of ISPs remains
somewhat unclear to them. Consequently, it is not surprising that they quickly move on to
debates about broader issues such as democracy, freedom of speech and equality when
discussing issues that they link to the topics of network neutrality and traffic management.
The fact that consumers define the Internet in terms of the applications and content that they
can access and the quality that they experience has important implications. Consumer
information about network neutrality should reflect this viewpoint, so it should therefore relate
to access to applications and content, and should not primarily address the technicalities of data
transport. This applies to both consumer information from NRAs and advertising by ISPs.
their conceptualisation of the Internet as a gateway to access content and applications. It avoided
the term “network neutrality”, which consumers had found confusing in the focus group
discussions, and replaced it with “traffic management”. The information was given in consumers’
everyday language rather than more technical terms, so for example “slowed down” was used
instead of “throttling”.
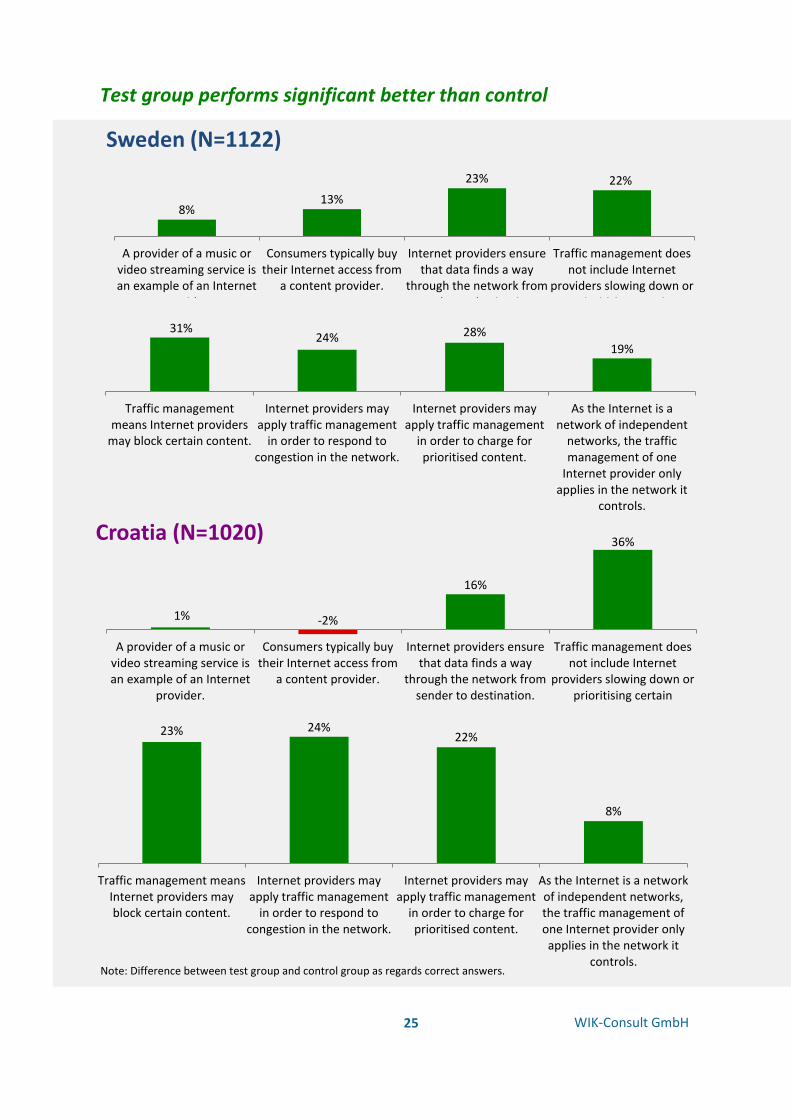
The information package was only shown to half of the respondents before taking the survey. In
order to measure its educational effect, all respondents were asked eight true or false questions.
The percentage of correct answers given by those who had seen the video clip was consistently
higher than that of those who had not (although in two cases the difference was not statistically
significant), demonstrating that the information package did indeed have the intended effect. The
increase in correct answers was greatest for the questions related to traffic management, as this is
a term that consumers weren’t previously familiar with.
25
WIK-Consult GmbH
8% 13%
23% 22%
A provider of a music orvideo streaming service isan example of an Internet
provider.
Consumers typically buytheir Internet access from
a content provider.
Internet providers ensurethat data finds a way
through the network fromsender to destination.
Traffic management doesnot include Internet
providers slowing down orprioritising certain
content.
Sweden (N=1122)
31% 24% 28%
19%
Traffic managementmeans Internet providers
may block certain content.
Internet providers mayapply traffic management
in order to respond tocongestion in the network.
Internet providers mayapply traffic management
in order to charge forprioritised content.
As the Internet is anetwork of independent
networks, the trafficmanagement of one
Internet provider onlyapplies in the network it
controls.
1% -2%
16%
36%
A provider of a music orvideo streaming service isan example of an Internet
provider.
Consumers typically buytheir Internet access from
a content provider.
Internet providers ensurethat data finds a way
through the network fromsender to destination.
Traffic management doesnot include Internet
providers slowing down orprioritising certain
content.
Croatia (N=1020)
23% 24% 22%
8%
Traffic management meansInternet providers mayblock certain content.
Internet providers mayapply traffic management
in order to respond tocongestion in the network.
Internet providers mayapply traffic management
in order to charge forprioritised content.
As the Internet is a networkof independent networks,the traffic management ofone Internet provider onlyapplies in the network it
controls.
Test group performs significant better than control
group
Note: Difference between test group and control group as regards correct answers.

26
WIK-Consult GmbH
5% 5%
21% 33%
A provider of a music orvideo streaming service isan example of an Internet
provider.
Consumers typically buytheir Internet access from
a content provider.
Internet providers ensurethat data finds a way
through the network fromsender to destination.
Traffic management doesnot include Internet
providers slowing down orprioritising certain
content.
Czech Republic (N=1032)
36%
10%
27%
-2%
Traffic managementmeans Internet providers
may block certain content.
Internet providers mayapply traffic management
in order to respond tocongestion in the network.
Internet providers mayapply traffic management
in order to charge forprioritised content.
As the Internet is anetwork of independent
networks, the trafficmanagement of one
Internet provider onlyapplies in the network it
controls.
20% 15%
25%
14%
Traffic managementmeans Internet providers
may block certain content.
Internet providers mayapply traffic management
in order to respond tocongestion in the network.
Internet providers mayapply traffic management
in order to charge forprioritised content.
As the Internet is anetwork of independent
networks, the trafficmanagement of one
Internet provider onlyapplies in the network it
controls.Note: Difference between test group and control group as regards correct answers.
11% 10%
23% 33%
A provider of a music orvideo streaming service isan example of an Internet
provider.
Consumers typically buytheir Internet access from
a content provider.
Internet providers ensurethat data finds a way
through the network fromsender to destination.
Traffic management doesnot include Internet
providers slowing down orprioritising certain
content.
Greece (N=1028)
Figure 8 – Manipulation test – educational effect of the information package in the test area

27
WIK-Consult GmbH
Consumers care about free, unrestricted, reliable access to and high
quality of content and communication. For them, that is quality of
experience.
28
WIK-Consult GmbH
02 | Interest
In order to fully understand the meaning of network neutrality to European consumers, one first
has to understand the role that the Internet plays in their lives. One would expect that this topic
has been studied from all perspectives possible. We were surprised to learn that this is not the
case. Thus, this chapter provides novel insights. For instance, we find that there are marked
differences in the role that the Internet plays in consumers’ lives. Furthermore, it is most crucial
to learn about consumers’ attitudes towards the Internet and what access to the Internet means
to them. This chapter provides the answers to these questions, which are critical in
understanding consumers’ conceptualization of network neutrality.
There is little published qualitative research on the
role that the Internet plays in consumers’ lives.
What has been published is either potentially
outdated, as a result of being published a long
time ago and revolving around the Internet’s
potential effects on consumer behaviour (for
example, Geissler & Zinkhan, 199810), or explores
particularly vulnerable groups using specific
Internet-based applications (for example the
elderly (Papa et al., 2011)11 or rural communities
(Macintyre & Macdonald, 2011)12). Our research
adds new insights into the role that the Internet
plays more generally for consumers.
As one would expect, the Internet plays a central
role in consumers’ lives across all the test areas.
10 Geissler, G.L. & Zinkhan, G.M. (1998): Consumer Perceptions of the World Wide Web: An Exploratory Study Using Focus Group Interviews. Advances in Consumer Research 25, 386-392.
11 Papa, F.; Sapio, B. & Pelagalli, M.F. (2011): User Experience of Elderly People with Digital Television: A Qualitative Investigation. EuroITV 2011 - Proceedings of the 9th international interactive conference on Interactive television, 223-226.
12 Macintyre, R. & Macdonald, J. (2011): 'Remote from what?' Perspectives of distance learning students in remote rural areas of Scotland. The International Review of Research in Open and Distance Learning 12(4).
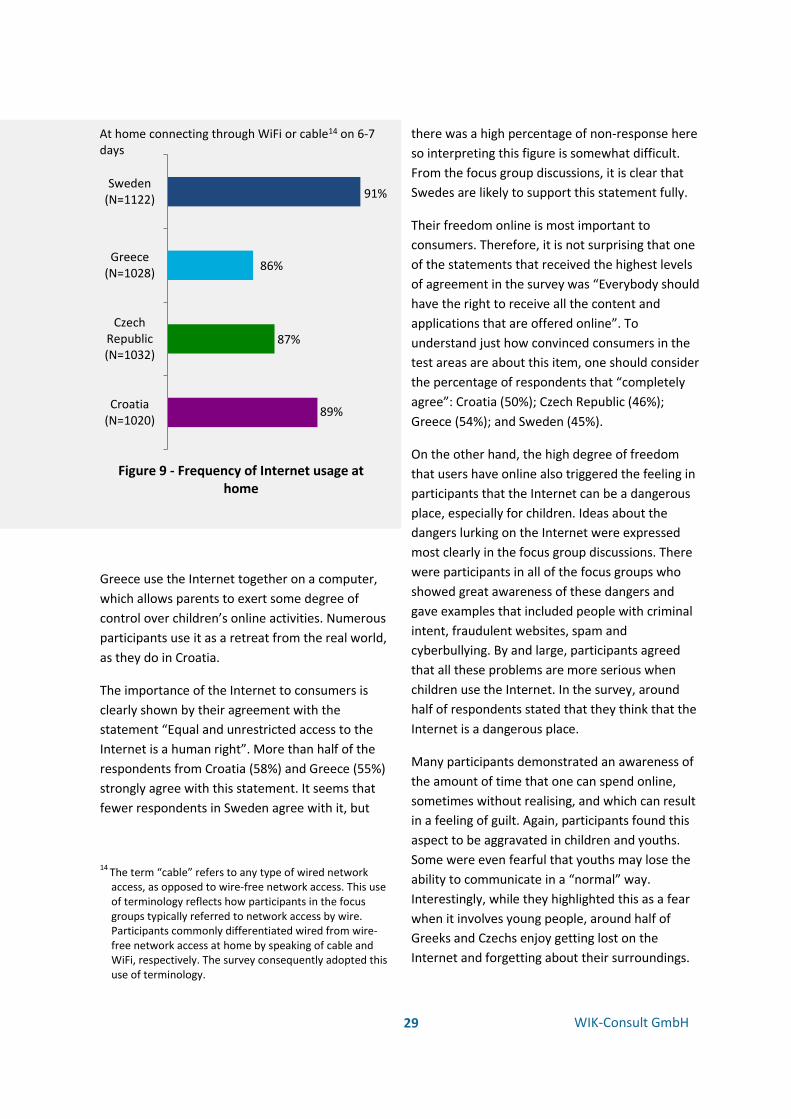
Around 90% of them use it almost every day at
home.13 However, the character of this role differs
quite significantly as the focus group discussions
indicated. In Sweden the Internet is woven into
consumers’ lives and they often use it almost
without realising, such as when streaming music or
videos on a smart stereo system or TV. Thus, it is
not surprising that we observed much higher
expectations as regards the reliability of
respondents’ Internet connection in Sweden than
in any other test area. Independent from where
they are, even in rural areas, Swedes simply expect
their access to the Internet to work. On the other
hand, Czech consumers explained that they are
very conscious of their Internet use and do not use
it all of the time. They use it predominantly for
organisational purposes, such as arranging to meet
friends. The role that the Internet plays in the
other two test areas falls between these two
extremes. Within that, it is interesting to note that
according to participants’ reports, families in
13 As having stationary access to the Internet at home was a selection criterion for the samples, these findings are line with expectations. They are however not necessarily representative for the general population in the respective test areas.
29
WIK-Consult GmbH
89%
87%
86%
91%
Croatia(N=1020)
CzechRepublic(N=1032)
Greece(N=1028)
Sweden(N=1122)
At home connecting through WiFi or cable14 on 6-7 days
Figure 9 - Frequency of Internet usage at home
Greece use the Internet together on a computer,
which allows parents to exert some degree of
control over children’s online activities. Numerous
participants use it as a retreat from the real world,
as they do in Croatia.
The importance of the Internet to consumers is
clearly shown by their agreement with the
statement “Equal and unrestricted access to the
Internet is a human right”. More than half of the
respondents from Croatia (58%) and Greece (55%)
strongly agree with this statement. It seems that
fewer respondents in Sweden agree with it, but
14 The term “cable” refers to any type of wired network access, as opposed to wire-free network access. This use of terminology reflects how participants in the focus groups typically referred to network access by wire. Participants commonly differentiated wired from wire-free network access at home by speaking of cable and WiFi, respectively. The survey consequently adopted this use of terminology.
there was a high percentage of non-response here
so interpreting this figure is somewhat difficult.
From the focus group discussions, it is clear that
Swedes are likely to support this statement fully.
Their freedom online is most important to
consumers. Therefore, it is not surprising that one
of the statements that received the highest levels
of agreement in the survey was “Everybody should
have the right to receive all the content and
applications that are offered online”. To
understand just how convinced consumers in the
test areas are about this item, one should consider
the percentage of respondents that “completely
agree”: Croatia (50%); Czech Republic (46%);
Greece (54%); and Sweden (45%).
On the other hand, the high degree of freedom
that users have online also triggered the feeling in
participants that the Internet can be a dangerous
place, especially for children. Ideas about the
dangers lurking on the Internet were expressed
most clearly in the focus group discussions. There
were participants in all of the focus groups who
showed great awareness of these dangers and
gave examples that included people with criminal
intent, fraudulent websites, spam and
cyberbullying. By and large, participants agreed
that all these problems are more serious when
children use the Internet. In the survey, around
half of respondents stated that they think that the
Internet is a dangerous place.
Many participants demonstrated an awareness of
the amount of time that one can spend online,
sometimes without realising, and which can result
in a feeling of guilt. Again, participants found this
aspect to be aggravated in children and youths.
Some were even fearful that youths may lose the
ability to communicate in a “normal” way.
Interestingly, while they highlighted this as a fear
when it involves young people, around half of
Greeks and Czechs enjoy getting lost on the
Internet and forgetting about their surroundings.

30
WIK-Consult GmbH
9%
3%
3%
1%
12%
7%
14%
8%
28%
27%
35%
31%
37%
58%
37%
55%
14%
12%
11%
5%
Sweden
Croatia
Czech Republic
Greece
Completely disagree Rather disagree Rather agree Completely agree Non-response
Equal and unrestricted access to the Internet is a human right.
2%
3%
2%
2%
8%
11%
8%
6%
27%
30%
36%
33%
45%
50%
46%
54%
18%
6%
8%
5%
Sweden
Croatia
Czech Republic
Greece
Completely disagree Rather disagree Rather agree Completely agree Non-response
Everybody should have the right to receive all the content and applications that are offered online.
Figure 11 - Importance of the Internet to consumers (II)
Figure 10 - Importance of the Internet to consumers (I)

31
WIK-Consult GmbH
The result for the Czech Republic differs markedly
from the conscious use of the Internet that Czech
participants reported in the focus group
discussions. This difference may be attributed to
participants’ self-representation in the group
setting. Throughout all focus group discussions,
there was a latent notion of being used to
insufficient supply with goods, bad service
experiences and inferior quality of their Internet
access. In this light, the reported conscious use of
the Internet may be interpreted as emancipation
from generally unreliable service provision.
Consumers want to project to others that,
naturally, they do not depend on the Internet in
order to maintain their emotional independence.
As respondents most likely filled in the
questionnaire alone, this effect was not prevalent
in the survey responses. For Croatia, we found an
effect in the opposite direction. Here, as described
above, participants in the focus groups reported
that they enjoyed forgetting their surroundings
when they are online. This was less prevalent in
the survey responses. In this case, it should be
noted that there was a tendency to feel liberated
by the emergence of the Internet and its
possibilities. So, Croatian participants exhibited a
much more positive attitude towards the Internet,
which they probably sought to project to the other
participants as this is what is socially expected and
desired.
Nevertheless, respondents’ overall attitudes about
the Internet are overwhelmingly positive. In
particular, they value that it allows them to
connect to the wealth of information and services
that are available online, and to communicate with
friends. Few can actually imagine living without the
Internet anymore.
Coming back to Internet usage patterns, it is
interesting to see that despite similar usage
frequencies in the four test areas, the average
duration of usage varies. The Czechs claimed to
spend the most time online per day and the
Swedes the least. This result is surprising in light of
the market environment in these countries, as well
as the insights on conscious use gained from the
focus group discussions. However, it may actually
be the case that as Czechs use the Internet very
consciously, they also have a better, or perhaps
exaggerated, perception of how much time they
actually spend online per day. In Sweden,
however, the Internet has become an integral part
of consumers’ lives, with offline and online lives
blurring more and more. Consequently, it is
possible that Swedes actually spend significantly
more time online than the consumers in the other
test areas, but do not register this consciously
anymore.
The most typical online activities are emailing,
browsing, reading the news, using social networks
and streaming videos. Music streaming is
significantly more common in Sweden, while VoIP
has a surprisingly low level of usage there. This
may be attributed to Swedish respondents having
a higher level of income15 than those in the other
three test areas. The generally low usage of
Internet applications of Swedish respondents in
the survey seems surprising, especially given the
results found in the focus group discussions that
clearly indicate that the Internet is tightly woven
into Swedish consumers’ lives. Again, this may be
attributed to an (often) unconscious use of
Internet applications in Sweden. Additionally, a
deeper look into data splits by usage situation and
age group may shed some light on the respective
sources for the surprising results. Generally,
Swedes show a tendency towards mobile usage of
almost all Internet applications which supports the
findings from the focus group discussions. The
table only refers to at-home usage of Internet
applications. Splitting the data by age groups
15 Other factors such as applicable tariffs and market structure may also influence the substitutability of VoIP and traditional telephony.

32
WIK-Consult GmbH
reveals that most differences observed for the
Swedish respondents in this survey stem from a
bigger decrease in usage of applications as people
get older than in the other test areas.
To conclude, both the qualitative and quantitative
research demonstrates that the Internet plays a
crucial role in consumers’ lives, as they value
reliable and high-quality access to content and
applications. Our results also indicate differing
socially desired expectations about how the
Internet should be used as compared to how it is
used by consumers. The importance of the
Internet in consumers’ daily lives further supports
the finding of the previous chapter that consumers
experience the Internet through the applications
they use and the content they consume, giving
little (or any) thought to how the data is
transported.
Participants in all test areas frequently mentioned
in the focus group discussions that two of the main
purposes for their Internet usage are
communicating and finding information. However,
the actual ways in which consumers use the
Internet for communication differ substantially.
With regard to accessing information, there were
few noticeable differences across the test areas. In
general, participants highlighted the fact that
anyone can gain immediate access to information
as the Internet’s most important characteristic.
Many participants explained that this free access
to information gives them a sense of freedom and
the ability to express their individuality.
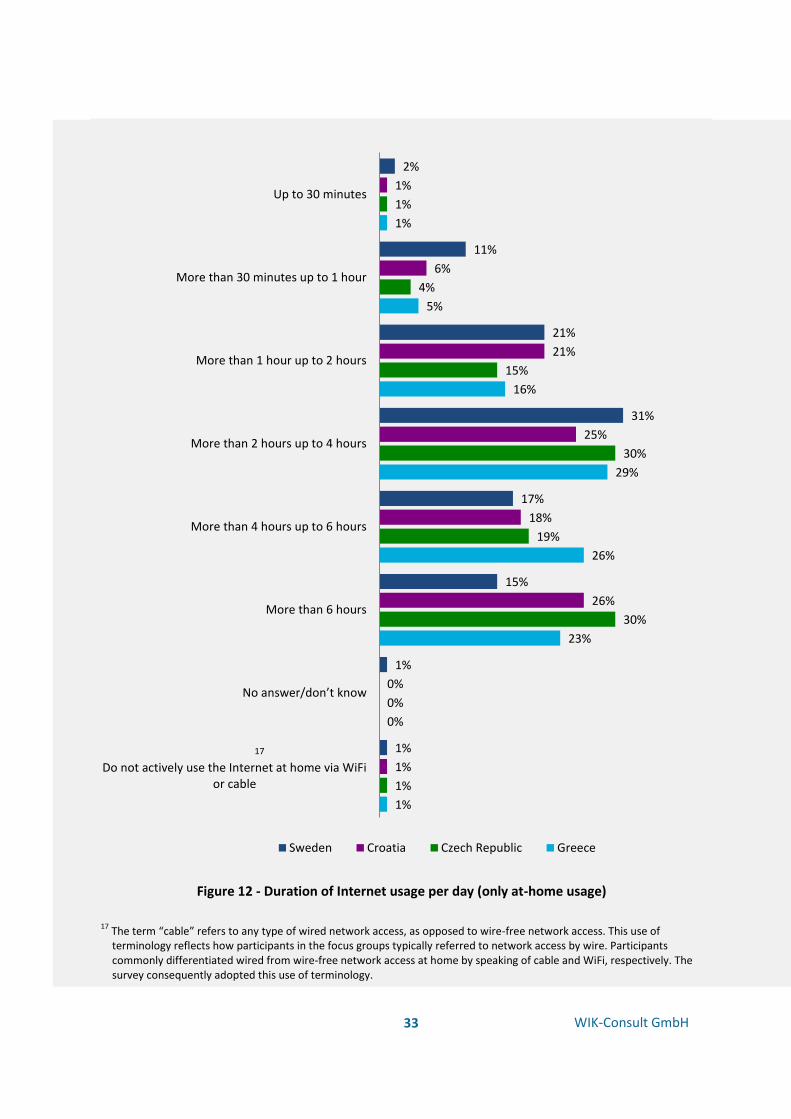
33
WIK-Consult GmbH
2%
11%
21%
31%
17%
15%
1%
1%
1%
6%
21%
25%
18%
26%
0%
1%
1%
4%
15%
30%
19%
30%
0%
1%
1%
5%
16%
29%
26%
23%
0%
1%
Up to 30 minutes
More than 30 minutes up to 1 hour
More than 1 hour up to 2 hours
More than 2 hours up to 4 hours
More than 4 hours up to 6 hours
More than 6 hours
No answer/don’t know
Do not actively use the Internet at home via WiFior cable
Sweden Croatia Czech Republic Greece
17
Figure 12 - Duration of Internet usage per day (only at-home usage)
17 The term “cable” refers to any type of wired network access, as opposed to wire-free network access. This use of terminology reflects how participants in the focus groups typically referred to network access by wire. Participants commonly differentiated wired from wire-free network access at home by speaking of cable and WiFi, respectively. The survey consequently adopted this use of terminology.
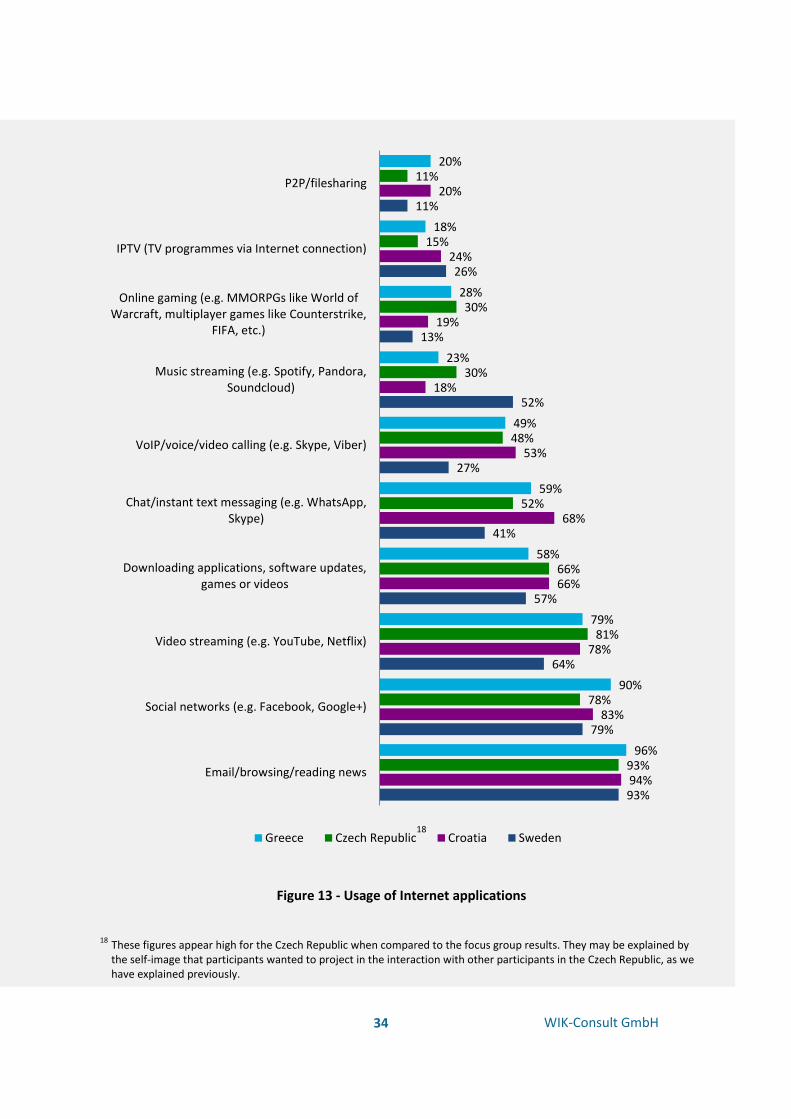
34
WIK-Consult GmbH
93%
79%
64%
57%
41%
27%
52%
13%
26%
11%
94%
83%
78%
66%
68%
53%
18%
19%
24%
20%
93%
78%
81%
66%
52%
48%
30%
30%
15%
11%
96%
90%
79%
58%
59%
49%
23%
28%
18%
20%
Email/browsing/reading news
Social networks (e.g. Facebook, Google+)
Video streaming (e.g. YouTube, Netflix)
Downloading applications, software updates,games or videos
Chat/instant text messaging (e.g. WhatsApp,Skype)
VoIP/voice/video calling (e.g. Skype, Viber)
Music streaming (e.g. Spotify, Pandora,Soundcloud)
Online gaming (e.g. MMORPGs like World ofWarcraft, multiplayer games like Counterstrike,
FIFA, etc.)
IPTV (TV programmes via Internet connection)
P2P/filesharing
Greece Czech Republic Croatia Sweden18
Figure 13 - Usage of Internet applications
18
These figures appear high for the Czech Republic when compared to the focus group results. They may be explained by the self-image that participants wanted to project in the interaction with other participants in the Czech Republic, as we have explained previously.

35
WIK-Consult GmbH
Network neutrality-related attributes make up ….
Figure 14 - Relative importance of attributes by test area
7%
7%
7%
7%
13%
11%
12%
12%
7%
8%
7%
9%
5%
5%
5%
5%
21%
20%
20%
21%
12%
12%
12%
12%
8%
9%
8%
8%
7%
8%
7%
7%
12%
12%
13%
11%
8%
8%
10%
8%
0% 20% 40% 60% 80% 100%
Sweden
Croatia
Czech Republic
Greece
Brand Speed Bundle Contract duration Price
Data cap P2P VoIP Video streaming Online gaming
46%
50%
49%
47%
…of consumer purchase criteria.

36
WIK-Consult GmbH
03 | Desire
Consumers’ desires as regards network neutrality are much more nuanced than a simple
preference for or against this principle. In fact, our research finds that they do see the bigger
picture. This chapter presents answers to the questions: What do consumers consider fair? What
is the role of network neutrality attributes within the purchase choice criteria when choosing an
IAS? It is obvious that not all consumers act in the same, thus this chapter also presents a
segmentation of consumers based on their preference patterns. Finally, we test whether
consumer information about how the Internet works and network neutrality effects has got any
impact on their purchase choice criteria.
Previous chapters have highlighted that consumers
are mainly concerned about their own personal
online experience and they do not want to see this
compromised. This is not surprising given the
important role that the Internet plays in many of
their lives. This finding is reinforced by the
responses given to the questions in the survey on
attitudes towards network neutrality, as can be
seen by the high level of agreement with the
statement “If prioritising one application means
that I cannot access another application, I cannot
accept this”. Even the guarantee of high-quality
access to a particular application is not seen as a
strong enough incentive for a consumer to accept
losing access to another and thus risk a negative
impact on their online experience as well as the
unrestricted access to all content and applications
that they value so highly.
The quality of experience for all users also appears
to shape respondents’ initial attitude towards the
fairness of offering prioritised services at an extra
cost. Across all test areas, around 75% agreed with
the statement “If prioritising one user means that
someone else gets slower access to the Internet, I
find this unfair”. Strong agreement was particularly
high in the Czech Republic.
As could be predicted from the focus group
discussions, the Swedish respondents showed the
lowest levels of agreement with the statement “I
am fine with applications being prioritised for a
specific user if they pay extra for this service”.
Here, just 50% of respondents agreed with this
statement. Although a few Swedish focus group
participants indicated an interest in purchasing
prioritised services, the majority of them either did
not consider such services to be fair, or would only
purchase them if they did not reduce the speed of
other users’ connections. Meanwhile, Czech
respondents showed the highest levels of
agreement with the statement that they would be
fine with applications being prioritised for those
who pay extra. This may be a result of the fact that
Internet access in the Czech Republic is generally
more unstable than in the other test areas, and
respondents may therefore have empathised more
strongly with others wishing for prioritised access
to certain applications or content.
Moreover, ideas about the wider effects of
potential prioritisation of content and applications
on competition and innovation also registered to
some extent with consumers. This is demonstrated
in a range of results from our study. In the focus
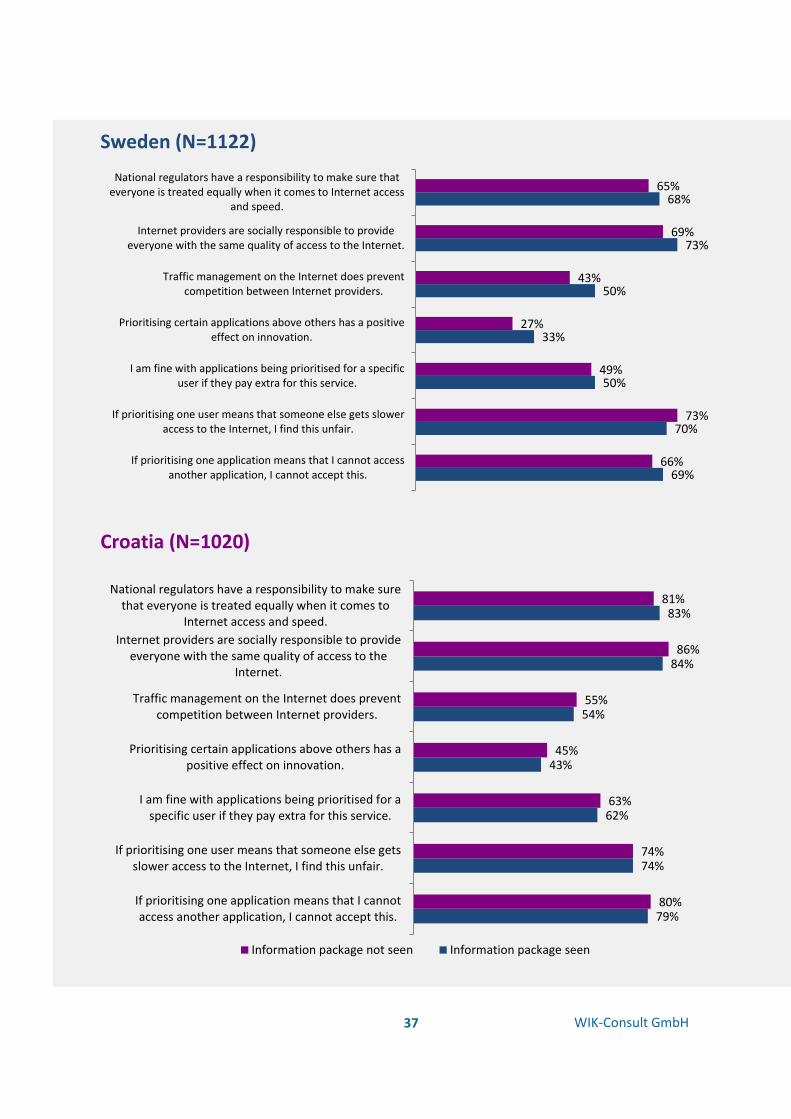
37
WIK-Consult GmbH
69%
70%
50%
33%
50%
73%
68%
66%
73%
49%
27%
43%
69%
65%
If prioritising one application means that I cannot accessanother application, I cannot accept this.
If prioritising one user means that someone else gets sloweraccess to the Internet, I find this unfair.
I am fine with applications being prioritised for a specificuser if they pay extra for this service.
Prioritising certain applications above others has a positiveeffect on innovation.
Traffic management on the Internet does preventcompetition between Internet providers.
Internet providers are socially responsible to provideeveryone with the same quality of access to the Internet.
National regulators have a responsibility to make sure thateveryone is treated equally when it comes to Internet access
and speed.
Sweden (N=1122)
Croatia (N=1020)
79%
74%
62%
43%
54%
84%
83%
80%
74%
63%
45%
55%
86%
81%
If prioritising one application means that I cannotaccess another application, I cannot accept this.
If prioritising one user means that someone else getsslower access to the Internet, I find this unfair.
I am fine with applications being prioritised for aspecific user if they pay extra for this service.
Prioritising certain applications above others has apositive effect on innovation.
Traffic management on the Internet does preventcompetition between Internet providers.
Internet providers are socially responsible to provideeveryone with the same quality of access to the
Internet.
National regulators have a responsibility to make surethat everyone is treated equally when it comes to
Internet access and speed.
Information package not seen Information package seen

38
WIK-Consult GmbH
76%
74%
72%
47%
50%
75%
68%
72%
74%
66%
46%
48%
76%
69%
If prioritising one application means that I cannotaccess another application, I cannot accept this.
If prioritising one user means that someone else getsslower access to the Internet, I find this unfair.
I am fine with applications being prioritised for aspecific user if they pay extra for this service.
Prioritising certain applications above others has apositive effect on innovation.
Traffic management on the Internet does preventcompetition between Internet providers.
Internet providers are socially responsible to provideeveryone with the same quality of access to the
Internet.
National regulators have a responsibility to make surethat everyone is treated equally when it comes to
Internet access and speed.
Czech Republic (N=1032)
83%
78%
59%
53%
56%
86%
85%
82%
78%
56%
51%
53%
85%
83%
If prioritising one application means that I cannotaccess another application, I cannot accept this.
If prioritising one user means that someone elsegets slower access to the Internet, I find this unfair.
I am fine with applications being prioritised for aspecific user if they pay extra for this service.
Prioritising certain applications above others has apositive effect on innovation.
Traffic management on the Internet does preventcompetition between Internet providers.
Internet providers are socially responsible toprovide everyone with the same quality of access…
National regulators have a responsibility to makesure that everyone is treated equally when it…
Information package not seen Information package seen
Greece (N=1028)
Figure 15 - Attitudes towards traffic management across test areas and towards network neutrality
in general across test areas – (Top2Boxes)

39
WIK-Consult GmbH
group discussions, Swedish participants were
concerned about potentially harmful effects on
competition if content and applications providers
were able to pay for prioritisation of their services
or might even pay for their rivals to be slowed
down or removed from an ISP’s network. They also
feared that such practices might prevent small
start-ups gaining a foothold in the market.
Consequently, it is not surprising that Swedish
respondents were least likely to agree with the
item “Prioritising certain applications above others
has a positive effect on innovation”.
The item “Traffic management on the Internet
does prevent competition between Internet
providers” was meant to further assess
respondents’ concern about traffic management
measures on competition in the market. In Croatia
(54%) and Greece (55%), more than half of the
respondents agreed with this statement, while in
the other two areas statistically significantly fewer
respondents did so: Czech Republic (49%) and
Sweden (46%). Still, we found that consumers
appeared to have great difficulty assessing the
potential wider economic impact of traffic
management. First, this is reflected in the fact that
the focus groups in the test areas other than
Sweden did not mention this aspect. Second, this is
reflected in the high percentage of non-response
for the items reported here, which ranged from
11% to 36%.
Societal issues revolving around traffic
management appear to resonate stronger with
consumers than those to do with economic effects.
The item “Internet providers are socially
responsible to provide everyone with the same
quality of access to the Internet” showed
consistently high levels of agreement in all test
areas. However, there are some noticeable
differences. Levels of agreement were statistically
higher in Greece and Croatia (both 85%) than in
the Czech Republic and Sweden with 76% and 71%
of respondents agreeing respectively. Turning from
the top two boxes to the share of respondents that
stated they “completely agree” with this
statement, the picture becomes even clearer. In
Croatia (58%) and Greece (52%), more than half of
consumers were likely to feel strongly about this
issue. In the Czech Republic (38%) and Sweden
(41%), the percentage of people who agreed
completely with this statement was much lower.
However, consumers felt that social responsibility
should not just reside with the ISPs. They also
thought that some institution (preferably a
governmental one) ought to oversee what
happens with their Internet access. In particular,
they sought out some degree of control over their
unrestricted and satisfactory access to content and
applications of their choice. This insight stems
from both the focus group discussions and the
survey results. The item “National regulators have
a responsibility to make sure that everyone is
treated equally when it comes to Internet access
and speed” refers directly to NRAs’ involvement in
network neutrality issues. As we have seen from
the focus groups, consumers generally lack the
technical knowledge to express their wishes in
technical or economic terms; however, as other
items in the survey reflect, they have strong
preconceptions about the nature of the Internet as
a free, open and inherently democratic medium
that everyone who wishes ought to have
(unrestricted) access to.
Although results for the items mentioned above
varied by test area, the information package
(which performed well in educating respondents
about traffic management) did not affect the
respondents’ attitudes. The figure 15 illustrates the
differences between the two groups’ responses to
the statements.
In essence, consumers subscribe to the idea that
some data can or, in some cases, even should be
prioritised, either for extra payment or due to
reasons of urgency. On the other hand, consumers

40
WIK-Consult GmbH
Privacy concerns may get in the way of
prioritised services
Drawing on comments received in some of the focus group discussions, an item on what
consumers think about the need for data traffic analysis to enable prioritised services by
ISPs was included in the survey. While Czech consumers appeared less concerned about
issues to do with data privacy, Swedish and Croatian consumers in particular were worried
about this issue and want their online privacy untouched. Online privacy was not
particularly emphasised in the focus group discussions; however, it was a latent theme
underlying many of the discussions. Consumers do not like the idea of being spied on, and
they also do not want to see their data being used for advertising and other purposes.
67% 76% 72%
80%
52%
73% 69% 70%
I am concerned that Internet providers’ analyses of data traffic to enable prioritised applications
violate privacy rights.
Internet providers should not monitor whatindividual users do online.
Sweden Croatia Czech Republic Greece
Figure 16 - Attitudes towards privacy-related aspects of traffic management – Top2Boxes
do not want prioritisation to take place at the expense of anybody else’s access and in particular not their
own quality of Internet access. As they consider potential effects of traffic management not only on
themselves but also on others, consumers exhibit a pronounced sensitivity for fairness when it comes to
network neutrality. In this context, consumers also consider to some extent greater societal effects.
Consumers’ pronounced desire for fairness implies that ISPs need to understand in depth what consumers
are willing to accept. Our research suggests that consumers are in principle open to (the effects of) traffic
management, but they draw a line when someone’s benefit is to the detriment of someone else. Fairness
understood this way defines what consumers would probably perceive as reasonable traffic management.
It will be important for ISPs to contain traffic management effects that impair the experience of a
consumer to a minimum. In this context, ISPs may risk dissatisfying consumers if they use prioritisation on
data links that run at their capacity. In situations of scarce (network) resources, it naturally follows that
someone who receives more essentially takes these extra resources from someone else.

41
WIK-Consult GmbH
The resulting key questions are of course just how
sensitive consumers really are to violations of what
they consider fair, whether they would actually
attribute the reason for a violation to their ISP’s
behaviour, and if they translate any dissatisfaction
into action (for instance, switch to another
provider). The study of these questions deserves
further attention from research as the respective
insights may help define consumer-driven, clear-
cut boundaries between reasonable and
unreasonable traffic management.
To contextualise consumers’ concept of fairness in
the network neutrality debate, it is certainly
relevant to benchmark it against BEREC’s set of
criteria to assess “reasonableness” of traffic
management measures. In total, BEREC identifies
four criteria for this. We quote each of them below
and benchmark them against our findings from this
study.
(i) Non-discrimination between players: The
practice is done on a non-discriminatory basis
among all content and application providers.
This first criterion identified by BEREC reflects
consumers’ concept of fairness as regards traffic
management quite well. In fact, one might argue
that consumers even go beyond the idea that all
content and application providers have to be
treated equally by also considering the impact that
their potential choice for a prioritised
content/application service might have on the
quality of experience for other users. As such,
consumers appear to support the idea that all
users are treated equally on the Internet, and even
if some may be willing to pay extra for better
quality access, they feel that measures to assure
their own quality of experience should not impair
the quality of experience for others.
(ii) End-user control: It is an important indicator
of reasonableness when the practice is applied on
the request of users at the edge, who can control
and deactivate it. The level of control is deemed
higher when the user does not incur costs for
removing a restriction.
Also, the role and control of the end-user is
reflected clearly in our results. If consumers opt for
prioritised services, they want to make the choice
themselves about which particular content or
applications are prioritised and are reluctant to
accept any predefined selection that their ISP may
offer. In fact, in the focus group discussions, many
participants voiced doubts that ISPs could actually
anticipate their specific needs and create bespoke
products. This is also reflected in the low
agreement with the item in the survey that asks if
ISPs should make the choice of which content and
applications are prioritised and which ones are not.
Similarly, respondents showed relatively little
agreement with the item referring to ISPs
prioritising their own content such as IPTV over
other (third-party) content.
(iii) Efficiency and proportionality: The
measures should be limited to what is necessary to
fulfil the objective, in order to minimise possible
side effects. The intensity of the practice, such as
frequency and reach, is also important when
assessing its impact.
First and foremost, the focus group discussions
highlighted that consumers would like to be as free
and uncontrolled as possible when they are online.
On the other hand, many participants also voiced
their wish for a sort of anticipatory filtering of
content that they deem offensive, fraudulent or
dangerous. Some participants did subscribe to the
idea of a “guardian angel” in the background and
intended to perform this task themselves, probably
severely underestimating its magnitude.
As hard or even impossible it would be to achieve
this consumer ideal, the only institution that most
of the participants would have faith in performing
it is their own government. The actual fulfilment of
the task is further impeded by consumers’ clear

42
WIK-Consult GmbH
wish that their personal data remain untouched
(as far as possible). While this suggests that they
adhere to the principle put forward by BEREC
quoted above, in fact neither ISPs nor the
government or an NRA could possibly fulfil the task
of filtering without analysing user data.
(iv) Application agnosticism: As long they are
able to achieve a similar effect, BEREC expresses a
general preference for ‘application-agnostic‘
practices. This reflects the fact that the decoupling
of the network and application layers is a
characteristic feature of the open Internet, and has
enabled innovation and growth.
In sum, the results of our study show that
consumers by and large are unaware of the
technical underpinnings of the Internet as well as
the specific role that ISPs play within it. They care
mostly about their own quality of experience and
have a strong preference for open, unrestricted
and reliable access to the content and applications
they want. In addition, ideas about the wider
effects of potential prioritisation of content and
applications on the competition and innovation
also register to some extent with consumers.
Overall, we found stable and clear-cut attitudes
towards network neutrality as described in detail
above.
How consumers’ attitudes towards network
neutrality are reflected in their purchase criteria
was tested in a conjoint analysis (ACA). It should be
noted that this study is not the first to test the
relevance of network neutrality-related attributes
in a conjoint analysis setting. Nam et al. (2011)19
and Huck and Wallace (2011)20 have already
conducted similar experiments. However, their
studies exhibit some shortcomings that this study
overcomes. First, both papers tested network
neutrality-related attributes in a comparatively
limited set of product attributes. Our study tests
ten IAS product attributes. Second, the phrasing of
the network neutrality-related attributes in the
papers by Nam et al. and Huck and Wallace may be
criticised as both papers capture only part of the
effects that emerged as being important to
consumers from the focus group discussions
conducted for the present study. Furthermore, the
attributes of preceding studies appear to be
phrased in a way that in light of the results of our
focus group discussions was very difficult to
understand for their respondents.
In fact, the extensive qualitative research we
undertook critically guided the selection and
phrasing of the attributes for the conjoint analysis
as well as the other parts of the questionnaire. It
was important to address consumers in terms of
their own Internet usage experiences, rather than
how data is transported.
The conjoint analysis tested ten product attributes
for IAS, out of which five referred to typical
product attributes, such as price and download
speed. The remaining five product attributes
revolved around applications that may or not be
affected by deviations from network neutrality
either in a positive way, i.e. prioritised, or
negatively, i.e. slowed down or blocked. On the
one hand, these applications reflected our finding
that consumers care most about the effects of
traffic management on their immediate quality of
experience. On the other hand, the selected
applications mirrored the ones most relevant to
consumers in the test areas as identified from the
focus group discussions. The following paragraphs
specify the ten selected IAS product attributes.
We included four attributes related to network
neutrality and the effect that traffic management
might have on how applications work. For each
19 Nam, C.; Lee, H.; Kim, S. & Kim, T. (2011): Network Neutrality: An End-User’s Perspective. International Telecommunications Policy Review 18(1), 1–15.
20 Huck, S. & Wallace, B. (2011): Consumer Information on Broadband Speed and Net Neutrality Experiment. London Economics.

43
WIK-Consult GmbH
attribute, there were four possible levels of access:
normal access, prioritised access, slowed down
access and blocked access. The attributes were:
Access to P2P file sharing
Access to VoIP
Access to video streaming services
Access to online gaming
In addition to this, we included an attribute on
data caps. Although strictly speaking they are not a
network neutrality issue as such, consumers may
see this as a potentially strong infringement of
their idea of freedom and unlimited access to all of
the Internet’s resources. After careful
consideration, it was decided to also include zero-
rating within this attribute. Specifically, we used
the following data caps for this attribute:
10 GB (with additional zero-rating
examples)
50 GB (with additional zero-rating
examples)
No data cap
As regards the five IAS product attributes related
to general product characteristics, the focus
groups’ choice criteria were very similar across all
test areas, and the criteria were generally in line
with the expectations gained from the reviews of
the previous studies. In addition to the attributes
related to network neutrality, this meant that the
choice criteria to involve in the survey were:
Quality/stability of the Internet
connection, which was captured by ISP
brand
Download speed
Bundle options
Price
Contract length
The remainder of this chapter discusses the results
of the ACA in detail. We begin by highlighting the
overarching findings as regards network neutrality-
related attributes, and then we discuss the effect
of the information package on how the Internet
works and traffic management tested as part of
our study. To this end, the test group (i.e. the
respondents who had seen the information
package before the conjoint exercise) and the
control group (i.e. the respondents who had not
seen the information package) are compared as
regards the part-worth utilities found in the
conjoint analysis. After these high-level results, the
individual attributes and their levels are discussed
in detail.
With regard to the product attributes that are
relevant to consumers’ purchase decisions,
network neutrality-related attributes scored
relatively high. Download speed, data caps and
video streaming came out as the second most
important purchase decision criteria behind price.
Out of these three product attributes, data caps
What is zero-rating?
Zero-rating is a commercial practice which consists of allowing end-users to access particular
content, services or applications without being charged or having it count towards their data
usage. In Europe, it is currently observed mainly in the context of mobile Internet access with
data caps.

44
WIK-Consult GmbH
and video streaming both relate to network
neutrality: the data caps included zero-rated
products and the video streaming offered different
levels of normal (unmanaged), prioritised, slowed
down and blocked access. It is our assumption that
the previous studies would have found network
neutrality to play a much more prominent role had
it been presented to consumers in a way that they
could easily relate to. We believe that our
approach, which was driven by the qualitative
insights, paid off.
It is a widely held view that increasing
transparency about network neutrality and traffic
management practices by giving consumers (fair
and neutral) information affects consumer
behaviour. Our study is the first that tests this idea
with regard to network neutrality and consumers’
purchase choice criteria. In the previous chapter,
we described the experimental manipulation of
the present study, i.e. the information package. It
was found that the test and control groups of
respondents differed markedly in their knowledge
about how the Internet works in general and traffic
management practices in particular. Thus, we can
be sure that the manipulation as such did work.
However, there was almost no measurable effect
on purchase choice criteria. In fact, the results
were very similar across all attributes tested in the
conjoint analysis (see Figure 17). A noticeable but
in practice negligible trend is that respondents in
the control group placed a little more importance
on price than respondents in the test group.
As regards network neutrality-related attributes,
we observed practically no differences between
the relative relevance of these attributes for the
two groups of respondents. In Croatia, accessibility
to online gaming applications was slightly more
important to those in the control group than those
in the test group. In the Czech Republic, the
accessibility of VoIP and online gaming applications
was a little more important in the test group than
in the control group. However, the differences are
marginal. In Greece and Sweden, the information
package had no effect on the perceived
importance of network neutrality-related
attributes.
This finding is very interesting in the specific
debate on network neutrality, but also bears
importance for other related fields of
policymaking. In our case, both the focus group
discussions and the survey found that there are
strong preconceptions about the nature of the
Internet and thus attitudes towards network
neutrality. It has been highlighted that the
individual’s quality of experience and unrestricted
access to content and applications are seen as
non-negotiable by consumers. Consequently, it is
not surprising that transparency about how the
Internet works and the rationale behind as well as
the effects of traffic management alone had little if
any effect on consumers’ behaviour. If a noticeable
change in consumer behaviour had been our
objective for this study, we would have had to test
different (persuasive) framings for the information
package. In fact, this represents a major avenue for
future research that is relevant to policymakers,
NRAs, ISPs and content and application providers
alike. Although for different reasons, all these
stakeholders ought to be interested in
understanding which persuasive messages are
likely to resonate with consumers given their
strong pre-existing attitudes towards the issue.
It is also interesting to note that the part-worth
utilities did not vary significantly across the test
areas. In fact, similar patterns regarding the
importance of the respective attributes of fixed
Internet offers emerged across all four countries.
Price was the most important attribute in all the
test areas, accounting for about 20% of
respondents’ decisions made in the conjoint
experiment. Download speed and the network
neutrality-related attributes of data caps and video
streaming were the second most important ones,
with each being roughly half as important as price.
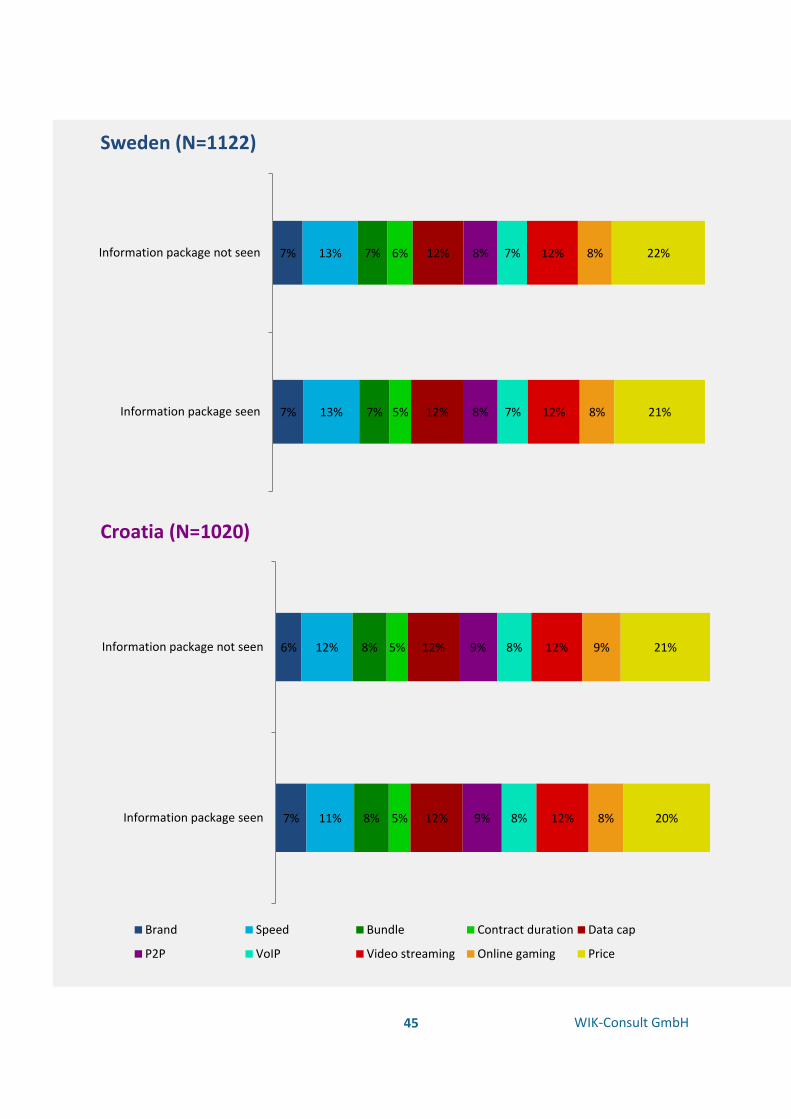
45
WIK-Consult GmbH
7%
7%
13%
13%
7%
7%
5%
6%
12%
12%
8%
8%
7%
7%
12%
12%
8%
8%
21%
22%
Information package seen
Information package not seen
7%
6%
11%
12%
8%
8%
5%
5%
12%
12%
9%
9%
8%
8%
12%
12%
8%
9%
20%
21%
Information package seen
Information package not seen
Brand Speed Bundle Contract duration Data cap
P2P VoIP Video streaming Online gaming Price
Sweden (N=1122)
Croatia (N=1020)
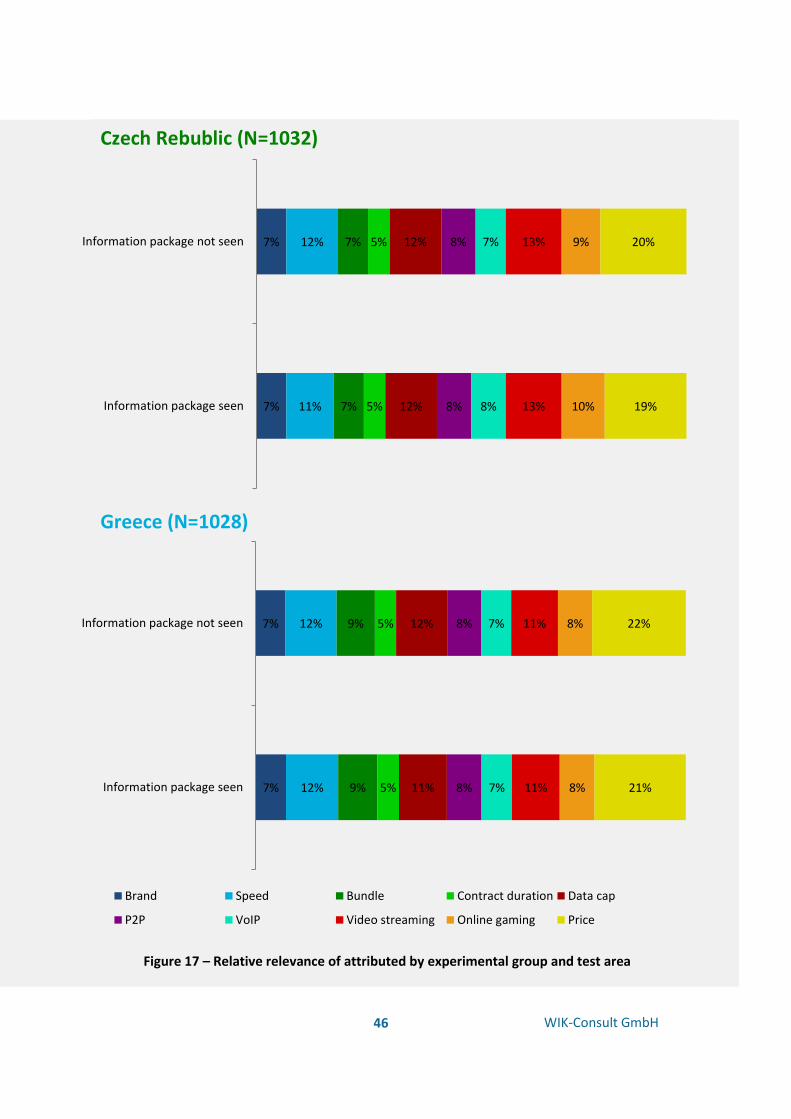
46
WIK-Consult GmbH
7%
7%
11%
12%
7%
7%
5%
5%
12%
12%
8%
8%
8%
7%
13%
13%
10%
9%
19%
20%
Information package seen
Information package not seen
7%
7%
12%
12%
9%
9%
5%
5%
11%
12%
8%
8%
7%
7%
11%
11%
8%
8%
21%
22%
Information package seen
Information package not seen
Brand Speed Bundle Contract duration Data cap
P2P VoIP Video streaming Online gaming Price
Greece (N=1028)
Czech Rebublic (N=1032)
Figure 17 – Relative relevance of attributed by experimental group and test area
47
WIK-Consult GmbH
How to interpret part-worth utilities
For ease of interpretation, raw part-worth utility values were transformed by scaling the part-
worth utility value of the least attractive level of an attribute to zero. This does not mean that
the least preferred level is not attractive to consumers at all, yet it is least attractive among all
the levels tested within an attribute. Other than that, part-worth utilities are interval scaled and
do not carry an inherent meaning. Consequently, they are to be interpreted only relative to each
other (e.g. level A is twice as attractive as level B).
Principles of interpretation are as follows:
1 The least attractive attribute level is the baseline for interpretation per attribute. It is set to
zero, yet this does not reflect that this level is not attractive at all.
2 Absolute values may not be interpreted across attributes, test areas or subsamples (e.g.
experimental groups or consumer segments). This is also the case for differences: absolute
differences between two levels may not be compared across attributes, test areas or
subsamples.
3 For basic interpretation, ranks of levels within an attribute may be considered. Differences
in terms of ranks of levels within an attribute may be compared between test areas or
subsamples.
4 Conclusions about the amount of attractiveness of a specific level may be drawn in a
relative fashion considering the range of part-worth utilities within an attribute. Increases
and decreases in attractiveness may be calculated and then compared in a relative manner
(i.e. the difference between level A and level B vs the difference between level B and level
C).
The figure 18 provides a fictitious reading example. In all test areas, the least attractive level is
set to zero. In Country 3, the range from the least attractive level D to level A is twice as large as
the range from level D to level B. Thus, level A is twice as attractive as level B. When comparing
level B and level C, the range from the least attractive level D to level B is twice as large as the
range from level D to level C. In conclusion, level B is twice as attractive as level C when
compared to the least attractive level. Although absolute values differ, the same relation can be
described with respect to Country 2 results.

48
WIK-Consult GmbH
0
15
30
90
Country 2
0
50
75
100
Attributelevel 4
Attributelevel 3
Attributelevel 2
Attributelevel 1
Country 1
0
20
40
80
Country 3
0
50
100
120
Country 4
The least attractive level within
an attribute is set to zero.
In both Country 2 and 3, the increase in attractiveness
from level C to B is as high as the increase from level D
to level C. Level B is twice as attractive as level C when
compared to the least attractive level D.
In Country 3, the increase in attractiveness from level B to
level A is as high as the increase fro m level D to level B.
Level A is twice as attractive as level B when compared to
the least attractive level D.
Figure 18 - Reading example part-worth utilities
Download speed was slightly more important in
Sweden than in Croatia, with the Czech Republic
and Greece falling in between. This concurs with
the finding from the Swedish focus groups that
highlighted the importance of high download
speeds for these consumers. Bundling, P2P, VoIP,
brand and contract duration form a group of
attributes that play less of a role in consumers’
decisions than the other attributes analysed.
While the above comparisons of the different
attributes reflect their relative importance
compared to each other in the respondents’
decision-making process, they do not give any
insight into the specific level of each attribute that
they prefer. Conclusions regarding these levels
have to be made on the basis of part-worth
utilities. As was the case with the conjoint analysis,
the part-worth utilities for the preferred attribute
levels were by and large the same, irrespective of
whether consumers had seen the information
package or not.

49
WIK-Consult GmbH
The data cap attribute represents one of the two network neutrality-related attributes most relevant for
consumers’ purchase decisions. To the best knowledge of the authors of this study, we are the first to test
this attribute in the context of the at-home usage situation. Within that, our study also appears to be the
first one to test the effect of zero-rating. Although more prevalent for mobile IAS contracts, our results
provide interesting and novel insights for policymakers and market actors alike.
Looking at the different types of data caps, offers without a data cap were clearly preferred to those that
included one. This is not surprising, given that this is the most common type of offer found in the market
today. Naturally, consumers are unlikely to want the additional concern of a data cap limiting their at-
home data consumption. Offers including a 50 GB data cap only reached about 60% to 75% of the
attractiveness of offers that did not include one. Unsurprisingly, a data cap of 50 GB per month was
preferred to one of 10 GB per month.
81
51
49
49
46
13
6
5
0
Croatia (N=1020)
64
47
42
44
40
11
7
6
0
Czech Republic (N=1032)
60
39
39
39
35
11
6
5
0
Greece (N=1028)
70
51
45
43
44
14
5
6
0
Sweden (N=1122)
No data cap
50 GB, your favourite video streaming
application does not count towards the cap
50 GB, your favourite VoIP application does
not count towards the cap
50 GB, your favourite online game does not
count towards the cap
10 GB, your favourite video streaming
application does not count towards the cap
50 GB
10 GB
10 GB, your favourite
VoIP application does
not count towards the
cap
Figure 19 - Part-worth utilities for the data cap attribute by test area
10 GB, your favourite
online game does not
count towards the cap

50
WIK-Consult GmbH
As regards zero-rating of specific applications, our
results indicate that consumers exhibit some
consciousness of their own data consumption. It is
therefore interesting to note that zero-rating of
specific applications has almost no effect when it is
offered combined with a data cap of 50 GB, i.e.
one that the majority of consumers are unlikely to
reach in a normal month of online activity.
However, zero-rating and within that in particular
zero-rating of one’s favourite video application had
a significant (positive) effect on the part-worth
utility when it was linked to a data cap of 10 GB.
One would suspect that this effect may be linked
to consumers’ experiences from their mobile IAS
contracts. A split by respondents with and without
mobile access to the Internet supports this at least
partly. In three out of four test areas, the part-
worth utility for offers with a data cap of 10 GB
and their favourite video streaming application
zero-rated increased noticeably when the
respondent also has a contract for mobile Internet
access as compared to when the respondent does
not have such a contract. Again, this finding calls
for more in-depth research into this matter. For
instance, it will be interesting to know what
combination of data cap and zero-rating may offer
most value to consumers, whether there are
combinations that lead to consumer dynamics in
the market for IAS, and whether this would have
significant effects on competition and innovation.
The part-worth utilities for the remaining network
neutrality-related attributes also showed some
surprising results. Building on the results of the
focus group discussions, these attributes related to
the levels of access to different applications (video
streaming, VoIP, P2P, online gaming) – prioritised,
normal (i.e. best-effort Internet as the consumers
know it), slowed down and blocked access.
The attributes related to the levels of access to
different Internet applications (video streaming,
VoIP, P2P, online gaming) were featured in the
questionnaire in such a way so as not to exclude
one another. Consequently, the most rational
behaviour for any respondent would have been to
show a preference for prioritised service across all
four applications at the lowest price. In this light,
the consistent preference for normal access across
all applications is surprising and merits further
discussion. It should be noted that the relative
part-worth utility of normal access was usually
slightly higher than the one of prioritised access,
but significantly higher than the one for restricted
access. Blocked access was always clearly the least
preferred level.
First, it may be argued that respondents did not
understand the meaning of the specific attribute
levels. If this had been the case, one would have
expected the part-worth utilities of the test and
control groups of respondents to differ. However,
our analysis did not reveal any significant
differences. Consequently, there is no indication
that there was an issue with respondents’
comprehension of the attributes themselves.
Having ruled out a fundamental methodological
problem, several other explanations seem
possible. Given that this is the first study to
research consumers’ preferences for network
neutrality-related attributes in depth, all these
explanations should be interpreted with care.
A first potential explanation is that normal access
referring essentially to the best-effort Internet as
consumers know it in their respective country
should be understood as a must-be quality.21 In
21 This refers to Kano’s theory of customer satisfaction. A must-be quality describes an attribute that is essential to the product’s use but is commonly not mentioned in any customer satisfaction survey because it is so fundamental. An example that is typically used is a leaking milk carton or a butcher’s shop that is not clean. No one would opt to purchase such a carton or any meat from this butcher. Nonetheless, these are attributes that are not mentioned unprompted as they are too obvious. Note that in our survey by mentioning the specific level we did prompt respondents.

51
WIK-Consult GmbH
72
62
39
0
56
49
29
0
55
47
26
0
52
45
27
0
can be used normally
prioritised
slowed down
blocked
62
57
34
0
51
45
27
0
46
43
25
0
44
39
24
0
can be used normally
prioritised
slowed down
blocked
Figure 21 - Part-worth utilities for the VoIP services attribute by test area
Figure 20 - Part-worth utilities for the P2P/filesharing attribute by test area
Croatia
(N=1020)
Czech
Rebublic
(N=1032)
Greece
(N=1028)
Sweden
(N=1122)
Greece
(N=1028)
Sweden
(N=1122)
Czech
Rebublic
(N=1032)
Croatia
(N=1020)
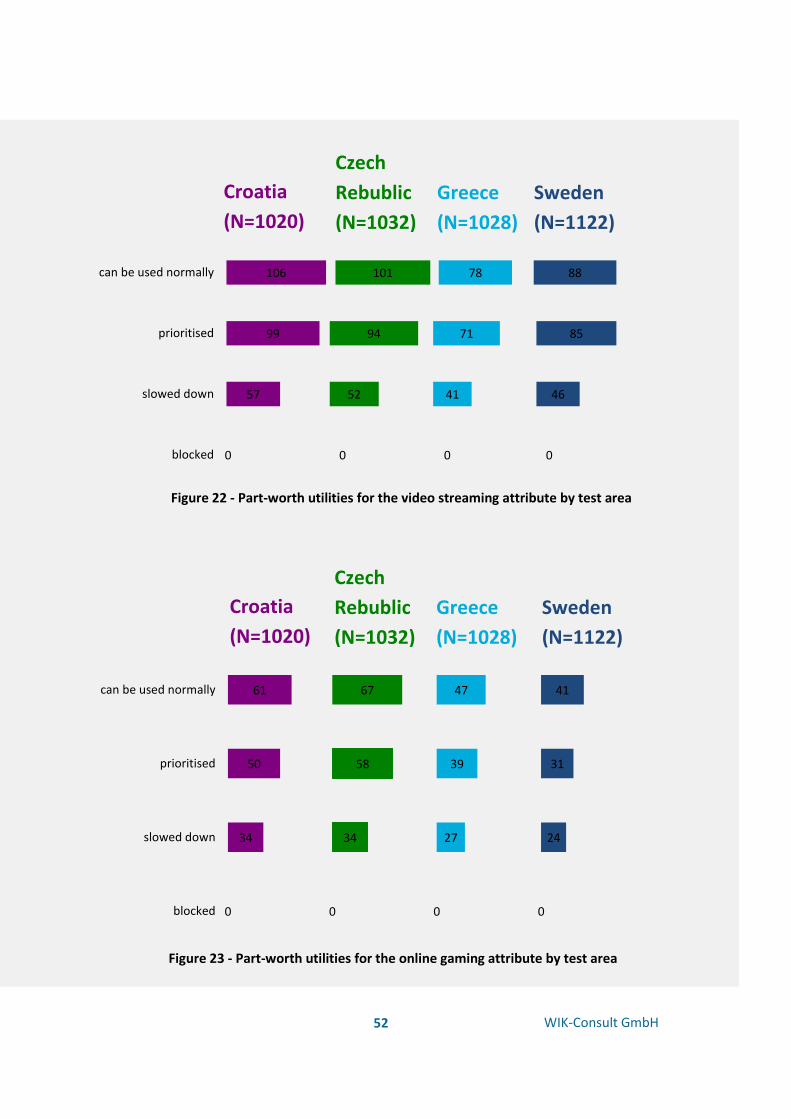
52
WIK-Consult GmbH
61
50
34
0
67
58
34
0
47
39
27
0
41
31
24
0
can be used normally
prioritised
slowed down
blocked
Figure 23 - Part-worth utilities for the online gaming attribute by test area
106
99
57
0
101
94
52
0
78
71
41
0
88
85
46
0
can be used normally
prioritised
slowed down
blocked
Figure 22 - Part-worth utilities for the video streaming attribute by test area
Greece
(N=1028)
Sweden
(N=1122)
Czech
Rebublic
(N=1032)
Croatia
(N=1020)
Greece
(N=1028)
Sweden
(N=1122)
Czech
Rebublic
(N=1032)
Croatia
(N=1020)

53
WIK-Consult GmbH
light of the focus group results indicating that
unrestricted access to any content or applications
is the core characteristic of the Internet and is
often equated to network neutrality, this
explanation seems sensible. While this is a
convincing explanation for the substantial drop in
part-worth utility for the restricted and blocked
access levels as well as the importance of normal
access, it fails to fully explain why normal is
consistently preferred over prioritised access.
This aspect may be better explained by consumers’
concept of fairness as regards network neutrality
that transpired from the focus group discussions.
Consumers appear to find it fair that certain
government, disaster relief or relevant security
applications are prioritised on the Internet. Some
groups were also interested in purchasing
prioritised services. However, no one was really in
favour of receiving such prioritised services at the
expense of other consumers. This underlying
construct could be an explanation for the observed
preference patterns.
Another explanation, in particular in the at-home
usage situation that has been investigated in this
study, is that consumers are simply unfamiliar with
the benefits that prioritised access to a specific
application may bring them. Such offers are very
rare at the moment. As the Internet is primarily an
experience good,22 the actual benefit can only be
experienced after the purchase. Consequently,
consumers may have quite simply opted for the
most familiar option as they were doubtful about
the actual benefit of prioritised access. This
explanation is supported by the fact that most
respondents were quite satisfied with their current
IAS.
Finally, it may be argued that respondents already
accounted for the long-term effects of the
prioritised level such as less innovation or
foreclosure on the Internet. Given the small role
such arguments played in the focus group
discussions and also the fact that part-worth
utilities did not differ between the test and control
groups of respondents, this explanation seems
unlikely.
In sum, to answer the key underlying question of
“Do consumers actually prefer the best-effort
Internet, or do they rather prefer the Internet they
know over an Internet they have not yet
experienced?”, more research has to be
undertaken. This research needs to address all the
possible explanations outlined above. As it seems
unlikely that one study could test all the
explanations at once, the most relevant starting
point appears to be a study that can investigate
consumers’ preferences for normal (unmanaged)
and quality-differentiated access to Internet
applications based on their actual experience. Such
a study could measure consumers’ satisfaction
with different experiences, investigate the impact
on purchase choices (in comparison of ex ante and
ex post purchase choices), and it could provide in-
depth results on the trade-offs consumers would
be willing to make. Most importantly, it would
contribute to the discussion about whether
network neutrality should be understood as a
must-be quality for consumers.
22 An experience good describes a good whose actual quality a consumer can only learn about by using or consuming it.

54
WIK-Consult GmbH
The remaining attributes referring to general
characteristics of IAS products have been
extensively tested in other studies23 using conjoint
analysis. Our results by and large reflect the
findings of these studies. As regards the most
important attribute for consumers’ purchase
choices, i.e. price, we found that consumers
naturally prefer lower price24 levels over higher
price levels in general. Equally unsurprising, higher
rates of download speed were preferred over
lower rates of download speed across all test
areas. On the whole, speeds up to 100 MBit/s were
found to be about twice as attractive as speeds up
to 10 MBit/s.
Bundled services were preferred over stand-alone
Internet offers in general. Bundles including
Internet, telephone and TV were most attractive
across all four countries, but there were
differences between countries regarding the
relative attractiveness of bundles that are not
triple play. In Croatia, the Czech Republic and
Sweden, bundles including Internet and TV were
preferred to those including Internet and
telephone, while in Greece these two
combinations of services were seen as equally
attractive.
The analysis of the part-worth utilities for brand
revealed that Hrvatski Telekom was the most
attractive ISP in Croatia, with Czechs preferring O2
Czech Republic. OTE was the most attractive ISP in
Greece, about four times as attractive as Forthnet,
which is ranked second. In Sweden, highest ranked
Telia was more than twice as attractive as local
Internet providers.25 The analysis also
demonstrates consumers’ clear preference for
their current ISP. This supports the results gained
in the section on why respondents are unlikely to
switch, where the most important reason was that
they were satisfied with their current ISP.
For minimum contract duration, one month was
most attractive in Croatia and Sweden, while
twelve months was preferred in the Czech
Republic and in Greece. Across all the test areas,
the minimum contract duration of 24 months was
the least attractive.
Consumer segments
To gain a more in-depth understanding of the
factors that drive consumer preferences for IAS
products, we identified mutually exclusive
consumer segments. To achieve this objective,
post hoc market segmentation was conducted with
the conjoint results used as input data.
Segmentation was conducted across all the test
areas in order to derive stable segments that are
valid for all the countries and can be applied on
23 Van Camp, F. (2012): FTTH Moves the Market. FTTH Conference 2012, Munich. Deere, G.; Brice, L. & Barton, S. (2008): Winning and Losing in the Multi-play Market using Conjoint and Construct. Research sponsored by BT Wholesale. Ipsos MediaCT. Ida, T. & Sato, M. (2006): Conjoint Analysis of Consumer Preferences for Broadband Services in Japan. The Kyoto Economic Review, 5(2), 115–127. Klie, A. (2012): Broadband: What do Consumers Want? Examining Willingness-to-pay. A work project, presented as part of the requirements for the award of a master’s degree in Economics from the NOVA – School of Business and Economics. Rosston, G., Savage S. J., & Waldman, D. M. (2010): Household Demand for Broadband Internet in 2010. The B.E. Journal of Economic Analysis & Policy, 10(1), Article 79. Takano, N. (2013): A Conjoint Analysis of a Next Generation Network (NGN) in Japan. Res Socionetwork Strat: in press. The Full Results Report features additional references.
24 Prices are quoted throughout this report in local currency in order to reflect survey results in the test areas as closely as possible. Exchange rates for November 2014 should be applied when converting prices to another currency. XE reports the following average exchange rates for euros in November 2014: HRK/EUR = 0.1302, CZK/EUR = 0.0361, SEK/EUR = 0.1081.
25 For the purpose of this study as well as the survey we have conducted, “Local Internet Providers” refers to Internet providers within the test areas that serve only a limited regional or local area within the test area (country).
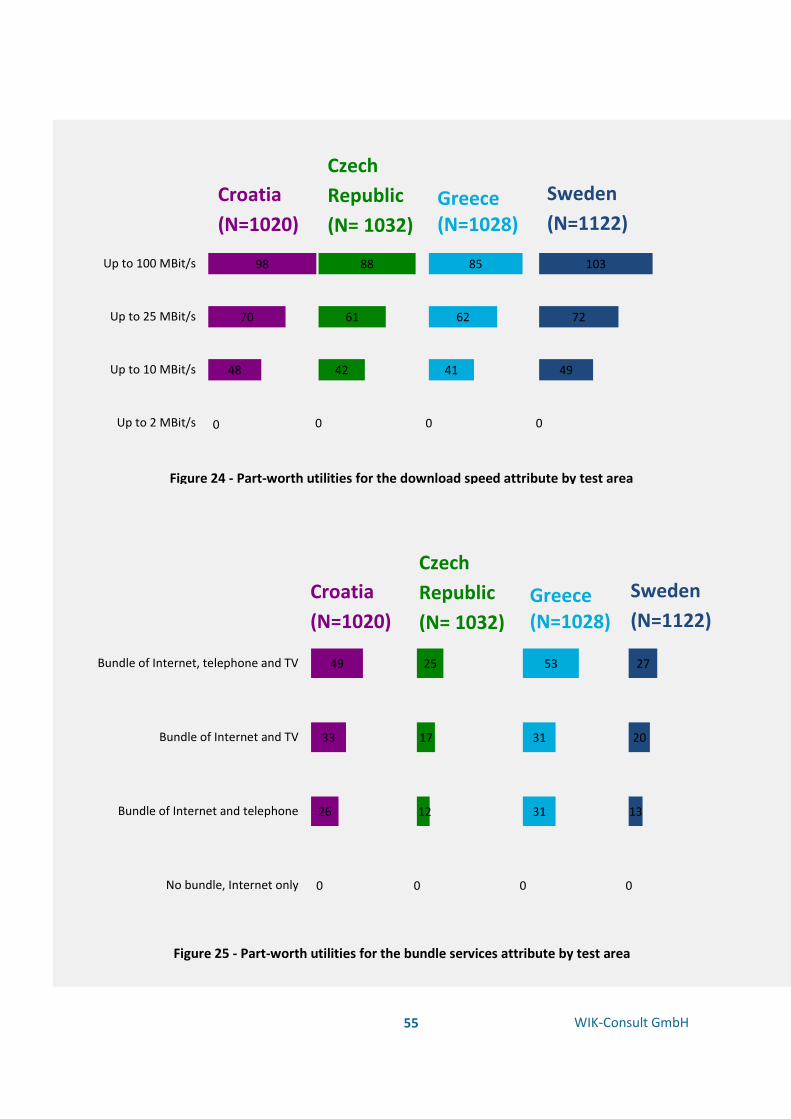
55
WIK-Consult GmbH
98
70
48
0
88
61
42
0
85
62
41
0
103
72
49
0
Up to 100 MBit/s
Up to 25 MBit/s
Up to 10 MBit/s
Up to 2 MBit/s
Croatia
(N=1020)
Czech
Republic
(N= 1032)
Sweden
(N=1122) Greece (N=1028)
Figure 24 - Part-worth utilities for the download speed attribute by test area
49
33
26
0
25
17
12
0
53
31
31
0
27
20
13
0
Bundle of Internet, telephone and TV
Bundle of Internet and TV
Bundle of Internet and telephone
No bundle, Internet only
Figure 25 - Part-worth utilities for the bundle services attribute by test area
Croatia
(N=1020)
Czech
Republic
(N= 1032)
Sweden
(N=1122) Greece (N=1028)
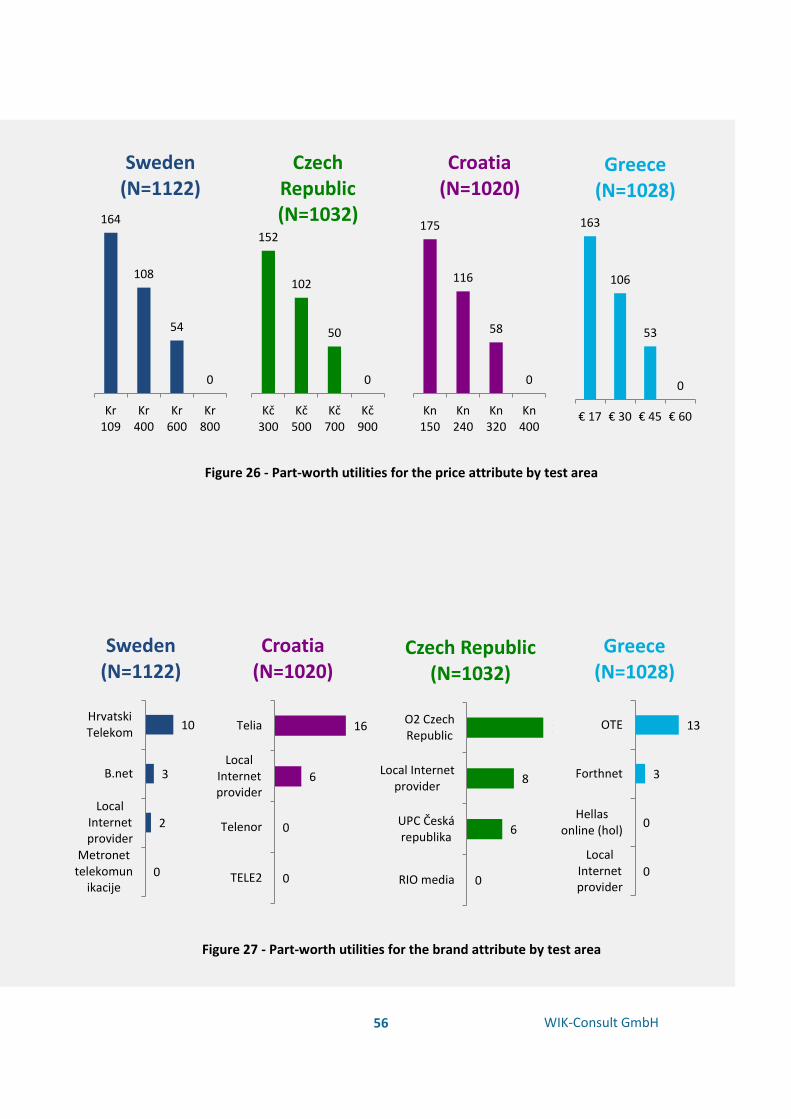
56
WIK-Consult GmbH
164
108
54
0
Kr109
Kr400
Kr600
Kr800
Sweden (N=1122)
152
102
50
0
Kč300
Kč500
Kč700
Kč900
Czech Republic (N=1032)
175
116
58
0
Kn150
Kn240
Kn320
Kn400
Croatia (N=1020)
163
106
53
0
€ 17 € 30 € 45 € 60
Greece (N=1028)
Figure 26 - Part-worth utilities for the price attribute by test area
10
3
2
0
HrvatskiTelekom
B.net
LocalInternetprovider
Metronettelekomun
ikacije
Sweden (N=1122)
16
6
0
0
Telia
LocalInternetprovider
Telenor
TELE2
Croatia (N=1020)
13
8
6
0
O2 CzechRepublic
Local Internetprovider
UPC Českárepublika
RIO media
Czech Republic (N=1032)
13
3
0
0
OTE
Forthnet
Hellasonline (hol)
LocalInternetprovider
Greece (N=1028)
Figure 27 - Part-worth utilities for the brand attribute by test area
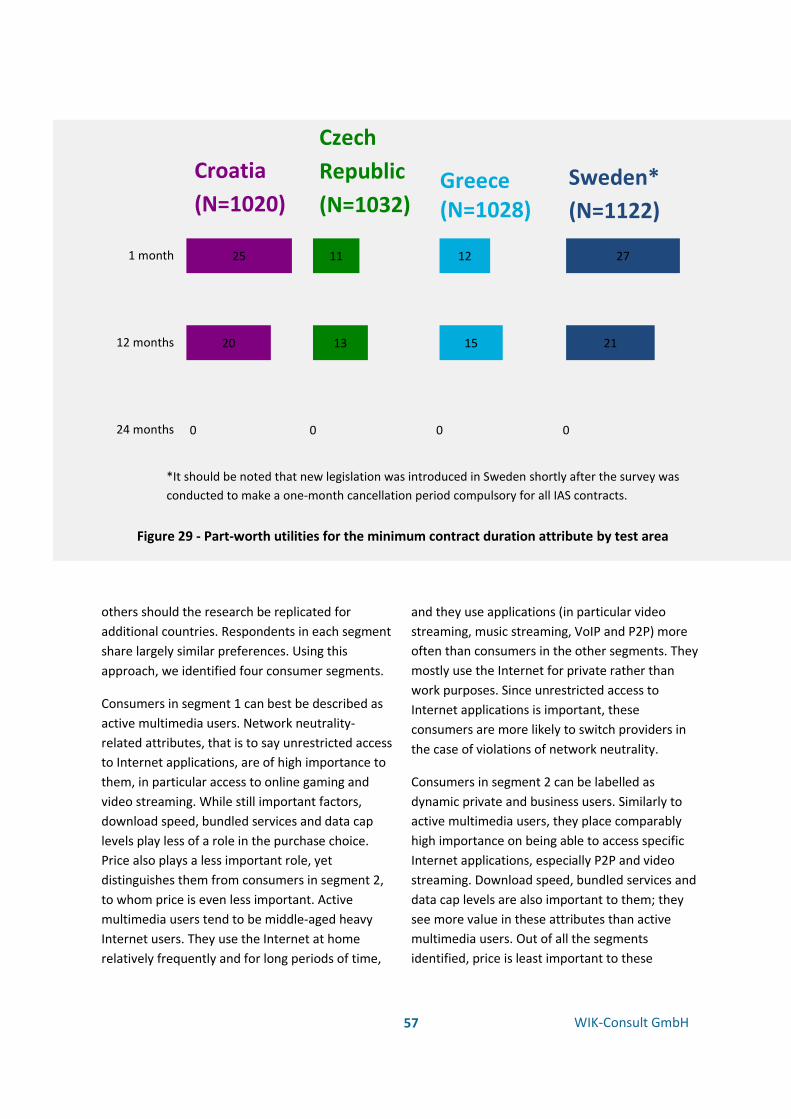
57
WIK-Consult GmbH
others should the research be replicated for
additional countries. Respondents in each segment
share largely similar preferences. Using this
approach, we identified four consumer segments.
Consumers in segment 1 can best be described as
active multimedia users. Network neutrality-
related attributes, that is to say unrestricted access
to Internet applications, are of high importance to
them, in particular access to online gaming and
video streaming. While still important factors,
download speed, bundled services and data cap
levels play less of a role in the purchase choice.
Price also plays a less important role, yet
distinguishes them from consumers in segment 2,
to whom price is even less important. Active
multimedia users tend to be middle-aged heavy
Internet users. They use the Internet at home
relatively frequently and for long periods of time,
and they use applications (in particular video
streaming, music streaming, VoIP and P2P) more
often than consumers in the other segments. They
mostly use the Internet for private rather than
work purposes. Since unrestricted access to
Internet applications is important, these
consumers are more likely to switch providers in
the case of violations of network neutrality.
Consumers in segment 2 can be labelled as
dynamic private and business users. Similarly to
active multimedia users, they place comparably
high importance on being able to access specific
Internet applications, especially P2P and video
streaming. Download speed, bundled services and
data cap levels are also important to them; they
see more value in these attributes than active
multimedia users. Out of all the segments
identified, price is least important to these
25
20
0
11
13
0
12
15
0
27
21
0
1 month
12 months
24 months
Figure 29 - Part-worth utilities for the minimum contract duration attribute by test area
*It should be noted that new legislation was introduced in Sweden shortly after the survey was
conducted to make a one-month cancellation period compulsory for all IAS contracts.
Croatia
(N=1020)
Czech
Republic
(N=1032)Greece (N=1028)
Sweden*
(N=1122)
58
WIK-Consult GmbH
consumers. They are predominantly young males
and are heavy Internet users. They use applications
such as music and video streaming, P2P, IPTV and
VoIP more often than the average respondent, and
they use the Internet for both private and business
purposes. Dynamic private and business users are
more likely to have positive associations with the
Internet in general. As the importance of network
neutrality-related attributes is high, there is a high
likelihood of switching due to violations of network
neutrality among these consumers.
Consumers in segment 3 can be described as
conservative brand users. Within this segment,
download speed, bundled services and data cap
levels are of high importance. This is also the case
for brand and price; these consumers value brand
more than consumers in all other segments, and
they value price more than active multimedia and
dynamic private and business users. Network
neutrality-related attributes are of comparably
lower importance. Conservative brand users are
older and use the Internet at home less frequently
and for shorter periods. They use specific
applications less often, and they mainly use the
Internet for private purposes. They are also less
likely to switch providers in the case of violations
of network neutrality. Consumers in this segment
feel that the social aspects of the Internet, for
example communicating with friends online, are of
less importance than its other uses.
Consumers in segment 4 are pragmatic average
users. Of all the segments identified, price is most
important to these consumers, while they value
network neutrality-related attributes, download
speed, bundling and data cap levels the least. The
consumers in this segment are older than those in
Main drivers for purchase choice criteria
Despite clear-cut differences in the perception of products with and without deviations from
network neutrality across test areas in the focus groups, part-worth utilities show little
differences across test areas. This is even more surprising given the sometimes fundamental
differences in the electronic communication market environment in the test areas. So, if it is
not the market environment that drives differences in consumer perceptions, attitudes and
purchase decision criteria, what is it then?
The four consumer segments that were identified from the preference patterns in the conjoint
analysis may provide an answer. As these four segments were built from the choice data, it is
not surprising that they show significant differences in their choices. However, they also shed
light on what may actually drive these differences, namely both socio-demographic variables
and attitudes towards the Internet – or, in essence, the role of the Internet in one’s life.
These underlying variables appear to be consistently attached to the respective segments
across test areas. This clearly highlights that such underlying variables actually drive choices,
not the market environment. However, the market environment is very likely to shape the size
of the respective segments in each test area.

59
WIK-Consult GmbH
6
6
8
7
9
15
14
9
7
9
10
7
4
4
5
7
11
15
13
10
11
10
7
6
9
8
7
7
15
14
9
9
11
7
8
7
16
11
20
32
Active multimedia users
Dynamic private and business users
Conservative brand users
Pragmatic average users
Croatia (N=1020)
7
6
8
7
9
16
15
10
6
7
8
7
4
5
5
6
11
15
13
9
10
10
6
6
8
7
6
6
16
14
10
10
13
8
8
8
16
11
20
32
Active multimedia users
Dynamic private and business users
Conservative brand users
Pragmatic average users
Czech Republic (N=1032)
7
7
8
7
9
16
14
9
8
10
11
8
4
5
5
5
11
14
13
9
10
10
7
7
9
7
6
6
14
12
9
8
10
7
8
7
18
12
20
32
Active multimedia users
Dynamic private and business users
Conservative brand users
Pragmatic average users
Greece (N=1028)
7
6
8
7
11
17
16
11
6
7
8
7
4
5
6
7
11
15
13
10
10
10
6
6
8
7
6
6
15
14
9
8
10
7
7
7
17
12
21
33
Active multimedia users
Dynamic private and business users
Conservative brand users
Pragmatic average users
Brand Speed Bundle Contract duration Data cap
P2P VoIP Video streaming Online gaming Price
Sweden (N=1122)
Figure 30 - Relative importance of attributes by segment and test area (in %)
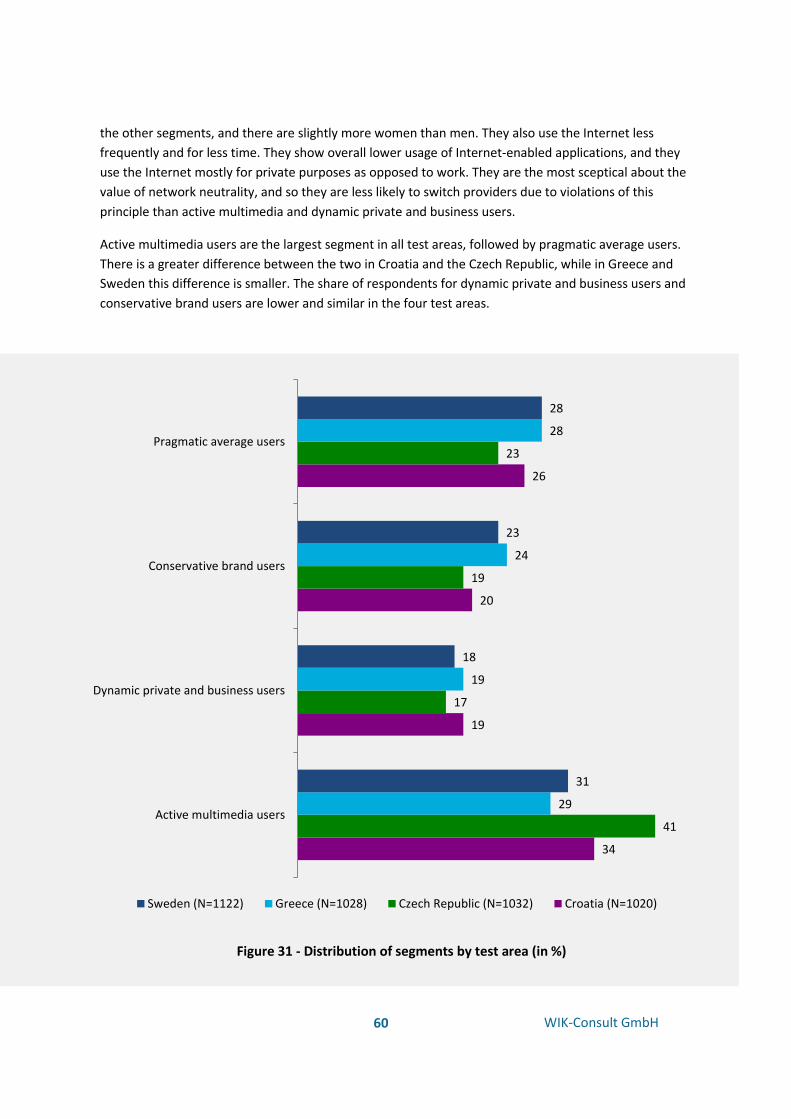
60
WIK-Consult GmbH
34
19
20
26
41
17
19
23
29
19
24
28
31
18
23
28
Active multimedia users
Dynamic private and business users
Conservative brand users
Pragmatic average users
Sweden (N=1122) Greece (N=1028) Czech Republic (N=1032) Croatia (N=1020)
Figure 31 - Distribution of segments by test area (in %)
the other segments, and there are slightly more women than men. They also use the Internet less
frequently and for less time. They show overall lower usage of Internet-enabled applications, and they
use the Internet mostly for private purposes as opposed to work. They are the most sceptical about the
value of network neutrality, and so they are less likely to switch providers due to violations of this
principle than active multimedia and dynamic private and business users.
Active multimedia users are the largest segment in all test areas, followed by pragmatic average users.
There is a greater difference between the two in Croatia and the Czech Republic, while in Greece and
Sweden this difference is smaller. The share of respondents for dynamic private and business users and
conservative brand users are lower and similar in the four test areas.

61
WIK-Consult GmbH
Consumers care about free, unrestricted, reliable access to and high
quality of content and communication. For them, that is quality of
experience.
Consumers care not only about their own quality of experience, but also
about that of others. Some may thus hesitate to purchase a quality-
differentiated service or even switch if their ISP introduces them.

62
WIK-Consult GmbH
04 | Action
How do consumers’ awareness, interests and desires translate into action? This is a key question for
NRAs and ISPs alike. This final chapter of our study presents answers to this question as we
investigate consumers’ propensity to switch their ISPs due to their approach to network neutrality.
Within that this chapter provides an indication for consumers’ willingness-to-pay for network
neutrality. Overall, it appears that there is a significant trade-off ahead for ISPs if they decide to
introduce quality-differentiated services.
In the previous chapter the question of switching
was brought up in the context of violations of
network neutrality. This chapter explores switching
in more depth, focusing on how likely consumers
are to switch in general and what drivers exist that
may increase their propensity to switch.
Early on in the survey, respondents were asked if
they had ever switched ISPs for home Internet
access. To give more detailed responses, they
could choose from three options: no, yes because I
had to (for example, due to moving house), and
yes because I wanted to (for example, due to
finding a better offer). The responses to this
question demonstrate generally strong customer
loyalty to their ISP.
In Croatia, the Czech Republic and Sweden, around
half of respondents had never switched in the
past, while in Greece this percentage was
substantially lower at 30%. In Croatia, only 8% of
respondents indicated that they have been forced
to switch ISPs at some point, while in Sweden this
figure was 22%. This is backed up by a finding from
the focus group discussions, where numerous
Swedish participants stated that they feel that
their Internet access is closely linked to their house
and would have to be changed if they moved.
Some also stated that it is not easy to switch
without moving house. The highest proportion of
respondents who had switched was found in
Greece (62%). A potential explanation for this is
that the severity of the economic crisis forced
Greeks to find ways to save money wherever
possible, while the other three test areas weren’t
affected so badly by the financial crisis.
The question as to whether consumers actually
have the choice to switch played a role in all of the
focus group discussions in some way, so a question
related to this was included in the survey. Almost
half (46%) of the Swedish respondents stated that
they feel that they do not have a true choice when
it comes to choosing an ISP for home Internet
access. This was the highest percentage out of all
of the test areas, and reflects the opinions
expressed in the Swedish focus groups. The lowest
percentage of agreement was found in Greece,
which could be a result of the fact that many Greek
respondents have switched ISP before. However,
despite the fact that many of them had switched
their provider recently, more than half agreed with
the statement that they are generally unlikely to
switch. Nevertheless, this figure is still higher in
the other test areas. For instance, 72% agreed with
the statement in Sweden.
Respondents who indicated that they are unlikely
to switch ISPs were then asked about the reasons
for this; they were able to select three options
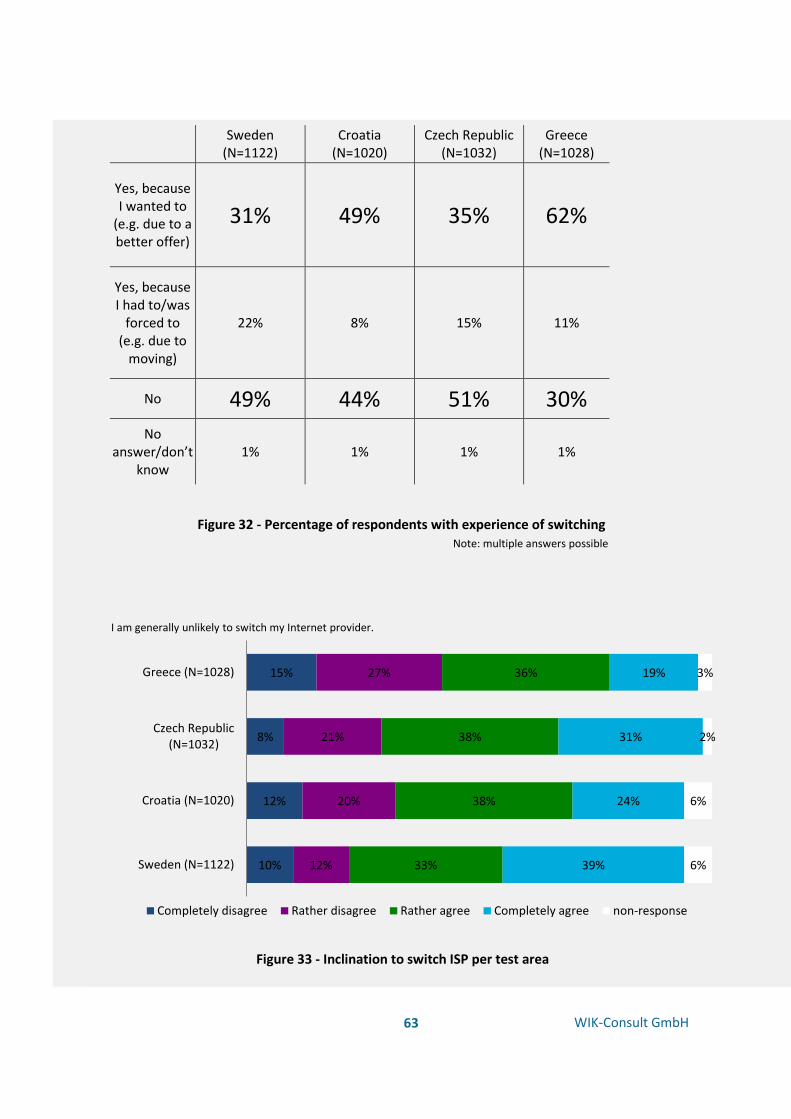
63
WIK-Consult GmbH
Sweden (N=1122)
Croatia (N=1020)
Czech Republic (N=1032)
Greece (N=1028)
Yes, because I wanted to
(e.g. due to a better offer)
31% 49% 35% 62%
Yes, because I had to/was
forced to (e.g. due to
moving)
22% 8% 15% 11%
No 49% 44% 51% 30%
No answer/don’t
know 1% 1% 1% 1%
Figure 32 - Percentage of respondents with experience of switching Note: multiple answers possible
10%
12%
8%
15%
12%
20%
21%
27%
33%
38%
38%
36%
39%
24%
31%
19%
6%
6%
2%
3%
Sweden (N=1122)
Croatia (N=1020)
Czech Republic(N=1032)
Greece (N=1028)
Completely disagree Rather disagree Rather agree Completely agree non-response
I am generally unlikely to switch my Internet provider.
Figure 33 - Inclination to switch ISP per test area

64
WIK-Consult GmbH
from the chart 35. The most common response in
all four test areas was that they are satisfied with
their current ISP and thus see no reason to switch,
which confirms the results from the question on
satisfaction described earlier in this report.
Another significant reason across all the test areas
was that respondents don’t feel that there is a
better deal available with any other ISPs.
From this point, the reasons differ across test
areas. Hurdles perceived by the Croatian
respondents include the lack of alternative
providers and long contract durations, as well as
the risk of loss of service or paying double and the
effort needed to undertake the switching process.
Czech respondents also showed concern about the
risks associated with switching, but reported that
the other reasons cited by Croatians have less of
an impact on them; in fact, only 8% of Czechs felt
that switching is too much effort, the lowest
percentage out of all the test areas. The Greek
respondents reported comparatively high levels of
concern about paying double, which reflects the
sustained financial crisis in the country. They were
also worried about a temporary loss of service.
However, they do not see a lack of choice as an
issue. Meanwhile, in Sweden the switching process
was seen as being very tedious and difficult, and
consumers find it difficult to compare ISP offers. It
is also interesting to note that a relatively large
percentage were worried about losing their email
address or personal web page as a result of
switching.
32%
22%
27%
39%
15%
34%
34%
29%
29%
28%
25%
20%
17%
12%
12%
8%
7%
4%
2%
4%
Sweden(N=1122)
Croatia(N=1020)
CzechRepublic(N=1032)
Greece(N=1028)
I feel that I do not have a true choice when it comes to deciding for an Internet provider.
Completely disagree Rather disagree Rather agree Completely agree non-response
Figure 34 - Inclination to switch ISP per test area

65
WIK-Consult GmbH
61%
26%
21%
11%
11%
24%
8%
13%
12%
5%
5%
8%
2%
69%
39%
24%
28%
16%
16%
13%
6%
6%
2%
2%
4%
1%
70%
41%
14%
12%
17%
8%
12%
8%
4%
6%
3%
3%
3%
69%
45%
8%
18%
23%
13%
27%
7%
6%
2%
2%
3%
1%
Sweden (N=812) Croatia (N=639)
Czech Republic (N=707) Greece (N=567)
Loss of related services (e.g.
email address, personal web
page) Finding information on Internet
offers is too difficult
Not sure what steps to take
Other
No answer/don’t know
Comparing different Internet
providers is too difficult
Long binding times/minimum
contract durations
No other Internet providers
available for my household
No other Internet providers
offer better value for money
Satisfied with current Internet
provider
Requires too much time/effort
Risk of a temporary loss of
service during the switching
process
Risk of paying for two Internet
providers during the switching
process
Figure 35 - Reasons for not switching ISPs in test areas
66
WIK-Consult GmbH
A study conducted on behalf of the Executive
Agency for Health and Consumers (EAHC)26
approached the issue from the perspective of
those who have already switched. The main reason
for switching providers among these consumers
was commonly found to be price, i.e. they found a
better offer. This was true for 47% of Czech
respondents, 46% of Greeks and 36% of Swedes.27
Another important driver was dissatisfaction with
the previous provider, which also emerged as one
of the strongest drivers for switching in our focus
group discussions. A parallel can be drawn here
with the finding from our survey that most
consumers do not switch because they are
satisfied with their current provider. In fact, a key
finding from the EAHC report is that “the two main
reasons why survey respondents did not even
consider switching are satisfaction with their
current provider [48% of respondents] and a belief
that that provider offers them the best value for
money [25% of respondents]”. When looking at
these results on a national level, it is interesting to
note that satisfaction as a reason for not switching
was higher in Sweden (58%), the Czech Republic
(58%) and Greece (57%) than the European
average of 48%.
In the section of our survey that asked consumers
about their attitudes towards network neutrality
(see Figure 36), the fourth statement
(“Transparency is all that it needs: people will
switch providers if they do not agree with
prioritising or blocking Internet traffic, as long as
they are informed that it takes place”) addressed
the question as to whether consumers will switch
if they disagree with the traffic management
practices of their ISP. There was a high level of
agreement with this statement, particularly among
the Greek28 respondents, of whom 83% agreed
with it, which is statistically significantly more than
in the other test areas. There is also a high
percentage of agreement among consumers in the
other three test areas.29
However, the high level of agreement with this
statement should not be equated with consumers
actually switching ISPs. The agreement shows that
the majority of respondents expect people to
switch providers if two conditions are met, namely
if they disagree with the traffic management
practices of their ISP, and if they are informed that
these practices take place. Knowing that
satisfaction is a key contributor to customer loyalty
and knowing that satisfaction in all test areas is
higher than average in the EU, one would doubt
that awareness about and disagreement with
certain traffic management practices alone would
give sufficient reason for consumers to actually
switch providers. Only consumers who show high
levels of purchase involvement might reasonably
be assumed to translate awareness and
disagreement into switching. For this to happen on
a large scale though, consumers would have to be
dissatisfied with their quality of experience, and
they would have to attribute the reason for
impaired quality to their ISP. We discussed earlier
in this report (see Awareness chapter) that
consumers tend not to blame their ISP when
experiencing major disruptions. Thus, it appears
unlikely that the average consumer who notices a
change in the quality of IAS immediately relates
26 Executive Agency for Health and Consumers (EAHC) (2012): Consumer Market Study on the Functioning of the Market for Internet Access and Provision from a Consumer Perspective. Final Report. Part 1: Synthesis Report. (Note: The EAHC was renamed Consumers, Health, Agriculture and Food Executive Agency (CHAFEA) in 2014.)
27 There is no data available for Croatia.
28
The particularly high levels of agreement in Greece are likely to partly be because more Greek respondents have previous experience of switching so will have overcome their original concerns, providing that the process went smoothly.
29 The figures for Sweden should be interpreted carefully as 25% of respondents did not answer, while 14% did not answer in the Czech Republic.
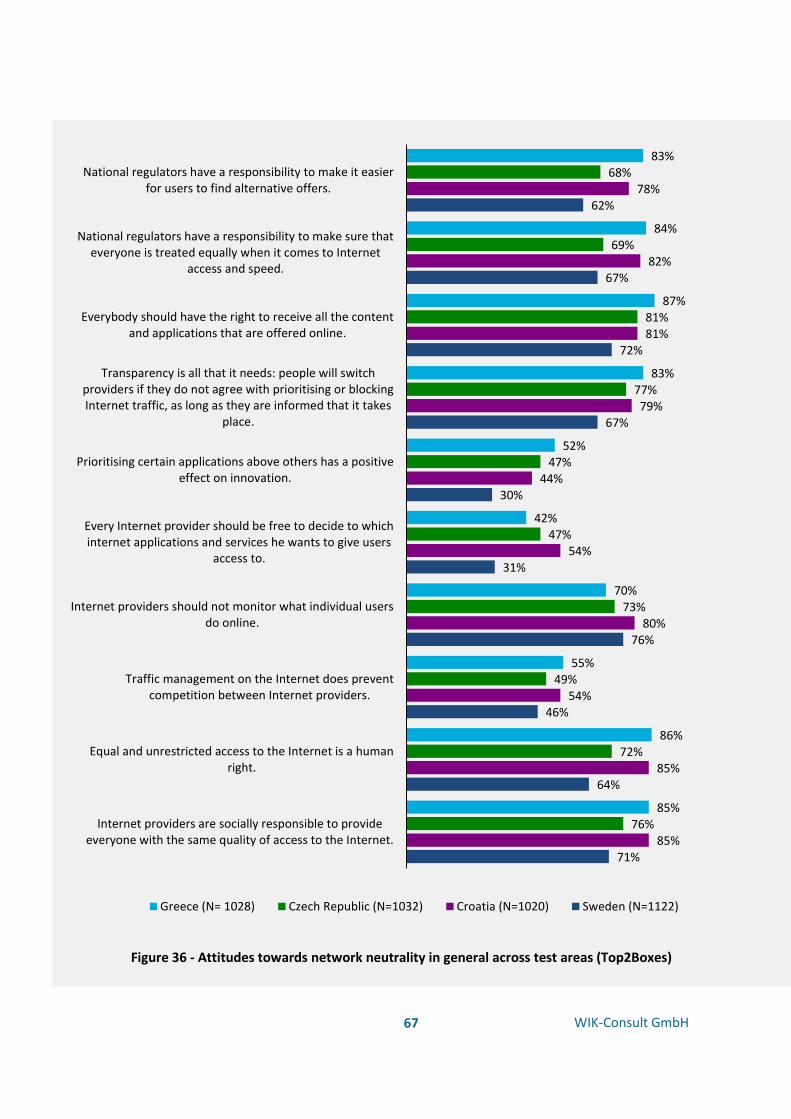
67
WIK-Consult GmbH
71%
64%
46%
76%
31%
30%
67%
72%
67%
62%
85%
85%
54%
80%
54%
44%
79%
81%
82%
78%
76%
72%
49%
73%
47%
47%
77%
81%
69%
68%
85%
86%
55%
70%
42%
52%
83%
87%
84%
83%
Internet providers are socially responsible to provideeveryone with the same quality of access to the Internet.
Equal and unrestricted access to the Internet is a humanright.
Traffic management on the Internet does preventcompetition between Internet providers.
Internet providers should not monitor what individual usersdo online.
Every Internet provider should be free to decide to whichinternet applications and services he wants to give users
access to.
Prioritising certain applications above others has a positiveeffect on innovation.
Transparency is all that it needs: people will switchproviders if they do not agree with prioritising or blockingInternet traffic, as long as they are informed that it takes
place.
Everybody should have the right to receive all the contentand applications that are offered online.
National regulators have a responsibility to make sure thateveryone is treated equally when it comes to Internet
access and speed.
National regulators have a responsibility to make it easierfor users to find alternative offers.
Greece (N= 1028) Czech Republic (N=1032) Croatia (N=1020) Sweden (N=1122)
Figure 36 - Attitudes towards network neutrality in general across test areas (Top2Boxes)

68
WIK-Consult GmbH
30 Across two test areas, there is a high percentage of non-
response for this item: 15% in the Czech Republic and 23% in
Sweden.
that effect to the practices of an ISP, let alone to
any traffic management practices. In order to
explore the effects of new IAS products building on
deviations from network neutrality, further
research into the factors that drive consumer
satisfaction with their at-home Internet access is
needed.
The seventh item in this set of questions (“National
regulators have a responsibility to make it easier
for users to find alternative offers”) addressed the
role of NRAs. Once again, the highest proportion of
agreement was found among the Greek
respondents, where 83% agreed, which is
statistically significantly more than in the other
three test areas. In the Czech Republic (68%) and
Sweden (62%), significantly fewer respondents
agreed with the statement.30

69
WIK-Consult GmbH
81%
74% 71%
64% 59% 57%
80% 84%
74%
64%
56%
64%
76% 70%
65%
58% 53%
62%
74% 69%
60% 55%
41%
59%
If my Internetprovider introduced
data caps forInternet access at
home, I wouldswitch providers.
If my Internetprovider decreasedthe speed for videostreaming unless Ipaid extra, I wouldswitch providers.
If my Internetprovider decreasedthe speed for musicstreaming unless Ipaid extra, I wouldswitch providers.
If my Internetprovider decreased
the speed forP2P/filesharing
unless I paid extra, Iwould switch
providers.
If my Internetprovider decreasedthe speed for onlinegaming unless I paidextra, I would switch
providers.
If my Internetprovider decreasedthe speed for voicechat/VoIP unless Ipaid extra, I wouldswitch providers.
Czech Republic (N=1032)
89% 87% 85% 82%
74% 79%
90% 86% 85% 82%
69%
78% 83%
78% 76% 75%
66% 73%
82% 83% 78% 79%
67% 73%
If my Internetprovider introduced
data caps forInternet access at
home, I wouldswitch providers.
If my Internetprovider decreasedthe speed for videostreaming unless Ipaid extra, I wouldswitch providers.
If my Internetprovider decreasedthe speed for musicstreaming unless Ipaid extra, I wouldswitch providers.
If my Internetprovider decreased
the speed forP2P/filesharing
unless I paid extra, Iwould switch
providers.
If my Internetprovider decreasedthe speed for onlinegaming unless I paidextra, I would switch
providers.
If my Internetprovider decreasedthe speed for voicechat/VoIP unless Ipaid extra, I wouldswitch providers.
Active multimedia users Dynamic private and business users
Conservative brand users Pragmatic average users
Greece (N=1028)
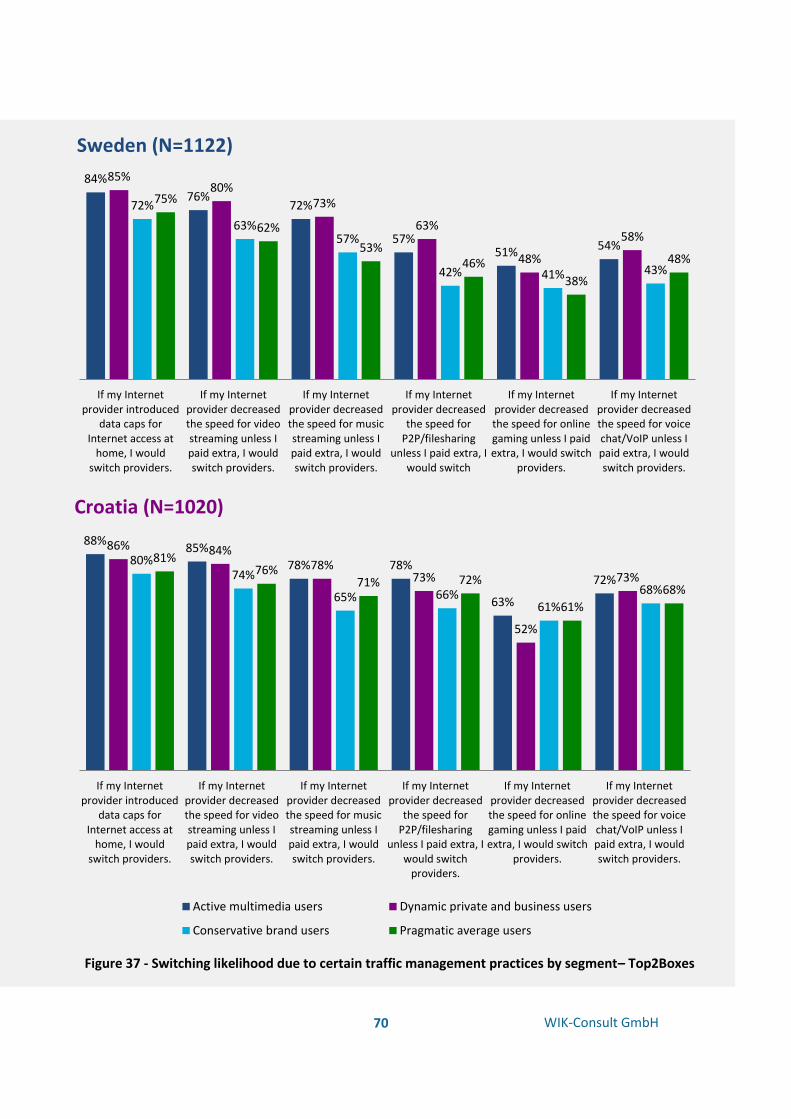
70
WIK-Consult GmbH
84%
76% 72%
57% 51%
54%
85% 80%
73%
63%
48%
58%
72%
63% 57%
42% 41% 43%
75%
62%
53% 46%
38%
48%
If my Internetprovider introduced
data caps forInternet access at
home, I wouldswitch providers.
If my Internetprovider decreasedthe speed for videostreaming unless Ipaid extra, I wouldswitch providers.
If my Internetprovider decreasedthe speed for musicstreaming unless Ipaid extra, I wouldswitch providers.
If my Internetprovider decreased
the speed forP2P/filesharing
unless I paid extra, Iwould switch
providers.
If my Internetprovider decreasedthe speed for onlinegaming unless I paidextra, I would switch
providers.
If my Internetprovider decreasedthe speed for voicechat/VoIP unless Ipaid extra, I wouldswitch providers.
Sweden (N=1122)
Figure 37 - Switching likelihood due to certain traffic management practices by segment– Top2Boxes
88% 85%
78% 78%
63%
72%
86% 84% 78%
73%
52%
73%
80% 74%
65% 66% 61%
68%
81% 76%
71% 72%
61%
68%
If my Internetprovider introduced
data caps forInternet access at
home, I wouldswitch providers.
If my Internetprovider decreasedthe speed for videostreaming unless Ipaid extra, I wouldswitch providers.
If my Internetprovider decreasedthe speed for musicstreaming unless Ipaid extra, I wouldswitch providers.
If my Internetprovider decreased
the speed forP2P/filesharing
unless I paid extra, Iwould switch
providers.
If my Internetprovider decreasedthe speed for onlinegaming unless I paidextra, I would switch
providers.
If my Internetprovider decreasedthe speed for voicechat/VoIP unless Ipaid extra, I wouldswitch providers.
Active multimedia users Dynamic private and business users
Conservative brand users Pragmatic average users
Croatia (N=1020)

71
WIK-Consult GmbH
In order to further analyse the value of network neutrality offers to consumers, the relationship between
price and the network neutrality-related attributes was investigated. This was done by systematically
varying the price as well as the levels of access to certain types of applications. By simulating offers with
different price points and different levels of access to P2P, VoIP services, video streaming and online
gaming, utility scores for these offers were calculated. It was ensured that the other attributes did not
have an impact on this by maintaining them at what had been found to be the most attractive level in the
respective test areas across all the offers.
Figure 38 shows the raw utility scores (averaged across brands) for the example of video streaming in the
four test areas. These scores are shown for each price point tested in relation to normal, prioritised,
slowed down and blocked access. The absolute values should not be compared between test areas but
can be compared between different price points and levels of access within the same country. For
example, in Croatia slowed down access to video streaming at a price of kn 400 is seen as just as
attractive as blocked access at a price of kn 320.
In Croatia, utility scores for video streaming are slightly lower for prioritised access than for normal
access, at the same price point. Scores for slowed down access are even lower, and blocked access scores
lowest. This is also true for P2P, VoIP and online gaming applications. When looking at video streaming,
the option of blocked access at kn 150 is below the utility level of the option of normal access at kn 240.
0
1
2
3
4
5
6
7
8
9
10
access access access access
Normal Prioritised Slowed down Blocked
Kn 150 Kn 240 Kn 320 Kn 400
Croatia (N=1020)

72
WIK-Consult GmbH
0
1
2
3
4
5
6
7
8
9
10
Normal Prioritised Slowed down Blocked
€ 17 € 30 € 45 € 60
0
1
2
3
4
5
6
7
8
9
10
Normal Prioritised Slowed down Blocked
Kč 300 Kč 500 Kč 700 Kč 900
Czech Republic (N=1032)
Greece (N=1028)

73
WIK-Consult GmbH
0
1
2
3
4
5
6
7
8
9
10
Normal Prioritised Slowed down Blocked
Kr 190 Kr 400 Kr 600 Kr 800
This pattern can be seen at all price levels, i.e.
normal access at a particular price is seen as more
attractive than blocked access at the price point
below.
These findings are mirrored in the other test areas,
with only minor differences. In the Czech Republic,
the pattern described for access options to video
streaming, where the utility scores for blocked
access options are lower than the scores for the
normal access option at the next price point up, is
also found for access to online gaming
applications. Meanwhile, in Sweden, the decrease
in utility from prioritised to slowed down access to
online gaming is less distinct.
In sum, the results presented in this chapter
indicate two points. First, depending on the
segment they belong to, consumers differ in their
inclination to switch due to non-neutral IAS offers
as well as in their attitudes towards traffic
management. Thus, it is likely that there is actually
a part of the market that would respond positively
to offers that include deviations from network
neutrality. However, there is also a significant part
that would be strongly inclined to switch if ISPs
were to introduce such deviations. Part of this
group may even switch providers if they
themselves do not experience adverse effects of
traffic management, but because they do not
appreciate the practice as such. Thus, ISPs will
have to carefully investigate their (potential)
consumers’ attitudes and inclination to switch in
developing such IAS products.
Sweden (N=1122)
Figure 38 - Association of price and levels of access to video streaming

74
WIK-Consult GmbH
Second, the results provide an indication of the
monetary value that consumers are likely to attach
to the specific levels of the network neutrality-
related attributes in the conjoint experiment.
More specifically, a consumer would be willing to
spend less on an IAS product that offers only
slowed down access to video streaming as
compared to a product that offers best-effort or
prioritised access. For instance, Internet access
with slowed down video streaming at kn 150 gives
consumers roughly the same utility as best-effort
video streaming at kn 240. Taken together, these
insights mean that there is a trade-off for ISPs that
intend to offer such services. If they were to
introduce offers with deviations from network
neutrality, they might gain additional revenue from
consumers who purchase prioritised services, but
they are also likely to lose consumers who strictly
oppose such measures, or otherwise they would
have to give them a strong incentive to stay
through a discount on their monthly price.
It is difficult to foresee if offering quality-
differentiated services would really pay off for ISPs
overall. This is particularly true as capex and opex
might increase considerably, particularly opex, due
to an increased need for changes to data-
forwarding policies in an ISP’s network that could
be expected to be frequent, near real time and
possibly down to the level of individual consumers.
An increased number of quality-differentiated
services and therefore an increased need for
managed network elements (such as routers and
switches) that are exposed to frequent data-
forwarding policies might not only be costly, but
could even lead to unstable networks. At some
level of traffic management, management
complexity and the complexity of anticipating the
effects of even small changes to the network as
such might be beyond ISPs’ control. Therefore,
traffic management presents both an opportunity
and a risk, or even a threat, to ISPs.
Interestingly, many participants in the focus
groups, even if they were inclined to purchase
products with the prioritisation of certain services,
had severe doubts as to whether ISPs would
actually be able to provide them with a
personalised product that matched their own
individual preferences. In our survey, we
introduced only a limited number of non-neutral
attribute levels for specific applications. Contrary
to the indications from the focus groups,
respondents were able and willing to choose from
these offers. This indicates that ISPs can make
standardised offers for quality-differentiated
services which are likely to resonate at least with
certain consumer segments.
Forecasting market developments is extremely
difficult for the question at hand here, especially
given the important role that regulation may play
within this. However, our data enables us to look
at the current offers in the markets of the four test
areas. To achieve this objective, the attractiveness
of existing Internet offers on the local markets31
was benchmarked against the respective optimal
offer as derived from the conjoint analysis.
Concretely, the part-worth utilities of each level
within the ten attributes were used to calculate
both the optimal IAS product as well as the relative
attractiveness scores for the existing IAS products.
Just as for the conjoint analysis itself, one should
keep in mind that the part-worth utilities do not
represent absolute values, but rather relative ones.
As the most attractive level for each attribute
differs only marginally across consumer segments,
the optimal offer for the overall market was used.
This optimal IAS product is, of course, fictitious and
may not be economically viable for ISPs to offer.
31 The data for these offers was provided by the NRAs of the test areas.
32 The Full Results Report contains a fully detailed list of the existing market offers with their individual percentage score.

75
WIK-Consult GmbH
Relative utility score compared to most
attractive offer
Croatia (N=1020)
Czech Republic (N=1032)
Greece (N=1028)
Sweden (N=1122)
66% and more 4% 28% 10% 13%
More than 33%, less than 66% 55% 57% 89% 76%
0–33% 39% 13% 0% 9%
The figure 39 displays the results of this analysis. The optimal IAS product is represented by the value of
100. Relative to this figure, the attractiveness of existing IAS products is represented in three groups: the
ones reaching (1) between 66% and 100%; (2) between 33% and 65%; and (3) between 0% and 32%.32
The highest percentage of offers that reach at least 66% of the utility of the most attractive offer is found
in the Czech Republic. This is more than twice as high as the percentage in Sweden, nearly three times as
high as in Greece, and nearly six times as high as in Croatia. Greece has the highest percentage of offers
with a utility of between 33% and 66% of the most attractive offer, and interestingly no offers that fall
below 33%, the only test area where this is the case. The market situation in Croatia provides a contrast
to this with 40% of the offers having a utility of less than 33% of the most attractive offer.
While these results shed light on how well existing market offers match the (fictitious) optimal IAS
product, they do not imply that products with low scores are necessarily products unfit for the specific
test area’s market. Consequently, one should not draw conclusions from the results presented here as to
the quality of the IAS products present in the test areas as well as whether test area markets function
efficiently.
Furthermore, these results only shed light on the current market situation, which only rarely includes
quality-differentiated services. In the future, however, this may change. ISPs may have the intention to
introduce data caps (with or without zero-rating) as well as other options deviating from network
neutrality to offer quality-differentiated services. The results of the present study provide indications on
how consumers may react to such offers.
Figure 39 - How the current offers available in the different markets compare to the most attractive offer

76
WIK-Consult GmbH

77
WIK-Consult GmbH