Embed Size (px)
Citation preview

The Future of Mobile Payments
How will mobile wallets impact the shopper purchase journey?

The US mobile payments market is expected to more than double by 2019 primarily driven by Millennials and Generation X consumers. Despite this less than a third of US consumers today use mobile payments. PayPal is by far the most popular payment service used by US smartphone owners with more than five times the number of users compared to the next closest payment service Google Wallet.
The key reason behind consumer’s reluctance in adopting mobile payment is because they can’t find a benefit when comparing it with cash and card, which are perceived as familiar, convenient and more secure. Consumers are, however, interested in mobile payment if it becomes part of the shopping process by integrating coupons and loyalty programs via a mobile wallet.
Consumers are already using smartphones as a shopping companion at various stages of the purchase journey when inside a store. They use it to find new products in the discovery stage. In the influence stage they use smartphones to look up information on products and read product reviews towards making a purchase decision. In the final conversion stage, they are using mobile to pay via QR codes, apps and NFC features. Mobile wallets can help consumers along the shopping journey by providing information relevant for discovery and influence stages as well. Addition of loyalty programs, one of the most sought after features, could make mobile wallets a useful tool to track and engage consumers beyond the purchase journey. As a shopping companion, consumers expect brands to provide marketing content such as coupons, loyalty programs, and product information in mobile wallets.
Consumers also use mobile payments for peer-to-peer transfer. Most transfers occur between trusted members of a person’s social network such as the local corner shop owner, friends, and family. There is also a small group of individuals who work for themselves such as cleaners, handymen and freelance workers who have take a liking to being paid via peer-to-peer transfer on their smartphones through apps like Venmo. People trust banks the most to provide a reliable mobile wallet service. A greater trust in bank emerges from their experience using mobile banking features.
This report will look into why US consumers aren’t warming up to mobile payment services and how mobile wallets can integrate shopping and peer-to-peer transfers to make payments relevant with smartphone owners for wider adoption.
Introduction

Table of Contents1. Introduction 2. Who is driving growth of the us mobile payments market?
• US mobile payment transaction value will more than double by 2019 • Multiple device owners are twice as likely to use mobile payments • Millennials and Generation X drive mobile payment adoption in the us • Black and hispanic consumers lead in mobile payment usage
3. How does mobile compare against other payment options? • Cash and card beat mobile across most categories • Cash and card perceived as more secure payment options
4. Which mobile payment services do consumers use? • Knowing about a mobile payment service does not mean consumers use it • Paypal is the most well know and widely used mobile payment service
5. How do consumers use mobile payments? • Consumers use mobile to pay their bills and pay for their purchases • Fashion and luxury ahead of travel and sporting goods in mobile commerce • Consumers pay on smartphones or tablets depending on category • Consumers spend more on tablets than on smartphones • Debit and credit cards fund consumer mobile payments
6. What is keeping consumers from using mobile payments? • The biggest barrier to mobile payment adoption lies in consumer minds • Consumers expect mobile to help them shop and replace their wallets
7. How can mobile wallets make mobile payments relevant? • Consumers define mobile wallet as tool to organize marketing content • Mobile wallets that integrate marketing also drive revenue • Consumers want mobile wallet content, but brands are slow to provide
8. How can mobile wallets enhance shopper purchase journey? • Mobile is already a key part of the shopper’s in-store journey • Mobile wallets can bring together the fragmented consumer journey
9. How do consumers use mobile wallets beyond shopping? • Trust drives peer-to-peer transfers between members of one’s social network
10. Who do consumers trust most to provide a mobile wallet? • Consumers trust banks and credit card brands with their mobile wallets • Consumers trust banks because of experience with mobile banking • Banks can target mobile banking users with wallet services

Read the Full Report
Read the full report

View All Charts
View all charts

GET THE FULL REPORT IN WORD
AND PDF FORMATS
GET ALL CHARTS IN POWERPOINT AND KEYNOTE FORMATS
Download

Who is driving growth of the US mobile payments market?
I
Millennials and Generation X consumers will drive the US mobile payments market, which is expected to more than double over the next four years. The growth will come primarily from technologically savvy consumers who own both smartphones and tablets. Non-Caucasian consumers are already ahead in mobile payment adoption and will be responsible for much of the future growth.

1 The US mobile payments market grew by 34% between 2014 and 2015 to reach $69.3 billion. It is estimated to grow by 104% over the next four years and reach $1.4 trillion in 2019.
2 Mobile payment penetration is nearly twice as high among multiple mobile device owners (54%) compared to the average US consumer (28%).
3 18 to 29 year old US Millennials lead mobile payment adoption with more than a third (34%) using the service.
4 30-44 year old Generation X segment is the fastest growing demographic driving mobile payment adoption after growing 10 percentage points between 2013 and 2014 – from 21% to 31%.
5 Non-Caucasian consumer segments are ahead of white consumers in mobile payment adoption – especially among African-American (34%) and Hispanic consumers (32%).
Key Data Highlights

$16,833
$14,428
$11,899
$9,614
$7,308
$5,255
$34,160
$23,472
$16,240
$10,451
$6,815
$3,737 $90,680$81,349$72,269$63,351$53,141$42,555
Remote paymentIn-person paymentPeer to peer transfer
Source: PwC, 2015
2014 2015 2016 2017 2018 2019
US mobile payment transactions by type, 2014-2019US mobile payment transaction values in millions of dollars

US consumer usage of mobile payment, All vs mobile device owners% US consumers and %smartphone owners
46%54%
Used a mobile payment serviceNot used a mobile payment service
Source: Federal Reserve Board and YouGov, 2015
72%
28%
Among all US consumers Among smartphone/tablet owners

7%7%8%
5%
16%
13%
9%8%
31%
21%
18%16%
34%
28%26%
20%
18-2930-4445-5960+
Source: Federal Reserve Board, 2015
2011 2012 2013 2014
US mobile payment usage by age group, 2011-2014% of all US consumers

23%
31%
13%
9%
32%
26%
18%20%
24%
16%17%
15%
34%34%
18%
14%
17%
12%13%
10%
White, non-HispanicBlack, non-HispanicOther, non-HispanicHispanicMixed race
Source: Federal Reserve Board, 2015
2011 2012 2013 2014
US mobile payment usage by ethnicity, 2011-2014% of all US consumers

Read the Full Report
Read the full report

View All Charts
View all charts

GET THE FULL REPORT IN WORD
AND PDF FORMATS
GET ALL CHARTS IN POWERPOINT AND KEYNOTE FORMATS
Download

How does mobile compare against other payment options?
IICash and card are top of consumer minds when it comes to picking payment methods in most everyday situations such as buying groceries, going to a restaurant or paying for a cab. Cash is the most accessible form of payment with more than eight in ten consumers still carrying some amount of cash with them at all times. Consumers also believe cash to be the most secure form of payment ahead of card and mobile.

1Consumers overwhelmingly prefer cash for transactions that involve small amounts of money being exchanged such as paying a street vendor (87%), paying cabs or public transit (64%), and paying the bar tab (52%).
2Consumers prefer using their debit cards for regular purchases such as buying groceries (60.94%) and paying at retail outlets (58.09%). They also prefer debit cards for leisure related purchases such as paying for movie tickets (52.73%) and paying at a restaurant (53.01%).
3Cash is the most accessible form of payment for US consumers with more than two in five (41%) consumers carrying anywhere between a dollar to twenty dollars with them at all times. Less than one on five (18%) consumers do not carry any cash with them.
4 Consumers feel most secure when paying with cash (56%), followed by credit cards (22%) and debit cards (16%). Only one in a hundred (1%) rank mobile as the most secure payment option.
Key Data Highlights

Street Vendors
Cabs or public transit
At a bar At a coffee shop
Paying others for goods & services
At a restaurant
At leisure venues
Grocery shopping
Retail purchases
Paying mortgage/
rent
Paying electricity
Cash Debit card Credit card Check Mobile payment
Source: Walker Sands, 2015
Cash 86.63% 63.89% 51.82% 39.53% 36.38% 18.60% 16.93% 15.25% 13.58% 8.47% 4.00%
Drebit card 7.31% 20.81% 30.45% 41.32% 35.42% 53.01% 52.73% 60.94% 58.09% 25.26% 49.03%
Credit card 4.89% 13.78% 16.43% 15.85% 18.50% 27.48% 29.03% 22.36% 26.95% 7.30% 15.79%
Check 0.14% 0.48% 0.34% 0.21% 7.63% 0.21% 0.14% 0.76% 0.41% 52.65% 24.14%
Mobile 0.68% 0.83% 0.62% 2.68% 1.65% 0.56% 0.90% 0.41% 0.68% 5.92% 6.83%
US consumer preferred payment method by transaction type% of all US consumers

7%10%
24%
41%
18%
Source: Walker Sands, 2015
$0 $1-$20 $21-$50 $51-$100 $101+
US consumer cash carrying and spending behavior% US consumers who carry cash and pay for purchases using cash
4%
25%
30%31%
11%
Today Yesterday More than three days
ago
More than a week
ago
I do not ever use
cash
How much cash do you currently have in your wallet?
How recently have you paid for something with cash?

US consumer payment methods by sense of security% US consumers who feel given payment method is most secure
1%
2%
3%
16%
22%
56%
Source: Walker Sands, 2015
Cash
Credit card
Debit card
Digital currency
Checks
Mobile payments

Read the Full Report
Read the full report

View All Charts
View all charts

GET THE FULL REPORT IN WORD
AND PDF FORMATS
GET ALL CHARTS IN POWERPOINT AND KEYNOTE FORMATS
Download

Which mobile payment services do consumers use?
IIIPayPal is by far the most popular payment service used by US smartphone owners with more than five times number of users compared to the next closest payment service Google Wallet. PayPal is also the top mobile payment service on consumer minds followed by Google Wallet and Apple Pay. However, awareness does not convert to usage with more than third of smartphone owners saying they don’t use a mobile payment service despite being aware of one or more options.

1 PayPal is the most widely used mobile payment service among US mobile payment users with nearly a half (44%) using the service.
2 PayPal is also the most widely known mobile payment service in the US with more than four in five (85%) smartphone owners aware of the brand’s mobile payment services.
3 More than half (51%) of all smartphone owners are aware of Google Wallet, while nearly half (49%) are aware of Apple Pay.
4 More than a third (37%) of US smartphone owners do not use mobile payment services despite being aware of one or more options.
5 Less than one in ten (9%) of US smartphone owners are not aware of any mobile payment services.
Key Data Highlights
US consumers’ familiarity with and usage of mobile payment services% US smartphone owners
9%
37% 54%
Know and used a mobile payment serviceKnow but not used a mobile payment serviceDon't know and haven't used a mobile payment service
Source: YouGov, May 2015

US consumers’ familiarity with mobile payment services% US smartphone owners who have heard of given mobile payment service
Source: YouGov, May 2015
4%
6%
6%
7%
15%
17%
19%
49%
51%
85%Paypal
Google Wallet
Apple Pay
Bank of America Online Transfer
A bank-specific payment service (i.e., Chase QuickPay)
Square Cash
Xoom
Venmo
Dwolla
Popmoney

US consumers’ usage of mobile payment services% US smartphone owners who have used a given mobile payment service
Source: YouGov, May 2015
1%
1%
1%
2%
2%
3%
4%
5%
8%
44%Paypal
Google Wallet
Bank of America Online Transfer
A bank-specific payment service (i.e., Chase QuickPay)
Apple Pay
Square Cash
Popmoney
Xoom
Venmo
Dwolla
Read the Full Report
Read the full report

View All Charts
View all charts

GET THE FULL REPORT IN WORD
AND PDF FORMATS
GET ALL CHARTS IN POWERPOINT AND KEYNOTE FORMATS
Download

How do consumers use mobile payments?
IVConsumers are paying their utility bills as well as their purchases online and in stores with mobile payment services. Consumers prefer to use QR codes and apps that do not require NFC while paying with mobile in stores. Consumers tend to pay with mobile when buying fashion and luxury as well as travel related products. Overall purchases made through tablets are larger in value compared to smartphone purchases.

1 Nearly seven in ten (68%) of US mobile payment users use the service to pay their utility bills such as electricity, mobile, and cable television.
2 More than half (54%) of US mobile payment users pay for an online purchase using their smartphones, while just under two in five (39%) pay for an offline purchase made at a physical retail store.
3 While paying at retail point-of-sale with one’s smartphone, US consumers prefer to scan a QR code (31%) followed by using an app that does not require waving or tapping (22%).
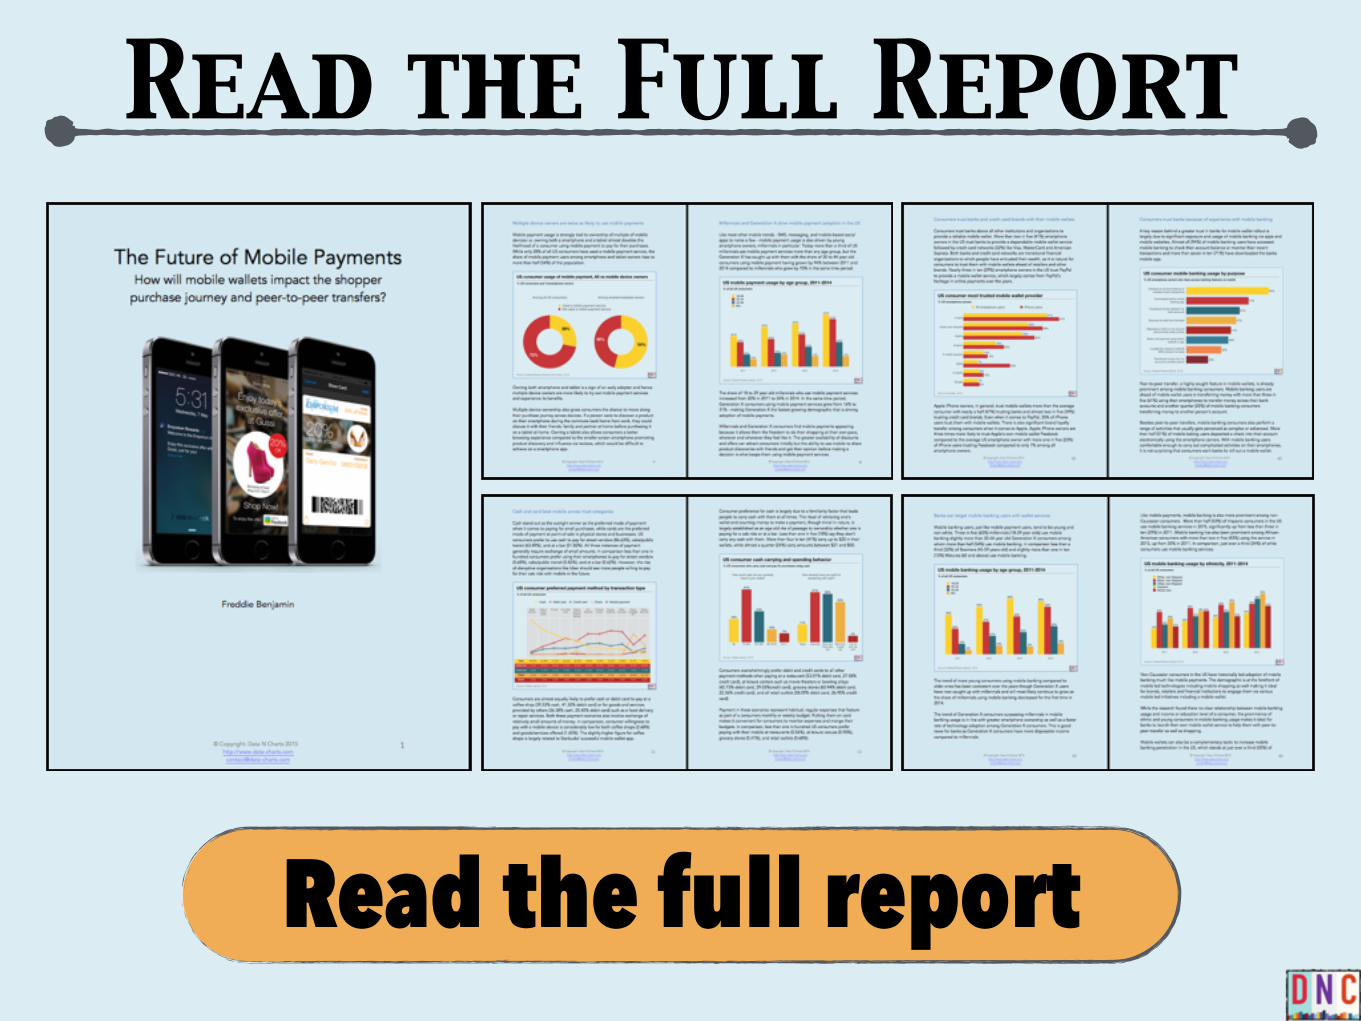
4 Online purchases made via mobile contribute significantly to e-Commerce transaction in the fashion and luxury category (33%), followed by travel (27%) and sporting goods (26%).
5 Smartphones dominate mobile purchases for fashion and luxury (65%) as well as travel (62%), while tablets dominated mobile purchases made in the home category (68%).
6 Consumers spend more per order when buying on tablets than on smartphone – fashion and luxury ($28 more on tablets), travel ($59 more), sporting goods ($15 more), and home ($25 more).
7 Consumer prefer to link mobile payment services with debit cards (55%), credit cards (51%) and bank accounts (41%) over PayPal (15%).
Key Data Highlights

US consumers’ usage of mobile payment by purpose% US smartphone owners who have used a mobile payment service
Source: Federal Reserve Board, 2015
9%
11%
16%
30%
31%
36%
39%
54%
68%To pay bills
To make online or in-app purchases
To pay for a product or service at a store
To send money to another person
To receive money from another person
To receive loyalty or reward points though an app
To pay for paring, taxi or public transit
To make a payment by text message
To send remittance overseas

US consumers mobile payment method at Point-of-Sale% US smartphone owners who have used a mobile to make payment at a POS
Source: Federal Reserve Board, 2015
14%
22%
31%Scan a QR Code
Use an app that does not require wave or tapping
Waved or tapped smartphone at POS
US mobile share of eCommerce transactions by category% US eCommerce transactions that occurred on mobile devices
15%
20%
23%
26%
27%
33%
Source: Criteo, 2015
Fashion and Luxury
Travel
Sporting Goods
Mass Merchants
Health and Beauty
Home

68%
53%
51%
51%
38%
35%
32%
47%
49%
49%
62%
65%
Smartphones Tablets
US mobile share of eCommerce transactions by device type
Source: Criteo, 2015
Fashion and Luxury
Travel
Health and Beauty
Sporting Goods
Mass Merchants
Home
% US eCommerce transactions that occurred on mobile devices by device type

$85
$70
$95
$102
$114
$96
$36
$45
$80$86$86
$91
Smartphones Tablets
Health and Beauty Fashion and Luxury
Mass Merchants Sporting Goods Home Travel
US mobile order value compared to $100 spent on desktopMobile order value in US dollars for every $100 spent on desktop
Source: Criteo, 2015

US consumers funding method for mobile payments% US smartphone owners who have used a mobile payment service
Source: Federal Reserve Board, 2015
4%
8%
15%
41%
51%
55%Debit card
Credit card
Direct from a bank account
Non financial institution account (e.g. PayPal)
Prepaid debit card
Directly charged to phone bill

Read the Full Report
Read the full report

View All Charts
View all charts

GET THE FULL REPORT IN WORD
AND PDF FORMATS
GET ALL CHARTS IN POWERPOINT AND KEYNOTE FORMATS
Download

What is keeping consumers from using mobile payments?
VConsumers who view mobile payment as an alternative to cash and card do not want to trial the technology because they don’t see how it provides a benefit compared to exiting payment methods. Security with mobile payments is also a key concern among mobile payment non-users. Consumers are most interested in mobile payment when it becomes part of the shopping process by integrating coupons and loyalty programs via mobile wallet.

1 Three quarters (75%) of smartphone owners who haven’t used a mobile payment service say they find it easier to pay with cash or card.
2 Nearly three in five (59%) mobile payment non-users don’t see the benefit of using mobile over cash or card, while an equal proportion are concerned about security of mobile payments.
3More than three in ten (31%) smartphone owners who haven’t used a mobile payment service are confused about mobile payment options available or find it difficult and time consuming to set up mobile payment services on their device.
4 More than three in five (65%) smartphone owners who haven’t used a mobile payment service aren’t interested in using the service in the future irrespective changes and innovation.
5 The top reasons that will attract the remaining mobile payment non-users are coupons and reward points (20%), being able to pay at a store (18%), and paying bills using a mobile app (15%).
Key Data Highlights

US consumers’ reasons for not using a mobile payment service% US consumers who have not used a mobile payment service
Source: Federal Reserve Board, 2015
23%
23%
31%
31%
37%
41%
59%
59%
75%It’s easier to pay with cash or
credit/debit card
I don’t see any benefit from using mobile payments
I’m concerned about the security of mobile payemnts
I don’t trust the technology
I don’t have the necessary feature on my phone
I don’t really understand the different mobile payment otions
It’s difficult or time consuming to set up or use mobile payments
I don’t need to make any payments or someone else pays the bills
The places I shop don’t accept mobile payments
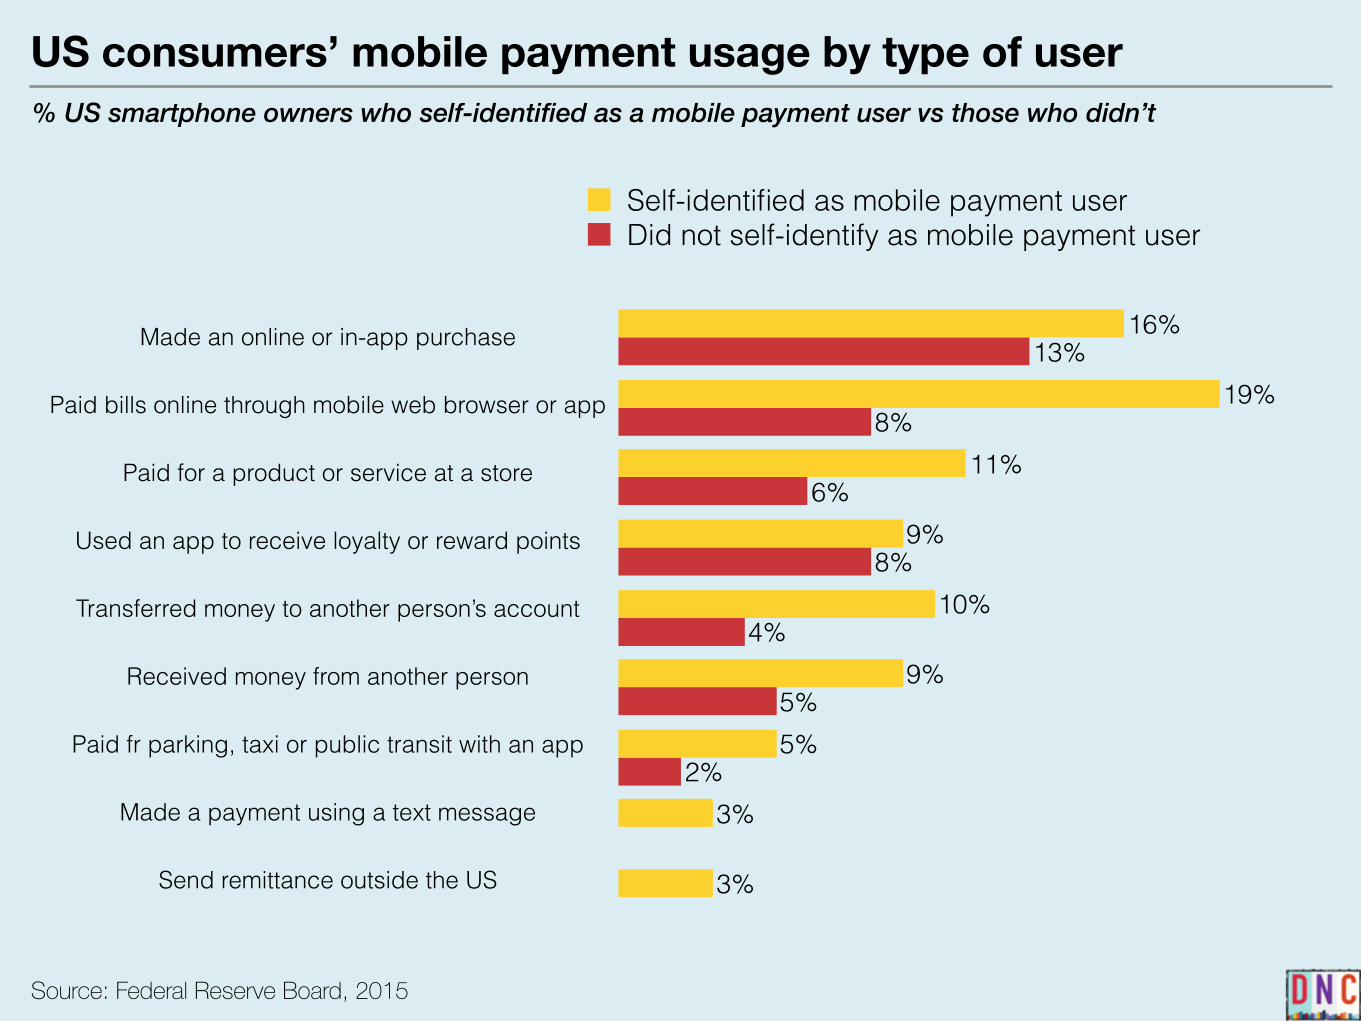
US consumers’ mobile payment usage by type of user% US smartphone owners who self-identified as a mobile payment user vs those who didn’t
Source: Federal Reserve Board, 2015
2%
5%
4%
8%
6%
8%
13%
3%
3%
5%
9%
10%
9%
11%
19%
16%
Self-identified as mobile payment userDid not self-identify as mobile payment user
Made an online or in-app purchase
Paid bills online through mobile web browser or app
Paid for a product or service at a store
Used an app to receive loyalty or reward points
Transferred money to another person’s account
Received money from another person
Paid fr parking, taxi or public transit with an app
Made a payment using a text message
Send remittance outside the US
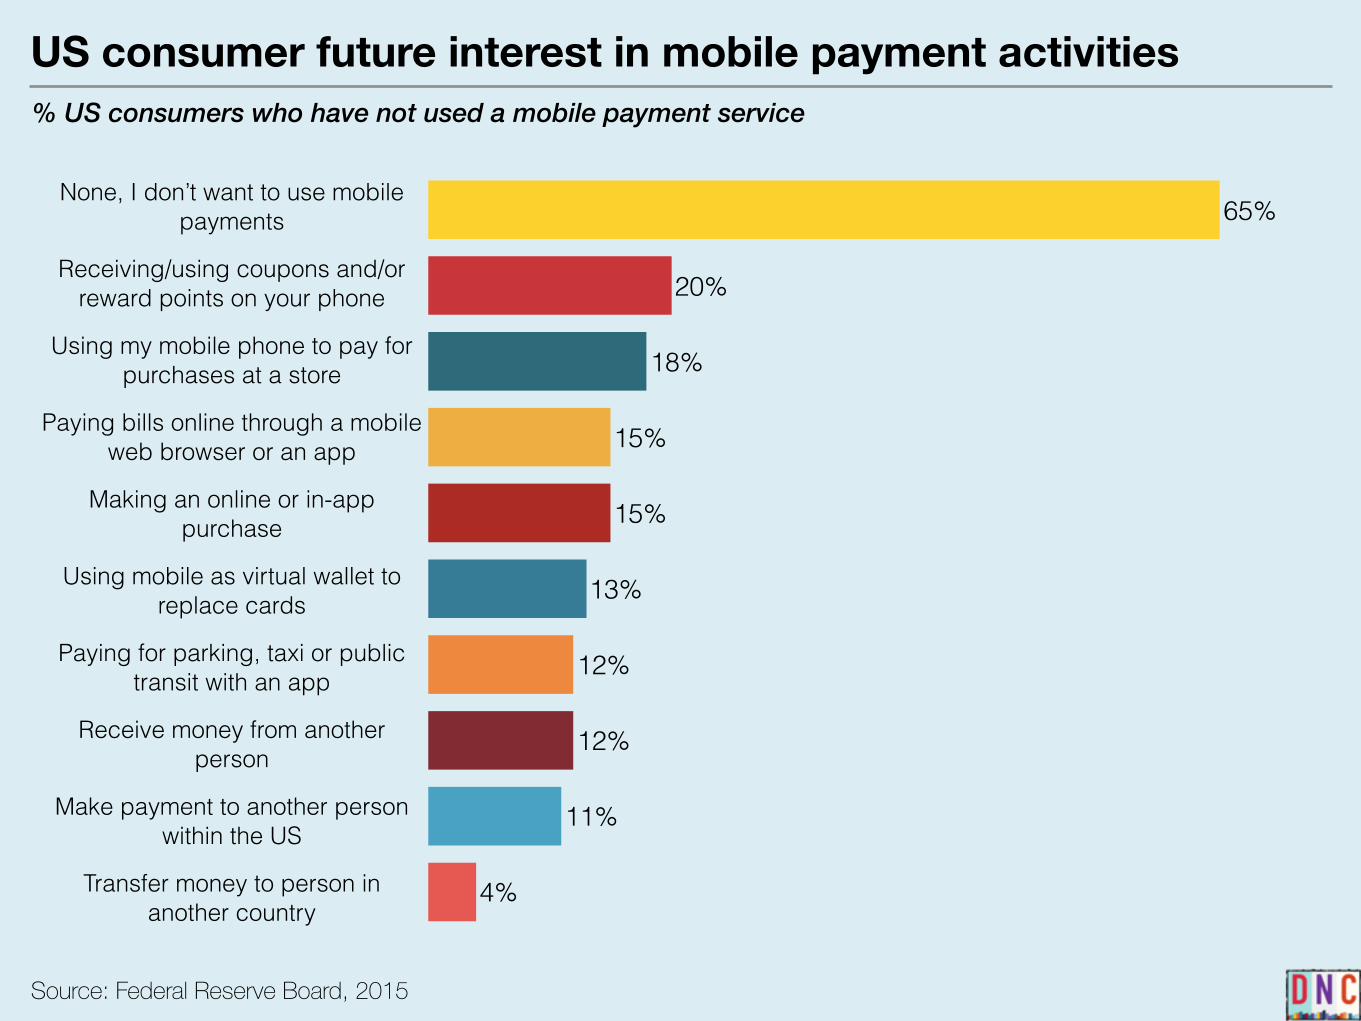
US consumer future interest in mobile payment activities% US consumers who have not used a mobile payment service
Source: Federal Reserve Board, 2015
4%
11%
12%
12%
13%
15%
15%
18%
20%
65%None, I don’t want to use mobile
payments
Receiving/using coupons and/or reward points on your phone
Using my mobile phone to pay for purchases at a store
Paying bills online through a mobile web browser or an app
Making an online or in-app purchase
Using mobile as virtual wallet to replace cards
Paying for parking, taxi or public transit with an app
Receive money from another person
Make payment to another person within the US
Transfer money to person in another country

Read the Full Report
Read the full report

View All Charts
View all charts

GET THE FULL REPORT IN WORD
AND PDF FORMATS
GET ALL CHARTS IN POWERPOINT AND KEYNOTE FORMATS
Download

How can mobile wallets make mobile payments relevant?
VIConsumers perceive mobile wallets as more than just a payment alternative to cash and card. They expect brand to provide a marketing content such as coupons, loyalty programs, and product information in mobile wallets to help them with the shopping process. However, there is a large mobile wallet disconnect with brands and retailers failing to meet consumer demand for marketing content aimed at mobile wallets.

1Nearly half (48%) of consumers are aware that mobile wallets have non-payment features in addition to payment features, compared just a third (33%) who are aware of its payment features only.
2More than four in five (85%) of smartphone owners in the US expect non-payment related marketing content form brands in their mobile wallets, but less than one in five (19%) retailers provide marketing content that integrate with mobile wallets.
Key Data Highlights

19%
33%
48%
Aware of non-payment mobile wallet featuresAware of payment mobile wallet features onlyNot aware of any mobile wallet features
US consumer awareness of mobile wallet features% US smartphone owners who have used a mobile payment service
Source: Vibes, 2014
43%
56%
A mobile tool that allows me to both pay and store
information on products
A mobile tool that allows me to store information on
products and discounts

8.07.5
7.06.5
6.05.5
5.0
4.03.5
3.0
2.1
Source: Starbucks quarterly reports, 2012-2015
Q4 2012 Q1 2013 Q2 2013 Q3 2013 Q4 2013 Q1 2014 Q2 2014 Q3 2014 Q4 2014 Q1 2015 Q2 2015
Starbucks weekly mobile app transactions volume in the USAverage weekly mobile app transactions in millions

15%
85%
Expect non-payment related mobile wallet contentNot interested in mobile wallet content
US consumer expectation for mobile wallet content% US smartphone owners who expect mobile wallet content vs retailer who provide such content
Source: Vibes, 2014
81%
19%
Retailers who provide mobile wallet contentRetailers who are yet provide any mobile wallet content

Read the Full Report
Read the full report

View All Charts
View all charts

GET THE FULL REPORT IN WORD
AND PDF FORMATS
GET ALL CHARTS IN POWERPOINT AND KEYNOTE FORMATS
Download
How can mobile wallets enhance shopper purchase journey?
VII
Consumers are already using smartphones as a shopping companion at various stages of the purchase journey when inside a store. They use it to find new products in the discovery stage. In the influence stage they use smartphones to look up information on products and read product reviews to help them make a purchase decision. While payment is part of the final Conversion stage, mobile wallets can help consumers along the shopping journey by providing information relevant for discover and influence stages as well. Addition of loyalty programs, one of the most sought after features, could make mobile wallets a useful tool to track and engage consumers beyond the purchase journey.

1 Consumers use smartphone when inside a store to compare prices (30%), find new and relevant products (28%), find and redeem coupons (25%), and to look up product information (24%).
2 More than one in five (23%) smartphone using shoppers use the device to take pictures of products and share with friends to get an opinion before making a purchase decision.
3 The most sought after feature in a mobile wallet is loyalty programs, points and rewards (57%), followed by coupons, discounts and special offers (56%).
4 Consumers also want price comparison features (52%) and ability to look up product information (50%) built into their mobile wallets.
5Besides shopping, consumers are willing to use mobile wallets for making a reservation at a restaurant (50%), placing their order before reaching the restaurant (49%), and requesting the bill to pay at their table (50%).
Key Data Highlights

US consumers in-store smartphone usage by purpose% US smartphone owners who used the device inside a physical retail store while shopping
Source: Forrester, 2015
15%
19%
19%
22%
22%
23%
24%
25%
28%
30%To compare prices
To find new and relevant products
To find or redeem a coupon or coupon code
To look up product information
To take pictures of product and share with friends or ask for their opinion
To locate a nearby store or check store hours
To access the internet via guest Wi-Fi
To read customer reviews of a product
To access my shopping list
To check availability of a product in another physical store

Consumer feature preferences for mobile digital wallet% US and EU smartphone owners
Source: Forrester, 2015
28%
30%
19%
36%
23%
27%
27%
31%
36%
34%
48%
48%
49%
49%
50%
50%
50%
52%
56%
57%
US EU7
Loyalty programs, points and rewards
Coupons, discounts and special offers
Price comparisons for items I want to buy
Product information for items I want to buy
Make a reservation at a restaurant
Request bill and pay at the table
Digital receipts for things I buy
Place order before arriving at restaurant
Digital tickets
My payment card or bank account information

Read the Full Report
Read the full report

View All Charts
View all charts

GET THE FULL REPORT IN WORD
AND PDF FORMATS
GET ALL CHARTS IN POWERPOINT AND KEYNOTE FORMATS
Download

How do consumers use mobile wallets beyond shopping?
VIII
Besides online and retail store shopping, consumers use mobile payments for peer-to-peer transfer. Most transfers occur between trusted members of a person’s social network such as the local corner shop owner, friends, and family. There is, however, a small group of individuals who work for themselves such as cleaners, handymen and freelance workers who have take a liking to being paid via peer-to-peer transfer on their smartphones through apps like Venmo.

1 Slightly more than one in five (21%) mobile payment users in the US have used the service to pay a local business or store via money transfer.
2 One in five (20%) mobile payment users have sent money to friends and family while 15% have received money from their friends and family.
3More than one in ten (13%) of mobile payment users have also used peer-to-peer transfer to send payment for products and services – usually to individual contractors such as cleaners, handymen, landlord and freelancers.
Key Data Highlights

US consumers’ mobile wallet usage for peer-to-peer transfer% US smartphone owners who have used a mobile payment service
Source: YouGov, May 2015
8%
9%
13%
15%
18%
20%
21%To pay or send money to a business / store
for a product or service
To send money to a friend or family member
To transfer money between my own accounts
To receive money from a friend or family member
To pay an individual for a product or service (e.g., handyman, cleaner, paying rent to a landlord, etc.)
To receive money from an individual for a product or service (e.g., payment for handiwork, receive rent from a tenant, etc.)
To receive money from a business for a product or service

$1,300 mn
$906 mn
$700 mn
$468 mn
$314 mn
$194 mn$141 mn$105 mn$81 mn$59 mn
Source: Paypal quarterly reports, 2012-2015
Q4 2012 Q1 2013 Q2 2013 Q3 2013 Q4 2013 Q1 2014 Q2 2014 Q3 2014 Q4 2014 Q1 2015
Venmo monthly mobile app transactions value in the USAverage monthly mobile app transactions value in millions of dollars

Read the Full Report
Read the full report
View All Charts
View all charts

GET THE FULL REPORT IN WORD
AND PDF FORMATS
GET ALL CHARTS IN POWERPOINT AND KEYNOTE FORMATS
Download

Who do consumers trust most to provide a mobile wallet?
IX
People trust banks the most to provide a reliable mobile wallet service. A greater trust in bank emerges from their experience using mobile banking to do everything from checking bank accounts to making electronic check deposits. Mobile banking users are also similar to mobile payment users in terms of demographic – young and ethnic – making it valuable for banks to roll out a mobile wallet feature for their mobile banking consumers.

1 Consumer most trusted provider of mobile wallet is a bank (41%), followed by credit card networks (32%) and PayPal (29%).
2 Apple iPhone users are more then thrice as likely to trust a mobile wallet from Apple compared to all smartphone users (23% for iPhone users vs. 7% for all smartphone users).
3Consumer trust in banks for a reliable mobile wallet is driven by their usage of mobile banking which includes mundane tasks like checking account balance (94%) as well as advanced tasks like depositing a check electronically by using the camera (51%).
4 Mobile banking is particular prominent among millennials (60%) followed by Generation X consumers (54%) who have emerged as the fastest growing segment of mobile banking users.
5 Mobile banking has historically been more popular with Black (43%), Hispanic (53%) and other non-white consumers (48%).
Key Data Highlights

US consumer most trusted mobile wallet provider% US smartphone owners
Source: Forrester, 2015
8%
10%
23%
12%
20%
35%
39%
47%
7%
8%
7%
10%
16%
29%
32%
41%
All smartphone users iPhone users
A bank
Credit card networks
PayPal
Amazon
A mobile operator
Apple
A retailer

US consumer mobile banking usage by purpose% US smartphone owners who have access banking features on mobile
Source: Federal Reserve Board, 2015
25%
40%
48%
51%
57%
61%
71%
94%Checked an account balance or
checked recent transactions
Downloaded bank’s mobile banking app
Transferred money between my bank accounts
Received an alert from the bank
Deposited a check to my account electronically using camera
Made a bill payment using bank’s website or app
Located the closest in-network ATM or branch for bank
Transferred money from my account to another person

13%9%10%
5%
32%
25%21%
12%
54%
43%
37%
29%
60%63%
54%
45%
18-2930-4445-5960+
Source: Federal Reserve Board, 2015
2011 2012 2013 2014
US mobile banking usage by age group, 2011-2014% of all US consumers

41%
31%
36%
21%
53%
45%
36%
29%
48%
35%
31%
23%
43%42%39%
35% 34%
30%
26%
19%
White, non-HispanicBlack, non-HispanicOther, non-HispanicHispanicMixed race
Source: Federal Reserve Board, 2015
2011 2012 2013 2014
US mobile banking usage by ethnicity, 2011-2014% of all US consumers
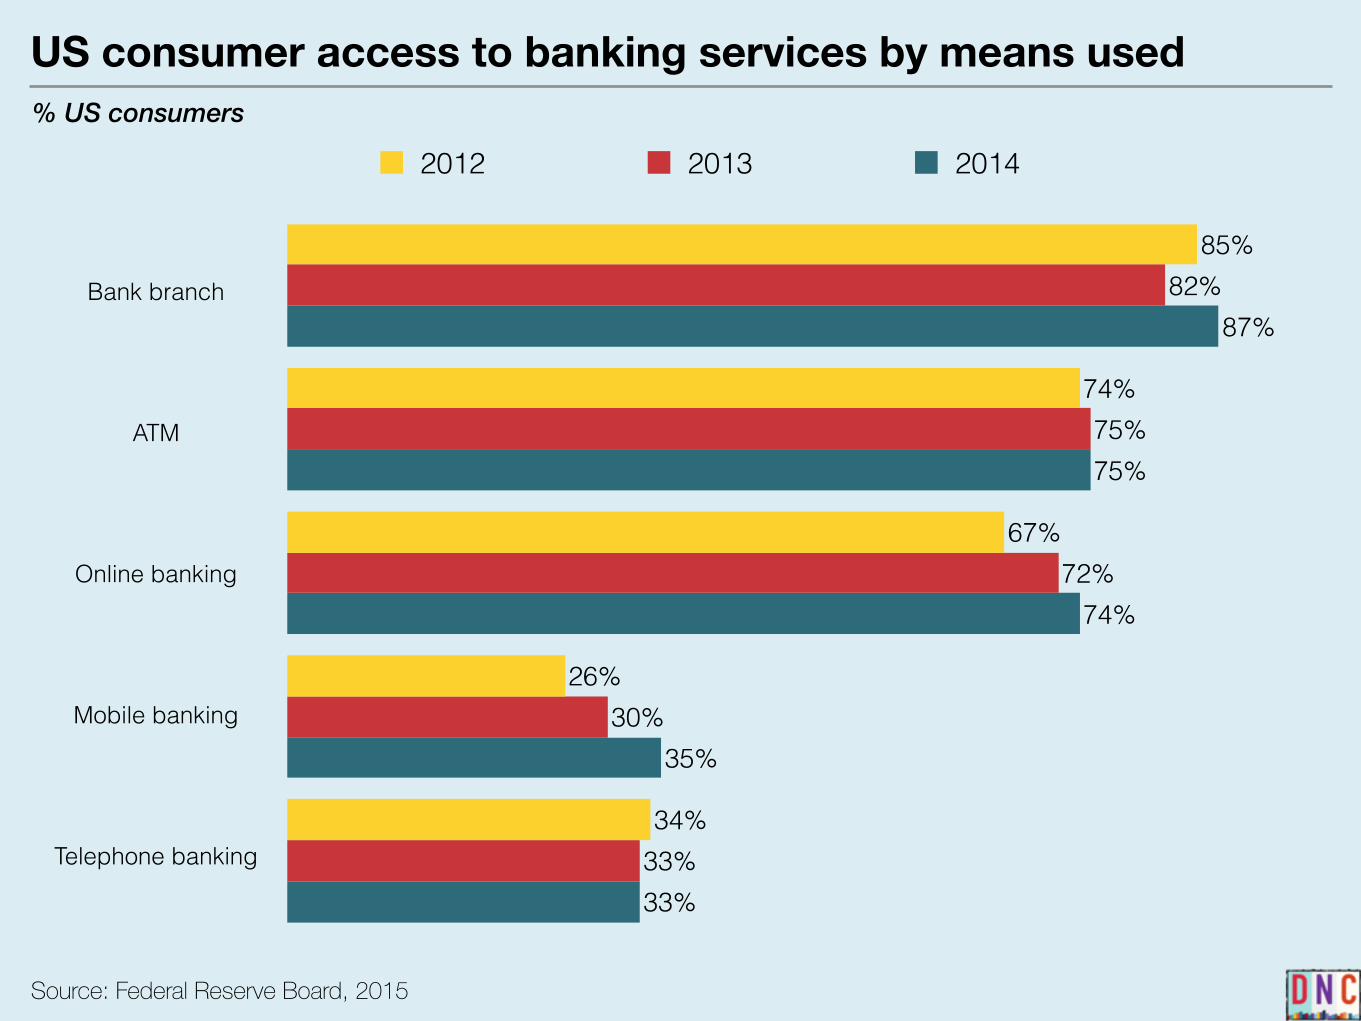
US consumer access to banking services by means used% US consumers
Source: Federal Reserve Board, 2015
33%
35%
74%
75%
87%
33%
30%
72%
75%
82%
34%
26%
67%
74%
85%
2012 2013 2014
Bank branch
ATM
Online banking
Mobile banking
Telephone banking

Read the Full Report
Read the full report

View All Charts
View all charts

GET THE FULL REPORT IN WORD
AND PDF FORMATS
GET ALL CHARTS IN POWERPOINT AND KEYNOTE FORMATS
Download