Embed Size (px)
Citation preview
November 2011 - 1Richard Kramer
Taming the Tech Hydra?
Richard Kramer, Managing Partner
November 2011 - 2Richard Kramer
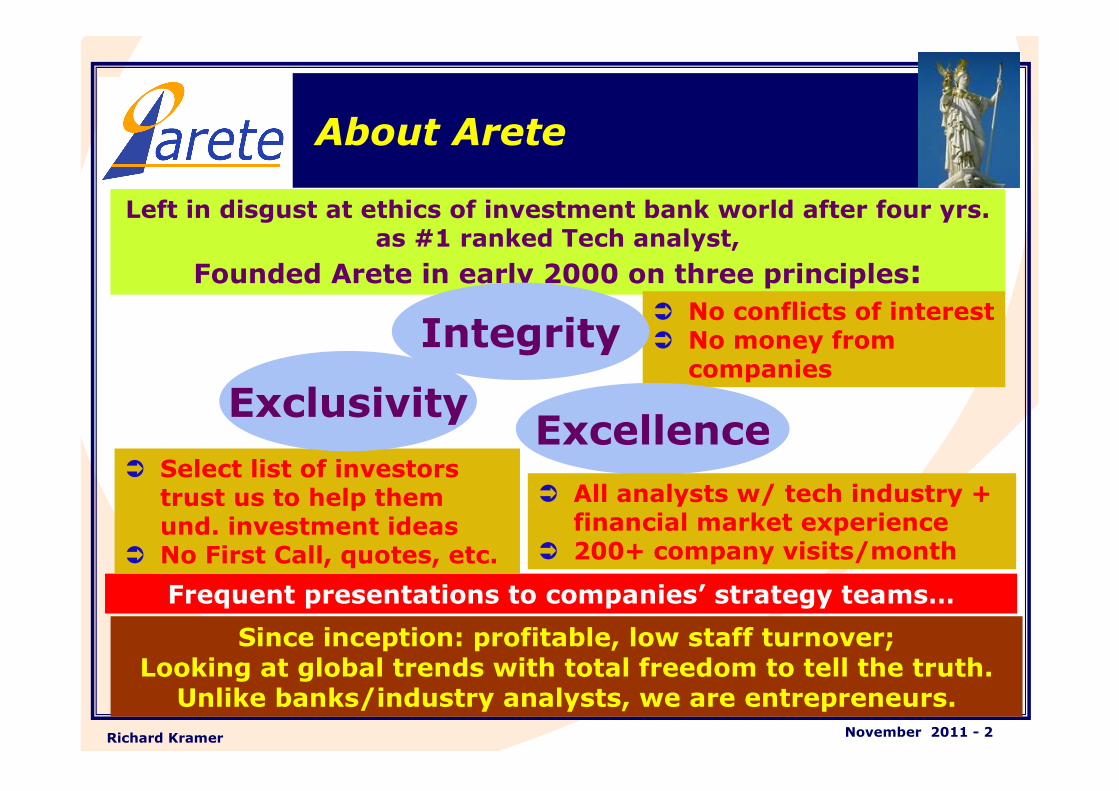
About Arete
Left in disgust at ethics of investment bank world after four yrs. as #1 ranked Tech analyst,
Founded Arete in early 2000 on three principles:� No conflicts of interest � No money from companies
� Select list of investors trust us to help them und. investment ideas
� No First Call, quotes, etc.
ExclusivityExcellence
� All analysts w/ tech industry + financial market experience
� 200+ company visits/month
Since inception: profitable, low staff turnover;Looking at global trends with total freedom to tell the truth.Unlike banks/industry analysts, we are entrepreneurs.
Integrity
Frequent presentations to companies’ strategy teams…
November 2011 - 3Richard Kramer
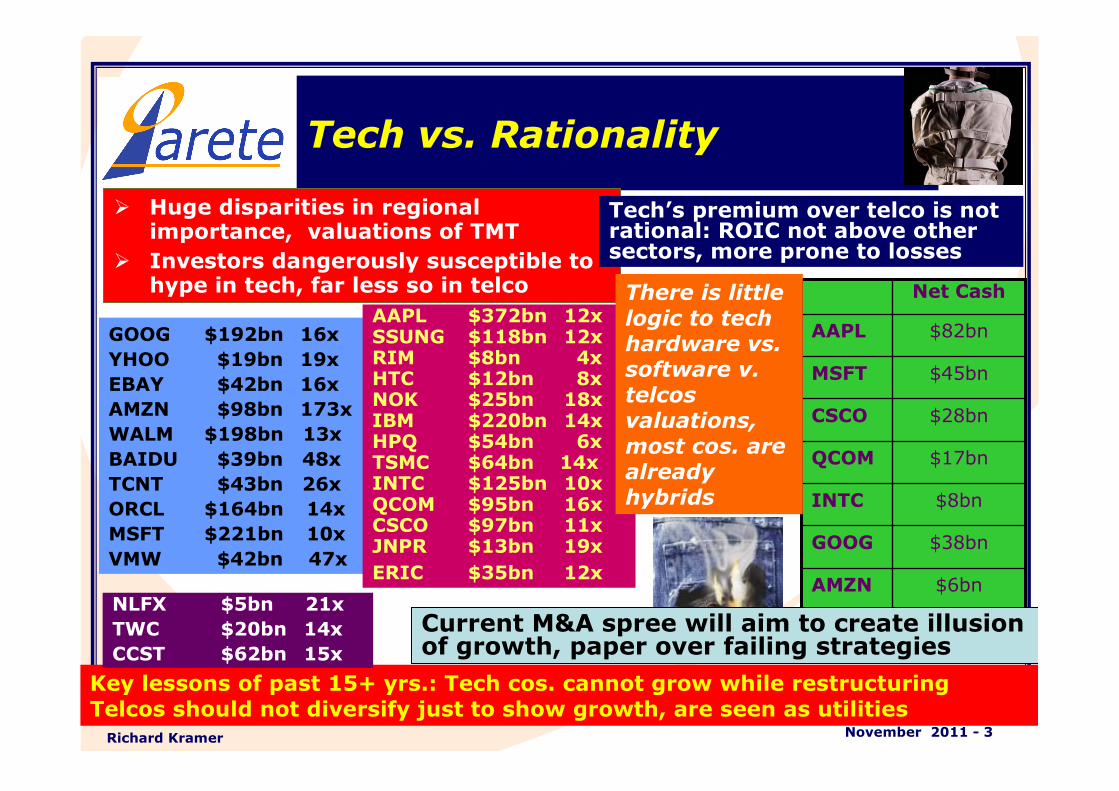
Tech vs. Rationality
� Huge disparities in regional importance, valuations of TMT
� Investors dangerously susceptible to hype in tech, far less so in telco
Tech’s premium over telco is not rational: ROIC not above other sectors, more prone to losses
$6bnAMZN
$38bnGOOG
$8bnINTC
$17bnQCOM
$28bnCSCO
$45bnMSFT
$82bnAAPL
Net Cash
Key lessons of past 15+ yrs.: Tech cos. cannot grow while restructuringTelcos should not diversify just to show growth, are seen as utilities
GOOG $192bn 16x
YHOO $19bn 19x
EBAY $42bn 16x
AMZN $98bn 173x
WALM $198bn 13x
BAIDU $39bn 48x
TCNT $43bn 26x
ORCL $164bn 14x
MSFT $221bn 10x
VMW $42bn 47x
AAPL $372bn 12xSSUNG $118bn 12xRIM $8bn 4xHTC $12bn 8x NOK $25bn 18xIBM $220bn 14xHPQ $54bn 6xTSMC $64bn 14xINTC $125bn 10xQCOM $95bn 16xCSCO $97bn 11xJNPR $13bn 19x
ERIC $35bn 12x
NLFX $5bn 21x
TWC $20bn 14x
CCST $62bn 15x
There is little logic to tech hardware vs. software v. telcosvaluations, most cos. are already hybrids
Current M&A spree will aim to create illusion of growth, paper over failing strategies
November 2011 - 4Richard Kramer
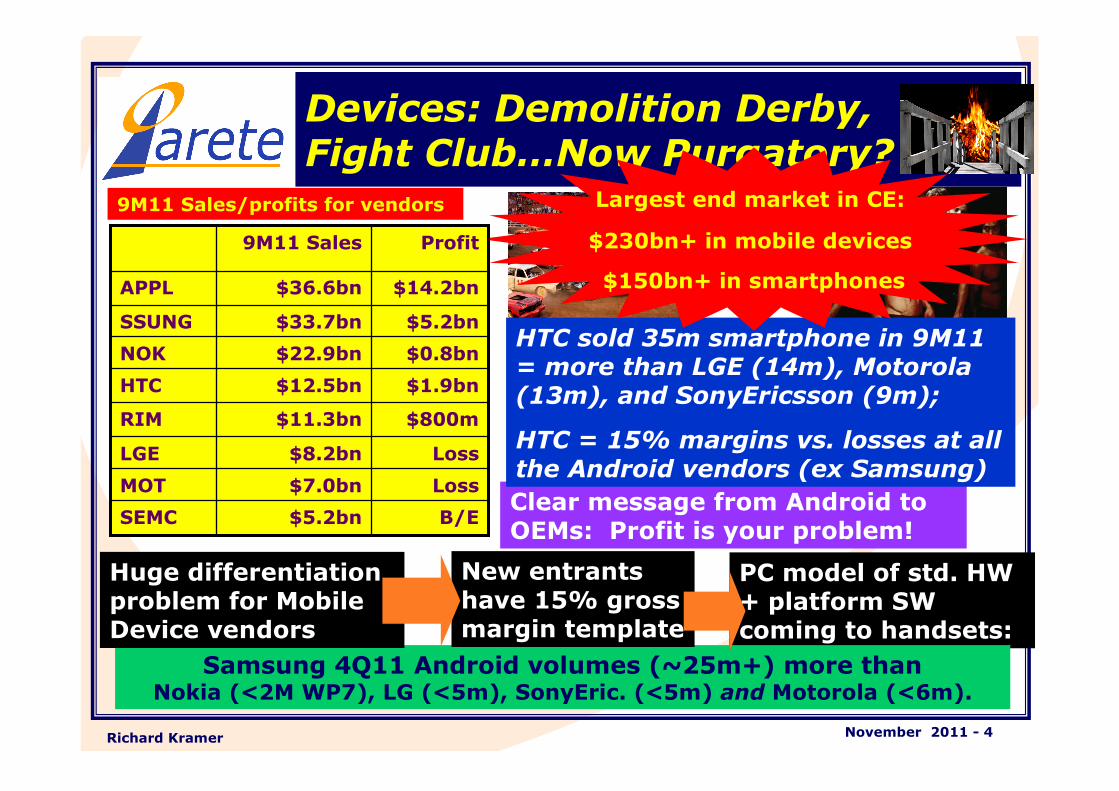
Devices: Demolition Derby, Fight Club…Now Purgatory?
Clear message from Android to OEMs: Profit is your problem!
9M11 Sales/profits for vendors
HTC sold 35m smartphone in 9M11 = more than LGE (14m), Motorola (13m), and SonyEricsson (9m);
HTC = 15% margins vs. losses at all the Android vendors (ex Samsung)
PC model of std. HW + platform SW coming to handsets:
Largest end market in CE:
$230bn+ in mobile devices
$150bn+ in smartphones
Samsung 4Q11 Android volumes (~25m+) more than Nokia (<2M WP7), LG (<5m), SonyEric. (<5m) and Motorola (<6m).
$5.2bn$33.7bnSSUNG
Loss$7.0bnMOT
B/E$5.2bnSEMC
Loss$8.2bnLGE
$800m$11.3bnRIM
$1.9bn$12.5bnHTC
$0.8bn$22.9bnNOK
$14.2bn$36.6bnAPPL
Profit9M11 Sales
Huge differentiation problem for Mobile Device vendors
New entrants have 15% gross margin template
November 2011 - 5Richard Kramer
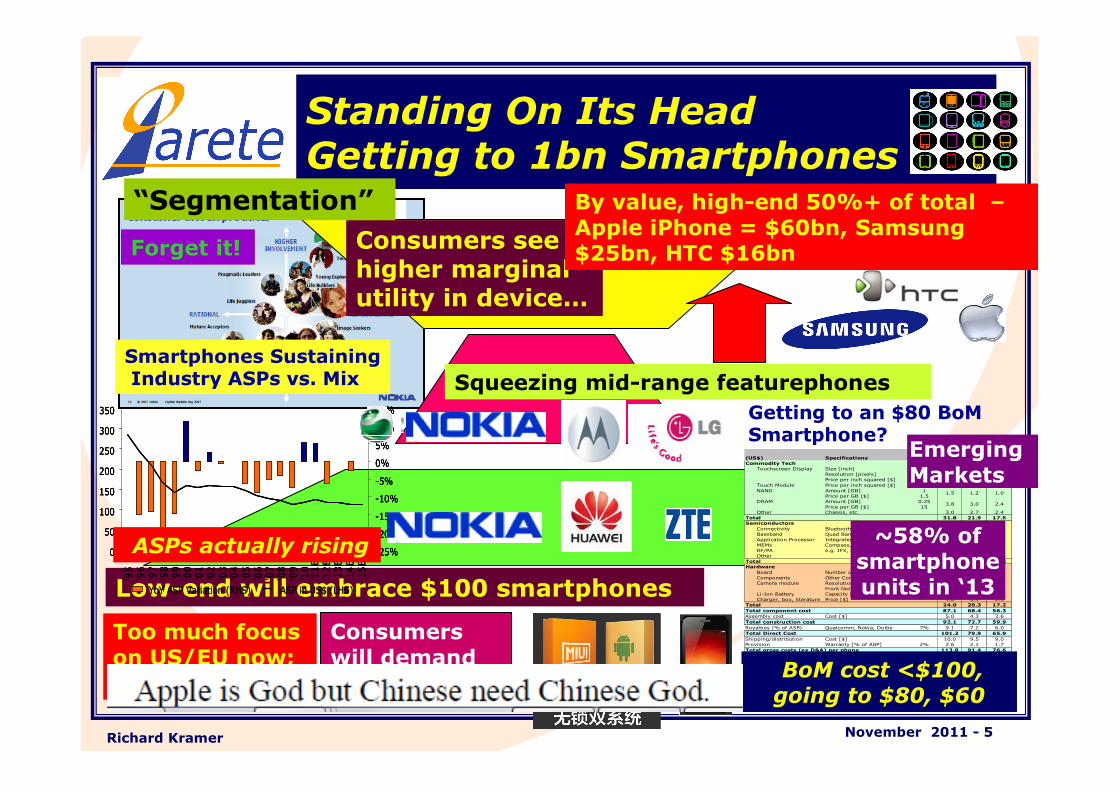
Standing On Its HeadGetting to 1bn Smartphones
Low-end will embrace $100 smartphones
Squeezing mid-range featurephones
Smartphones SustainingIndustry ASPs vs. Mix
'95
'96
'97
'98
'99
'00
'01
'02
'03
'04
'05
'06
'07
'08
'09
'10
'11E
'12E
'13E
'14E
'15E
0
50
100
150
200
250
300
350
-25%
-20%
-15%
-10%
-5%
0%
5%
10%
15%
YoY ASP Variation (RHS) ASP in US$ (LHS)
'95
'96
'97
'98
'99
'00
'01
'02
'03
'04
'05
'06
'07
'08
'09
'10
'11E
'12E
'13E
'14E
'15E
0
50
100
150
200
250
300
350
-25%
-20%
-15%
-10%
-5%
0%
5%
10%
15%
0
50
100
150
200
250
300
350
-25%
-20%
-15%
-10%
-5%
0%
5%
10%
15%
YoY ASP Variation (RHS) ASP in US$ (LHS)
ASPs actually rising
Consumers see higher marginal utility in device…
Getting to an $80 BoMSmartphone?(US$) Specifications Details
Value
'10
Value
'11
Value
'12
Commodity Tech
Touchscreen Display Size [inch] 2.8
Resolution [pixels] 240x320
Price per inch squared [$] 2
Touch Module Price per inch squared [$] 1 7.8 5.9 4.4
NAND Amount [GB] 1
Price per GB [$] 1.5
DRAM Amount [GB] 0.25
Price per GB [$] 15
Other Chassis, etc. 3.0 2.7 2.4
Total 31.8 21.9 17.5
Semiconductors
Connectivity Bluetooth, GPS, WiFi 3.5 2.8 2.2
Baseband Quad Band, HSPA
Application Processor Integrated ARM11 AP/Baseband
MEMs Compass, Mic, etc. 4.3 3.6 3.1
RF/PA e.g. IFX, ST, SWKS, RFMD, etc. 2.6 2.3 2.0
Other 4.0 3.6 3.2
Total 31.4 26.3 21.5
Hardware
Board Number of PCB Layers 4 3.5 3.0 2.5
Components Other Components (Filters, Bus, Conn.) 10.0 8.5 7.2
Camera module Resolution [MP] 3.2
Front facing Camera No
Li-Ion Battery Capacity [mAh] 1100 3.0 2.6 2.3
Charger, box, literature Price [$] 4.0 3.4 2.9
Total 24.0 20.3 17.2
Total component cost 87.1 68.4 56.3
Assembly cost Cost [$] 5.0 4.3 3.6
Total construction cost 92.1 72.7 59.9
Royalties (% of ASP) Qualcomm, Nokia, Dolby 7% 9.1 7.2 6.0
Total Direct Cost 101.2 79.9 65.9
Shipping/distribution Cost [$] 10.0 9.5 9.0
Provision Warranty [% of ASP] 2% 2.6 2.1 1.7
Total gross costs (ex D&A) per phone 113.8 91.4 76.6
Gross margin Implied (%) 12% 11% 10%
ASP [$] 130.0 103.0 85.0
2.3
7.3
1.0
2.4
11.0
2.8
9.1
1.2
3.0
14.017.0
3.5
15.7
1.5
3.8
BoM cost <$100, going to $80, $60
Forget it!
“Segmentation”
~58% of smartphoneunits in ‘13
Emerging Markets
Too much focus on US/EU now; EMs grow to ‘15
By value, high-end 50%+ of total –Apple iPhone = $60bn, Samsung $25bn, HTC $16bn
Consumers will demand local brands
November 2011 - 6Richard Kramer
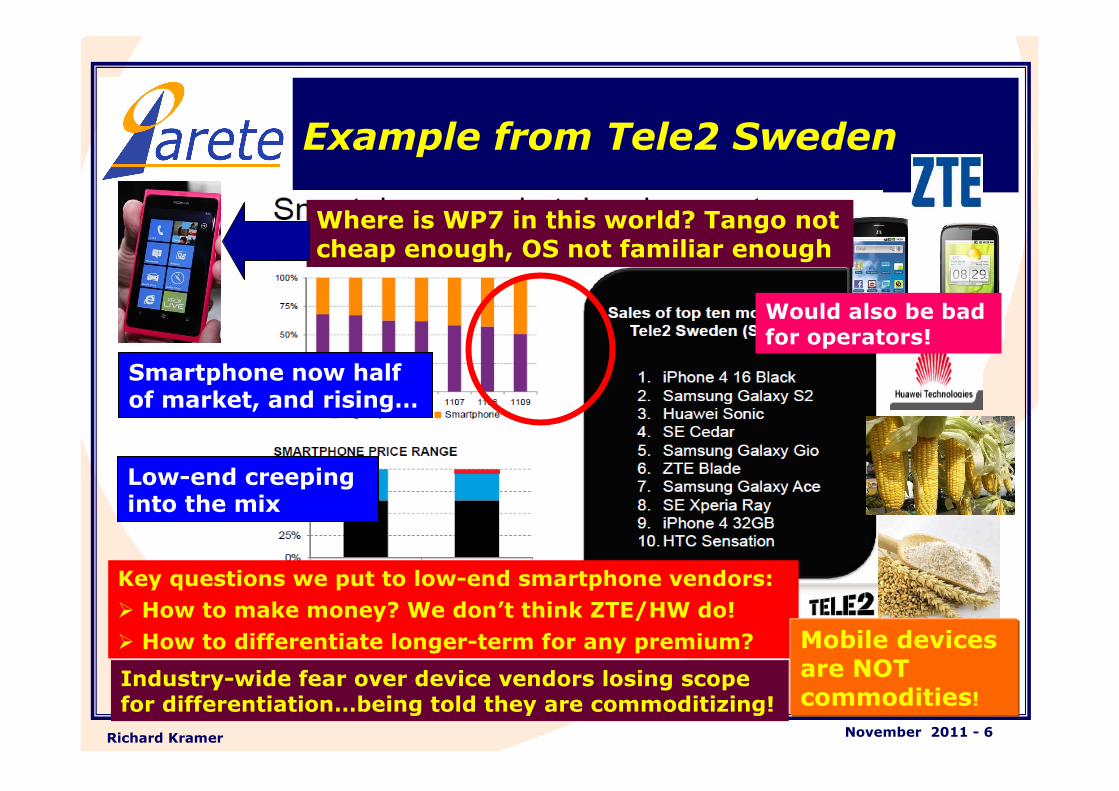
Example from Tele2 Sweden
Smartphone now half of market, and rising…
Low-end creeping into the mix
Key questions we put to low-end smartphone vendors:
� How to make money? We don’t think ZTE/HW do!
� How to differentiate longer-term for any premium?
Where is WP7 in this world? Tango not cheap enough, OS not familiar enough
Mobile devices are NOT commodities!
Industry-wide fear over device vendors losing scope for differentiation…being told they are commoditizing!
Would also be bad for operators!

November 2011 - 7Richard Kramer
Hooked on Tablets
UX not from PCs, but smartphones: SSD, touch, 3G, all-day battery, cloud storage
Tablet Forecast
� Apple’s low iPad gross margins are #1 issue for Android OEMs.
� Who can match Apple’s tech specs AND ecosystem AND retail channel?
July ’10 = ~53m in 2011…
Jan. ’11 = ~55m, more iPad
Media consumption device, like TV or game consoles; further pressures PCs until Win8 comes
40% of BoM = display and touch, not AP or modem! $200 by mid-’12
Kindle Fire: $180 BoM cost?
No 3G. Subsidy to Prime users ($80/yr.)
Puts virtual shop window in consumer’s hands 24/7. =
India = 54 languages, 8 major ones200m+ tablets in next 5 yrs.
Tablets will be the low cost computing platform in emerging markets.
OS = means to an end,
Apps a.k.a. Content
No need to subsidise (netbooks failed)
November 2011 - 8Richard Kramer
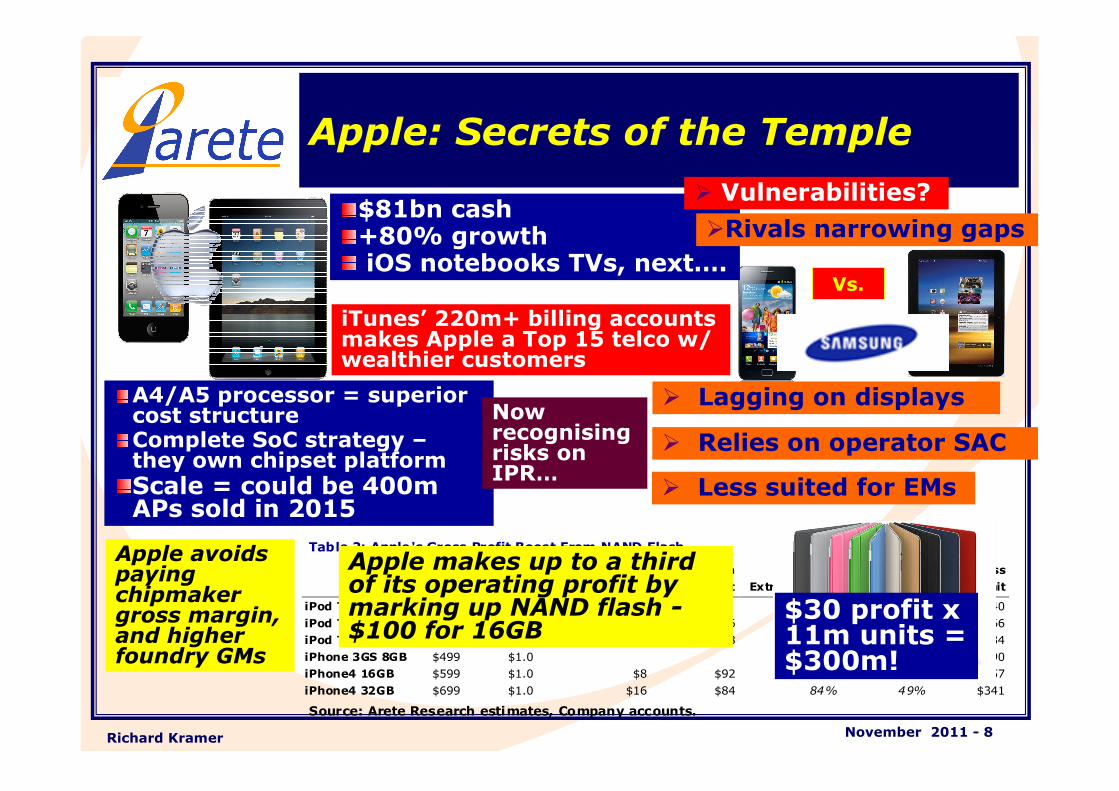
Apple: Secrets of the Temple
Vs.
Table 2: Apple's Gross Profit Boost From NAND Flash
Price Cost/GB Extra Memory
Cost
Add'l Margin
per Unit
Margin on
Extra Memory
Assumed/
Increm. GP
Gross
Profit/Unit
iPod Touch 8GB $199 $1.0 20% $40
iPod Touch 32GB $249 $1.0 $24 $26 52% 26% $66
iPod Touch 64GB $349 $1.0 $32 $68 68% 38% $134
iPhone 3GS 8GB $499 $1.0 38% $190
iPhone4 16GB $599 $1.0 $8 $92 92% 43% $257
iPhone4 32GB $699 $1.0 $16 $84 84% 49% $341
Source: Arete Research estimates, Company accounts.
$81bn cash+80% growth iOS notebooks TVs, next….
iTunes’ 220m+ billing accounts makes Apple a Top 15 telco w/ wealthier customers
A4/A5 processor = superior cost structureComplete SoC strategy –they own chipset platform
Scale = could be 400m APs sold in 2015
� Vulnerabilities?
� Relies on operator SAC
�Rivals narrowing gaps
� Lagging on displays
Apple makes up to a third of its operating profit by marking up NAND flash -$100 for 16GB
Apple avoids paying chipmaker gross margin, and higher foundry GMs
� Less suited for EMs
Now recognising risks on IPR…
$30 profit x 11m units = $300m!
November 2011 - 9Richard Kramer
0.0
5.0
10.0
15.0
20.0
25.0
30.0
35.0
40.0
1Q11 2Q10 3Q10 4Q10 1Q11 2Q11 3Q11 4Q11E
0%
2%
4%
6%
8%
10%
12%
14%
16%
18%
Smartphone
Margins
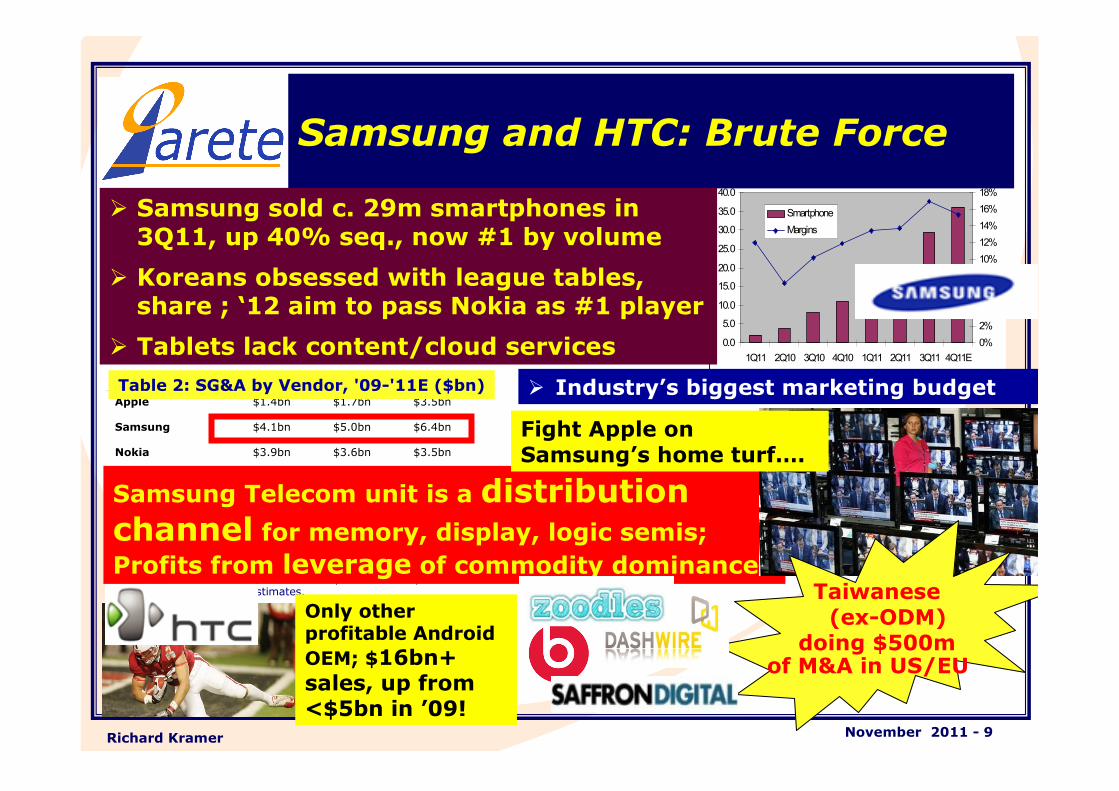
Samsung and HTC: Brute Force
$1.5bn$1.3bn$1.1bnMotorola
$1.2bn$1.2bn$1.5bnSony Ericsson
$1.7bn$0.9bn$0.4bnHTC
$1.8bn$1.4bn$1.2bnRIM
$2.3bn$2.4bn$2.1bnLGE
$3.5bn$3.6bn$3.9bnNokia
$6.4bn$5.0bn$4.1bnSamsung
$3.5bn$1.7bn$1.4bnApple
'11E'10'09
Source: Arete Research estimates.
� Samsung sold c. 29m smartphones in 3Q11, up 40% seq., now #1 by volume
� Koreans obsessed with league tables, share ; ‘12 aim to pass Nokia as #1 player
� Tablets lack content/cloud services
� Industry’s biggest marketing budget
Samsung Telecom unit is a distribution channel for memory, display, logic semis; Profits from leverage of commodity dominance
Fight Apple on Samsung’s home turf….
Taiwanese (ex-ODM)
doing $500m of M&A in US/EU
Table 2: SG&A by Vendor, '09-'11E ($bn)
Only other profitable Android
OEM; $16bn+ sales, up from <$5bn in ’09!

November 2011 - 10Richard Kramer
Nokia and RIM: Troubled Twins
RIM: Doors of Perception,June ‘11
Sharp Turn for the Titanic,May ‘10
Blind Man’s Bluff, Feb. ‘11
Leap
#1
(YE’11)
Make current
portfolio & initial
WP7 competitive;
parity unrealistic
Leap
#2
(1H12)
Leap
#3
(YE12)
Make current
portfolio & initial
WP7 competitive;
parity unrealistic
Aim for parity, or
leapfrog next iterations
of Android, iPhone5;
“unique experience?”
Make current
portfolio & initial
WP7 competitive;
parity unrealistic
Address lower-
tier WP7
segment w/
Apollo release;
Hold Your Horses, Nov. ‘11RIM: Lost in Transition, Sept. ‘11
Key Issue: execution
Nokia and RIM both still profitable, w/ resources, and
desperate … but v. hard to reverse market perceptionand make up for lack of Internet innovation.
November 2011 - 11Richard Kramer
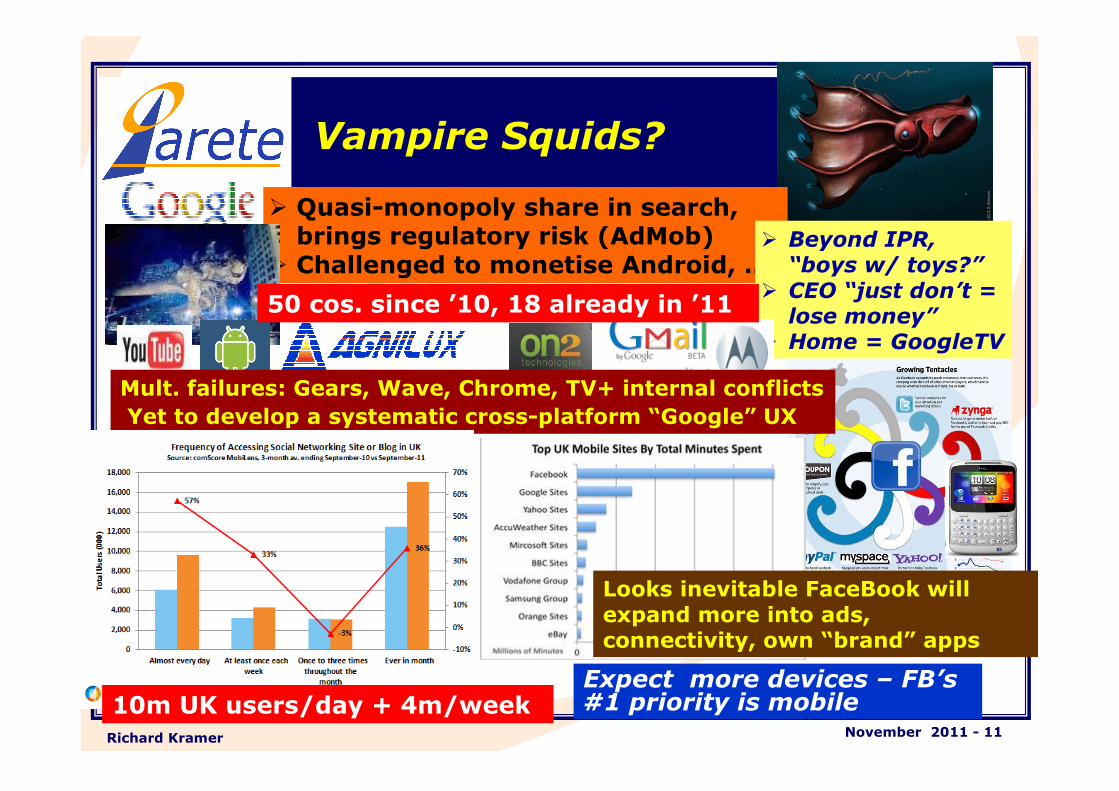
Vampire Squids?
� Quasi-monopoly share in search, brings regulatory risk (AdMob)
� Challenged to monetise Android, …� Beyond IPR,
“boys w/ toys?”� CEO “just don’t =
lose money”� Home = GoogleTV
50 cos. since ’10, 18 already in ’11
Looks inevitable FaceBook will expand more into ads, connectivity, own “brand” apps
Mult. failures: Gears, Wave, Chrome, TV+ internal conflicts
Yet to develop a systematic cross-platform “Google” UX
10m UK users/day + 4m/week Expect more devices – FB’s#1 priority is mobile
November 2011 - 12Richard Kramer
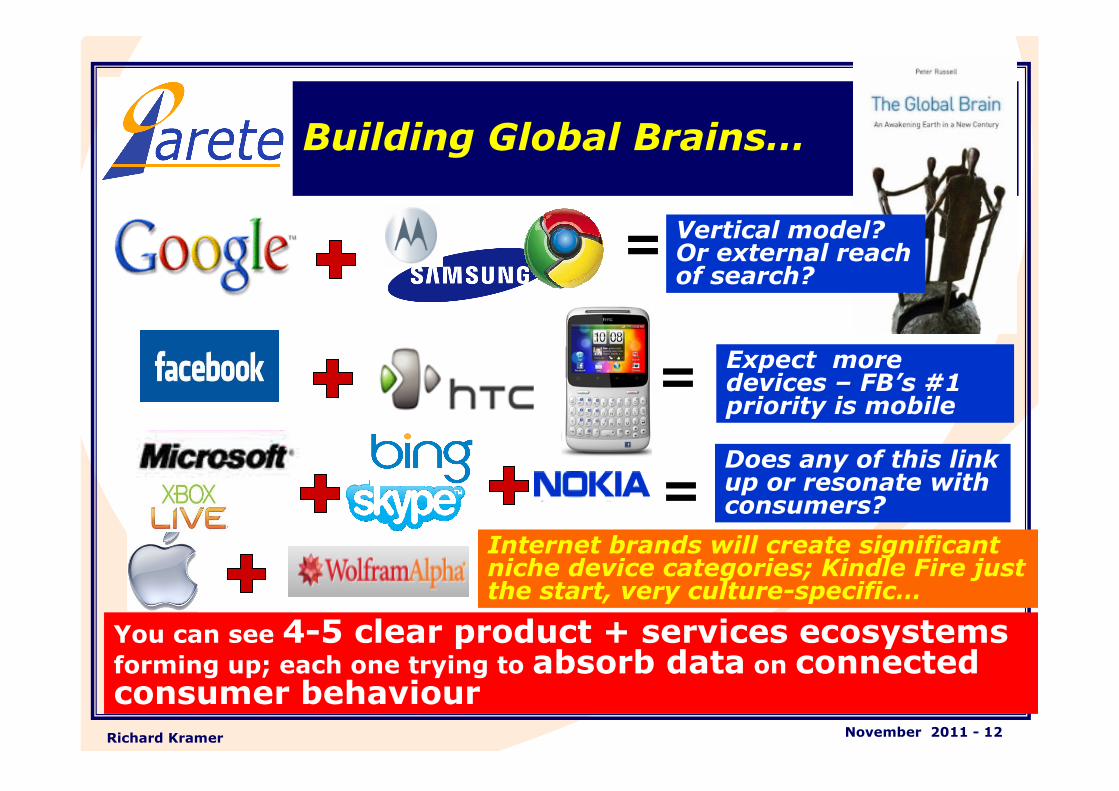
Building Global Brains…
Internet brands will create significant niche device categories; Kindle Fire just the start, very culture-specific…
=
=
=
Vertical model? Or external reach of search?
Expect more devices – FB’s #1 priority is mobile
Does any of this link up or resonate with consumers?
You can see 4-5 clear product + services ecosystemsforming up; each one trying to absorb data on connected consumer behaviour
November 2011 - 13Richard Kramer
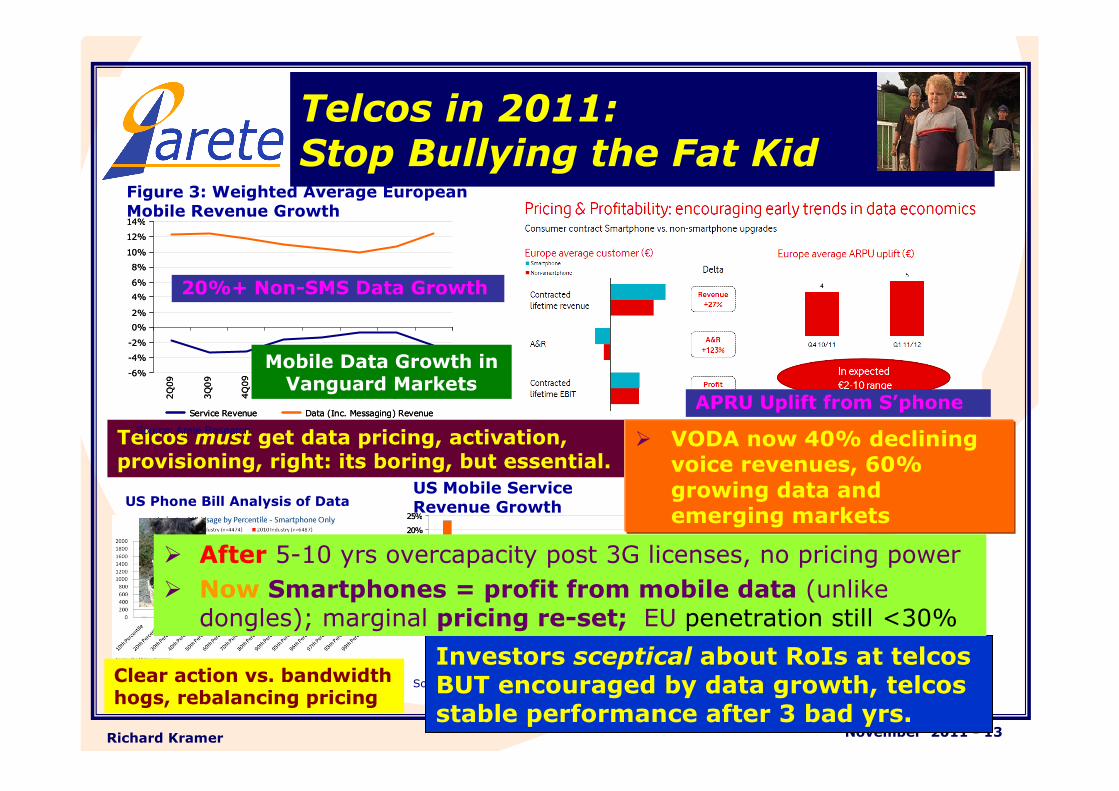
Telcos in 2011:Stop Bullying the Fat Kid
US Phone Bill Analysis of Data
Clear action vs. bandwidth hogs, rebalancing pricing
Telcos must get data pricing, activation, provisioning, right: its boring, but essential.
US Mobile Service Revenue Growth
-10%
-5%
0%
5%
10%
15%
20%
25%
Metro
Leap
AT&T
VZW
Sprint
TMO U
S
nTelos
Cincinnati
Bell
4Q10 1Q11
-10%
-5%
0%
5%
10%
15%
20%
25%
Metro
Leap
AT&T
VZW
Sprint
TMO U
S
nTelos
Cincinnati
Bell
4Q10 1Q11
Source: Arete Research.
� VODA now 40% declining voice revenues, 60% growing data and emerging markets
Investors sceptical about RoIs at telcosBUT encouraged by data growth, telcosstable performance after 3 bad yrs.
� After 5-10 yrs overcapacity post 3G licenses, no pricing power
� Now Smartphones = profit from mobile data (unlike dongles); marginal pricing re-set; EU penetration still <30%
APRU Uplift from S’phone
Figure 3: Weighted Average European Mobile Revenue Growth
-6%
-4%
-2%
0%
2%
4%
6%
8%
10%
12%
14%
2Q09
3Q09
4Q09
1Q10
2Q10
3Q10
4Q10
1Q11
Service Revenue Data (Inc. Messaging) Revenue
-6%
-4%
-2%
0%
2%
4%
6%
8%
10%
12%
14%
2Q09
3Q09
4Q09
1Q10
2Q10
3Q10
4Q10
1Q11
Service Revenue Data (Inc. Messaging) Revenue
Source: Arete Research.
20%+ Non-SMS Data Growth
Mobile Data Growth in Vanguard Markets
November 2011 - 14Richard Kramer
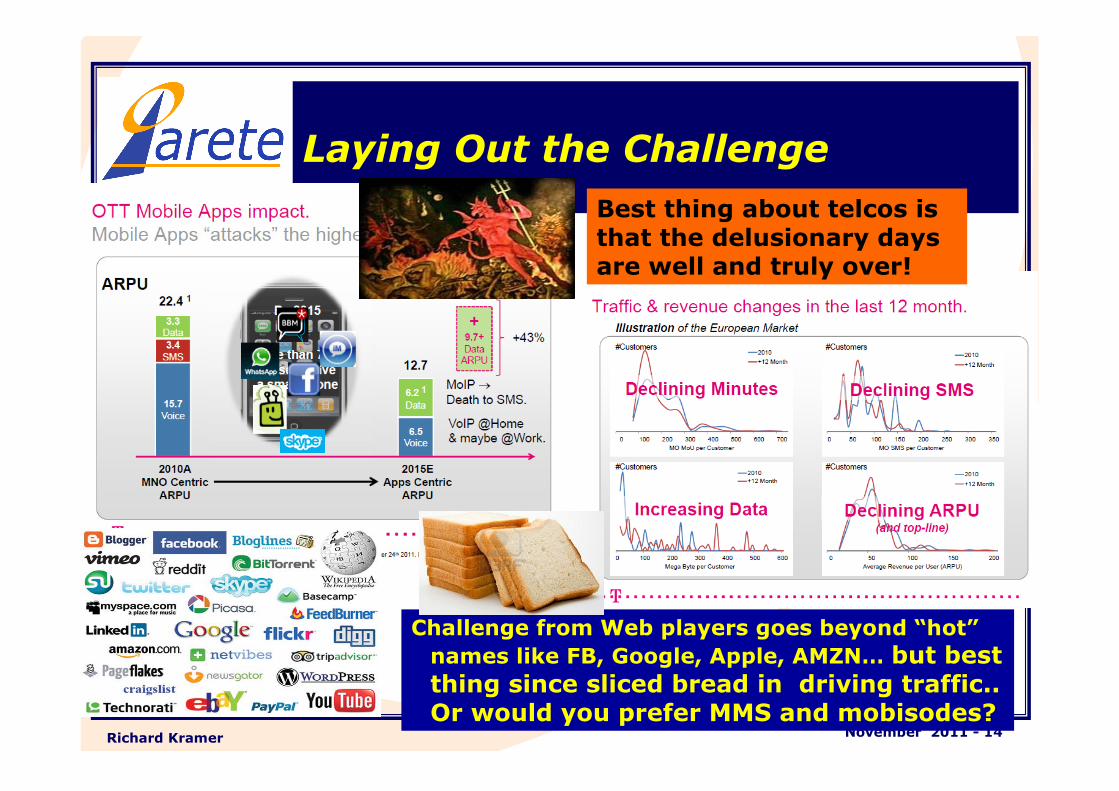
Laying Out the Challenge
Challenge from Web players goes beyond “hot”
names like FB, Google, Apple, AMZN… but best thing since sliced bread in driving traffic.. Or would you prefer MMS and mobisodes?
Best thing about telcos is that the delusionary days are well and truly over!
November 2011 - 15Richard Kramer
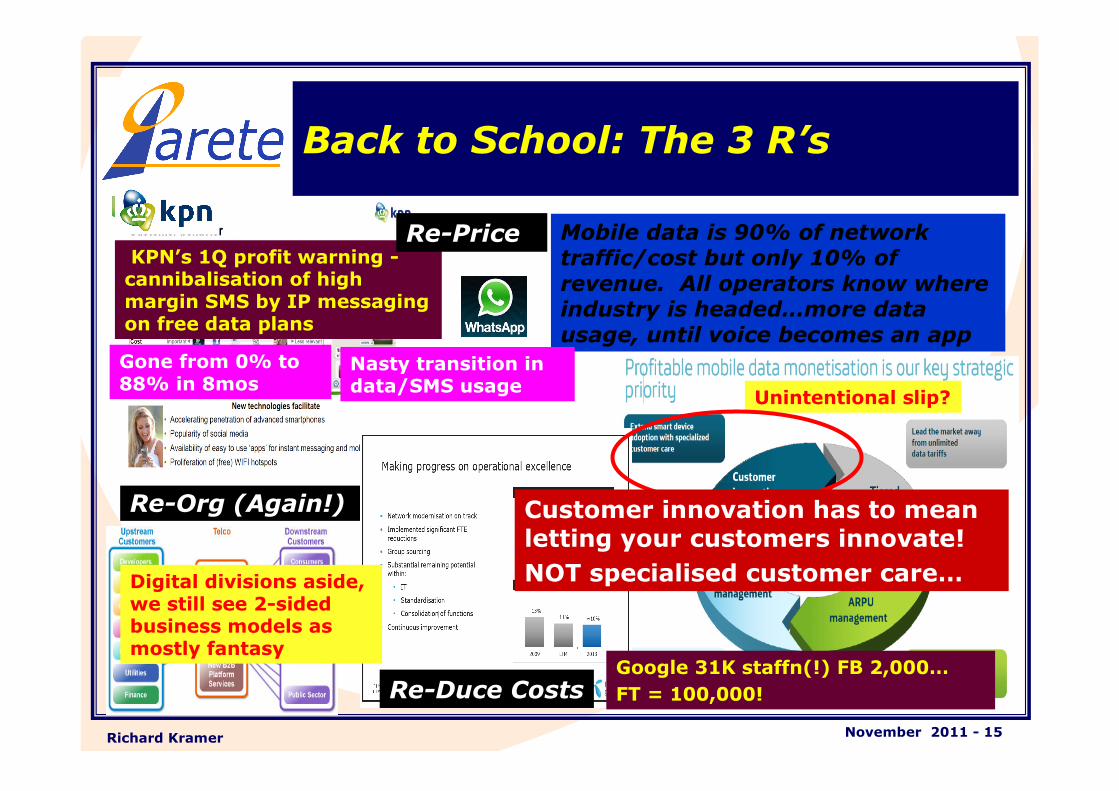
Back to School: The 3 R’s
KPN’s 1Q profit warning -cannibalisation of high margin SMS by IP messaging on free data plans
Re-Price Mobile data is 90% of network traffic/cost but only 10% of revenue. All operators know where industry is headed…more data usage, until voice becomes an app
Re-Org (Again!)
Unintentional slip?
Re-Duce CostsGoogle 31K staffn(!) FB 2,000…
FT = 100,000!
Digital divisions aside, we still see 2-sided business models as mostly fantasy
Nasty transition in data/SMS usage
Gone from 0% to 88% in 8mos
Customer innovation has to mean letting your customers innovate!
NOT specialised customer care…

November 2011 - 16Richard Kramer
Two Definitions of LTE
LTE: Late, Tempting, Elusive Jun. '09
Testing
The laTEr
the better!
LaTE!LTE Outside US & Japan, LTE best
remains a niche, still several yrs. off, marred foremost by inconsistent spectrum, rel. few devices
Optimisation� Still attractive capacity additions via HSPA+ to 42Mbps….
� Lot to do w/ 2G infra. (M2M)
This is not RoI on LTE per se, but RoI on unstoppable data demand in a (and artificially) supply-constrained industry – and inevitablity of moving to single RAN
Nokia Ultra-Site 2G+ 3G started
the ball rolling…
Less Transforming than Expected
We said in ’09 LTE faces (sensible) delays; better right than early – 2.5 years later, the first 100s of 1000s of customers are now appearing
� LTE/4G not going to change usage per se..
� Initially adds costs to devices, power issues, etc.; will bring another hype cycle from vendors
� Will help improve UX … but only eventually!
Business Model

November 2011 - 17Richard Kramer
Mobile Ads, Mobile Money
‘06 ‘07 ‘08 ‘09 ‘10‘08 ‘09 ‘10 ‘11 ‘12‘10 ‘11 ‘12 ‘13 ‘14‘12 ‘13 ‘14 ‘15 ‘16
Mobile Ad Forecasts
� Operators want NFC to be SIM based to manage authentication, security
� Credit card companies do not want SIM and say telcos can’t manage risk.
IssuerBank<2%
Visa, MCInterLink<1%
AcquirerBank<1%
MerchantHas to Pay Some…
� Who makes money?
Not yet clear who monetises mobile advertising, under which model:
� Telcos? ISPs? Web Brands?
� Trad. agencies going digital?
Then mobile advertising Behaviour change?
PoS?Use case?
Regulatory issues
November 2011 - 18Richard Kramer
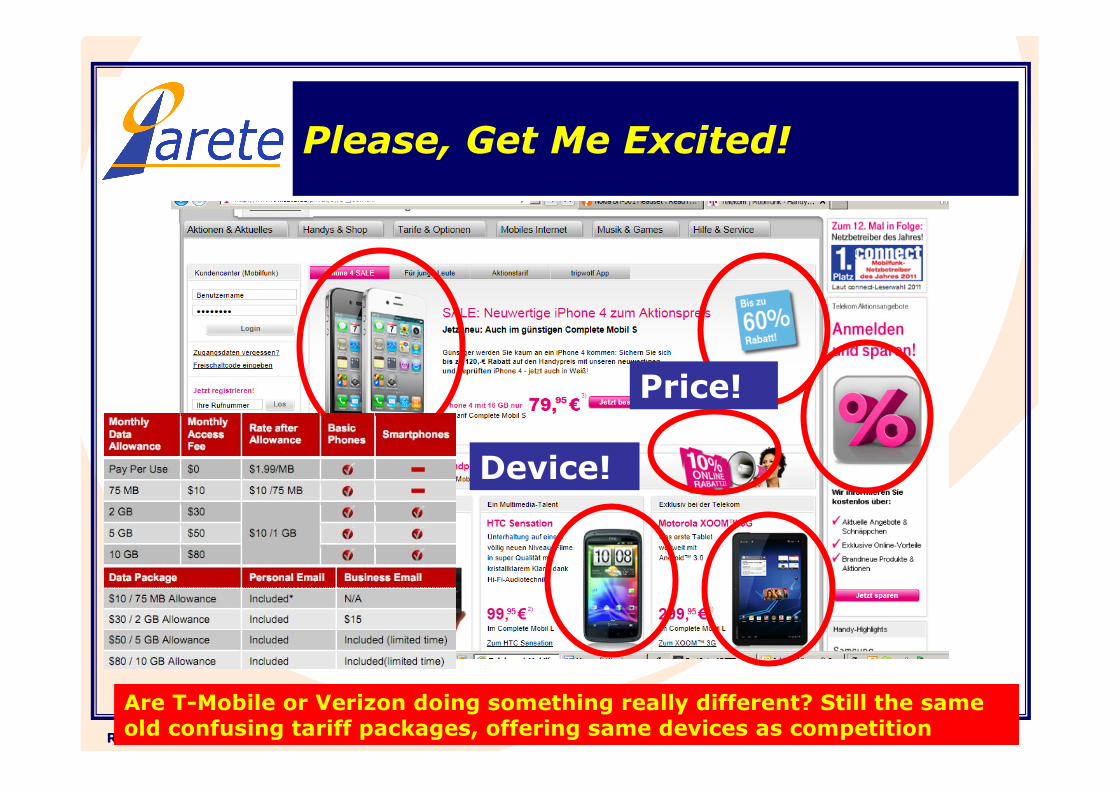
Please, Get Me Excited!
Are T-Mobile or Verizon doing something really different? Still the same old confusing tariff packages, offering same devices as competition
Price!
Device!
November 2011 - 19Richard Kramer
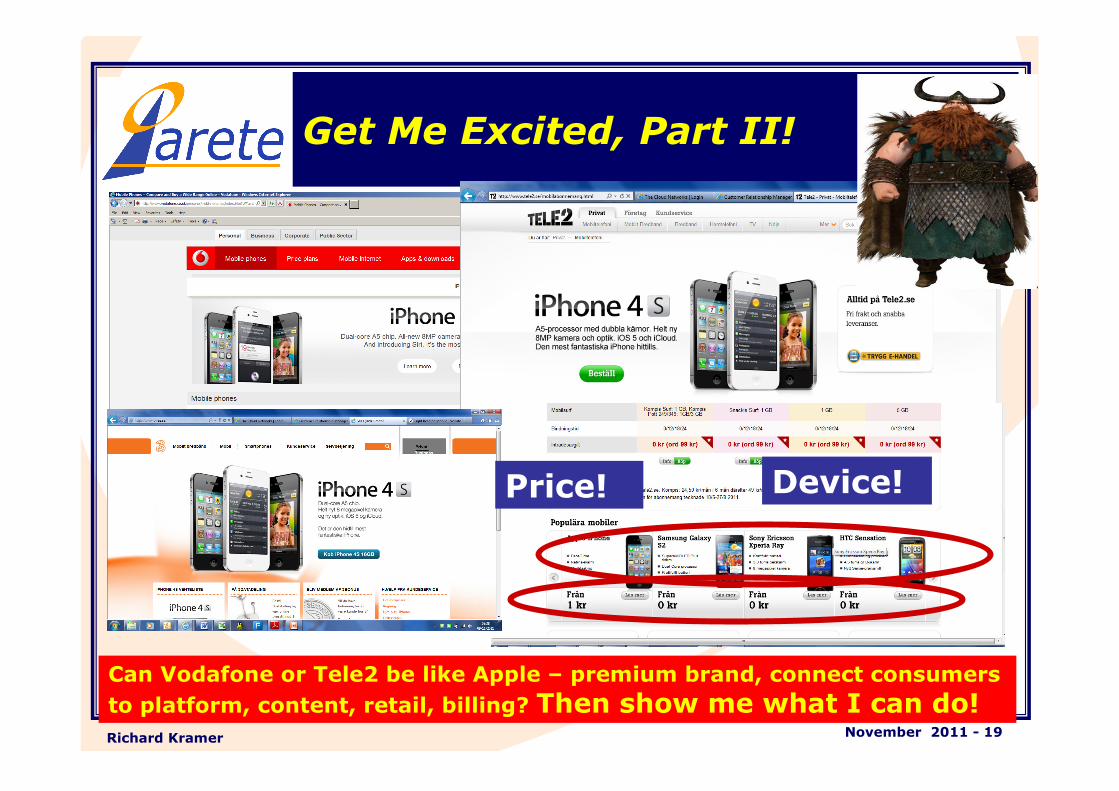
Get Me Excited, Part II!
Can Vodafone or Tele2 be like Apple – premium brand, connect consumers
to platform, content, retail, billing? Then show me what I can do!
Price! Device!
November 2011 - 20Richard Kramer
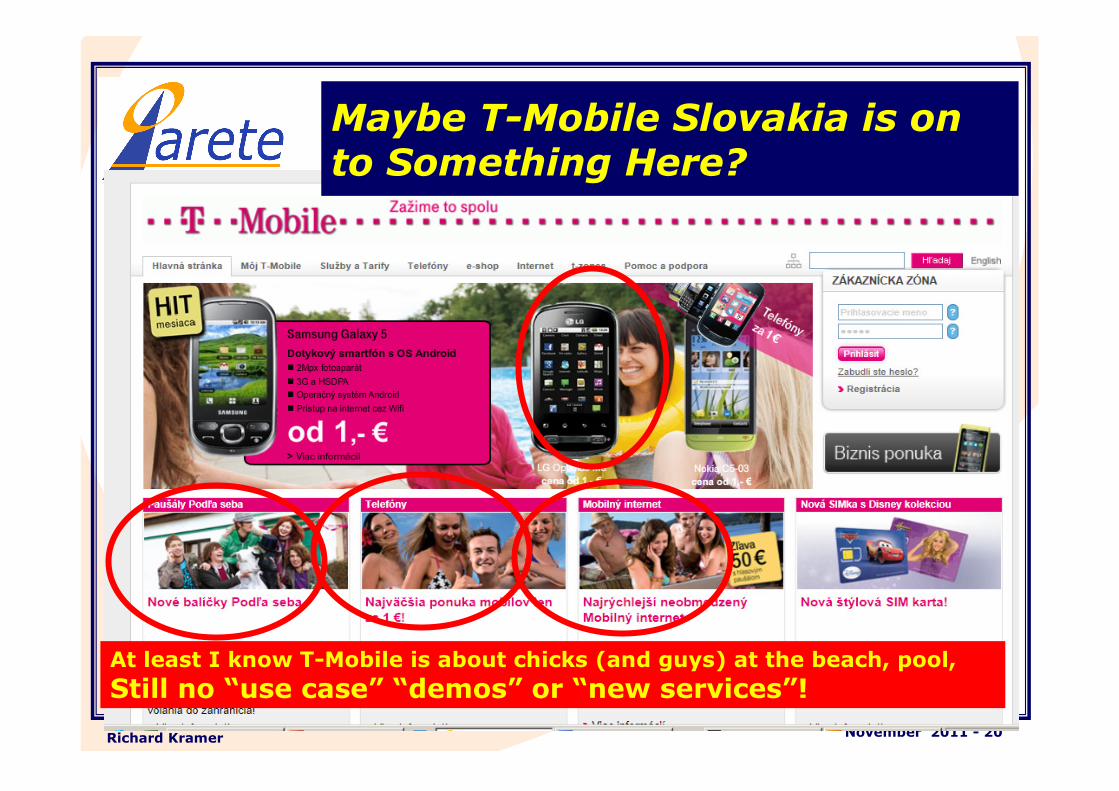
Maybe T-Mobile Slovakia is on to Something Here?
At least I know T-Mobile is about chicks (and guys) at the beach, pool,
Still no “use case” “demos” or “new services”!
November 2011 - 21Richard Kramer
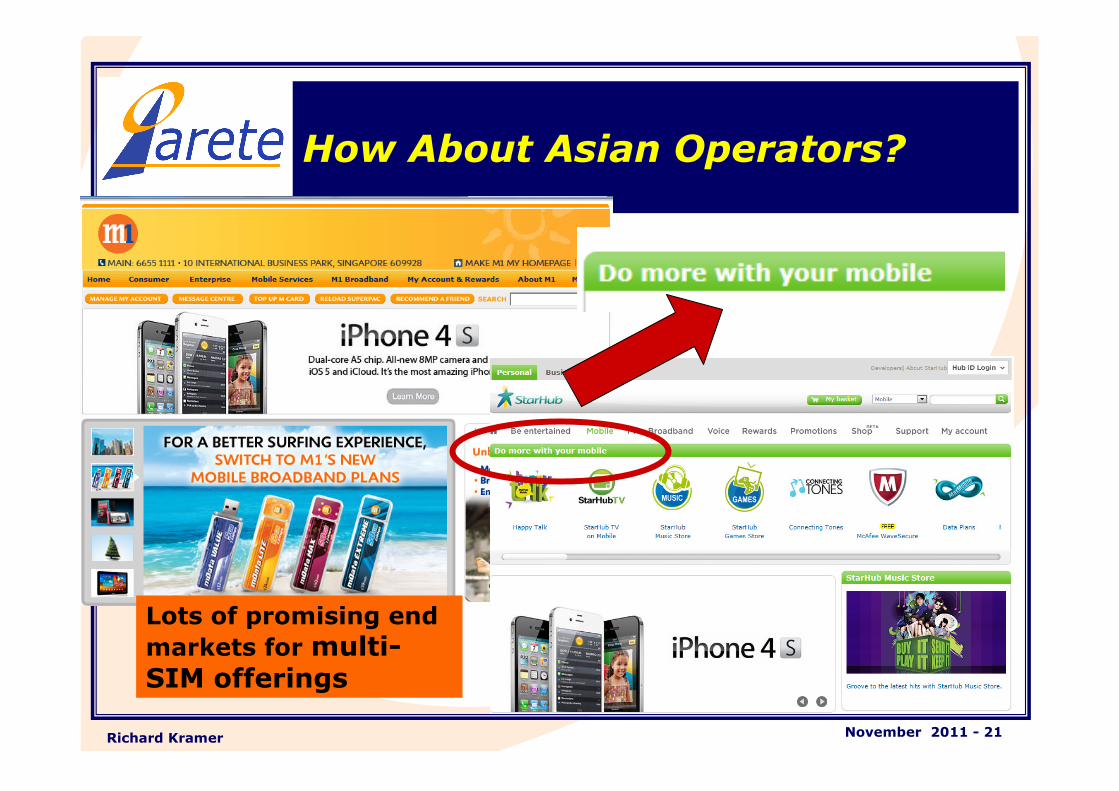
How About Asian Operators?
Lots of promising end
markets for multi-SIM offerings

November 2011 - 22Richard Kramer
Some Other Approaches?
Like Google, start with Search….
Weiβer Spargel, Surstromming, Chili Crab?
What’s unique customer experience on any operator?
What can any telco offer that its competitors won’t or can’t?
� A few hit apps branded by operator
that work on any platform: based on customer insight - location, contacts, usage, etc.
Create “radical chic” buzz around high-end tech: TelcoNext?Build communities!
Lots of clutter…
and one device!
November 2011 - 23Richard Kramer
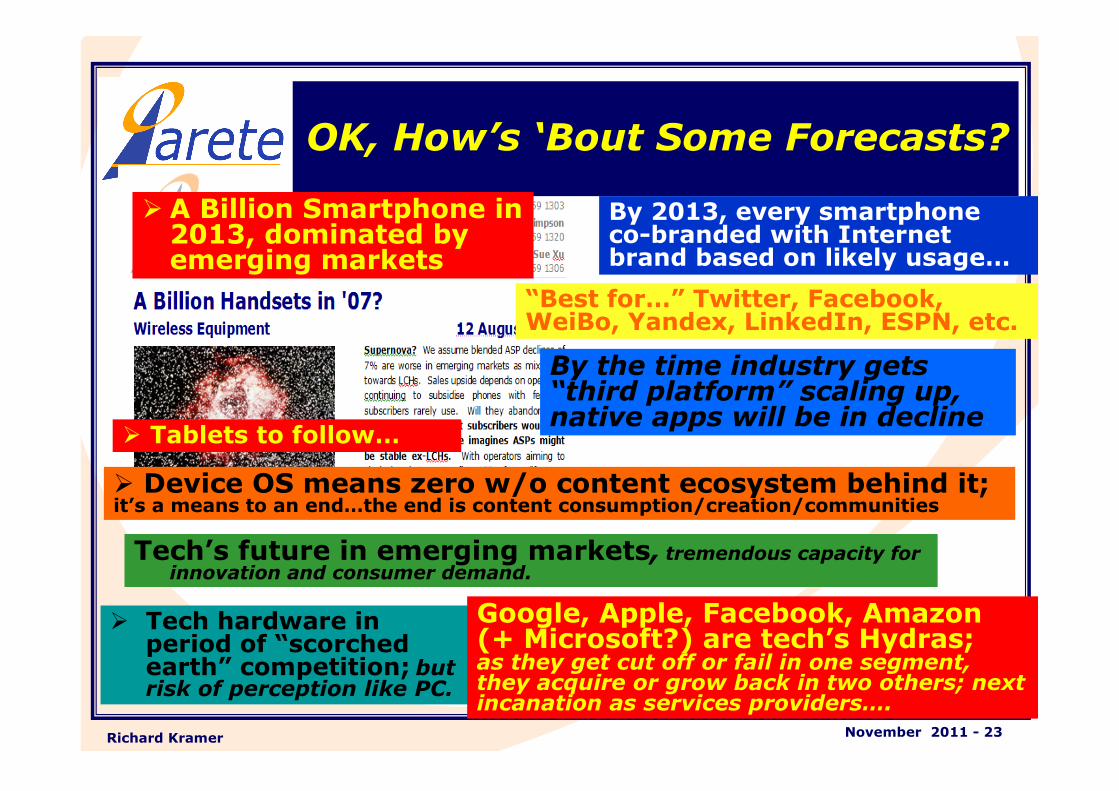
OK, How’s ‘Bout Some Forecasts?
� A Billion Smartphone in 2013, dominated by emerging markets
By 2013, every smartphoneco-branded with Internet brand based on likely usage…
“Best for…” Twitter, Facebook, WeiBo, Yandex, LinkedIn, ESPN, etc.
� Tablets to follow…
By the time industry gets “third platform” scaling up, native apps will be in decline
� Device OS means zero w/o content ecosystem behind it;it’s a means to an end…the end is content consumption/creation/communities
Tech’s future in emerging markets, tremendous capacity for innovation and consumer demand.
� Tech hardware in period of “scorched earth” competition; but risk of perception like PC.
Google, Apple, Facebook, Amazon (+ Microsoft?) are tech’s Hydras;as they get cut off or fail in one segment, they acquire or grow back in two others; next incanation as services providers….