Embed Size (px)
Citation preview

Enterprise EHS Software Solutions
SPILL PREVENTION THROUGH ENVIRONMENTAL RISK MANAGEMENT

Enterprise EHS Software Solutions
FIND OUT MORE
REPORTING
SPILL PREVENTION PLANS
CONSTRUCTING A RISK MODEL

Enterprise EHS Software Solutions
INTRODUCTION
REPORTING
CONSTRUCTING A RISK MODEL
SPILL PREVENTION PLANS

Enterprise EHS Software Solutions
Spill Prevention Plans are operating procedures that prevent spills.
Your plan should control measures to prevent spills from reaching environment
Countermeasures to contain, clean up and mitigate effects of a spill

Enterprise EHS Software Solutions
Why Use a Spill Prevention Plan?
Provincial, state, federal penalties
PR issues, stock price
Remediation/restoration activities

Enterprise EHS Software Solutions6
A SPILL PREVENTION PLAN SHOULD FORM PART OF YOUR ENVIRONMENTAL RISK MANAGEMENT
FRAMEWORK
• Set of coordinated activities that direct an organization’s actions in order to reduce risk
• Enables EHS professionals to proactively identify and rank risks
• Decrease reliance upon professional judgement

Enterprise EHS Software Solutions
ENVIRONMENTAL RISK MANAGEMENT
RISKASSESSMENT
ANDTREATMENT
OPTIONS
STAKEHOLDERSDECISION MAKING
OPERATIONS TO REDUCE
RISK
ENGAGE
CONCERNS
MONITOR
ACTIONSCONTEXT
RISK CONTROLOPTIONS
Fig 1: NERAM Benchmark Risk Management Framework
Enterprise EHS Software Solutions
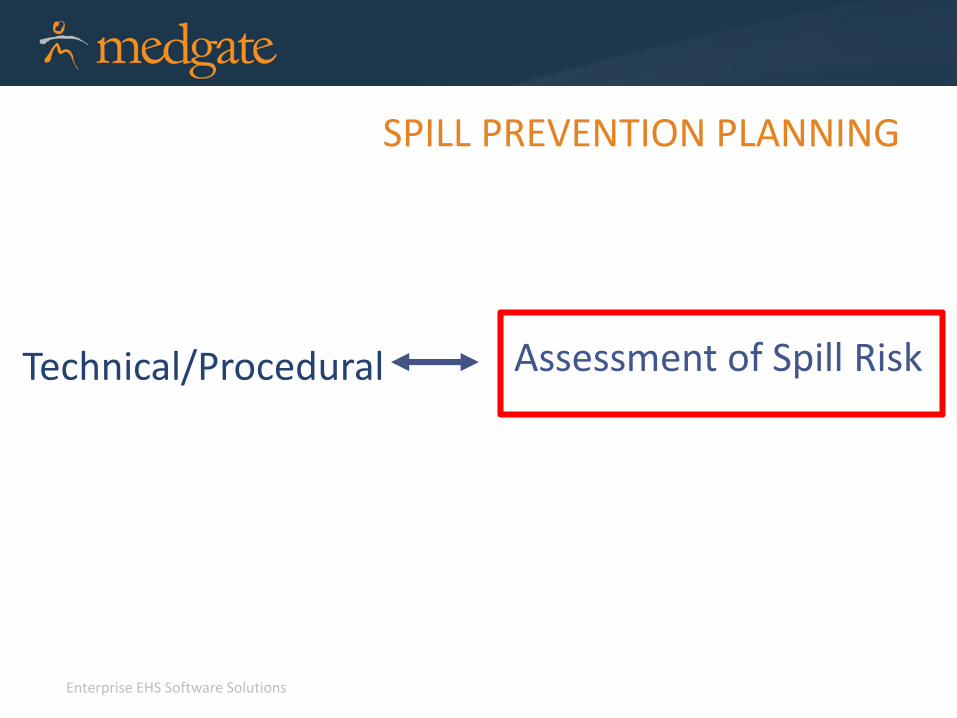
SPILL PREVENTION PLANNING
Technical/Procedural Assessment of Spill Risk

Enterprise EHS Software Solutions
INTRODUCTION
REPORTING
SPILL PREVENTION PLANS
CONSTRUCTING A RISK MODEL

Enterprise EHS Software Solutions
COMPONENTS OF A SPILL PREVENTION RISK ASSESSMENT
1. Hazard Identification
2. Estimating Spill Likelihood
3. Estimating Potential Spill Severity
4. Risk Analysis & Priority Ranking
5. Prevention Planning

Enterprise EHS Software Solutions
STEP 1: HAZARD IDENTIFICATION
• Complete materials inventory
• History of organization’s spills/leaks
• Adverse effects of agents when combined
• Potential routes into environment (storage/transportation/use)
• Potential for failures in controls/machinery
• Environmental fate

Enterprise EHS Software Solutions
STEP 2. ESTIMATING SPILL LIKELIHOOD
• Historical weather data
• Equipment failure rates
• Preventative maintenance data
• Professional judgement
• Human error analysis

Enterprise EHS Software Solutions
STEP 2. ESTIMATING SPILL LIKELIHOOD
Qualitative Approach Likelihood/Probability Description
Very unlikely Less than 1 event every 200 years
Unlikely At least 1 event every 200 years
Possible At least 1 event every 30 years
Very Possible At least 1 event every 10 years
Certain 1 or more event every year
Level Descriptor Example description
A Almost certain Is expected to occur in most circumstances
B Likely Will probably occur in most circumstances
C Possible Might occur or should occur at some time
D Unlikely Could occur at some time
E Rare May occur only in exceptional circumstances

Enterprise EHS Software Solutions
STEP 2. ESTIMATING SPILL LIKELIHOOD
Semi-Qualitative Approach
Weight Possiblility
Frequent (5) 1 or more events per year
Probably (4) 12 or more events per 10 years
Occasional (3) 1 or more events per 3 years
Remote (2) 1 or more events per 200 years
Improbable (1) Less than one event in 200 years

Enterprise EHS Software Solutions
STEP 3. ESTIMATING POTENTIAL SPILL SEVERITY
• Physical and chemical characteristics of the agent
• Into which media the agent is released (air/land/water)
• Human health/environmental threats posed by the agent
• Professional judgement

Enterprise EHS Software Solutions
STEP 3. ESTIMATING POTENTIAL SPILL SEVERITY
Qualitative
Impact Description
Catastrophic May cause fatalities
Severe Impacts to health (non-fatal) or widespread injury or damage to the environment that is difficult to remediate
Moderate Material discomfort of localized impacts to property or the natural environment that can be remediated
Low Easily remediated impacts toindividual property
None No impact
Consequence (Risk Weight)
Public Health Consequences
Catastrophic(100)
Multiple fatalities and injuries
Major (60) Single fatality, permanent total disability
Serious (25) Major injury, partial injury or longer term injury
Moderate (10) Minor injury, medical aid or low severity impairment
Minor (2) Slight injury, illness, first aid not required
Semi-Qualitative

Enterprise EHS Software Solutions
STEP 4. RISK ANALYSIS & PRIORITY RANKING
Likelihood x Severity = Relative Risk of a Spill
STEP 2 STEP 3 STEP 4

Enterprise EHS Software Solutions
STEP 4. RISK ANALYSIS & PRIORITY RANKING
Risk Matrix:
Like
liho
od
of
occ
urr
en
ce Certain
Very Possible
Possible
Unlikely
Very unlikely
None Low Moderate Severe Catastrophic
Impact/Adverse Effect

Enterprise EHS Software Solutions
STEP 4. RISK ANALYSIS & PRIORITY RANKING
Risk Matrix:
Likelihood Consequences
1 Insignificant 2 Minor 3 Moderate 4 Major 5 Catastrophic
A (almostcertain)
Moderate High Very high Very high Very high
B (likely) Moderate High High Very high Very high
C (possible) Low Moderate High Very high Very high
D (unlikely) Low Low Moderate High Very high
E (rare) Low Low Moderate High High

Enterprise EHS Software Solutions
STEP 4. RISK ANALYSIS & PRIORITY RANKING
Risk Registry Table:
Risk Score (R) Risk Level Action Required
>400 Extreme Risk Cannot tolerate – immediate action necessary to reduce risk
100-400 High Risk Unacceptable for long-term, must implement risk controls
30-100 Moderate Risk Undesirable, evaluate risk reduction measures in long-term
<30 Low Risk No mitigation necessary, periodic evaluation to maintain low level

Enterprise EHS Software Solutions
Risk Score (R) Risk Level Action Required
>400 Extreme Risk Cannot tolerate – immediate action necessary to reduce risk
100-400 High Risk Unacceptable for long-term, must implement risk controls
30-100 Moderate Risk Undesirable, evaluate risk reduction measures in long-term
<30 Low Risk No mitigation necessary, periodic evaluation to maintain low level
RISK THRESHOLD & PRIORITIZATION
Like
liho
od
of
occ
urr
ence Certain
Very Possible
Possible
Unlikely
Very unlikely
None Low Moderate Severe Catastrophic
Impact/Adverse Effect
?
?

Enterprise EHS Software Solutions
EXAMPLE: PULP & PAPER INDUSTRY
• Sodium Hydroxide
• Receive Shipment –Rail Tank Cars
• Sodium Hydroxide
• Tank Storage
• Effluent/Sludge
• Transportation to Thermal Evaporators
• Effluent/Sludge
• Storage for thermal evaporators
1 2
3 4

Enterprise EHS Software Solutions
EXAMPLE: PULP AND PAPER INDUSTRY
1 2
3 4
X
X
XX

Enterprise EHS Software Solutions
TRANSPARENCY & REPEATABILITY
• Documentation is a critical component of any Risk Assessment:
What are the Risk Assessment inputs
How are risk estimates reached?
Documented action plan per risk category

Enterprise EHS Software Solutions
STEP 5: PREVENTION PLANNING
• Risk level and prioritization can now be fed back into the Risk Management Framework for prevention planning and the institution of controls

Enterprise EHS Software Solutions
STEP 5: PREVENTION PLANNING
• Documentation
• Preventative/Corrective Actions

Enterprise EHS Software Solutions
FIND OUT MORE
REPORTING
SPILL PREVENTION PLANS
CONSTRUCTING A RISK MODEL

Enterprise EHS Software Solutions
PRIORITIZATION, REPORTING & TRENDING
Enterprise EHS Software Solutions
REPORTING
• Robust and consistent benchmark for estimating risk
• Movement away from reliance on professional judgement and toward a repeatable, transparent process
• Prioritization of controls and corrective actions

Enterprise EHS Software Solutions
FIND OUT MORE
REPORTING
SPILL PREVENTION PLANS
CONSTRUCTING A RISK MODEL

Enterprise EHS Software Solutions
This presentation was used for a webinar on spill prevention which you can watch for free here: http://www2.medgate.com/environmental-risk-slideshare
WATCH THE WEBINAR