Embed Size (px)
Citation preview

Solar Electric Dealers 2004:
Dynamic Markets, Significant Opportunities,
Challenging Threats
Meredith McClintock
Coast Hills Partners
158 Pinon Drive Portola Valley, California 94028
[email protected] (650) 255 -1828
www.coasthillspartners.com

COAST HILLS PARTNERS
SOLAR ELECTRIC DEALERS 2004: DYNAMIC MARKETS, SIGNIFICANT OPPORTUNITIES, CHALLENGING THREATS
Here’s what solar industry leaders are saying about Solar Dealers 2004:
“It is by far the most comprehensive report that I have ever seen about the installation side of our industry… It’s rare that I receive an industry report that I actually download, read through, and highlight.”
-- Barry Cinnamon, President, Akeena Solar
“I found it well researched and informative.” -- Gary T. Gerber, President, Sun Light & Power Company
“…very comprehensive and very well done… [I]t was gratifying to have my assumptions validated with such good data.” -- Tom McCalmont, President, REgrid Power
“Bang on with a host of points… There is ‘coaching’ value in this document.”
-- Louis A. Regaud, Founder, Halus Power Systems
“A trenchant analysis. Useful and provocative. Well done!”
-- David Hughes, President, Affordable Solar Group, LLC
© 2004-2005 COAST HILLS PARTNERS, INC. WWW.COASTHILLSPARTNERS.COM ALL RIGHTS RESERVED 2
-- David Hughes, Affordable Solar Group, LLC

COAST HILLS PARTNERS
SOLAR ELECTRIC DEALERS 2004: DYNAMIC MARKETS, SIGNIFICANT OPPORTUNITIES, CHALLENGING THREATS
Contents
I. Executive Summary .......................................................... 6
The Market 6
The Companies 7
The Customers & the Market 8
Competitive Dynamics 10
Pricing & Cost Structure 11
Marketing 12
Recommendations 12
Strategic 12
Policy 14
Further Research 14
II. Acknowledgements........................................................ 16
III. Company Profiles.......................................................... 17
Definition of a Solar Electric Dealer 17
Company Representatives 17
Ages of Companies 18
Revenues 20
Market Segments Served 22
Distribution Channels 23
© 2004-2005 COAST HILLS PARTNERS, INC. WWW.COASTHILLSPARTNERS.COM ALL RIGHTS RESERVED 3
Geographic Coverage 25
COAST HILLS PARTNERS
SOLAR ELECTRIC DEALERS 2004: DYNAMIC MARKETS, SIGNIFICANT OPPORTUNITIES, CHALLENGING THREATS
Summary and Conclusions 28
IV. Customer Profiles ......................................................... 29
Residential Customer Attributes 29
Target Residential Customer Motivations 31
Commercial Customer Attributes 35
Target Commercial Customer Motivations 38
The Bay Area Customer Base as Representative 39
Summary and Conclusions 40
V. Market & Trends ............................................................ 42
The Solar Electric Market 42
Business Conditions & Future Expectations 43
Market Trends 48
Impact of Electricity & Oil Price Volatility on Demand 50
Impact on Businesses if Incentives are Phased Out 52
Opportunities and Threats 53
Summary and Conclusions 56
VI. Company Approaches to Growth ................................. 57
Recent Growth Rates 57
Growth Strategies 60
Summary and Conclusions 65
VII. Competition.................................................................. 66
Competitors Identified by Respondents 66
Sources of Competitive Advantage 68
© 2004-2005 COAST HILLS PARTNERS, INC. WWW.COASTHILLSPARTNERS.COM ALL RIGHTS RESERVED 4
Summary and Conclusions 69

COAST HILLS PARTNERS
SOLAR ELECTRIC DEALERS 2004: DYNAMIC MARKETS, SIGNIFICANT OPPORTUNITIES, CHALLENGING THREATS
VIII. Pricing & Cost Structure ............................................. 71
Residential Pricing 71
Commercial Pricing 78
Sources of Supply 81
Revenue Per Employee 82
Contractors 85
Profitability 87
Summary and Conclusions 87
IX. Marketing Strategies & Tactics..................................... 89
Marketing Methods Utilized 89
Sources of New Business 92
Marketing Personnel 94
Marketing Expenditures 95
Summary and Conclusions 99
X. Company Motivations .................................................. 101
XI. Conclusion: Findings & Recommendations............... 103
Findings 103
Recommendations 105
Strategic 105
Policy 106
Further Research 107
XII. Study Methodology.................................................... 108
© 2004-2005 COAST HILLS PARTNERS, INC. WWW.COASTHILLSPARTNERS.COM ALL RIGHTS RESERVED 5
XIII. About Coast Hills Partners........................................ 114
COAST HILLS PARTNERS
SOLAR ELECTRIC DEALERS 2004: DYNAMIC MARKETS, SIGNIFICANT OPPORTUNITIES, CHALLENGING THREATS
I.
I. Executive Summary
This report analyzes the characteristics of and market dynamics surrounding solar electric dealers in the Greater San Francisco Bay Area. This research should provide insights to photovoltaic dealers seeking benchmarking references, as well as to those companies and organizations that interact with these dealers on a regular basis. Given the size and age of this regional market, it is also reasonable to extrapolate the conclusions here to the developing downstream photovoltaic distribution channel for the U.S.
The Market The market for grid-tied solar electric, or photovoltaic, systems in the Greater San Francisco Bay Area and across the state has exploded over the last six years since the state of California initiated incentives for purchasers of renewable energy systems. Cumulative annual growth rates have averaged over 135% during this period, which has been marked by dramatically increased demand as well as a substantial increase in competition. Coast Hills Partners estimates the total California grid-tied photovoltaic market to be $359 million, and the Greater Bay Area market to be $182 million, in 2004. California is the third largest solar market in the world, and the Greater Bay Area comprises 51% of the overall California market. This area is by far the largest regional market in the U.S., and, on a standalone basis, is the fourth largest solar electric market in the world, behind Japan, Germany, and the rest of Europe. It is also one of the most mature.
© 2004-2005 COAST HILLS PARTNERS, INC. WWW.COASTHILLSPARTNERS.COM ALL RIGHTS RESERVED 6

COAST HILLS PARTNERS
SOLAR ELECTRIC DEALERS 2004: DYNAMIC MARKETS, SIGNIFICANT OPPORTUNITIES, CHALLENGING THREATS
The relative size and maturity of this marketplace, combined with a growing diversity of customer motivations and types, suggest that the Bay Area may serve as a reasonably representative predictor of how other developing photovoltaic markets in the U.S. will behave over the next few years. Even as the market continues to grow, market dynamics are becoming more challenging, as rebates decline and incentives overall are inconsistently supported. Solar electric dealers will have to adapt their strategies in order to thrive as the market evolves.
The Companies Twenty-one solar electric dealers in the Greater Bay Area participated in this study. These companies sell solar photovoltaic systems to residential and/or commercial customers and represent approximately $114 million in total revenue. These companies comprise approximately 37% of the Greater Bay Area market (calculated using revenue from business within the region only). Based on the results of this survey, the typical photovoltaic dealer is a small business, four to six years old, with approximately $4 million in revenues. The company was owner-financed to start and has grown by bootstrapping. The business owner/founder(s) originally entered the business to accomplish environmental and/or energy system goals, in addition to capitalizing on an attractive business opportunity. The majority of the typical dealer’s business is in the residential sector, but projects and revenue from the commercial sector are increasing significantly. The company has about ten employees, each pulling in around $350,000-$400,000/year in sales. These employees include a direct sales force and around 70% of a person devoted to marketing. Contractors are utilized when needed, primarily for electrical, installation, and roofing. The company spends approximately 0.5% of its sales, or $20,000, on marketing, for which it employs a variety of tools and tactics of varying effectiveness.
© 2004-2005 COAST HILLS PARTNERS, INC. WWW.COASTHILLSPARTNERS.COM ALL RIGHTS RESERVED 7
This typical solar dealer has experienced double- or even triple-digit growth during the past 24 months while the regional market has grown by about 40% per year. The company plans to manage for growth in

COAST HILLS PARTNERS
SOLAR ELECTRIC DEALERS 2004: DYNAMIC MARKETS, SIGNIFICANT OPPORTUNITIES, CHALLENGING THREATS
the future, even though growth expectations, while still positive, are less so than during the recent past: 81% of companies identified business conditions as positive during the past 24 months; 48% expect similar positive conditions over the next 24 months. Future growth is perceived to be limited by supply shortfalls, the challenges of internal growth management, and rebate delays. Company executives are not as familiar as they could be with their competition: who they are, how big they are, and what makes them successful. Most believe their sources of competitive advantage are a combination of experience, customer care, and price; this is problematic since it results in a lack of differentiation among the players. The typical dealer is slightly profitable on a net basis, at an estimated 5%-8% before tax, a somewhat higher rate on average than the rates for general contracting, which run around 3%-5%.
The Customers & the Market The ongoing energy situation today is characterized by high and increasing electric rates, continuing concerns about pollution from fossil fuels and dependence on foreign oil, and extremely slow change in the overall energy generation and distribution system. These factors all fuel increasing demand for photovoltaic systems. Increasing public awareness of solar technology and of environmental issues in general, combined with media coverage, serve to broaden this demand. Although annual rates of increase have slowed from triple digits in 2001, the California market is still expanding at annual rates in the 30-40% range. Future rates of market growth will depend upon incentive levels and volatility, and on the rate of increase in electric rates. In Northern California, electric rates have increased 28% since deregulation in 1996, and additional rate increases have been announced for California in 2005. However, this growth will be cut back if concerns about instability in the state’s renewable energy incentive plans, cited by a third of those surveyed, come to fruition.
© 2004-2005 COAST HILLS PARTNERS, INC. WWW.COASTHILLSPARTNERS.COM ALL RIGHTS RESERVED 8
COAST HILLS PARTNERS
SOLAR ELECTRIC DEALERS 2004: DYNAMIC MARKETS, SIGNIFICANT OPPORTUNITIES, CHALLENGING THREATS
If the current solar panel shortage persists, it will begin to have greater growth-limiting effects. New manufacturing capacity, in North America and elsewhere, is gradually coming on line, with some scheduled before the end of this year. If sufficient amounts are made available to the U.S. market, this constraint will be relaxed. Residential solar electric customers appear to be driven by three broad motivations:
“Green:” the desire to help the environment and society by switching to a clean, renewable source of energy;
“Economic:” the desire to achieve current and future savings
on electricity expenses; and
“Independence:” the desire to achieve a measure of control over one’s access to power, separate from the current energy infrastructure.
While environmental concerns still play a significant role in motivating solar electric purchases, an increasing number of solar electric customers are seeking positive economic returns as their primary, or a strong secondary, objective, thus expanding the available market. Corroborating this phenomenon is the substantial increase in commercial business now driven by cost-benefit analyses supporting solar adoption.
Typical residential solar electric customers in the Greater Bay Area tend to be affluent, educated, and middle-aged, concerned about the environment and somewhat familiar with technology. These consumers have high electric bills and seek some economic benefit as well as want to “do the right thing” by going solar.
© 2004-2005 COAST HILLS PARTNERS, INC. WWW.COASTHILLSPARTNERS.COM ALL RIGHTS RESERVED 9
Typical commercial/municipal customers for the dealers in this survey are long-term building occupants or owners, requiring systems between 30kW and 100kW in size. They have cash on hand or the ability to obtain financing to pay for the systems and are seeking positive economic returns from investing in solar. These customers may also seek some collateral benefits as well from solar adoption, such as “green” marketing to their own customers or constituents.

COAST HILLS PARTNERS
SOLAR ELECTRIC DEALERS 2004: DYNAMIC MARKETS, SIGNIFICANT OPPORTUNITIES, CHALLENGING THREATS
In these market conditions, dealers highlight equipment shortages and lack of consistent government support as the two greatest external threats to their business. Supply limitations make it difficult to capitalize on demand, and increased prices due to shortages reduce that demand. Similarly, lack of incentives, inconsistent funding, and unpredictable changes to incentives tend to limit demand growth and make it risky to expand capacity. Dealers almost universally agree with the premises behind the CEC’s planned rebate step-down, with many expressing the desire to be able to operate without incentives, but they acknowledge that the economics are not there just yet. The greatest internal threat cited by survey respondents is the challenge of internal growth management. For any small business, attempting to expand rapidly and/or handle uncertain market conditions is fraught with pitfalls in cash flow management, hiring decisions, and other critical business functions. Solar dealers must rise to these challenges if they are to expand successfully. Top opportunities identified by dealers are, first, the ongoing energy “crisis” (the ever-increasing costs, monetary and otherwise, of fossil fuel dependence), and the growing awareness of solar as an alternative. Second and related is the possibility of more government programs (e.g., at the Federal level) to encourage renewable energy adoption, and third is the increasing availability of new markets, as more states institute incentive programs and more new solar products are introduced.
Competitive Dynamics
The large number of relatively new, small players contributes to an intensely competitive environment made more difficult by limited information flows among the players. As a result, few companies truly understand their source of competitive advantage, and many fail to differentiate themselves from their competitors.
© 2004-2005 COAST HILLS PARTNERS, INC. WWW.COASTHILLSPARTNERS.COM ALL RIGHTS RESERVED 10
This lack of information adds to the challenging competitive dynamics of the photovoltaic marketplace. The large number of competitors vying for the same types of business, essentially interchangeable products,

COAST HILLS PARTNERS
SOLAR ELECTRIC DEALERS 2004: DYNAMIC MARKETS, SIGNIFICANT OPPORTUNITIES, CHALLENGING THREATS
and potentially uneven rates of market growth going forward all create a potentially unstable competitive situation.
Unless the market continues to expand faster than competitors can meet demand, these conditions point to a likely shakeout in the future. This could be caused by the realization of market threats – loss of incentives or supply interruptions – eliminating weaker players, or by the growth of larger regional players (in the $20 million+ revenue range) with the capability to buy up smaller competitors. In either scenario, companies that have achieved broader customer awareness in their segments will have an advantage in becoming regional leaders or in attracting strong buyout prices. Some players may also find that developing a strong niche position (e.g., leading in the schools segment) is a defensible strategy. Thus, successful branding and differentiation will become crucial competitive marketing strategies.
Pricing & Cost Structure Photovoltaic system pricing has declined slightly overall in California since 1998 (about 5%). Pricing for residential systems typically ranges from $8.72 - $8.80 per AC Watt as rated by the California Energy Commission (CEC), or $7.27 - $7.33 per Standard Test Condition (STC) DC Watt. For commercial and municipal systems, the typical dealer charges $8.00 - $8.29/ CEC Watt, or $6.67 - $6.91/STC Watt. Pricing for the most part indicates no scale effects, except in large commercial systems (>100 kW), projects that few dealers in this study typically win. This lack of scale underscores the need for all dealers to leverage their resources and reduce their cost structures in order to compete effectively in the long run.
© 2004-2005 COAST HILLS PARTNERS, INC. WWW.COASTHILLSPARTNERS.COM ALL RIGHTS RESERVED 11
The structural environment for solar electric dealers also presents some challenges for manufacturers attempting to introduce new products into this channel. Training must reach personnel in a large number of dispersed organizations, and each dealer must develop a comfort level with the new product, its interoperability, and its track record before being willing to quote it to customers, thus lengthening the time-to-market for many new photovoltaic components.
COAST HILLS PARTNERS
SOLAR ELECTRIC DEALERS 2004: DYNAMIC MARKETS, SIGNIFICANT OPPORTUNITIES, CHALLENGING THREATS
Profitability for solar electric dealers today, suggested to be in the range of 5-8% net before tax, is tight and likely to become more so as competition increases. The ability to achieve scale economies will become increasingly important as the market matures further and competition intensifies. A company’s resulting lower cost structure will improve both profitability and maneuverability.
Marketing Solar electric dealers today utilize a variety of marketing tools, with varied results. These tools include Web-based advertising and a Web site, customer references and referrals, trade shows and industry events, Yellow Page advertisements and some direct mail. Interestingly, the tools most used do not necessarily map to those that bring in the most new business, which are referrals, advertising other than Yellow Pages, and Web presence. While this type of marketing will suffice in the future if demand continues to outpace dealers’ ability to supply solar electric systems, as supply constraints ease and/or competition intensifies, dealers will need to critically evaluate the return on investment for each of their marketing activities. In addition, as the need to differentiate effectively grows with competition, marketing efforts will need to be integrated into a coherent plan to accomplish strategic goals as well as promote sales.
Recommendations Strategic
Solar electric dealers must achieve scale and create sustainable, differentiated positioning. Companies must create reasons for doing business with them that are distinct from their competitors’ and must leverage their resources to a point where scale economies – and therefore lower cost structures -- can be achieved in order to remain competitive.
© 2004-2005 COAST HILLS PARTNERS, INC. WWW.COASTHILLSPARTNERS.COM ALL RIGHTS RESERVED 12
COAST HILLS PARTNERS
SOLAR ELECTRIC DEALERS 2004: DYNAMIC MARKETS, SIGNIFICANT OPPORTUNITIES, CHALLENGING THREATS
Photovoltaic dealers therefore must:
Develop strategic marketing plans that cost-effectively drive sales while building a distinct, defensible brand and positioning. Carefully track and evaluate the returns on investment for alternative marketing approaches and integrate the best ones into a coordinated plan to drive sales growth, build competitive strength and profitability, and facilitate strategic maneuvers. Position the company based upon an accurate and unique source of competitive advantage.
Grow commercial business as a means of leveraging
sales, purchasing, and delivery resources. The larger deals typical of commercial and municipal opportunities can enable dealers to capture greater revenue per amount of sales effort, and likewise can enable lower unit costs through greater purchasing power and experience curve effects.
Reduce costs wherever possible. Lowering product
delivery cost structure is essential to photovoltaics’ economic viability in the absence of incentives. While the majority of the current cost gap must be closed in manufacturing, every percentage decrease in distribution costs, including dealers’ costs, is an important contribution toward this goal. In addition, lower cost structures improve profitability and competitiveness.
Implement protective strategies, especially smaller players
with less opportunity to develop scale. Developing niche segments with specialized market knowledge and clientele can both differentiate individual dealers and insulate against price pressures in the broader market. In addition, players can potentially increase buying power and reduce product costs through cooperative purchasing organizations or similar sourcing mechanisms.
Become and remain active in the political advocacy
surrounding incentive programs. In short, dealers must participate in the political process to insure that their industry needs are met, or else allow other players to determine their destinies.
© 2004-2005 COAST HILLS PARTNERS, INC. WWW.COASTHILLSPARTNERS.COM ALL RIGHTS RESERVED 13

COAST HILLS PARTNERS
SOLAR ELECTRIC DEALERS 2004: DYNAMIC MARKETS, SIGNIFICANT OPPORTUNITIES, CHALLENGING THREATS
Policy
Incentive programs have provided an essential catalyst for the photovoltaic market in California. Given where the market stands now and the effects of incentive changes on dealers, the following points are critical to future policy discussions. Government agencies promoting renewable energy sources must:
Ensure that incentive systems remain consistent and predictable. Interruptions in funding or negative, unplanned changes in incentives only serve to undermine growth of the industry the incentives were intended to stimulate.
Take into account global market conditions (e.g.,
unanticipated worldwide supply shortages), as well as slower than anticipated growth in demand, where programs are intended to adjust over time. Positive changes in incentive programs such as these should have a beneficial effect on the industry, so long as the rationale and appropriate future expectations resulting from them are communicated. Alternatively, tie downward adjustments in incentive amounts to total megawattage of installations, or another metric that directly measures industry progress.
Account for the fact that many of the industry
players are very small businesses for which cash flow and timing are critical issues. Emphasize timely return of rebates and set clear expectations for timeframes.
The photovoltaic market in California is ready to take off, which is what the state’s incentive programs are intended to accomplish. It must not be hindered by uncertainties or interruptions. Allowing these to occur simply reduces the return on the public funds invested, and hinders the achievement of renewable energy policy goals.
Further Research
© 2004-2005 COAST HILLS PARTNERS, INC. WWW.COASTHILLSPARTNERS.COM ALL RIGHTS RESERVED 14
Additional research in this category will be critical for those players wishing to take leadership positions in the photovoltaic distribution
COAST HILLS PARTNERS
SOLAR ELECTRIC DEALERS 2004: DYNAMIC MARKETS, SIGNIFICANT OPPORTUNITIES, CHALLENGING THREATS
channel. Coast Hills Partners is pursuing further analysis in several important areas. Examples include:
Evaluation and development of effective marketing strategies and tactics
Investigation and creation of strategies to achieve scale
economies or other mechanisms to increase resource leverage in product sourcing and service delivery
Design of operational strategies to improve competitive
advantage and reduce costs
Analysis of additional state markets to determine market potential, target customer attributes, and entry strategies.
For further information or for additional copies of this study please contact Coast Hills Partners:
© 2004-2005 COAST HILLS PARTNERS, INC. WWW.COASTHILLSPARTNERS.COM ALL RIGHTS RESERVED 15
www.coasthillspartners.com 1- 650 - 255 -1828

COAST HILLS PARTNERS
SOLAR ELECTRIC DEALERS 2004: DYNAMIC MARKETS, SIGNIFICANT OPPORTUNITIES, CHALLENGING THREATS
II. Acknowledgements
Coast Hills Partners first acknowledges the many solar electric dealers in this study who gave their time to share knowledge and insight about their businesses. Many of the survey respondents’ own questions and suggestions have added depth to this report. Without their participation this study would not have been possible, and for it the author is grateful. Coast Hills Partners is also appreciative of the California Energy Commission’s robust renewable energy library. In addition, we thank Peter Buchanan for outstanding professional consultation, Dr. Leslie Field for her thoughtful review, and Steve Humphreys for peerless logistical and other support, as always.
© 2004-2005 COAST HILLS PARTNERS, INC. WWW.COASTHILLSPARTNERS.COM ALL RIGHTS RESERVED 16

COAST HILLS PARTNERS
SOLAR ELECTRIC DEALERS 2004: DYNAMIC MARKETS, SIGNIFICANT OPPORTUNITIES, CHALLENGING THREATS
III. Company Profiles
In this section, we provide an overview of solar electric dealers today, based on our survey sample. Company ages, sizes, market segments served, distribution channels and geographic coverage are examined.
Definition of a Solar Electric Dealer A solar electric dealer as defined in this study is a private business that sells solar photovoltaic components and systems to residential and/or commercial and municipal end-customers. The dealer is typically, but is not always, a type of home improvement contractor. Dealers may design and specify photovoltaic systems for clients, or they may merely sell components selected by customers. Similarly, these companies may -- and often do – install these systems for their customers, as well as provide post-installation support where desired. For the purposes of this study, “solar electric” or “photovoltaic” systems refer to grid-tied systems, versus “off-grid” systems, which are not interconnected with the utility’s’ transmission system.
Company Representatives Survey respondents typically represented senior company management, with almost half being CEOs and/or owners of their firms. The next category of respondents, sales or marketing leadership, also were in positions of knowledge about their company’s markets, growth outlook, target customers, and so forth, as were sales personnel in general. Twenty-one companies were interviewed in total.
© 2004-2005 COAST HILLS PARTNERS, INC. WWW.COASTHILLSPARTNERS.COM ALL RIGHTS RESERVED 17

COAST HILLS PARTNERS
SOLAR ELECTRIC DEALERS 2004: DYNAMIC MARKETS, SIGNIFICANT OPPORTUNITIES, CHALLENGING THREATS
Table 1: Survey Respondents
Ages of Companies The twenty-one companies interviewed ranged widely in age, from under one year to over 40 years [Figure 1]. The median age of responding companies, however, is three to three and a half years, not surprising given the events of 2001. While the original California Energy Commission (CEC) California Emerging Renewables rebate program was launched in 1998, 2001 saw the infamous California energy crisis. The rolling blackouts, Pacific Gas & Electric (PG&E) filing for bankruptcy, and dramatic electric rate increases resulted in widespread consumer outrage -- and a fair amount to emotional fuel to make changes in the system.
0
1
2
3
4
5
6
Number of Companies
1 4 7 10 13 16 19 22 25 28 31 34 37 40
Years
Figure 1: Ages of Businesses Surveyed
In addition, in March 2001, the California Public Utilities Commission instituted the Self Generation Incentive Program, directing utilities to provide financial incentives for large electricity users seeking to install renewable energy systems of 30 kilowatt (kW) or larger. This resulted in creation of PG&E’s attractive rebate program aimed primarily at commercial and municipal customers.
© 2004-2005 COAST HILLS PARTNERS, INC. WWW.COASTHILLSPARTNERS.COM ALL RIGHTS RESERVED 18
Owner/President/CEO 9 43% Sales/Marketing Director 6 29% Sales 4 19% Other 2 10% TOTAL 21 100%

COAST HILLS PARTNERS
SOLAR ELECTRIC DEALERS 2004: DYNAMIC MARKETS, SIGNIFICANT OPPORTUNITIES, CHALLENGING THREATS
Finally, California instituted a 15% tax credit on purchases of photovoltaic (and wind) systems up to 200 MW, installed between January 1, 2001, and December 31, 2003 – a significant incentive. (The tax credit was reduced to 7.5% for 2004-2005, and is currently planned to sunset in 2006). These three factors combined to make the photovoltaic market more attractive as a business opportunity. Taking a broader view, there was actually a confluence of forces that resulted in almost 60% of sample companies being founded within the last six years:
Establishment of CEC incentives in 1998 dramatically increased the economic feasibility of photovoltaics, enabling it to come out of the realm of remote, non-grid-tied systems (although cost-effectiveness remains a significant issue);
“Y2K” fears in 1998 and 1999 fueled consumer interest in being shielded or independent from large systems such as the electric grid, which were feared to be vulnerable;
Ongoing, increasing environmental awareness in the general population regarding issues such as global warming, air pollution, and habitat preservation has steadily increased the desire for clean energy and the acceptability of “alternative” energy sources;
Finally, the 2001 energy crisis and its reverberations since have helped to sustain and increase the solar electric market. Accordingly, competition has dramatically increased over this time period; some respondents have estimated more than a 10X increase in the number companies participating in the photovoltaic market. The older companies represented in the survey are impressive for their ability to survive: while several had a core business outside of solar prior to entering the photovoltaic market, most have a foundation in early solar technology, such as solar thermal, non-grid-connected solar electric, and so forth. These companies were able to stay in business despite the hostile market conditions of the 1980’s and the1990’s. Not surprisingly, company representatives who have seen some of this history are more sanguine about market conditions today and in the future.
© 2004-2005 COAST HILLS PARTNERS, INC. WWW.COASTHILLSPARTNERS.COM ALL RIGHTS RESERVED 19

COAST HILLS PARTNERS
SOLAR ELECTRIC DEALERS 2004: DYNAMIC MARKETS, SIGNIFICANT OPPORTUNITIES, CHALLENGING THREATS
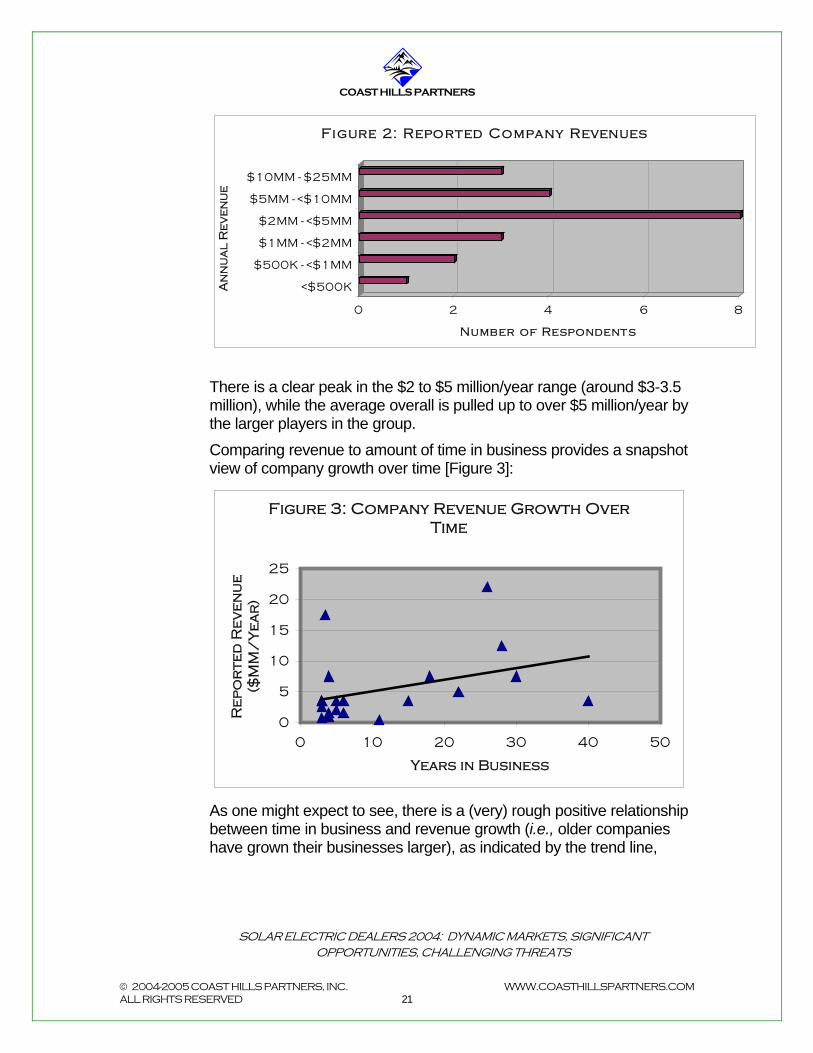
Revenues Company size, measured in annual revenue, also varies widely, although none have broken out of the “small business” size range, defined as $28.5 million/year for the solar industry as a whole in the Small Business Administration’s Size Standards (https://eweb1.sba.gov/naics/dsp_naicsearch2.cfm, description = “solar”). The companies in the survey reported a total of approximately $114 million in sales, estimated for the twelve months of 2004. Analysis of the CEC’s database of renewable energy installations under 30kW in size (http://www.energy.ca.gov/renewables/emerging_renewables/2004-10-1_ERP_Cmptd_Apprvd.XLS) confirms $42.4 million of this revenue. Additional analysis utilizing 2003 data compiled by Solarbuzz (http://www.solarbuzz.com/usgridconnect2004.htm) and updating it for 2004 identifies another $24 million in projects over 30kW. Further Coast Hills Partners analysis of market segments served (below) infers an additional $22 million in sales. Therefore, approximately 80% of reported revenues can be verified or inferred from other information. The remaining 20% can be attributed to additional 2004 business that has not yet been booked, as well as to the fact that many survey respondents preferred to provide their company revenue within a range (e.g., “$2 to $5 million”), as illustrated below [Figure 2]. Looking only at company revenues derived from business sold in Northern California, we estimate that these companies represent approximately 37% of the Northern California market today.
© 2004-2005 COAST HILLS PARTNERS, INC. WWW.COASTHILLSPARTNERS.COM ALL RIGHTS RESERVED 20
Reported annual company revenues ranged from just under half a million dollars per year to $22 million.
COAST HILLS PARTNERS
SOLAR ELECTRIC DEALERS 2004: DYNAMIC MARKETS, SIGNIFICANT OPPORTUNITIES, CHALLENGING THREATS
0 2 4 6
Number of Respondents
8
<$500K
$500K - <$1MM
$1MM - <$2MM
$2MM - <$5MM
$5MM - <$10MM
$10MM - $25MM
An
nu
al
Re
ve
nu
e
Figure 2: Reported Company Revenues
There is a clear peak in the $2 to $5 million/year range (around $3-3.5 million), while the average overall is pulled up to over $5 million/year by the larger players in the group. Comparing revenue to amount of time in business provides a snapshot view of company growth over time [Figure 3]:
Figure 3: Company Revenue Growth Over Time
0
5
10
15
20
25
0 10 20 30 40 50
Years in Business
Re
po
rte
d R
ev
en
ue
($
MM
/Y
ea
r)
© 2004-2005 COAST HILLS PARTNERS, INC. WWW.COASTHILLSPARTNERS.COM ALL RIGHTS RESERVED 21
As one might expect to see, there is a (very) rough positive relationship between time in business and revenue growth (i.e., older companies have grown their businesses larger), as indicated by the trend line,

COAST HILLS PARTNERS
SOLAR ELECTRIC DEALERS 2004: DYNAMIC MARKETS, SIGNIFICANT OPPORTUNITIES, CHALLENGING THREATS
although the many outliers clearly indicate that a variety of growth aspirations and strategies are in play. (Note: the trend lines that appear in some of the analyses in this report are based on simple linear regression analysis, and are intended to illustrate only approximate directional relationships between variables).
Market Segments Served Companies were queried about the solar electric market segments they served: Residential, Commercial/Municipal, Wholesale, or Other Products/Services. The last category could include photovoltaic products other than for standard roof-/ground-mounted systems, other solar segments such as solar thermal systems, or other renewable energy products. The split amongst these segments for the survey sample, in terms of number of systems sold, is shown in Figure 4. The bulk of sample companies currently concentrate sales volume (but not necessarily revenue) in the residential sector, with 71% attributing more than 50% of their sales volume to residential business. That said, almost every company also serving the commercial/municipal market noted that the dollar amounts per sale are much higher on the commercial side, and several noted that their commercial business specifically was increasing dramatically.
Figure 4: Market Segments Served
Wholesale2%
Residential66%
Commercial/Municipal
21%
Other Products/
Services11%
© 2004-2005 COAST HILLS PARTNERS, INC. WWW.COASTHILLSPARTNERS.COM ALL RIGHTS RESERVED 22
Only three respondents reported participating significantly in the wholesale solar electric segment. Several companies (33%) are active in other products and services, primarily other photovoltaic or other renewable energy products and services.

COAST HILLS PARTNERS
SOLAR ELECTRIC DEALERS 2004: DYNAMIC MARKETS, SIGNIFICANT OPPORTUNITIES, CHALLENGING THREATS
Respondents provide three basic reasons for participating in these other business areas: Historical: They were already in the other business when they decided to enter the photovoltaic market; Opportunistic: The other market opportunity “came up” and appeared to complement some aspects of their solar electric business; Diversification: The new market segment is insulated from incentive program uncertainties and other photovoltaic market risks. Interestingly, whether or not diversification was part of the business strategy appeared to be unrelated to annual revenue; companies of all sizes were just as likely to pursue multiple markets as not. All diversified respondents did note an increased sense of security from not having all of their business eggs in one basket, so to speak. However, this increased security from risks in one market must be balanced against the internal management risks associated with greater complexity and potentially less focus on the core competencies needed to succeed in one’s chosen market(s). In some cases, enough synergy exists between the different markets that this problem can be minimized. This depends largely upon the skill and expertise of the management involved.
Distribution Channels Survey respondents reported two types of distribution channels: direct sales and Internet sales with affiliate installers [see Figure 5]. The direct sales model is the most prevalent, with 86% of companies utilizing this channel, as well as the most traditional: a company representative meets directly with sales prospects, makes the proposal and shepherds the opportunity through to a close.
© 2004-2005 COAST HILLS PARTNERS, INC. WWW.COASTHILLSPARTNERS.COM ALL RIGHTS RESERVED 23
The Internet approach utilizes a Web site enabled for e-commerce, so that customers can order photovoltaic equipment directly from the Web site or over the phone. In one case a paper catalog is also used. Equipment is then shipped directly to the customer, who can then choose to work with an affiliated installer to complete the installation.

COAST HILLS PARTNERS
SOLAR ELECTRIC DEALERS 2004: DYNAMIC MARKETS, SIGNIFICANT OPPORTUNITIES, CHALLENGING THREATS
0
5
10
15
20
Nu
mb
er
of
R
es
po
nd
en
ts
Direct Sales Internet Sales w/Affiliate Installers
Figure 5: Distribution Channels Utilized
The Internet sales model affords greater geographical reach, and attracts a demographic of knowledgeable and/or do-it-yourselfer customers. Lower equipment prices are a significant draw in most cases, as are advertised large selections, lower overhead, and so forth. Possible downsides for the consumer include shipping costs, support, and the tax implications of rebates if the dealer does not process them. These can be, but are not always, addressed by the dealer. Two apparent downsides for the dealer are the lack direct customer contact in the field and of control over the final installation. These can be addressed, however, with limited site visits after extensive phone consultation, and with affiliates that have a significant stake in the success of the dealer (e.g., affiliates that are shareholders of the dealer). The economics of these two types of distribution present a number of trade-offs. Direct sales represent the most expensive form of distribution. Sales personnel are paid to track prospects and present proposals, a time-consuming process in which a large percentage will not come to fruition. However, it also affords the greatest control over the sale and is particularly useful in complex, high-value sales. While it is more expensive, the conversion rate of prospects to closed sales is probably higher.
© 2004-2005 COAST HILLS PARTNERS, INC. WWW.COASTHILLSPARTNERS.COM ALL RIGHTS RESERVED 24
Internet-based sales offer the possibility of much lower distribution costs, through fewer and sometimes less well-compensated personnel, lower expenses (e.g., no travel expenses, less hard-copy collateral, no remote sales offices), and sometimes less post-sale service. These

COAST HILLS PARTNERS
SOLAR ELECTRIC DEALERS 2004: DYNAMIC MARKETS, SIGNIFICANT OPPORTUNITIES, CHALLENGING THREATS
advantages are reduced as Internet dealers add services to compete with the higher customer touch of direct sales dealers. Although the close rate may be lower with this model, costs of the distribution channel are lower, too. Which model is ultimately “best” will depend upon how well individual players execute their respective distribution strategies, and requires further analysis of the specifics of the solar electric marketplace, not covered in this report.
Geographic Coverage All participating companies in the survey serve the “Greater Bay Area,” an area defined loosely as centered around San Francisco, extending north to Sonoma and Napa counties; east to Solano and Contra Costa counties; and south through Santa Clara and Santa Cruz counties [see map, Figure 7]. Company locations are distributed around the Greater Bay Area, with a slight emphasis on the South and East Bay regions in number of companies [Table 2], although not in revenue. Locations are either headquarters or local outposts if the company is based elsewhere.
Table 2: Company Locations Within the Great Bay Area Region Number of
Companies Percentage of Companies
Percentage of Reported Revenue
South Bay 8 38% 31%
East Bay 6 29 23
North Bay 4 19 39
Peninsula 2 9 4
Outside of Bay Area 1 5 3
TOTAL 21 100% 100%
© 2004-2005 COAST HILLS PARTNERS, INC. WWW.COASTHILLSPARTNERS.COM ALL RIGHTS RESERVED 25
Slightly over one third (36%) of companies concentrated their business in the Greater Bay Area as defined. A superset of this group, 49%, serves either the Greater Bay Area alone or this plus some extension

COAST HILLS PARTNERS
SOLAR ELECTRIC DEALERS 2004: DYNAMIC MARKETS, SIGNIFICANT OPPORTUNITIES, CHALLENGING THREATS
beyond it (e.g., serving into Yolo or San Joaquin counties). See Figure 8. Interestingly, few companies (with one significant exception) noted doing a great deal of business within the city of San Francisco itself. Several noted challenges in competing for municipal contracts or in gaining building approvals for residential systems.
Figure 7: Geographic Ranges of Companies Surveyed
Greater Bay Area + other
California13%
Greater Bay Area + other state(s)
21%
Global13%
Greater Bay Area + International
4%
Greater Bay Area 49%
Figure 8: The Greater Bay Area
Map Source: The CA Gen Web Project, 2004
© 2004-2005 COAST HILLS PARTNERS, INC. WWW.COASTHILLSPARTNERS.COM ALL RIGHTS RESERVED 26
Greater bay Area counties: San Francisco, San Mateo, Santa Cruz, Santa Clara, Alameda, Contra Costa, Solano, Napa, Sonoma
COAST HILLS PARTNERS
SOLAR ELECTRIC DEALERS 2004: DYNAMIC MARKETS, SIGNIFICANT OPPORTUNITIES, CHALLENGING THREATS
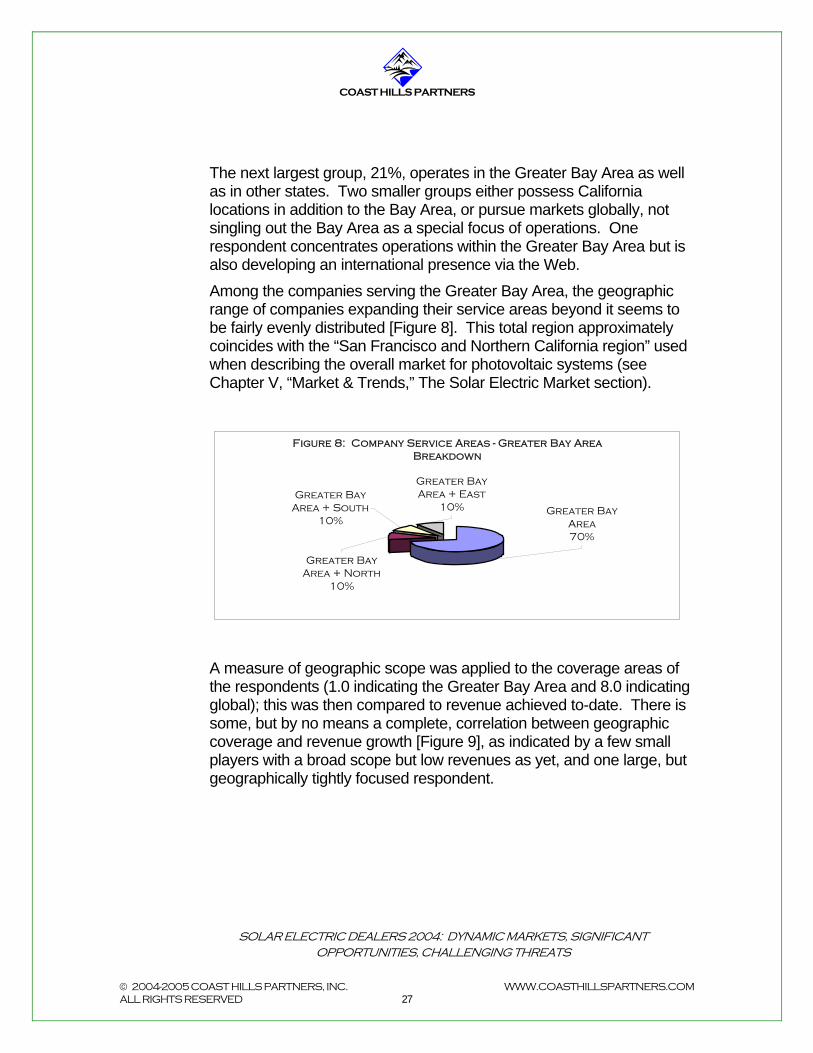
The next largest group, 21%, operates in the Greater Bay Area as well as in other states. Two smaller groups either possess California locations in addition to the Bay Area, or pursue markets globally, not singling out the Bay Area as a special focus of operations. One respondent concentrates operations within the Greater Bay Area but is also developing an international presence via the Web. Among the companies serving the Greater Bay Area, the geographic range of companies expanding their service areas beyond it seems to be fairly evenly distributed [Figure 8]. This total region approximately coincides with the “San Francisco and Northern California region” used when describing the overall market for photovoltaic systems (see Chapter V, “Market & Trends,” The Solar Electric Market section).
Figure 8: Company Service Areas - Greater Bay Area Breakdown
Greater Bay Area + South
10%
Greater Bay Area + East
10%
Greater Bay Area + North
10%
Greater Bay Area70%
© 2004-2005 COAST HILLS PARTNERS, INC. WWW.COASTHILLSPARTNERS.COM ALL RIGHTS RESERVED 27
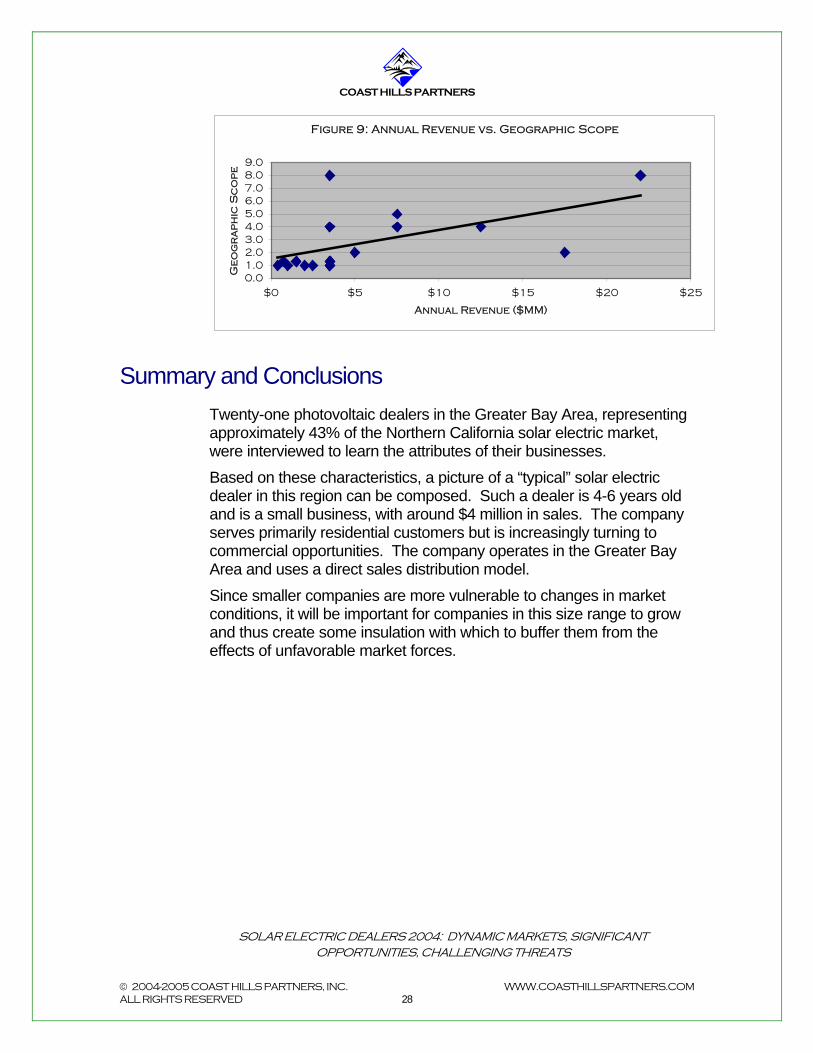
A measure of geographic scope was applied to the coverage areas of the respondents (1.0 indicating the Greater Bay Area and 8.0 indicating global); this was then compared to revenue achieved to-date. There is some, but by no means a complete, correlation between geographic coverage and revenue growth [Figure 9], as indicated by a few small players with a broad scope but low revenues as yet, and one large, but geographically tightly focused respondent.
COAST HILLS PARTNERS
SOLAR ELECTRIC DEALERS 2004: DYNAMIC MARKETS, SIGNIFICANT OPPORTUNITIES, CHALLENGING THREATS
Figure 9: Annual Revenue vs. Geographic Scope
0.01.02.03.04.05.06.07.08.09.0
$0 $5 $10 $15 $20 $25
Annual Revenue ($MM)
Ge
og
ra
ph
ic S
co
pe
Summary and Conclusions Twenty-one photovoltaic dealers in the Greater Bay Area, representing approximately 43% of the Northern California solar electric market, were interviewed to learn the attributes of their businesses. Based on these characteristics, a picture of a “typical” solar electric dealer in this region can be composed. Such a dealer is 4-6 years old and is a small business, with around $4 million in sales. The company serves primarily residential customers but is increasingly turning to commercial opportunities. The company operates in the Greater Bay Area and uses a direct sales distribution model.
© 2004-2005 COAST HILLS PARTNERS, INC. WWW.COASTHILLSPARTNERS.COM ALL RIGHTS RESERVED 28
Since smaller companies are more vulnerable to changes in market conditions, it will be important for companies in this size range to grow and thus create some insulation with which to buffer them from the effects of unfavorable market forces.

COAST HILLS PARTNERS
SOLAR ELECTRIC DEALERS 2004: DYNAMIC MARKETS, SIGNIFICANT OPPORTUNITIES, CHALLENGING THREATS
IV. Customer Profiles
Survey respondents provided a wealth of information regarding their target customers, both residential and commercial. Company representatives were asked to describe the key characteristics of their target customers, and, while each description was different, some common themes emerged. For analytical purposes, these customer characteristics have been divided into customer attributes and customer motivations – attributes being aspects of who the customers are, and motivations being the reasons they are interested in solar. First we’ll take a look at residential customers, then commercial/municipal ones.
Residential Customer Attributes For residential customer attributes, respondents shared a wide variety of characteristics that they believed define their target customers [see Figure 10]. Although many attributes appear here, even after some have been aggregated, there are some clear commonalities. From this data, and in descending order of importance, the target residential customer for photovoltaic systems appears to be:
Environmentally concerned. While not a passionate environmentalist, the target customer is aware of environmental issues and concerned about the environment.
Affluent. Target customers are typically mid- to upper-middle class and are able to consider purchases in the range of solar electric system costs.
Comfortable and familiar with technology.
© 2004-2005 COAST HILLS PARTNERS, INC. WWW.COASTHILLSPARTNERS.COM ALL RIGHTS RESERVED 29
Educated, typically global thinkers. This factor may co-vary with affluence and/or environmental concern.

COAST HILLS PARTNERS
SOLAR ELECTRIC DEALERS 2004: DYNAMIC MARKETS, SIGNIFICANT OPPORTUNITIES, CHALLENGING THREATS
Over 40 years old, and/or retirees. This could co-vary with affluence, as affluent people tend to be older (or, younger people are less likely to have amassed wealth since they have had fewer years in which to do it – dot-com boom notwithstanding).
4%4%
2%10%10%
2%2%
6%22%
4%2%
16%6%
12%
0% 5% 10% 15% 20% 25%
% of Responses
Technology savvyHigh electric use
AffluentAgricultural producers
ProfessionalsEnvironmentally concerned
Small % = environmentalists Need quality, value, service
Alt. fuel vehicle ownersOver 40 &/or retirees
Educated/ global thinkersLiberal
Know someone w/ solarNOT an environmentalist
Figure 10: Target Residential Customer Attributes
There was also agreement across a number of respondents that only a small percentage of customers are passionate, or “hard-core” environmentalists. As a broad characterization (or perception amongst dealers), hard-core environmentalists typically buy small systems, either due to inability to pay for larger ones or having relatively small electric usage to begin with. Other respondents noted that a certain, possibly increasing, percentage of customers are specifically not environmentalists. Rather, they are interested in solar because of its economic benefits and/or the degree of independence it provides from one’s utility and the overall power system.
© 2004-2005 COAST HILLS PARTNERS, INC. WWW.COASTHILLSPARTNERS.COM ALL RIGHTS RESERVED 30
The same number of respondents identified high electric power consumption as an important target customer attribute. While a prospective customer does not have to have exorbitant electric bills to benefit from solar, higher bills do increase the likely benefit and hence the motivation to purchase. They also indicate some degree of affluence, which also predisposes toward a solar purchase.

COAST HILLS PARTNERS
SOLAR ELECTRIC DEALERS 2004: DYNAMIC MARKETS, SIGNIFICANT OPPORTUNITIES, CHALLENGING THREATS
In identifying these attributes, almost all respondents opted not to mention some basic prerequisites for a prospective customer, presumably because these are assumed. These prerequisites include:
Prospect has sufficient sun exposure Prospect is typically a homeowner Prospect has sufficient financial resources Prospect has more than minimal electric usage.
The average size of residential system sold by respondents is approximately 4.6 kW. The size of system most frequently sold to residential customers (the mode of the sample) is also between 4.5 and 5.0 kW.
Target Residential Customer Motivations For target customers with the attributes described above, motivations to purchase a photovoltaic system appear to divide into three major themes:
“Green,” or environmentally motivated; Economic, primarily driven by the desire for savings; and Independence, driven by anger at one’s electric utility and
desire to have some control over power generation and access Figure 11 shows the relative frequency of customer motivations cited:
© 2004-2005 COAST HILLS PARTNERS, INC. WWW.COASTHILLSPARTNERS.COM ALL RIGHTS RESERVED 31
43%34%
23%
0%
10%
20%
30%
40%
50%
% o
f
Re
sp
on
se
s
(n=
44
)
Green Economic Independence
Figure 11: Relative Frequency of Customer Motivational Themes

COAST HILLS PARTNERS
SOLAR ELECTRIC DEALERS 2004: DYNAMIC MARKETS, SIGNIFICANT OPPORTUNITIES, CHALLENGING THREATS
The most prevalently cited motivations fell into the “Green” theme [Figure 12]:
Figure 12: "Green" Motivations for Buying Solar
Willing to pay small
economic penalty
5%
Do the Right Thing
(Enviro/Soci0- conscience)
69%
Politico-environmental motive (often
small systems)21%
Aware of oil issues/want to
reduce oil dependence
5%
The majority of reasons cited for interest in solar fall under the umbrella of wanting to “do the right thing,” meaning the customer seeking to do his/her part to reduce dependence on fossil fuels and their attendant side effects, particularly of pollution and global warming. Next off are those customers motivated by more pure environmentalist thinking. These are often politically motivated; solar electric may not actually make economic sense for them; and they typically purchase smaller systems. Finally, some customers appear to be motivated by oil issues: concern about dependence on foreign oil and its environmental and political implications for society. In all of these, some respondents noted, some customers motivated by green reasons can be willing to take a small economic penalty for going solar. In other words, they may fare about the same or a little worse than by sticking with their utility, but they are willing to nonetheless bear the expense of installing a photovoltaic system in order to achieve other environmental and social benefits.
© 2004-2005 COAST HILLS PARTNERS, INC. WWW.COASTHILLSPARTNERS.COM ALL RIGHTS RESERVED 32

COAST HILLS PARTNERS
SOLAR ELECTRIC DEALERS 2004: DYNAMIC MARKETS, SIGNIFICANT OPPORTUNITIES, CHALLENGING THREATS
The next most-often cited set of motivations, the “Economic” theme, is increasingly prevalent amongst target customers, according to respondents. As solar has become more affordable, and conventional electric rates have increased, there is a positive economic trade-off to going solar for more consumers (although this is partially mitigated by declining rebates). See Figure 13.
Figure 13: Economic Motivations to Buy Solar
Add value to house
7% Want to reduce bills53%
Lock in Energy costs20%
Seek good ROI20%
The first three stated categories are slightly different presentations of the same basic economic motivation, which is to reduce household energy costs. It was noted by some respondents that the desire to lock in energy costs, and thus be insulated from future rate increases, is particularly evident among retirees (due to fixed incomes). The fourth category, the desire to add value to one’s house, is most likely a secondary motivation behind a primary economic or other reason for interest in solar, as presumably a consumer would not purchase a system immediately in advance of selling the home.
© 2004-2005 COAST HILLS PARTNERS, INC. WWW.COASTHILLSPARTNERS.COM ALL RIGHTS RESERVED 33
Ironically, the focus on return on investment (ROI) can be a limiting factor for solar sales as well. Many consumers resist payback periods that hover around a decade, according to respondents. One company representative noted with frustration that some consumers were unwilling to purchase a solar electric system because they felt that a 10-year payback period was too long, but these same consumers had no problem buying the latest large SUV (which of course has no return on investment, and an infinite payback period). A marketing challenge, for sure.
COAST HILLS PARTNERS
SOLAR ELECTRIC DEALERS 2004: DYNAMIC MARKETS, SIGNIFICANT OPPORTUNITIES, CHALLENGING THREATS
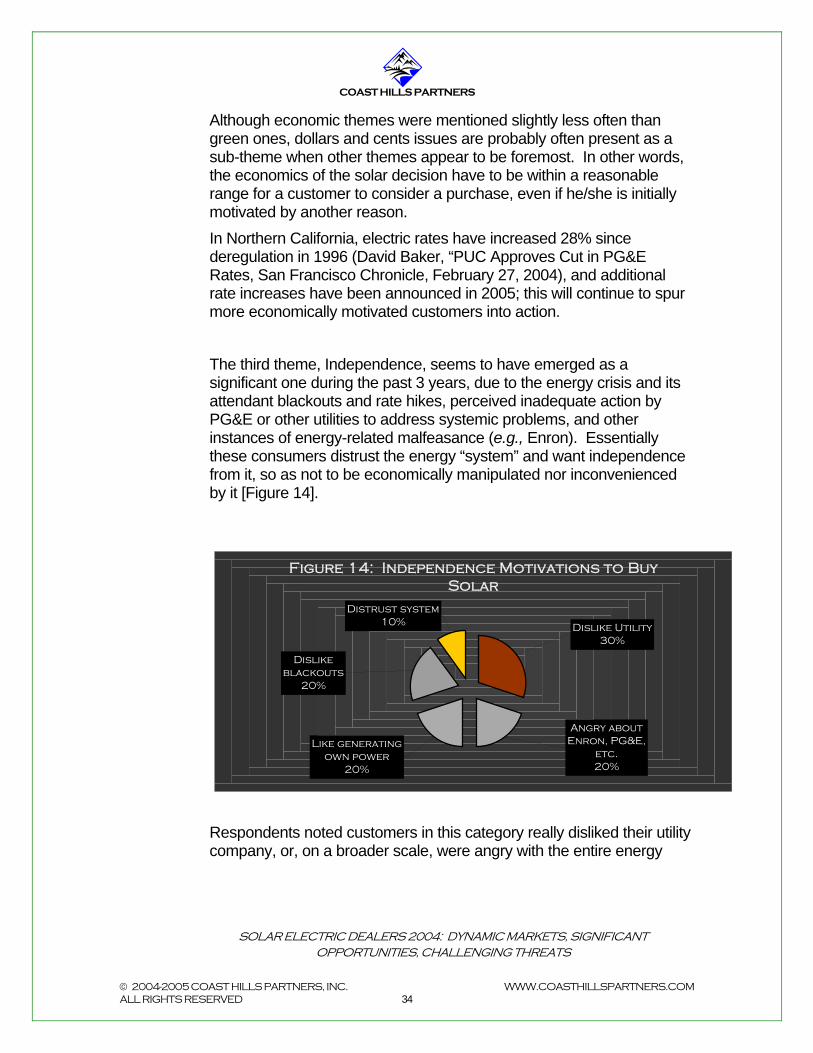
Although economic themes were mentioned slightly less often than green ones, dollars and cents issues are probably often present as a sub-theme when other themes appear to be foremost. In other words, the economics of the solar decision have to be within a reasonable range for a customer to consider a purchase, even if he/she is initially motivated by another reason. In Northern California, electric rates have increased 28% since deregulation in 1996 (David Baker, “PUC Approves Cut in PG&E Rates, San Francisco Chronicle, February 27, 2004), and additional rate increases have been announced in 2005; this will continue to spur more economically motivated customers into action. The third theme, Independence, seems to have emerged as a significant one during the past 3 years, due to the energy crisis and its attendant blackouts and rate hikes, perceived inadequate action by PG&E or other utilities to address systemic problems, and other instances of energy-related malfeasance (e.g., Enron). Essentially these consumers distrust the energy “system” and want independence from it, so as not to be economically manipulated nor inconvenienced by it [Figure 14].
Figure 14: Independence Motivations to Buy Solar
Dislike blackouts
20%
Like generating own power
20%
Angry about Enron, PG&E,
etc.20%
Dislike Utility30%
Distrust system10%
© 2004-2005 COAST HILLS PARTNERS, INC. WWW.COASTHILLSPARTNERS.COM ALL RIGHTS RESERVED 34
Respondents noted customers in this category really disliked their utility company, or, on a broader scale, were angry with the entire energy

COAST HILLS PARTNERS
SOLAR ELECTRIC DEALERS 2004: DYNAMIC MARKETS, SIGNIFICANT OPPORTUNITIES, CHALLENGING THREATS
system and what has transpired over the past few years in California, specifically citing Enron, blackouts, or the failed system in general. These consumers seek to have more control over their own power generation, both to protect themselves from a broken system and to deny the players in that system any economic benefit from their households. Interestingly, it is these target customers who were most likely to identify themselves specifically as non-environmentalists. This may be due to the fact that there is a new demographic with a more conservative mindset (which is sometimes, although not always, associated with less interest in environmental issues) drawn to solar because it is an available way of removing oneself partially or completely from an energy system which does not support the interests of the little guy. Of course, while it is useful to divide customer motivations into these three analyzable groups, in reality motivations expressed by target customers are probably often mixed across categories. For example, someone desiring to “Do the right thing” environmentally may decide to purchase once the economic case has been made that solar is affordable and beneficial. Similarly, economic and independence motivations are probably strongly linked: much of the anger at utilities stems from high bills and rate increases.
Commercial Customer Attributes
© 2004-2005 COAST HILLS PARTNERS, INC. WWW.COASTHILLSPARTNERS.COM ALL RIGHTS RESERVED 35
Respondents provided data about target commercial and municipal customers, but in general with less detail with less consensus among respondents. When aggregated, commercial and municipal customer characteristics did show some commonalities [Figure 15].

COAST HILLS PARTNERS
SOLAR ELECTRIC DEALERS 2004: DYNAMIC MARKETS, SIGNIFICANT OPPORTUNITIES, CHALLENGING THREATS
© 2004-2005 COAST HILLS PARTNERS, INC. WWW.COASTHILLSPARTNERS.COM ALL RIGHTS RESERVED 36
0% 5% 10% 15% 20% 25% 30% 35% 40%
% of Respondents Identifying(Responses greater than 100%)
Landlord/Long-term building occupantHigh power usage/Need >30kW system
Profitable business with CashSchools
Housing complexesMunicipal buildings
Some consumer contactMedium-sized business
Owners with solar residences
Figure 15: Target Commercial & Municipal Customer Attributes
Respondents identified several specific business segments as good target customers for solar electric systems:
Housing complexes Municipal buildings (although some respondents have chosen
not to pursue this segment due to the frequently lower margins, longer timeframes, and other requirements)
Schools (in many cases private schools, which do not have the cumbersome public budgeting process)
“Big box” retail (included in “long-term building occupant” in Fig. 15] The most frequently reported commercial customer attribute, according to respondents, was being either a landlord or a long-term building occupant. This makes obvious sense, since those businesses with short-term building leases would be unwilling to make a long-term investment in something like solar for that building space. Those with longer time horizons are better able to take advantage of the long-term benefits of solar. The next most-frequently cited attributes, being a profitable business and being a high power user, sound obvious but do represent some nuances in the commercial market. Unprofitable businesses are clearly not going to invest in something like solar (nor would they make good business risks for dealers), but profitable ones also need to possess sufficient cash-on-hand or have access to financing in order to be

COAST HILLS PARTNERS
SOLAR ELECTRIC DEALERS 2004: DYNAMIC MARKETS, SIGNIFICANT OPPORTUNITIES, CHALLENGING THREATS
viable customers. Low margin businesses with low cash flow are therefore not likely to make good candidates. Non-profits create an interesting dilemma in this regard. Respondents reported a great deal of interest from the non-profit sector, and some reported completing installations for large non-profits. However, many smaller non-profits that do not possess strong endowments just cannot muster the financial resources to go solar, unless they organize a fund-raising campaign to do so. Qualifying non-profit prospects thus is a very important part of the sales process. Relatively high power usage makes sense as a target customer attribute, since the higher the current usage the more rapid the payback, and businesses in particular seek rapid returns on their solar investments. In addition, potential customers requiring more than a 30kW system make good targets because this size pushes them into the PG&E rebate tier, which is much more attractive on a per-Watt basis (currently $4.50/Watt) than the CEC rebates ($3.00/Watt until January, 2005, when they will decline again). This assumes that the PG&E rebate fund continues to be replenished annually and waiting lists do not become too long. Companies with some consumer contact as well as an economic justification for going solar can reap the additional benefit of being able to utilize “green” marketing tactics, highlighting their clean energy production as a means of building consumer loyalty. Finally, an attractive attribute cited by at least one respondent is that the target be a medium sized business. In this case “medium” is a subjective term, but the concept is finding commercial entities that are big enough to benefit from solar and able to pay, but are not so big that the sales process is overly bureaucratic or lengthy, the headquarters is remote, and so forth. The average commercial system sold by respondents is approximately 55 kW. If we remove outliers on the top and bottom of the reported range, the average is a perhaps more realistic 36 kW for this sample. (The 55kW average was influenced by one very high reported average commercial system size). The median and mode of reported system sizes is between 30 and 40kW, with a range of 20-70 kW, plus one very high response at 200 kW.
© 2004-2005 COAST HILLS PARTNERS, INC. WWW.COASTHILLSPARTNERS.COM ALL RIGHTS RESERVED 37
There are two reasons way the average commercial system size appears relatively small. One is simply sample variance: the dealers

COAST HILLS PARTNERS
SOLAR ELECTRIC DEALERS 2004: DYNAMIC MARKETS, SIGNIFICANT OPPORTUNITIES, CHALLENGING THREATS
responding to the survey may have concentrated less on commercial (although that is changing, according to a number of them), and therefore have not sold a repeated number of large (>100kW) systems. Second, several respondents mentioned PowerLight (not surveyed) as a major competitor in the commercial arena, along with the fact that PowerLight tends to target larger (>100kW) deals. PowerLight’s behavior may have created an “umbrella” under which smaller competitors in the commercial marketplace can carve out successful positions without often running up against this large player.
Target Commercial Customer Motivations Commercial and municipal customer motivations essentially boil down to economic reasoning, with the one cited exception being that municipal customers sometimes desire to make a political statement or set an example for residents by adopting solar. Figure 16 illustrates how these motivations split out:
Figure 16: Target Commercial Customer Motivations
Political statement (Municipal)
7%
Educate others
7%
"Green" marketing
7%
Want to insulate vs. increasing
rates13%
Seek 3-7 year ROI26%
Seek overall economic
benefit20%
EconomicBenefit
93%
Save money now20%
In addition to the pure economic return received from solar, some commercial/municipal customers are able to achieve additional, collateral benefits, such as “green” marketing to consumers, education
© 2004-2005 COAST HILLS PARTNERS, INC. WWW.COASTHILLSPARTNERS.COM ALL RIGHTS RESERVED 38
COAST HILLS PARTNERS
SOLAR ELECTRIC DEALERS 2004: DYNAMIC MARKETS, SIGNIFICANT OPPORTUNITIES, CHALLENGING THREATS
in the case of schools or some non-profits, as well as the aforementioned political statement or setting of an example, which is all the more powerfully made when the municipality can clearly demonstrate that solar is the right thing to do both economically and environmentally.
The Bay Area Customer Base as Representative While the San Francisco Bay Area certainly has its points of uniqueness compared to other major metropolitan areas in the U.S., it is nonetheless increasingly able to serve as a representative market for photovoltaics when forecasting market behavior and trends. The Greater Bay Area is the largest regional photovoltaic market in the U.S. California makes up an enormous 80% of the current United States photovoltaic market; more than 50% of this comes from the region just surrounding the Greater Bay Area. This market has been actively growing since 1998, making it one of the oldest in the U.S. as well. The large number of customers, plus the relative maturity of the market here, all contributes to the Greater Bay Area’s usefulness in forecasting behavior in other state and regional markets. Commercial customers, primarily motivated by economic benefits, behave no differently in the Bay Area than in the rest of the country in this respect. As more and more states adopt renewable energy incentive programs, the economic equation for more businesses will dictate converting to solar or another renewable energy source just as it does in Northern California.
© 2004-2005 COAST HILLS PARTNERS, INC. WWW.COASTHILLSPARTNERS.COM ALL RIGHTS RESERVED 39
Similarly, as electric rates increase and more incentive programs are instituted, the economic equation for consumers in other regions becomes more and more similar to the one in the Bay Area. In addition, as general environmental awareness continues to grow, taking action for environmental reasons becomes both more common and less of a political statement. Doing the right thing for the environment becomes a civic-minded thing to do instead of something radical, as has become the case with recycling. This combination of increasing economic similarity and the mainstreaming of environmental awareness reduces the importance o f the Bay Area’s specific socio-political demographics.

COAST HILLS PARTNERS
SOLAR ELECTRIC DEALERS 2004: DYNAMIC MARKETS, SIGNIFICANT OPPORTUNITIES, CHALLENGING THREATS
The increasing diversity of motivations in the Bay Area suggests a broadening of the solar electric market to include a wider variety of customer types, which most likely tends to push the Bay Area’s customer profile further in the direction of the average for the country as a whole. This factor plus the size and age of this photovoltaics market relative to other markets in the U.S. suggests that we can look to the Bay Area to draw implications about the future behavior and trends in these newer markets.
Summary and Conclusions Typical residential solar electric customers in the Greater Bay Area tend to be affluent, educated, and middle-aged, concerned about the environment and are probably somewhat familiar with technology. These consumers have high electric bills and seek some economic benefit as well as want to “do the right thing” by going solar.
Residential solar electric customers appear to be driven by three broad motivations:
“Green:” the desire to help the environment and society by switching to a clean, renewable source of energy;
“Economic:” the desire to achieve current and future savings on electricity expenses; and
“Independence:” the desire to achieve a measure of control over one’s access to power, separate from the current energy infrastructure. While environmental concerns still play a significant role in motivating photovoltaic purchases, an increasing number of solar electric customers are seeking positive economic returns as their primary, or a strong secondary, objective, thus expanding the available market.
© 2004-2005 COAST HILLS PARTNERS, INC. WWW.COASTHILLSPARTNERS.COM ALL RIGHTS RESERVED 40
Typical commercial/municipal customers for the dealers in this survey are long-term building occupants or owners, requiring systems between 30kW and 100kW in size. They have cash on hand or the ability to obtain financing to pay for the systems and are seeking positive economic returns from investing in solar. These customers may also

COAST HILLS PARTNERS
SOLAR ELECTRIC DEALERS 2004: DYNAMIC MARKETS, SIGNIFICANT OPPORTUNITIES, CHALLENGING THREATS
seek some collateral benefits as well from solar adoption, such as “green” marketing to their own customers or constituents.
© 2004-2005 COAST HILLS PARTNERS, INC. WWW.COASTHILLSPARTNERS.COM ALL RIGHTS RESERVED 41
The broadening of the photovoltaic market beyond purely environmentally driven residential customers and the growth of the commercial/municipal market bodes well for continuing market expansion. This increasing diversity of customer motivations and types also suggests that the Bay Area may be a reasonable predictor of solar market development in other major U.S. metropolitan regions, as solar adoption becomes less dependent upon the sociopolitical demographics of Northern California and more so upon broad-based, politically neutral motivations.

COAST HILLS PARTNERS
SOLAR ELECTRIC DEALERS 2004: DYNAMIC MARKETS, SIGNIFICANT OPPORTUNITIES, CHALLENGING THREATS
V. Market & Trends
After discussing the characteristics of target customers, we now analyze the overall market and its effect on solar electric dealers. Survey respondents were interviewed about perceived business conditions and expectations, market trends, impact on the industry from certain events, and opportunities and threats for their businesses going forward.
The Solar Electric Market California is the third largest solar market in the world today, partly as a result of the incentives created by the state to encourage the industry’s growth (Starr, Thomas, Bonneville Environmental Foundation, 2004. http://www.californiasolarcenter.org/pdfs/forum/ Solar04-PerfBasedIncent-Pub.pdf). This market’s dramatic growth has been a boon to solar electric dealers, although, ironically, the very success of these programs has created challenges as well. The California photovoltaic market is projected to reach approximately $359 million in 2004, up from $339 million, according to Coast Hills Partners analysis of CEC and other data (see Chapter III, Company Profiles, Revenues section). The California market as a whole grew 34% from 2003 to 2004, with the region surrounding and including the Greater Bay Area growing slightly faster, at 41% (see Chapter VI, Company Approaches to Growth). This region, the primary marketplace for most of the surveyed companies, comprises 51% of the total California market, or $182 million [Figure 17].
© 2004-2005 COAST HILLS PARTNERS, INC. WWW.COASTHILLSPARTNERS.COM ALL RIGHTS RESERVED 42
As noted previously, since California makes up a whopping 80% of the U.S. solar electric market, San Francisco and Northern California thus make up 40% of the total U.S. photovoltaic market. This is both the largest regional market in the United States, as well as a substantial market from a worldwide perspective. Analysis of 2003 data from Solarbuzz (http://www.solarbuzz.com/marketbuzz2004-intro.htm) shows that, if broken out separately, the Northern California region

COAST HILLS PARTNERS
SOLAR ELECTRIC DEALERS 2004: DYNAMIC MARKETS, SIGNIFICANT OPPORTUNITIES, CHALLENGING THREATS
would rank 4th in global market size, behind Japan, Germany, and the rest of Europe.
Business Conditions & Future Expectations A clear majority of survey respondents (81%) reported either a substantial improvement in business conditions over the past 24 months or at least some overall improvement [Figure 18], which is consistent with overall market growth. The remainder reported a variety of conditions, ranging from neutral (no change in business conditions in this time period, or some positive change & some negative change) to slightly negative. Negative assessments were all attributed to the declining rebates in California. These have resulted in lower margins for some; lower volumes for others as they see some consumers being priced out of the market by higher net system costs. Others have looked to markets in other states where the incentives are more attractive (e.g., New Jersey). Although these other state markets are relatively tiny today, some dealers are betting that growth there will pick up, similar to growth in California from 2001 to present.
© 2004-2005 COAST HILLS PARTNERS, INC. WWW.COASTHILLSPARTNERS.COM ALL RIGHTS RESERVED 43
N
S
Figure 17: 2004 California Solar Electric Market by Regions
Total = $359 Million
San Francisco &
Northern California
51%
Los Angeles &
Central California
37%
San Diego11%
Other California
1%

COAST HILLS PARTNERS
SOLAR ELECTRIC DEALERS 2004: DYNAMIC MARKETS, SIGNIFICANT OPPORTUNITIES, CHALLENGING THREATS
1111
611
0 2 4 6 8 10 12
Number of Respondents
Improved significantly
ImprovedIncreased volume, some decreased
marginStayed same
Improvement out of state; decline in CA
Worsened somewhat
Figure 18: Business Conditions, Last 24 months
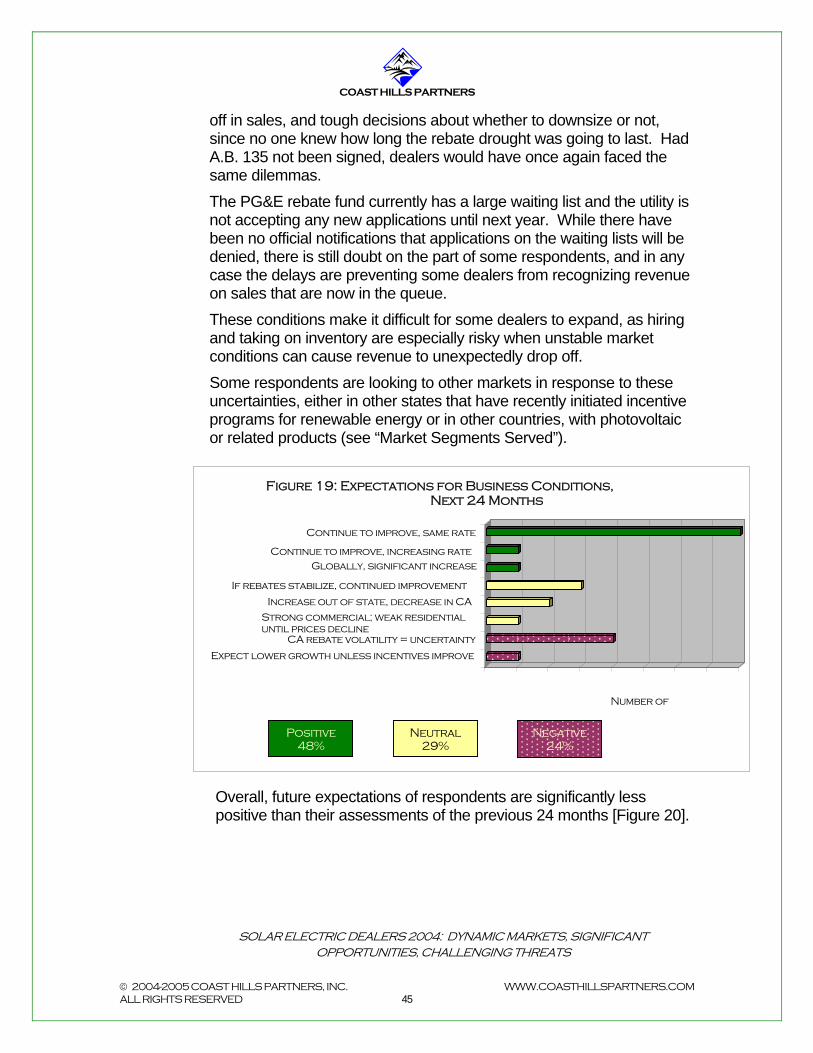
Expectations for the future show a similar pattern, although they are not so predominantly optimistic [Figure 19]. The major factor cited behind this change is the instability of California rebate programs. While the existence of the programs and the fact that they are being utilized by so many end-customers is certainly tremendous for dealers, the success of these incentives have sown the seeds of volatility, as program funds have been used faster than expected. Respondents noted that the unexpectedly large drop in the per-Watt rebate in January, 2004, ($.60/Watt instead of the expected $.20/Watt) created a great deal of uncertainty about the predictability of the CEC program going forward. Some respondents felt that this was too large a drop for the market to bear at that stage in its development, particularly as panel shortages have reduced or eliminated the price reductions that were expected to occur as more solar systems were sold. In addition, at the time of the survey, the CEC program was in danger of running out of money if the Governor did not sign A.B. 135, authorizing additional funds to be used this year (it was subsequently signed). Respondents compared the uncertainty and the possible impact if the bill were not signed to a similar, previous situation when the fund ran dry and no rebate checks were signed for a few months. Solar dealers were faced with cash flow crunches in some cases, a fall-
© 2004-2005 COAST HILLS PARTNERS, INC. WWW.COASTHILLSPARTNERS.COM ALL RIGHTS RESERVED 44
Positive 81%
Neutral 14%
Negative 5%
COAST HILLS PARTNERS
SOLAR ELECTRIC DEALERS 2004: DYNAMIC MARKETS, SIGNIFICANT OPPORTUNITIES, CHALLENGING THREATS
off in sales, and tough decisions about whether to downsize or not, since no one knew how long the rebate drought was going to last. Had A.B. 135 not been signed, dealers would have once again faced the same dilemmas. The PG&E rebate fund currently has a large waiting list and the utility is not accepting any new applications until next year. While there have been no official notifications that applications on the waiting lists will be denied, there is still doubt on the part of some respondents, and in any case the delays are preventing some dealers from recognizing revenue on sales that are now in the queue. These conditions make it difficult for some dealers to expand, as hiring and taking on inventory are especially risky when unstable market conditions can cause revenue to unexpectedly drop off. Some respondents are looking to other markets in response to these uncertainties, either in other states that have recently initiated incentive programs for renewable energy or in other countries, with photovoltaic or related products (see “Market Segments Served”).
Figure 19: Expectations for Business Conditions, Next 24 Months
Continue to improve, same rate
Continue to improve, increasing rateGlobally, significant increase
If rebates stabilize, continued improvement
Increase out of state, decrease in CA
Strong commercial; weak residential until prices decline
CA rebate volatility = uncertainty
Expect lower growth unless incentives improve
Number of
Positive 48%
Neutral Negative 24% 29%
Overall, future expectations of respondents are significantly less positive than their assessments of the previous 24 months [Figure 20].
© 2004-2005 COAST HILLS PARTNERS, INC. WWW.COASTHILLSPARTNERS.COM ALL RIGHTS RESERVED 45

COAST HILLS PARTNERS
SOLAR ELECTRIC DEALERS 2004: DYNAMIC MARKETS, SIGNIFICANT OPPORTUNITIES, CHALLENGING THREATS
5%14%
81%
24%
29%
48%
0%
20%
40%
60%
80%
100%
% o
f
Re
sp
on
se
s
Previous 24months
FutureExpectations
Figure 20: Perceptions of Business Conditions, Past & Future
Positive
Neutral
Negative
Notwithstanding, a substantial percentage -- almost half -- is very bullish on the future; thus, there is more divergence of opinion looking forward than there is assessing the recent past. A number of the bullish respondents appeared more sanguine about potentially choppy business conditions. There are three possible reasons for this, the first being simply having a more upbeat attitude. Some analysis of the data, however, reveals two other possibilities that could give rise to that optimistic outlook.
Figure 21: Optimistic Expectations Correlated with Size of Company
$0
$5
$10
$15
$20
-2 -1 0 1 2
-1 = Negative, 0 = Neutral, 1 = PositiveExpectations
An
nu
al
Re
ve
nu
e
($M
M)
© 2004-2005 COAST HILLS PARTNERS, INC. WWW.COASTHILLSPARTNERS.COM ALL RIGHTS RESERVED 46
Figure 21 shows the correlation between annual revenue and outlook. While smaller firms show up in each attitude category, it appears that
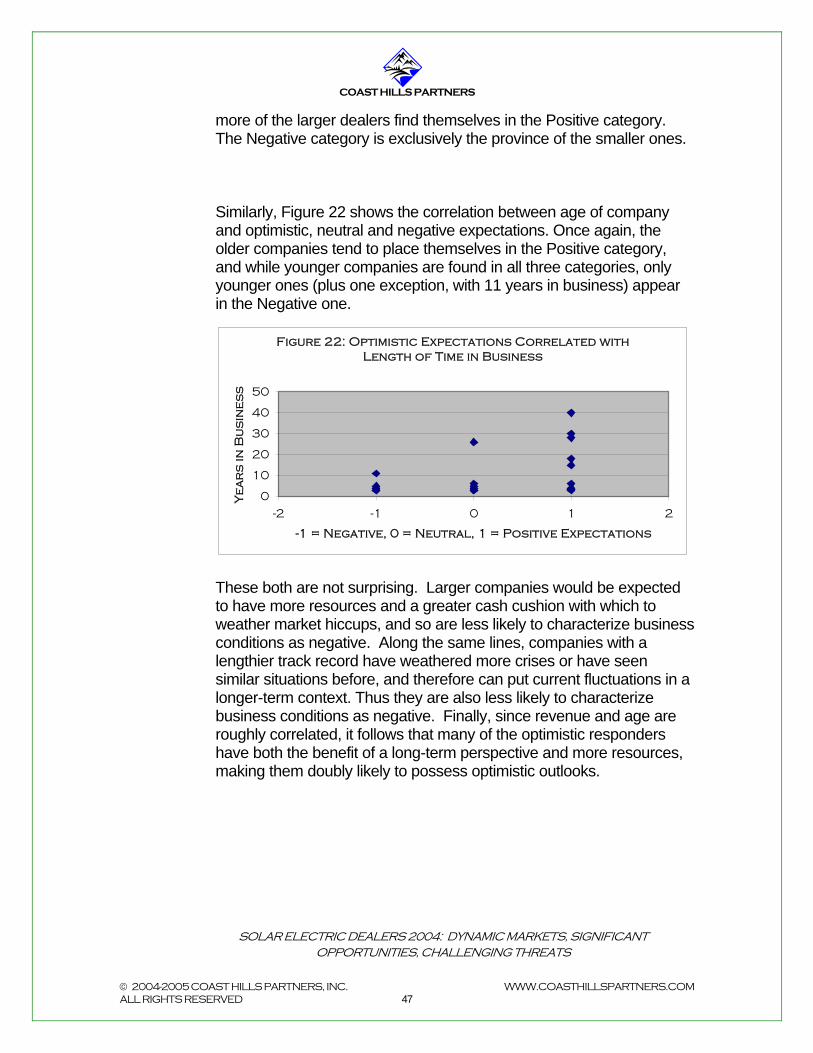
COAST HILLS PARTNERS
SOLAR ELECTRIC DEALERS 2004: DYNAMIC MARKETS, SIGNIFICANT OPPORTUNITIES, CHALLENGING THREATS
more of the larger dealers find themselves in the Positive category. The Negative category is exclusively the province of the smaller ones. Similarly, Figure 22 shows the correlation between age of company and optimistic, neutral and negative expectations. Once again, the older companies tend to place themselves in the Positive category, and while younger companies are found in all three categories, only younger ones (plus one exception, with 11 years in business) appear in the Negative one.
These both are not surprising. Larger companies would be expected to have more resources and a greater cash cushion with which to weather market hiccups, and so are less likely to characterize business conditions as negative. Along the same lines, companies with a lengthier track record have weathered more crises or have seen similar situations before, and therefore can put current fluctuations in a longer-term context. Thus they are also less likely to characterize business conditions as negative. Finally, since revenue and age are roughly correlated, it follows that many of the optimistic responders have both the benefit of a long-term perspective and more resources, making them doubly likely to possess optimistic outlooks.
© 2004-2005 COAST HILLS PARTNERS, INC. WWW.COASTHILLSPARTNERS.COM ALL RIGHTS RESERVED 47
Figure 22: Optimistic Expectations Correlated with Length of Time in Business
0
10
20
30
40
50
-2 -1 0 1 2
-1 = Negative, 0 = Neutral, 1 = Positive Expectations
Ye
ar
s in
Bu
sin
es
s
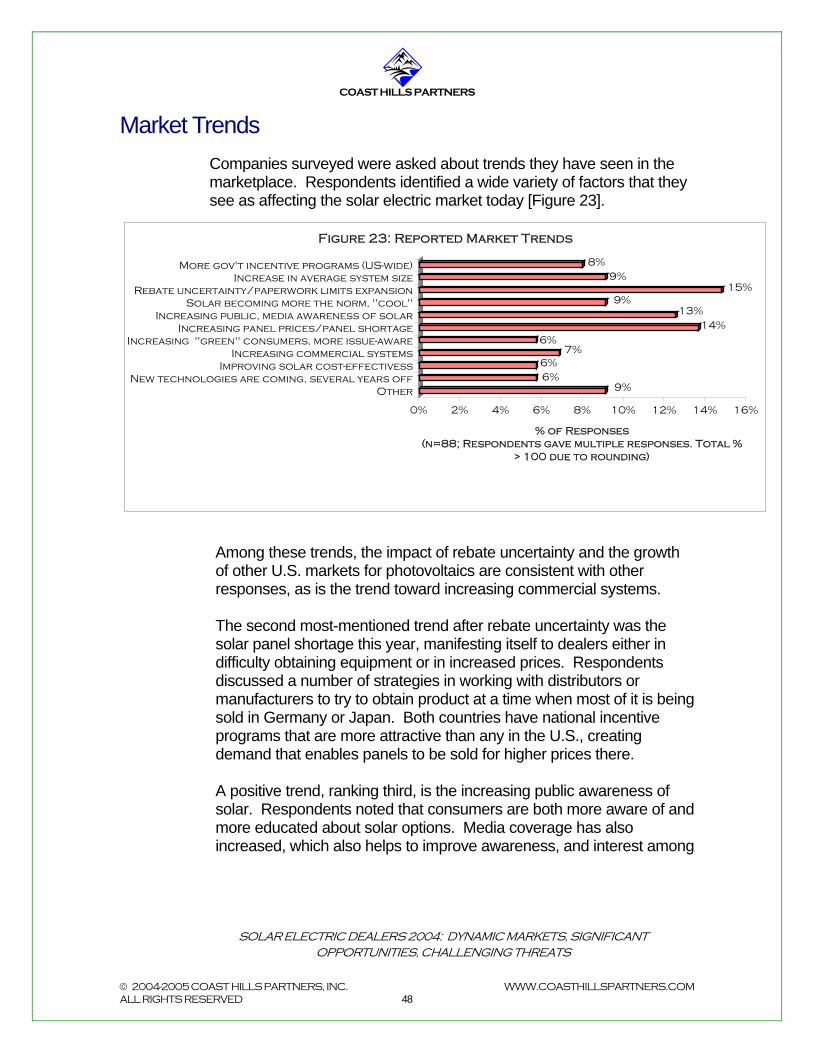
COAST HILLS PARTNERS
SOLAR ELECTRIC DEALERS 2004: DYNAMIC MARKETS, SIGNIFICANT OPPORTUNITIES, CHALLENGING THREATS
Market Trends Companies surveyed were asked about trends they have seen in the marketplace. Respondents identified a wide variety of factors that they see as affecting the solar electric market today [Figure 23].
9%6%6%
7%6%
14%13%
9%15%
9%8%
0% 2% 4% 6% 8% 10% 12% 14% 16%
% of Responses(n=88; Respondents gave multiple responses. Total %
> 100 due to rounding)
More gov't incentive programs (US-wide)Increase in average system size
Rebate uncertainty/paperwork limits expansionSolar becoming more the norm, "cool"
Increasing public, media awareness of solarIncreasing panel prices/panel shortage
Increasing "green" consumers, more issue-awareIncreasing commercial systems
Improving solar cost-effectivessNew technologies are coming, several years off
Other
Figure 23: Reported Market Trends
Among these trends, the impact of rebate uncertainty and the growth of other U.S. markets for photovoltaics are consistent with other responses, as is the trend toward increasing commercial systems. The second most-mentioned trend after rebate uncertainty was the solar panel shortage this year, manifesting itself to dealers either in difficulty obtaining equipment or in increased prices. Respondents discussed a number of strategies in working with distributors or manufacturers to try to obtain product at a time when most of it is being sold in Germany or Japan. Both countries have national incentive programs that are more attractive than any in the U.S., creating demand that enables panels to be sold for higher prices there.
© 2004-2005 COAST HILLS PARTNERS, INC. WWW.COASTHILLSPARTNERS.COM ALL RIGHTS RESERVED 48
A positive trend, ranking third, is the increasing public awareness of solar. Respondents noted that consumers are both more aware of and more educated about solar options. Media coverage has also increased, which also helps to improve awareness, and interest among

COAST HILLS PARTNERS
SOLAR ELECTRIC DEALERS 2004: DYNAMIC MARKETS, SIGNIFICANT OPPORTUNITIES, CHALLENGING THREATS
builders has grown, suggesting that solar electric systems may organically start to become a part of the new housing market. A related reported trend is the fact that solar seems to be becoming more of the “norm.” More people know someone else who has solar; it is no longer (at least in California) an unusual purchase made by a few “innovator” consumers. While it is not mainstream yet by far, solar is progressing along the technology adoption curve in that direction. Respondents also noted a “coolness” factor increasingly being attributed to solar (perhaps because of the heavy “tech” influence in the Bay Area), which increases its attractiveness with some customers. Almost 40% of respondents noted seeing an increase in the average system size (primarily residential) that they sold. Reasons for this include increased demand for solar overall, increased cost-effectiveness of photovoltaics (so consumers can afford to buy larger systems), and/or improved marketing and sales targeting toward customers more likely to purchase larger systems. Another trend, mirroring the customer attributes reported above, is the gradually increasing “green” trend in the population at large, which results in more consumers becoming aware of the environmental issues that solar can help address. Thus, some consumers are being drawn to solar, not because they learned about solar directly, but because they first learned about the effects of fossil fuels on global warming and air pollution and then identified solar as a potential solution they could adopt. It would be interesting to discover if this is a trend unique to the Bay Area, or if it has broader roots. Trends were also noted in the technology arena for photovoltaics. 24% of respondents cited an increase in the cost-effectiveness of solar electric systems, due to the twin effects of increasing electric rates and improving technology, which is gradually driving up equipment efficiencies. At the same time, an equal number of respondents expressed confidence, based on their own research, that there are new technologies in the pipeline that will very positively impact the economics of solar. Each of these respondents, however, also stated that these improvements were several years away from market deployment.
© 2004-2005 COAST HILLS PARTNERS, INC. WWW.COASTHILLSPARTNERS.COM ALL RIGHTS RESERVED 49

COAST HILLS PARTNERS
SOLAR ELECTRIC DEALERS 2004: DYNAMIC MARKETS, SIGNIFICANT OPPORTUNITIES, CHALLENGING THREATS
Responses bundled in the “Other” category were trends identified by less than 10% of respondents. They do represent important commentary on the market, however, and are trends worth noticing. They are:
A significant increase in competition over the past 3-6 years
Decreasing installation costs as experience (number of systems installed) increases. This is the classic “Learning Curve” effect: as production increases over time, the time and effort required (and therefore the cost) for each unit produced declines. This is one of the key assumptions behind the CEC rebates’ planned reductions: as more solar systems are sold, they will become cheaper to install, and the rebates will not need to be as large to provide the same level of economic incentive.
Decreasing demand as incentives decline. Some dealers are
seeing this trend (which indicates the CEC system is probably not perfect), perceiving that some residential customers are being priced out of the market.
Increased interest in more aesthetic solar products: Building-
integrated solar products, black-framed panels, and so forth. This may coincide with increased builder interest; it also may be the effect of municipalities starting to express preferences for more attractive equipment when issuing building permits, as more solar permits are sought.
Finally, a continuing issue more than a trend, is the fact that
cost-effectiveness issues still limit the overall market for solar electric.
Impact of Electricity & Oil Price Volatility on Demand
© 2004-2005 COAST HILLS PARTNERS, INC. WWW.COASTHILLSPARTNERS.COM ALL RIGHTS RESERVED 50
Survey respondents were asked to provide their impressions of what happens to their businesses when electric rates change and/or oil issues (oil price increases, foreign oil dependence, war in the Middle East, etc.) are in the news. Figure 24 illustrates their responses:

COAST HILLS PARTNERS
SOLAR ELECTRIC DEALERS 2004: DYNAMIC MARKETS, SIGNIFICANT OPPORTUNITIES, CHALLENGING THREATS
© 2004-2005 COAST HILLS PARTNERS, INC. WWW.COASTHILLSPARTNERS.COM ALL RIGHTS RESERVED 51
38%
10% 10%
24%
5%
14%
0%
5%
10%
15%
20%
25%
30%
35%
40%%
of
Re
sp
on
se
s(%
s >
10
0 d
ue
to
ro
un
din
g)
Both increasebusiness
(leads, sales)
Both increaseawarenessonly (not
sales directly)
Mediacoverageincreases
leads
Electric ratehikes only
increase leads
Oil crisesonly (war,
etc.) increaseleads
Does notaffect
business
Figure 24: Impact of electric rate, oil price volatility on solar demand
These responses reflect the estimated impact of certain events on observable changes in awareness or interest and leads. However, at this level of analysis, it is difficult to uncover causal relationships. For example, it seems plausible that electric rate increases are likely to result in a greater number of leads and sales. However, some respondents believe that rate hikes and other energy news only create awareness; another impetus has to be present to actually create a prospect. Similarly, another respondent stated his belief that events, even electric rate changes, must achieve a certain level of press coverage for them to have any effect on potential customers. Customers might not notice what’s on their electric bills, he asserts, but they do notice if it makes the papers. Almost 40% of respondents see an increase in leads and possibly sales when electricity or oil issues surface. How much this benefits solar electric dealers is actually unclear, however. One respondent pointed out perceptively that, while inquiries increase when electricity or oil issues are in the news, it is not clear that these inquiries actually result in a higher number of booked sales. Overall, it is safe to say that a majority of respondents believe that electric rate and oil price increases have positive effects at some level on their businesses. Determining how much of a benefit they provide

COAST HILLS PARTNERS
SOLAR ELECTRIC DEALERS 2004: DYNAMIC MARKETS, SIGNIFICANT OPPORTUNITIES, CHALLENGING THREATS
will require analysis of leads and close rates over different time periods by the individual companies.
Impact on Businesses if Incentives are Phased Out Company representatives were asked to predict what would happen to their businesses if solar electric incentives were to be phased out. Almost all respondents interpreted this question to mean “…if incentives were phased out suddenly.” Thus their responses reflect what they believe would happen in such a crisis situation. Responses varied across a wide range [Figure 25].
3%
3%
7%
7%
10%
13%
13%
13%
13%
17%
0% 2% 4% 6% 8% 10% 12% 14% 16% 18%
% of Responses(<100% due to rounding)
Remain in business
Industry shakeout
Smaller solar electric market
Significant loss to business
Long term, market wil be viable
Pursue other markets
Out of solar electric business
Don't believe it will happen in nearfuture
Trying to make solar affordable w/oincentives now
No response
Figure 25: Impact on Business if Incentives Phased Out (Suddenly)
Interestingly, respondents’ assessments of the results in this extreme scenario, either for their own businesses or for the photovoltaic market as a whole, were almost evenly split between the positive and the negative. Almost one-fifth of respondents remained confident that their companies would remain in business. The next two negative responses illustrate two sides of the same coin: one group of respondents predicted a smaller market for solar without incentives, while another group foresaw an industry shake-out, leaving only the strongest players – thus, smaller demand begets smaller supply.
© 2004-2005 COAST HILLS PARTNERS, INC. WWW.COASTHILLSPARTNERS.COM ALL RIGHTS RESERVED 52
Positive 50% Negative 46% No Response 3%

COAST HILLS PARTNERS
SOLAR ELECTRIC DEALERS 2004: DYNAMIC MARKETS, SIGNIFICANT OPPORTUNITIES, CHALLENGING THREATS
Another group predicted a significant loss to their own businesses, while a smaller percentage predicted they would exit the solar electric business entirely. On the positive side, a significant number of respondents expressed the belief that, long term, efficiency improvements combined with increasing electric rates from conventional fuels will drive the market for photovoltaics. Some respondents noted their efforts to make solar affordable today without incentives, through financing or other mechanisms. A larger group indicated their intent to either continue pursuing other markets (other geographies or products), or to enter new markets, to protect against the loss of incentives. Finally, another group expressed the belief/hope that this scenario is simply not likely. None of these predictions are mutually exclusive in reality, either over time or for the companies involved. For example, there could be a short-term shakeout followed by longer-term economic viability for solar; and during this process some companies will exit the business, move to other markets, or remain and grow stronger.
In general, respondents appeared to almost universally agree with the premises behind the CEC’s planned rebate step-down, with many expressing the desire to be able to operate without incentives. Nevertheless, they acknowledged that the economics of photovoltaics are not there just yet to be self-sustaining. Estimates vary for how much the cost must come down (or electric rates must rise); the order of magnitude is in dollars per Watt.
© 2004-2005 COAST HILLS PARTNERS, INC. WWW.COASTHILLSPARTNERS.COM ALL RIGHTS RESERVED 53
Opportunities and Threats Company representatives were asked to state perceived opportunities and threats to their businesses going forward [Figures 26 & 27].
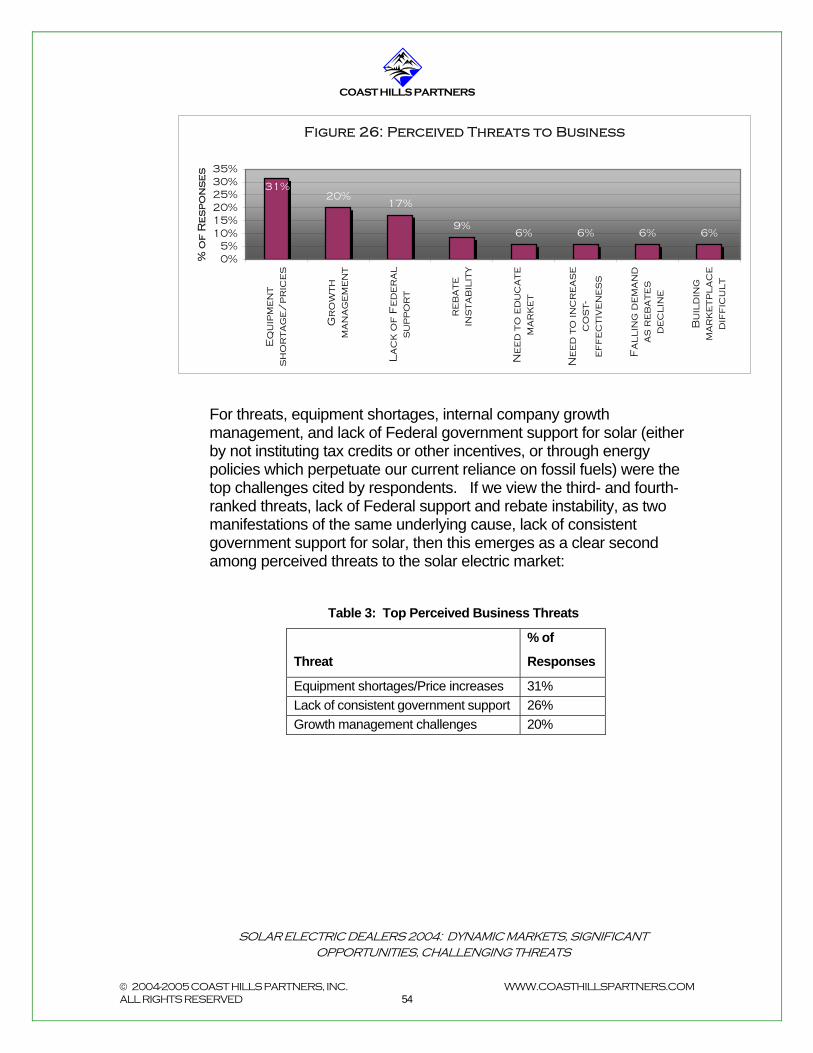
COAST HILLS PARTNERS
SOLAR ELECTRIC DEALERS 2004: DYNAMIC MARKETS, SIGNIFICANT OPPORTUNITIES, CHALLENGING THREATS
© 2004-2005 COAST HILLS PARTNERS, INC. WWW.COASTHILLSPARTNERS.COM ALL RIGHTS RESERVED 54
Figure 26: Perceived Threats to Business
20%17%
9%6% 6% 6% 6%
31%
0%5%
10%15%20%25%30%35%
Eq
uip
me
nt
sh
or
tag
e/
pr
ice
s
Gr
ow
thm
an
ag
em
en
t
La
ck
of
Fe
de
ra
ls
up
po
rt
re
ba
tein
sta
bil
ity
Ne
ed
to
ed
uc
ate
ma
rk
et
Ne
ed
to
inc
re
as
ec
os
t-e
ff
ec
tiv
en
es
s
Fa
ll
ing
de
ma
nd
as
re
ba
tes
de
cli
ne
Bu
ild
ing
ma
rk
etp
lac
ed
iff
icu
lt
% o
f R
es
po
ns
es
For threats, equipment shortages, internal company growth management, and lack of Federal government support for solar (either by not instituting tax credits or other incentives, or through energy policies which perpetuate our current reliance on fossil fuels) were the top challenges cited by respondents. If we view the third- and fourth- ranked threats, lack of Federal support and rebate instability, as two manifestations of the same underlying cause, lack of consistent government support for solar, then this emerges as a clear second among perceived threats to the solar electric market:
Table 3: Top Perceived Business Threats
Threat
% of
Responses
Equipment shortages/Price increases 31% Lack of consistent government support 26% Growth management challenges 20%

COAST HILLS PARTNERS
SOLAR ELECTRIC DEALERS 2004: DYNAMIC MARKETS, SIGNIFICANT OPPORTUNITIES, CHALLENGING THREATS
© 2004-2005 COAST HILLS PARTNERS, INC. WWW.COASTHILLSPARTNERS.COM ALL RIGHTS RESERVED 55
Figure 27: Perceived Opportunities for Business
18%
14% 14%
7%
4% 4% 4%
14%
11% 11%
0%
2%
4%
6%
8%
10%
12%
14%
16%
18%
20%
Po
sit
ive
le
gis
la
tio
n,
pr
og
ra
ms
Oth
er
av
ail
ab
le
ma
rk
ets
Inc
re
as
ing
aw
ar
en
es
s
En
er
gy
de
ma
nd
,r
ate
inc
re
as
es
Te
ch
no
log
y,s
ca
lee
co
no
mic
s
Co
mm
er
cia
lm
ar
ke
t
So
lar
ad
op
tio
nr
ate
Re
sid
en
tia
lm
ar
ke
t
CA
cli
ma
te
De
cli
ne
to
sta
te
% o
f R
es
po
ns
es
Respondents provided the expected variety of opportunities. New renewable energy programs and legislation, new markets, increasing awareness and the fact that “there will always be an energy crisis,” as one respondent put it, create the most visible opportunities. Some respondents specifically cited PG&E’s announced electric rate increases for 2005 as support for this last category. Dealers in general expressed optimism about technology-driven efficiency improvements for photovoltaics, as noted in Market Trends above, but for the most part do not view the resulting potential cost reductions as near-term opportunities for market growth. If we again view the third- and fourth ranked opportunities, increasing awareness of solar and continuing increase in energy demand and rates, as two manifestations of one phenomenon, continuing energy crisis and identification of solar as an alternative, then this emerges as the top opportunity for solar electric dealers going forward. The seventh-ranked “(increasing) solar adoption rate” response also belongs in this category. The top opportunities, then, represent a powerful trio of market forces:

COAST HILLS PARTNERS
SOLAR ELECTRIC DEALERS 2004: DYNAMIC MARKETS, SIGNIFICANT OPPORTUNITIES, CHALLENGING THREATS
Table 4: Top Perceived Business Opportunities
Opportunity
% of
Responses
Energy crisis; solar recognized, adopted as alternative 35% Increasing government programs 18% Other available markets 14%
Each of these opportunity categories represents the continuation and growth of a market condition that exists today. Thus, solar electric dealers should have the beginnings of a roadmap for pursuing these opportunities going forward.
Summary and Conclusions Market conditions have been excellent for solar electric dealers over the past few years. The photovoltaic market has grown to $359 million in annual sales in just a few short years, with the Greater Bay Area and slightly beyond comprising over 50% of that market. Not surprisingly, 81% of respondents described improved or significantly improved business conditions over the past 24 months. The amount of optimism expressed by dealers looking into the next 24 months or so is significant, but substantially less, than the positive assessments of the recent past. Key factors influencing these expectations include perceived instability in California’s renewable energy incentive programs and the current shortage of solar panel supplies. An additional challenge is posed by the difficulties of managing small businesses successfully for growth.
© 2004-2005 COAST HILLS PARTNERS, INC. WWW.COASTHILLSPARTNERS.COM ALL RIGHTS RESERVED 56
Positive trends cited included the broadening awareness of solar, as well as growing awareness of environmental issues in general. The continuation of the current energy situation, characterized by high and increasing prices combined with extremely slow change in our fossil fuel-based energy system, serves as an ongoing stimulus to the photovoltaic market. Other variables that can contribute to increasing rates of solar growth include the potential expansion of government support for renewable energy and the opening up of additional solar markets. Potential photovoltaic cost reductions are viewed as a future, but not immediate, opportunity for growth

COAST HILLS PARTNERS
SOLAR ELECTRIC DEALERS 2004: DYNAMIC MARKETS, SIGNIFICANT OPPORTUNITIES, CHALLENGING THREATS
VI. Company
Approaches to Growth
In general, surveyed companies have experienced dramatic rates of growth over the past few years. Many are continuing to see aggressive growth rates, while others are seeing a slowdown. In either case, the challenge of how to manage growth is a real one. Particularly for smaller companies, following the right growth strategy and managing growth carefully can mean the difference between survival and failure. (And, as noted before, all of those surveyed could be considered small in an industry-wide sense).
Recent Growth Rates Surveyed companies have experienced a wild ride of growth since 2001. Even many of the companies predicting slightly negative growth for this year and next saw upwards of 100% growth rates in 2002-2003, for example. Other companies are seeing their businesses go nowhere but up, with one respondent reporting continuous growth rates of 500-600% over the last few years and continuing through this year. A large number of other respondents cited lower, but nonetheless very impressive growth rates as well. In total, 81% of respondents reported double- or triple-digit growth rates over the past year. Company responses have been grouped into broad growth categories to illustrate the three main types of growth seen among respondents [Figure 28].
© 2004-2005 COAST HILLS PARTNERS, INC. WWW.COASTHILLSPARTNERS.COM ALL RIGHTS RESERVED 57

COAST HILLS PARTNERS
SOLAR ELECTRIC DEALERS 2004: DYNAMIC MARKETS, SIGNIFICANT
OPPORTUNITIES, CHALLENGING THREATS © 2004-2005 COAST HILLS PARTNERS, INC. WWW.COASTHILLSPARTNERS.COM ALL RIGHTS RESERVED 58
98
4
0
1
2
3
4
5
6
7
8
9
Number of Respondents
Figure 28: Relative Growth Rates Reported, 2003-2004
Flat or slightlynegative;
seeking othermarkets
10% to 99%year-to-year
growth
Greater than100% year-to-year growth
This experience is confirmed by rates of growth for the larger market as well. We used the year-to-year growth rates for systems smaller than 30kW as a rough proxy for total market growth [Figure 29]:
Figure 29: Year-to-Year Solar Electric Sales Growth Rates, CEC <30kW Program
-100% 0% 100% 200% 300% 400% 500% 600% 700%
2003-2004 2002-20032001-20022000-20011999-2000 1998-1999
Growth in
Revenue $
CEC <30 kW Year-to-Year Solar Electric Sales Growth
San Francisco and Northern California <30kW Year-to-Solar Electric Sales Growth

COAST HILLS PARTNERS
SOLAR ELECTRIC DEALERS 2004: DYNAMIC MARKETS, SIGNIFICANT OPPORTUNITIES, CHALLENGING THREATS
It is important to note that declining rates of growth only indicate a slower rate of expansion from one year to the next, not a contraction in the market. When growth rates actually turn negative (as they did briefly in 1999-2000), then the market is actually becoming smaller. In addition, growth rates for the past three years appear relatively flat in Figure 29, but they are actually not, as the detail indicates in Figure 30:
Overall, the under 30-kW photovoltaic market in California has grown at a cumulative annual growth rate (CAGR) of 111% since 1998. The Greater Bay Area region has grown at a slightly higher pace, a 135% CAGR. Although annual rates of increase have slowed from triple digits in 2001, the California market is still expanding at healthy double-digit annual rates. These rates of growth represent tremendous opportunity, as well as substantial challenge, to photovoltaic dealers. Next we investigate a possible link between scale (size) and growth rates, to see if larger or smaller players are better able to sustain high growth rates. For comparison purposes, the three different growth
© 2004-2005 COAST HILLS PARTNERS, INC. WWW.COASTHILLSPARTNERS.COM ALL RIGHTS RESERVED 59
Figure 30: Solar Electric Sales Growth Rate Detail,
2001-2004( <30 kW Systems)
0%
20% 40% 60% 80% 100% 120% 140%
Year-toYear Revenue Growth
California Year-to-Year Sales Growth
34%41%107%
Year-to-Year Sales Growth,San Francisco& N. California
41%40%132%
2003-20042002-20032001-2002

COAST HILLS PARTNERS
SOLAR ELECTRIC DEALERS 2004: DYNAMIC MARKETS, SIGNIFICANT OPPORTUNITIES, CHALLENGING THREATS
categories were given numeric values [Figure 31]. Results at first indicate that larger companies do appear to be experiencing higher rates of growth; this is interesting because, of course, it is more difficult to maintain a high rate of growth from a large base than a small one.
On the other hand, the lower growth rates indicated by some smaller companies could also be the result of conscious growth management policies. One respondent stated that he limited his company’s growth by remaining within a certain geography, for lifestyle reasons.
Figure 31: Experienced Growth Rates vs. Company Size
$0
$5
$10
$15
$20
$25
-1 0 1 2 3
Relative Growth Rates(0=Flat/Negative; 1=10% to 99%; 2=Above 100%)
An
nu
al
Re
ve
nu
e
($M
M)
It is also important to note that companies in the two high growth categories span all revenue sizes. Thus it is probably more likely in this case that revenue is a result, rather than a predictor, of growth rates. Differences in growth rates experienced by different dealers are due to growth strategy selected by management, execution of sales, marketing and production functions, market positioning, and so forth.
Growth Strategies
© 2004-2005 COAST HILLS PARTNERS, INC. WWW.COASTHILLSPARTNERS.COM ALL RIGHTS RESERVED 60
Company representatives were asked how their organizations planned to handle future growth [Figure 32]. The majority (almost 60%) chose the “Grow manageably” option when given the choices. Respondents provided granularity with this response by discussing the need to hire very judiciously, in terms of both numbers of hires and of finding high quality employees. Other respondents mentioned cash flow issues and the need to carefully manage job commitments, the expected timing of CEC rebate checks, and so forth.

COAST HILLS PARTNERS
SOLAR ELECTRIC DEALERS 2004: DYNAMIC MARKETS, SIGNIFICANT OPPORTUNITIES, CHALLENGING THREATS
2
2
2
12
3
0 5 10 15
Number of Respondents
Figure 32: Planned Growth Management
Grow As fast as possible
Grow manageably
Nonetheless, three respondents expressed the intent to grow as fast as possible. “As possible” does imply some growth management, but it is more intense, however, and indicates a greater willingness to make trade-offs in favor of growth. An area of concern that is closely linked to growth strategy is that of capacity constraints, as limiting factors in any aspect of the business process can derail growth plans. Respondents were asked what the greatest constraint was to expanding their businesses [Figure 33]. Responses fell into a relatively narrow list of common concerns:
© 2004-2005 COAST HILLS PARTNERS, INC. WWW.COASTHILLSPARTNERS.COM ALL RIGHTS RESERVED 61
Going out of state/toother markets
Do not expect growth
Do not know
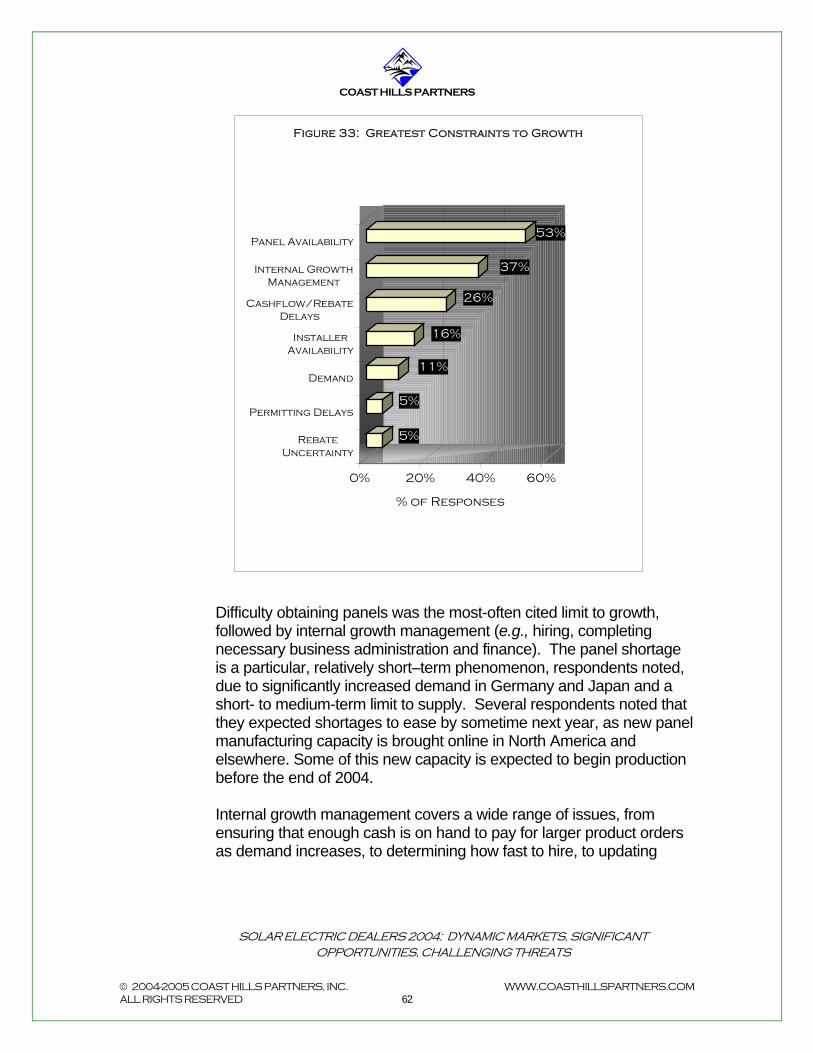
COAST HILLS PARTNERS
SOLAR ELECTRIC DEALERS 2004: DYNAMIC MARKETS, SIGNIFICANT OPPORTUNITIES, CHALLENGING THREATS
Difficulty obtaining panels was the most-often cited limit to growth, followed by internal growth management (e.g., hiring, completing necessary business administration and finance). The panel shortage is a particular, relatively short–term phenomenon, respondents noted, due to significantly increased demand in Germany and Japan and a short- to medium-term limit to supply. Several respondents noted that they expected shortages to ease by sometime next year, as new panel manufacturing capacity is brought online in North America and elsewhere. Some of this new capacity is expected to begin production before the end of 2004. Internal growth management covers a wide range of issues, from ensuring that enough cash is on hand to pay for larger product orders as demand increases, to determining how fast to hire, to updating
© 2004-2005 COAST HILLS PARTNERS, INC. WWW.COASTHILLSPARTNERS.COM ALL RIGHTS RESERVED 62
5%
5%
11%
16%
26%
37%
53%
0% 20% 40% 60%
% of Responses
Panel Availability
Internal GrowthManagement
Cashflow/RebateDelays
InstallerAvailability
Demand
Permitting Delays
RebateUncertainty
Figure 33: Greatest Constraints to Growth

COAST HILLS PARTNERS
SOLAR ELECTRIC DEALERS 2004: DYNAMIC MARKETS, SIGNIFICANT OPPORTUNITIES, CHALLENGING THREATS
procedures and rules to account for a larger organization. Some of these may seem mundane, but failure to properly handle them can result in a business not growing as much as it could or worse, causing problems that can threaten its survival. The length of time to process rebates, plus cash flow shortages due to this lengthy processing, were cited next. Dealers experience delays in finishing jobs while waiting for rebate approvals, thus reducing the number they can complete in a given year. Cash flow and working capital are often strained, especially if the dealer has ordered equipment in advance in order to try to secure scarce panels, since the company has to pay for equipment and then must wait for a rebate check from the state. Unless the dealer has access to a good deal of very low cost credit, this too limits the number of deals a company can take on in a given time period. Availability of qualified installers, either as employees or contractors, was cited fourth as a capacity constraint, limiting some respondents’ ability to complete jobs. This was perceived to be more of an ongoing problem to dealers than the panel shortage; respondents indicated that a fair amount of time is spent finding and training installer employees, locating additional installing contractors, or both. The remaining three categories identified were insufficient demand (cited by those companies seeing flat or negative growth); permitting delays in municipalities with stringent requirements and/or unfamiliarity or misconceptions about solar; and rebate uncertainty resulting in the company’s reluctance to add personnel even though demand is currently evident. Some of these growth constraints could be handled by increased investment in the business. Cash infusions could finance inventory, could provide a cash flow cushion against delays, and could enable hiring or paying additional sub-contractors. The current capitalization of most responding companies does not tend to support these kinds of cash infusions. Almost three-quarters of companies surveyed are owner-financed and have bootstrapped growth from internal cash flow [Figure 34].
© 2004-2005 COAST HILLS PARTNERS, INC. WWW.COASTHILLSPARTNERS.COM ALL RIGHTS RESERVED 63
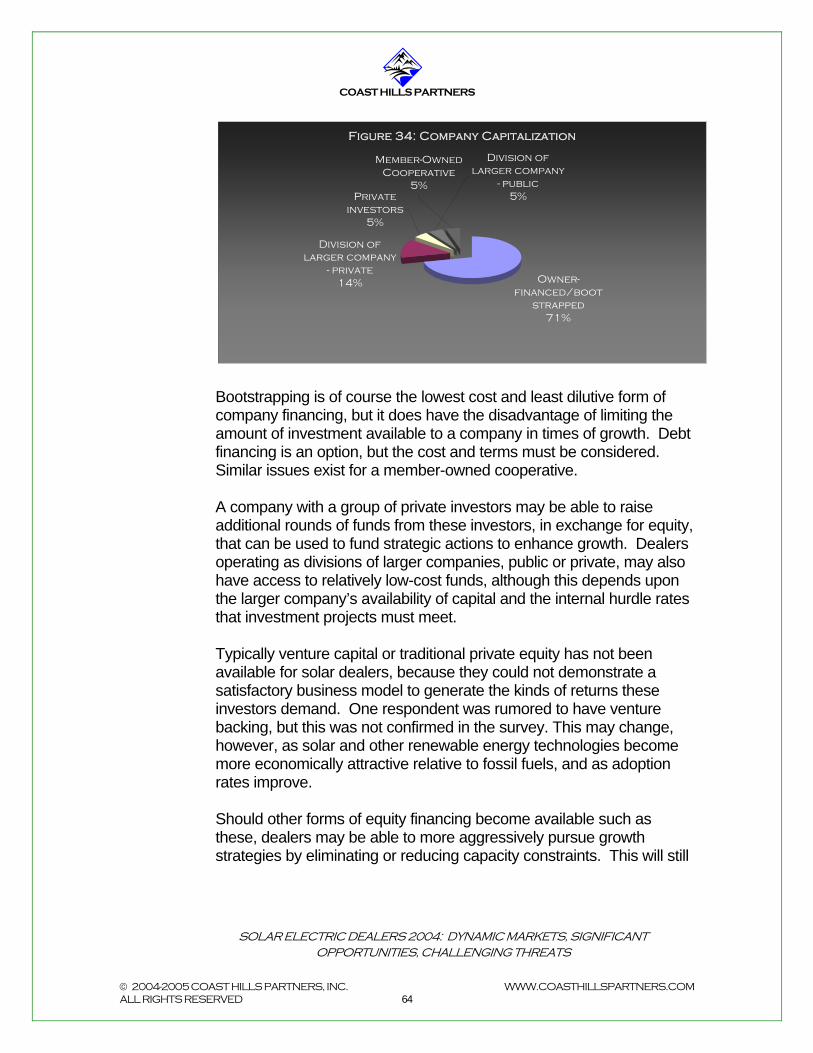
COAST HILLS PARTNERS
SOLAR ELECTRIC DEALERS 2004: DYNAMIC MARKETS, SIGNIFICANT OPPORTUNITIES, CHALLENGING THREATS
Bootstrapping is of course the lowest cost and least dilutive form of company financing, but it does have the disadvantage of limiting the amount of investment available to a company in times of growth. Debt financing is an option, but the cost and terms must be considered. Similar issues exist for a member-owned cooperative. A company with a group of private investors may be able to raise additional rounds of funds from these investors, in exchange for equity, that can be used to fund strategic actions to enhance growth. Dealers operating as divisions of larger companies, public or private, may also have access to relatively low-cost funds, although this depends upon the larger company’s availability of capital and the internal hurdle rates that investment projects must meet. Typically venture capital or traditional private equity has not been available for solar dealers, because they could not demonstrate a satisfactory business model to generate the kinds of returns these investors demand. One respondent was rumored to have venture backing, but this was not confirmed in the survey. This may change, however, as solar and other renewable energy technologies become more economically attractive relative to fossil fuels, and as adoption rates improve. Should other forms of equity financing become available such as these, dealers may be able to more aggressively pursue growth strategies by eliminating or reducing capacity constraints. This will still
© 2004-2005 COAST HILLS PARTNERS, INC. WWW.COASTHILLSPARTNERS.COM ALL RIGHTS RESERVED 64
Figure 34: Company Capitalization
Owner-financed/boot
strapped71%
Division of larger company
- public5%
Division of larger company
- private14%
Member-Owned Cooperative
5%Private
investors5%

COAST HILLS PARTNERS
SOLAR ELECTRIC DEALERS 2004: DYNAMIC MARKETS, SIGNIFICANT OPPORTUNITIES, CHALLENGING THREATS
leave the challenge of internal growth management, cited by several respondents, which will separate the successful from the less so. Successful growth management, and therefore achievement of growth strategies, will hinge on players’ ability to plan and execute effective company operations in a rapidly changing growth environment.
Summary and Conclusions The growth environment is attractive today for photovoltaic dealers in this market, with 81% of dealers surveyed having experienced double- or triple-digit rates of growth over the past year or more, and 71% of dealers currently pursuing growth strategies to expand their businesses. The photovoltaic market in California has grown by an average of 111% year-on-year since 1998, and the Greater Bay Area has grown even slightly faster. There are three major constraints limiting future growth; two of which are largely beyond the control of solar dealers. The first, solar panel shortages, is a global factor, which will hopefully be addressed in the short- to medium-term as manufacturers bring new capacity on line. The second, internal challenge of growth management, is an issue for all small businesses and one that must be mastered for growing solar dealers to achieve success. The third, cash flow and rebate timing issues, is partly an internal financial management issue and partly a political issue, can somewhat be addressed by dealers attempting to expand their financing options where possible, as well as by very careful internal management. Where they have the capacity, dealers can also become involved in the political arena to attempt to influence policy decisions that affect rebate timing and availability. Several dealers are pursuing this path as members of various industry groups or independently.
© 2004-2005 COAST HILLS PARTNERS, INC. WWW.COASTHILLSPARTNERS.COM ALL RIGHTS RESERVED 65

COAST HILLS PARTNERS
SOLAR ELECTRIC DEALERS 2004: DYNAMIC MARKETS, SIGNIFICANT OPPORTUNITIES, CHALLENGING THREATS
VII. Competition
Competition in the photovoltaic marketplace has increased dramatically in the past three to four years following the energy crisis and the beginning of the PG&E rebate program. The number of solar dealers in California has increased by a factor of 10 or more, according to estimates by respondents. Companies have entered the market from a wide variety of backgrounds, including previous, related solar experience, general contracting or electrical contracting, and high technology managers seeking to join the solar industry. As a result the competitive field is diverse in many ways, and fairly homogenous in others.
Competitors Identified by Respondents Survey respondents were asked to identify their major competitors, or the companies that they saw most often in the market. There were as many different competitors identified as there were survey respondents [Figure 35], and although some companies were mentioned multiple times, there was consensus on only one dominant player, PowerLight, as leader of a segment (commercial in this case). Respondents did not provide consensus on a leader in the residential sector.
© 2004-2005 COAST HILLS PARTNERS, INC. WWW.COASTHILLSPARTNERS.COM ALL RIGHTS RESERVED 66

COAST HILLS PARTNERS
SOLAR ELECTRIC DEALERS 2004: DYNAMIC MARKETS, SIGNIFICANT OPPORTUNITIES, CHALLENGING THREATS
From a confidentiality standpoint, it is critical to mention here that one must not assume that the companies identified as competitors are also the companies that were surveyed. While some of the competitors mentioned were surveyed, others were not, and several companies surveyed were not identified as competitors by other survey respondents. Mentions of a company as a competitor is also an imperfect measure of that company’s size and success rate. Some of the larger companies surveyed were not identified with a frequency related to their size in the market (or at all), while other, smaller players achieved greater notice. Two respondents, in particular, could be labeled as “stealth” competitors because they were not identified by many other respondents but nonetheless are significant players in their markets. Mentions seemed to be linked to geography and sector more than how direct a competitor was to a survey respondent. For example, if a surveyed company competes in the commercial sector, the respondent typically would identify a prominent commercial player, even while noting that this competitor typically went after a different size of job than the respondent’s company did. Visibility as competitors can be due to a variety of factors: a relatively high rate of participation at industry events, good public relations, or
© 2004-2005 COAST HILLS PARTNERS, INC. WWW.COASTHILLSPARTNERS.COM ALL RIGHTS RESERVED 67
0
2
4
6
8
10
12
Nu
mb
er
of
M
en
tio
ns
Ak
ee
na
Bo
rr
eg
o
Ec
oE
ne
rg
ies
"Mo
re
lo
ca
l" c
o's
.
Ma
rin
So
lar
MC
So
lar
Oc
cid
en
tal
Oth
er
s o
n N
et
"Ma
ny
oth
er
s"
Pa
lo
Al
to H
ar
dw
ar
e
Po
we
rL
igh
t
Re
al
Go
od
s
Sc
ho
tt
Sk
y P
ow
er
So
la
r D
ep
ot
So
la
rc
ra
ft
So
lar
wo
rk
s
"So
me
SF
co
."
Su
n L
igh
t &
Po
we
r
Su
n P
ow
er
& G
eo
the
rm
al
"Su
nL
igh
t E
ne
rg
ies
"
Competitors in Alphabetical Order
Figure 35: Competitors Identified by Survey Respondents

COAST HILLS PARTNERS
SOLAR ELECTRIC DEALERS 2004: DYNAMIC MARKETS, SIGNIFICANT OPPORTUNITIES, CHALLENGING THREATS
simply random coincidence, in addition to winning a high proportion of deals in a given segment. In several cases, dealers were not aware of other, significant competitors within their core geography, or expressed surprise at the number of companies in this survey (that there were so many available to be surveyed). These responses indicate very limited information flows in at least this aspect of the photovoltaic market.
Sources of Competitive Advantage
© 2004-2005 COAST HILLS PARTNERS, INC. WWW.COASTHILLSPARTNERS.COM ALL RIGHTS RESERVED 68
Respondents were then asked to define their own sources of competitive advantage – what made them superior to competitors where they chose to compete [Figure 36]. Most company representatives provided multiple reasons. What is striking, however, is how many of the responses are the same, again indicating a degree of lack of knowledge about competitors relative to themselves. Clearly, for example, not everyone can be the low price leader.
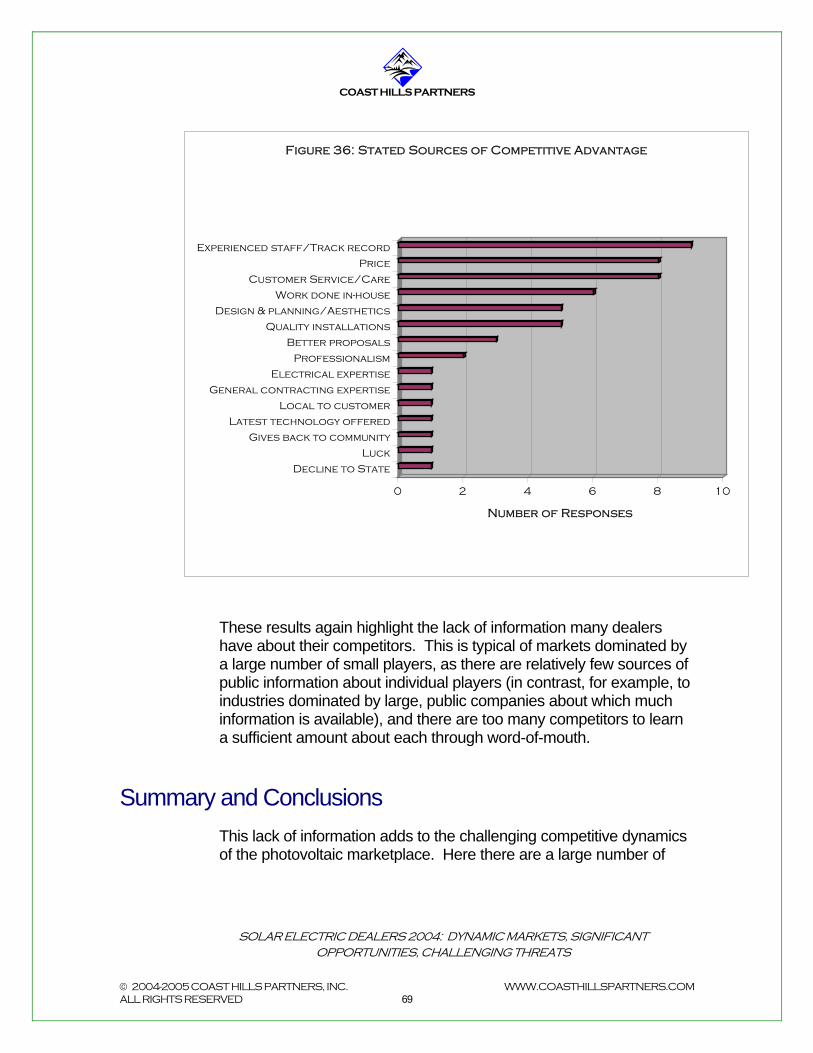
COAST HILLS PARTNERS
SOLAR ELECTRIC DEALERS 2004: DYNAMIC MARKETS, SIGNIFICANT OPPORTUNITIES, CHALLENGING THREATS
These results again highlight the lack of information many dealers have about their competitors. This is typical of markets dominated by a large number of small players, as there are relatively few sources of public information about individual players (in contrast, for example, to industries dominated by large, public companies about which much information is available), and there are too many competitors to learn a sufficient amount about each through word-of-mouth.
Summary and Conclusions This lack of information adds to the challenging competitive dynamics of the photovoltaic marketplace. Here there are a large number of
© 2004-2005 COAST HILLS PARTNERS, INC. WWW.COASTHILLSPARTNERS.COM ALL RIGHTS RESERVED 69
0 2 4 6 8 10
Number of Responses
Experienced staff/Track record
Price
Customer Service/Care
Work done in-house
Design & planning/Aesthetics
Quality installations
Better proposals
Professionalism
Electrical expertise
General contracting expertise
Local to customer
Latest technology offered
Gives back to community
Luck
Decline to State
Figure 36: Stated Sources of Competitive Advantage

COAST HILLS PARTNERS
SOLAR ELECTRIC DEALERS 2004: DYNAMIC MARKETS, SIGNIFICANT OPPORTUNITIES, CHALLENGING THREATS
competitors vying for the same types of business, with essentially interchangeable products that most players can obtain, and where information on which to base differentiating strategies is scarce. Unless the market continues to expand faster than competitors can meet demand, these conditions point to a likely shakeout in the future. This could be caused by the realization of market threats – loss of incentives or supply interruptions – that weed out weaker players, or by the growth of larger regional players (in the $20 million+ revenue range) with the capability to buy up smaller competitors. In either scenario, companies that have achieved broader customer awareness in their segments will have an advantage in becoming regional leaders or in attracting strong buyout prices. Thus, successful branding and differentiation will become crucial competitive marketing strategies.
© 2004-2005 COAST HILLS PARTNERS, INC. WWW.COASTHILLSPARTNERS.COM ALL RIGHTS RESERVED 70

COAST HILLS PARTNERS
SOLAR ELECTRIC DEALERS 2004: DYNAMIC MARKETS, SIGNIFICANT OPPORTUNITIES, CHALLENGING THREATS
VIII. Pricing & Cost
Structure
This section examines pricing (residential and commercial), sources of supply, typical equipment mark-ups, numbers of employees, and revenue per employee, to provide a glimpse at the business models of typical Bay Area solar electric dealers.
Residential Pricing Companies were asked to provide their average installed price per Watt for residential and commercial systems, or the prices they quoted as typical to customers in these segments. Residential prices varied within a relatively broad range [Figure 37]:
0
1
2
3
4
5
Nu
mb
er
of
R
es
po
nd
en
ts
Typically Quoted $/CEC Watt
Figure 37: Average Residential Prices Quoted
© 2004-2005 COAST HILLS PARTNERS, INC. WWW.COASTHILLSPARTNERS.COM ALL RIGHTS RESERVED 71
Figure 37 Data Analysis

COAST HILLS PARTNERS
SOLAR ELECTRIC DEALERS 2004: DYNAMIC MARKETS, SIGNIFICANT OPPORTUNITIES, CHALLENGING THREATS
Average Quoted Price $8.61/CEC Watt $7.13/ STC Watt Average, Excluding Low Outlier $8.74 $7.28 Median Price $8.72 $7.27 Mode $8.80 (n=4) $7.33 CEC Database Average (2004) $8.98 $7.48
[A note about per Watt numbers: Prices were quoted by most contractors and calculations were done for this study in CEC AC Watts (Wattage as calculated for PV systems by the California Energy Commission), before rebates. CEC figures are typically 20% lower than those quoted by manufacturers, in Standard Test Condition DC Watts. Where relevant, results are provided in STC Watts as well by grossing numbers up or down 20% as appropriate.] Prices per Watt ranged from a low of $6.00 per CEC Watt (although this number may not include shipping costs or certain taxes) to a high of $10.21. The increase from low to high in the sample is 70%. Average price from this sample (n = 21) is $8.61. This average rises to $8.74 when the low outlier is excluded. In both cases, these averages are below the state-wide average price per Watt found in the database of approved projects on the CEC’s Website (http://www.energy.ca.gov/renewables/emerging_renewables/2004-10-1_ERP_Cmptd_Apprvd.XLS). The CEC average is $8.98, looking at 2004 data only. (Prior years were not included because those prices reflect, in part, higher equipment prices, which have since declined somewhat. Indeed, the average price per Watt for the entire database, going back to 1998, is $9.45/Watt). The most commonly quoted price (mode), around $8.80/Watt, is not far from the adjusted sample average of $8.74. In addition, the mid-point in the range of quoted prices (median), $8.72, is also not far from the adjusted sample average and the mode. All of this implies that a price in the range of $8.75/CEC Watt (or $7.29/ STC Watt) or so is reasonably representative of the sample as interviewed. The lower average of the survey sample versus CEC data is probably the result of reporting bias; vendors are more likely to quote a low average price than a higher one when asked. Thus, a true average is most likely closer to the CEC database average.
© 2004-2005 COAST HILLS PARTNERS, INC. WWW.COASTHILLSPARTNERS.COM ALL RIGHTS RESERVED 72
One-third of companies were able to provide breakouts between the labor and equipment components of their prices. Prices for the labor

COAST HILLS PARTNERS
SOLAR ELECTRIC DEALERS 2004: DYNAMIC MARKETS, SIGNIFICANT OPPORTUNITIES, CHALLENGING THREATS
component ranged from $0.99 to $1.93 per CEC Watt, increasing from low to high by 95%. Prices charged per Watt for labor varied within a somewhat tighter range than prices overall [Figure 38], averaging $1.41 per CEC Watt (with no outliers), with median and mode falling out at $1.47/W and $1.48/W, respectively. (In STC Watts, the average is $1.18/W; median, $1.22/W; mode, $1.23/W).
Equipment prices varied to about the same degree, between $4.00/Watt and $7.86/Watt, averaging $6.58/Watt, and with a low to high increase of 96%. The average rises to $7.01/Watt if the low outlier is excluded again. Median is $6.90; mode is $6.86. [Figure 39]. In STC Watts, equipment prices range between $3.33/W and $6.56/W, with an average of $5.84/W (excluding the low outlier), a median of $5.75/W, and a mode of $5.72/W.
© 2004-2005 COAST HILLS PARTNERS, INC. WWW.COASTHILLSPARTNERS.COM ALL RIGHTS RESERVED 73
Figure 38: Average Residential Labor Charges
$0.00
$0.50
$1.00
$1.50
$2.00
$2.50
1 2 3 4 5 6 7 8 9
10
11
12
13
14
15
16
17
18
19
20
21
Respondents
Av
er
ag
e L
ab
or
C
ha
rg
e/
Wa
tt
(0
= N
o R
es
po
ns
e)

COAST HILLS PARTNERS
SOLAR ELECTRIC DEALERS 2004: DYNAMIC MARKETS, SIGNIFICANT OPPORTUNITIES, CHALLENGING THREATS
The variability of equipment charges versus labor suggests either differences in buying power among dealers or different strategies for equipment mark-ups, although the sample size for this data cautions against broad extrapolations. Typical mark-up rates among dealers do show a broad variation, from 0% to 34% [Figure 40]. The average mark-up is 20% over wholesale. Mark-ups tend to be fungible, however, as some respondents indicated that they reduced their mark-ups in competitive situations, or, for some, as rebates have declined and have made systems more expensive for consumers.
© 2004-2005 COAST HILLS PARTNERS, INC. WWW.COASTHILLSPARTNERS.COM ALL RIGHTS RESERVED 74
0%
5%
10%
15%
20%
25%
30%
35%
% M
ar
k-u
p f
ro
m
Wh
ol
es
al
e
1 2 3 4 5 6 7 8 9 101112131415161718192021
Respondents
Figure 40: Reported Equipment Mark-Up Rates
Figure 39: Estimated Residential Equipment Charges
$0.00$1.00$2.00$3.00$4.00$5.00$6.00$7.00$8.00$9.00
1 2 3 4 5 6 7 8 9
10
11
12
13
14
15
16
17
18
19
20
21
Respondents
Eq
uip
me
nt
Ch
ar
ge
/W
at
t
(0 =
No
Re
sp
on
se

COAST HILLS PARTNERS
SOLAR ELECTRIC DEALERS 2004: DYNAMIC MARKETS, SIGNIFICANT OPPORTUNITIES, CHALLENGING THREATS
Next, pricing data were analyzed for evidence of economies of scale. In theory, one would expect to see prices decline as system sizes increase, and/or as the size of the dealer increases. These would reflect experience curve effects and/or buying power effects. First, average residential prices (in CEC Watts) were compared to average system sizes, to see if such a relationship exists [Figure 41]:
The downward and to the right trend one would expect to see is absent. Instead, residential prices seem to vary independently from system size, although it is possible that scale effects would not be visible in this small size range (0-8kW). The equipment price component was then analyzed, to determine if there were scale effects in purchasing equipment that were somehow masked when looking at overall prices [Figure 42]. As above, there is not the expected downward trend as size of system increases. In fact, there appears to be a slight upward trend instead.
© 2004-2005 COAST HILLS PARTNERS, INC. WWW.COASTHILLSPARTNERS.COM ALL RIGHTS RESERVED 75
Figure 41: Residential System Size Versus Price per Installed Watt
$0.00
$2.00
$4.00
$6.00
$8.00
$10.00
$12.00
0 2 4 6 8
Average Residential System Size (kW)
$/
Wa
tt
(in
sta
ll
ed
, pr
e-r
eb
ate
)
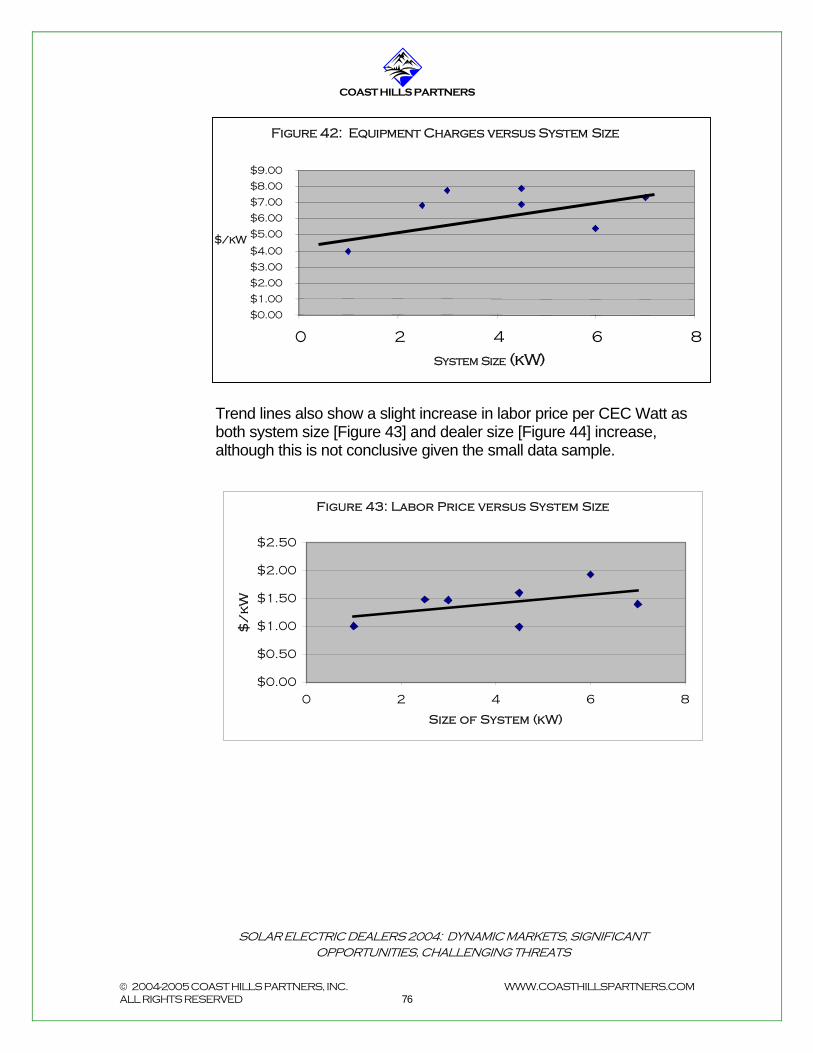
COAST HILLS PARTNERS
SOLAR ELECTRIC DEALERS 2004: DYNAMIC MARKETS, SIGNIFICANT OPPORTUNITIES, CHALLENGING THREATS
Figure 42: Equipment Charges versus System Size
$0.00 $1.00 $2.00 $3.00 $4.00 $5.00 $6.00 $7.00 $8.00 $9.00
0 2 4 6 8
System Size (kW)
$/kW
Trend lines also show a slight increase in labor price per CEC Watt as both system size [Figure 43] and dealer size [Figure 44] increase, although this is not conclusive given the small data sample.
Figure 43: Labor Price versus System Size
$0.00
$0.50
$1.00
$1.50
$2.00
$2.50
0 2 4 6
Size of System (kW)
$/
kW
8
© 2004-2005 COAST HILLS PARTNERS, INC. WWW.COASTHILLSPARTNERS.COM ALL RIGHTS RESERVED 76

COAST HILLS PARTNERS
SOLAR ELECTRIC DEALERS 2004: DYNAMIC MARKETS, SIGNIFICANT OPPORTUNITIES, CHALLENGING THREATS
Figure 44: Residential Labor Charges versus Retailer Size
$0.00
$0.50
$1.00
$1.50
$2.00
$2.50
$0 $5 $10 $15 $20
Retailer Annual Revenue ($MM)
La
bo
r P
ric
e p
er
C
EC
Wa
tt
Lastly, installed system costs were examined as they varied with the size of the installer – in other words, are larger dealers able to charge lower prices due to greater experience effects (they have more jobs over which to gain experience and thus efficiency), and greater buying power? Figure 45 demonstrates that, if those effects exist for larger dealers, those cost reductions are not being passed on to residential customers.
Figure 45: Residential Price per Installed Watt vs. Retailer Size
$0$2$4$6$8
$10$12
$0 $5 $10 $15 $20 $25Reported Annual Company Revenue ($MM)
Co
st
pe
r C
EC
Wa
tt
(i
ns
ta
ll
ed
, p
re
-re
ba
te
)
Since labor is a relatively small component of total installed price, experience benefits in installation may be difficult to see in the data.
© 2004-2005 COAST HILLS PARTNERS, INC. WWW.COASTHILLSPARTNERS.COM ALL RIGHTS RESERVED 77

COAST HILLS PARTNERS
SOLAR ELECTRIC DEALERS 2004: DYNAMIC MARKETS, SIGNIFICANT OPPORTUNITIES, CHALLENGING THREATS
Commercial Pricing Commercial system pricing exhibits similar behavior to residential pricing, although at slightly lower levels. The average price charged commercial clients by respondents was $8.33/Watt, with the median and mode of the sample both at $8.00 [Figure 46], compared to the unadjusted residential average price of $8.56/Watt. Commercial prices in this sample appear to be in the range of $0.40 - $1.00 cheaper per Watt than residential prices. Once again, the data were examined for evidence of scale economies, which one might expect to be more evident given the fact that commercial systems are typically much larger than residential ones.
© 2004-2005 COAST HILLS PARTNERS, INC. WWW.COASTHILLSPARTNERS.COM ALL RIGHTS RESERVED 78
$0.00
$2.00
$4.00
$6.00
$8.00
$10.00
$/
Wa
tt
1 2 3 4 5 6 7 8 9 10 11 12 13 14 15 16 17 18 19 20 21
Respondents
Figure 46A: Reported Commercial Prices per Installed Watt (CEC Watts)

COAST HILLS PARTNERS
SOLAR ELECTRIC DEALERS 2004: DYNAMIC MARKETS, SIGNIFICANT OPPORTUNITIES, CHALLENGING THREATS
$0.00$1.00$2.00$3.00$4.00$5.00$6.00$7.00$8.00$9.00
$/STC Watt
1 2 3 4 5 6 7 8 9 10 11 12 13 14 15 16 17 18 19 20 21
Respondents
Figure 46B: Reported Commercial Prices per Installed Watt (STC Watts)
In addition, while residential customers might not always seek competitive bids, one expects commercial customers would be much more demanding on price, and thus we would expect that if the dealers had savings from scale economies to pass on, they would do so in order to win jobs. If this occurs, we should see this revealed in typical prices charged. Again, price per installed watt was compared to system size [Figure 47] and to dealer size [Figure 48]. Figure 47 shows slight scale economy effects revealed by commercial system pricing. Prices tend to decline as systems sizes increase according to the data, although the effect is far from dramatic.
© 2004-2005 COAST HILLS PARTNERS, INC. WWW.COASTHILLSPARTNERS.COM ALL RIGHTS RESERVED 79
Figure 48 indicates that larger dealers are not apparently charging lower prices in general to commercial customers.

COAST HILLS PARTNERS
SOLAR ELECTRIC DEALERS 2004: DYNAMIC MARKETS, SIGNIFICANT OPPORTUNITIES, CHALLENGING THREATS
Figure 47: Commercial System Price versus Size
$0.00
$2.00
$4.00
$6.00
$8.00
$10.00
$12.00
0 50 100 150 200 250
System Size (kW)
$/
CE
C W
att
ins
tal
le
d
Thus, assuming the data are correct, we may infer that there might not be much in the way of scale effects for dealers in the sample’s size range. There may be an experience effect for labor, as anecdotal comments suggest, and there may also be a small buying power effect as system sizes increase in the larger commercial size ranges.
Figure 48: Commercial System Price per Installed Watt vs. Company Size
$0.00
$2.00
$4.00
$6.00
$8.00
$10.00
$12.00
$0 $5 $10 $15 $20 $25
Reported Annual Company Revenue ($MM)
$ p
er
Co
mm
er
cia
l S
yst
em
C
EC
Wa
tt,
In
st
al
le
d
© 2004-2005 COAST HILLS PARTNERS, INC. WWW.COASTHILLSPARTNERS.COM ALL RIGHTS RESERVED 80

COAST HILLS PARTNERS
SOLAR ELECTRIC DEALERS 2004: DYNAMIC MARKETS, SIGNIFICANT OPPORTUNITIES, CHALLENGING THREATS
Sources of Supply Companies surveyed were asked from where they sourced equipment: distributors, manufacturers, or both. While there may be some definitional confusion regarding distributors for a single manufacturer (i.e., if a distributor only sells equipment from one manufacturer and /or has a close relationship with the manufacturer, is it considered a distributor or part of the manufacturer?), sources of supply appear to be relatively evenly distributed [Figure 49]. A number of respondents noted that they had expanded their sources of supply as the panel shortage has made it more difficult to obtain product. This has included buying different brands of panels, and adding manufacturers and/or distributors to their supplier list. Going direct to manufacturers versus going through distributors does not appear to be related to company size (given the caveat above about manufacturers’ distributors); smaller companies were as likely to claim that they source directly from manufacturers as larger ones. A wide variety of manufacturers were cited in the survey, with a few clear leaders in each equipment category. For panels, most frequently mentioned was Sharp, followed by BP and Kyocera, then by occasional mentions of a few others (Schott, Shell, etc.). For inverters, SMA’s Sunny Boy brand appears to lead among dealers for residential applications, followed by Sharp and a new player, PV Powered. Fronius and Xantrex were mentioned as well, more for commercial uses. Unirac dominated racking, although individual respondents did mention a few smaller players.
© 2004-2005 COAST HILLS PARTNERS, INC. WWW.COASTHILLSPARTNERS.COM ALL RIGHTS RESERVED 81
Figure 49: Percent of Respondents Utilizing Different Sources of Supply
24%
41%
35%Distributors
Manufacturers
Both
COAST HILLS PARTNERS
SOLAR ELECTRIC DEALERS 2004: DYNAMIC MARKETS, SIGNIFICANT OPPORTUNITIES, CHALLENGING THREATS
While many respondents expressed some preference for a particular brand of equipment and a few respondents expressed strong preferences, most emphasized their willingness and ability to obtain almost any brand should the customer have a particular preference for one. While companies were almost all willing to opportunistically source equipment for individual customers, it does appear, based on anecdotal comments by many respondents, that adopting a new piece of equipment as a standard is a time-consuming process. A new product must be certified by the CEC for use, employees must be trained (a time and cost issue), and company personnel must be comfortable with the product’s ratings, interconnectivity and reliability. Finally, many respondents expressed reluctance to proactively offer a product until they have seen a sufficient performance track record in the field. While some companies surveyed were willing to be more aggressive with new products, in general these adoption processes present challenges to manufacturers seeking to break into the market with a new offering.
Revenue Per Employee
© 2004-2005 COAST HILLS PARTNERS, INC. WWW.COASTHILLSPARTNERS.COM ALL RIGHTS RESERVED 82
Respondents were asked to provide the number of employees and the types of contractors utilized at their businesses. The number of employees at each dealer varies from one to 55 and, predictably, varies positively with company revenue [Figure 50]. The most frequently reported number of employees in the sample was 10, with a median of 10 as well and an average of 14.

COAST HILLS PARTNERS
SOLAR ELECTRIC DEALERS 2004: DYNAMIC MARKETS, SIGNIFICANT OPPORTUNITIES, CHALLENGING THREATS
Figure 50: Number of Employees as Retailer Size Varies
$0
$5
$10
$15
$20
$25
0 10 20 30 40 50 60
Number of employees
An
nu
al
Re
ve
nu
e (
$M
M)
Based on this data, employee productivity, in the form of revenue per employee, was analyzed. When examining employees only (excluding contractors), revenue per employee ranged from a low of $133,000 per year to a high of $3.5 million/year, with the greatest number of dealers coming in at $350,000 (the mode of the sample) [Figure 51].
$0
$500,000
$1,000,000
$1,500,000
$2,000,000
$2,500,000
$3,000,000
$3,500,000
Re
ve
nu
e/
Em
pl
oye
e
($/
yea
r)
1 2 3 4 5 6 7 8 9 101112131415161718192021
Respondents
Figure 51: Revenue per Employee
© 2004-2005 COAST HILLS PARTNERS, INC. WWW.COASTHILLSPARTNERS.COM ALL RIGHTS RESERVED 83
A more granular look at most respondents is provided by excluding the three dealers with more than $1 million/year per employee [Figure 52]:

COAST HILLS PARTNERS
SOLAR ELECTRIC DEALERS 2004: DYNAMIC MARKETS, SIGNIFICANT OPPORTUNITIES, CHALLENGING THREATS
$350,000
$133,333
$318,182
$350,000
$375,000$390,625
$267,857
$166,667
$233,333
$350,000
$166,667
$250,000
$300,000
$312,500
$350,000
$238,095
$285,714
$0
$50,000
$100,000
$150,000
$200,000
$250,000
$300,000
$350,000
$400,000
Re
ve
nu
e p
er
Em
pl
oye
e
($/
Ye
ar
)
1 2 3 4 5 6 7 8 9 10 11 12 13 14 15 16 17 18 19 20 21
Respondents
Figure 52: Revenue per Employee, Under $1 Million/Year
Given this degree of variation, we looked to see if there was a relationship between company size and revenue per employee [Figure 53]:
Figure 53: Revenue per Employee as Company Size Varies
-$5
$0
$5
$10
$15
$20
$25
$30
-20 0 20 40 60 80
Number of Employees
An
nu
al
Re
ve
nu
e (
$M
M)
Revenue per Employee
© 2004-2005 COAST HILLS PARTNERS, INC. WWW.COASTHILLSPARTNERS.COM ALL RIGHTS RESERVED 84
In this analysis, it appears that there is a negative relationship between revenue per employee and company size, as the revenue per employee “bubbles” are larger toward the smaller end of the scale. This is not a surprising result, however, when one considers the role of contractors. The presence of contractors, who do the work of employees but are not counted as employees, skews

COAST HILLS PARTNERS
SOLAR ELECTRIC DEALERS 2004: DYNAMIC MARKETS, SIGNIFICANT OPPORTUNITIES, CHALLENGING THREATS
revenue/employee results toward smaller dealers who have fewer employees and probably rely on a higher proportion of contractors to employees than larger companies. Thus it makes sense at this point to evaluate the role of contractors for photovoltaic dealers.
Contractors Contractors play a significant role in the solar electric industry, as a way for dealers to limit semi-fixed costs and to expand capacity quickly and with less risk than with employees. This role varies greatly, however, from dealer to dealer. Six respondents identified the fact that they use no contractors or almost none as a source of competitive advantage. In this line of reasoning, doing all of the work themselves means that they have more control over the quality of work and are more accountable to the customer. On the other end of the spectrum, a number of dealers cited the advantages of contractors for the customer: they enable the dealer to provide the best price, the right specific expertise, faster system delivery, or some combination.
© 2004-2005 COAST HILLS PARTNERS, INC. WWW.COASTHILLSPARTNERS.COM ALL RIGHTS RESERVED 85
Respondents were asked what types, if any, of contractors they used [Figure 54]. This data was then combined with actual input regarding numbers of contractors typically used, or with estimates, to provide a rough employee number adjusted to include contractors. This was then used to analyze revenue per contractor-adjusted employee [Figure 55].

COAST HILLS PARTNERS
SOLAR ELECTRIC DEALERS 2004: DYNAMIC MARKETS, SIGNIFICANT OPPORTUNITIES, CHALLENGING THREATS
0 2 4 6 8
# Responses (multiple Responses allowed)
Installers
Roofers
Electrical
Engineering
Laborers
Temps, non-specified
General Contractors
Architects
Typ
e o
f C
on
tr
ac
to
r
Figure 54: Contractor Types Utilized
Even among those respondents who do use contractors, the degree to which they do varies greatly. Some go outside only for heavy electrical work (2-3 respondents), while others’ business models rely on outsourcing most functions. Now, re-looking at revenue per employee after adjusting for contractors, we see a much more uniform distribution [Figure 55]:
Figure 55: Revenue per Employee, Adjusted for Contractors
-$5$0$5
$10$15$20$25$30
-20 0 20 40 60 80
Annual Revenue ($MM)
# Employees
Revenue per Contractor-Adjusted Employee
Linear (Revenue per Contractor-Adjusted Employee)
© 2004-2005 COAST HILLS PARTNERS, INC. WWW.COASTHILLSPARTNERS.COM ALL RIGHTS RESERVED 86
COAST HILLS PARTNERS
SOLAR ELECTRIC DEALERS 2004: DYNAMIC MARKETS, SIGNIFICANT OPPORTUNITIES, CHALLENGING THREATS
Profitability Most of the survey respondents were reluctant to share information on this sensitive topic. Those who did for the most part were willing only to assert that their companies were indeed “profitable.” Two respondents acknowledged that their companies were at or near break-even, and a few others claimed that they were “quite” or “comfortably” profitable. Two respondents compared the solar electric industry to general contracting, claiming that profitability is comparable or better than in construction. (The construction analogy is reasonable for the majority of dealers that perform installations, which involve construction work). Profitability in the general contracting industry runs at approximately 3%-5% net before taxes (sources include the U.S. Small Business Administration and Jack Guttentag, Professor of Finance Emeritus, Wharton School, http://www.sbaer.uca.edu/Publications/pub00084.txt, and http://loan.yahoo.com/m/living1.html). Thus, it can be suggested (although this is by no means conclusive) that typical net profitability before taxes for solar electric dealers in this sample ranges from around 5% into the upper single percentiles, around 5%-8%.
Summary and Conclusions
Today, the typical dealer in the survey charges slightly lower prices than have been seen in California overall over the last several years. Prices charged by photovoltaic dealers in California have declined somewhat since the beginning of the buy down program in 1998, although that reduction has only been about 5%, according to analysis of the CEC installation database.
© 2004-2005 COAST HILLS PARTNERS, INC. WWW.COASTHILLSPARTNERS.COM ALL RIGHTS RESERVED 87
Scale effects from larger systems or by larger dealers appear limited in the pricing data, or they are not being passed on to residential customers and all but the largest commercial customers. The typical dealer in this survey charges roughly $8.72 - $8.80/CEC Watt ($7.27 – $7.33/STC Watt) for residential installations, and $8.00 - $8.29/CEC Watt ($6.67 - $6.91/STC Watt) for commercial ones. This dealer

COAST HILLS PARTNERS
SOLAR ELECTRIC DEALERS 2004: DYNAMIC MARKETS, SIGNIFICANT OPPORTUNITIES, CHALLENGING THREATS
sources equipment from a variety of distributors and/or manufacturers, and marks up these products by approximately 20% from wholesale. A typical Bay Area dealer employs around 10 people and utilizes perhaps as many contractor personnel, mostly in electrical, installation, and roofing, either to expand capacity or to furnish expertise not contained in-house. Revenue per employee (not adjusted for contractors) is in the range of $350,000/year. Based on survey input, profitability for photovoltaic dealers is inferred to be comparable or somewhat better than for general contracting, suggesting net profits before tax in the range of 5% to less than 10% per year. Further research in these areas would be useful to focus both on equipment and labor costs in more detail, and on the ability of dealers to realize greater economies of scale. The ability to achieve scale economies will become increasingly important as the market matures further and competition intensifies. These lower costs at higher levels of operation will improve both profitability and a company’s flexibility to respond to market threats by reducing price, pursuing previously unprofitable segments, or completing other strategic maneuvers. A few competitors in the Greater Bay Area are starting to reach revenue levels, around $20 million, that suggest this objective may be attainable. One strategy being employed is increasing focus on the commercial side of the business, where the larger deal size leverages sales and other resources. For smaller players, cooperative buying approaches are one way to increase market power and leverage. Alternatively, developing strong positions in niche segments is a means of insulating against price pressure in the overall market.
© 2004-2005 COAST HILLS PARTNERS, INC. WWW.COASTHILLSPARTNERS.COM ALL RIGHTS RESERVED 88
As noted previously, photovoltaic economics are not yet to the point where the solar electric market is self-sustainable without purchase incentives. Estimates on the magnitude of cost reductions needed are in the dollars-per-Watt range. While the majority of this gap must be closed in manufacturing, every percentage decrease in distribution costs, including dealers’ costs, is an important contribution toward this goal.

COAST HILLS PARTNERS
SOLAR ELECTRIC DEALERS 2004: DYNAMIC MARKETS, SIGNIFICANT OPPORTUNITIES, CHALLENGING THREATS
IX. Marketing
Strategies & Tactics
The marketing function was singled out for examination amongst solar electric dealers due to the competitive dynamics of the marketplace. There are a large number of competitors vying for the same types of business with essentially interchangeable products that most players can obtain. Thus, marketing strategies and tactics become crucial for differentiating individual players in this environment.
Marketing Methods Utilized Surveyed companies utilize a wide variety of marketing methods, almost all of them traditional in nature [Figure 56]. Several types are common to most respondents, while a smaller number of companies, due to their particular marketing strategy, favor others. Of these methods, Web-based advertising is universally used by the sample. This typically involves listing oneself as a solar dealer in various industry- or geography-specific, Web-based databases. Several respondents noted that they felt they could obtain a sufficient amount of coverage by concentrating on listings that were free.
© 2004-2005 COAST HILLS PARTNERS, INC. WWW.COASTHILLSPARTNERS.COM ALL RIGHTS RESERVED 89
Use of customer references and having a company Web site were the next most frequently employed marketing tools, references being just about essential in this business. Most companies have also made the judgment that deploying a Web site (containing, among other information, customer references) is worth the investment. These Web sites are employed for marketing only; e-commerce (sales) is not done

COAST HILLS PARTNERS
SOLAR ELECTRIC DEALERS 2004: DYNAMIC MARKETS, SIGNIFICANT OPPORTUNITIES, CHALLENGING THREATS
from these sites. Three other respondents do conduct e-commerce from their Web sites, but for most, this distribution strategy does not work with their direct sales-based business models.
0 5 10 15 20 25
# of Responses
Customer referralsCustomer references
Web site - marketingWeb site - e-commerce
Web-based advertisingYellow pages
Newspaper adsMagazine ads
Radio adsOther advertising
CollateralPR
Community events/Trade showsIndustry or "green" events
Direct mailTelemarketing
Surveys/Market researchPartners/Business Alliances
Subcontracts/Distributor referralsS.F."Generation Solar" referrals
OtherDecline to state
Figure 56: Marketing Methods Utilized
Customer referrals or “word of mouth” were cited by a significant number of respondents and are highly valued as sources of new business (see below). This “inbound” marketing tool is a critical means of gaining market traction and must be cultivated with existing customers, just as references must be (often with the same customers). In contrast, Yellow Page listings are employed almost as often as referrals, but respondents had varying opinions of their effectiveness. Most Yellow Pages advertising involves both print and online (“SBC Smart Yellow Pages”), and many companies purchase listings in multiple Bay Area books.
© 2004-2005 COAST HILLS PARTNERS, INC. WWW.COASTHILLSPARTNERS.COM ALL RIGHTS RESERVED 90
Some respondents regard at least some Yellow Page advertising level as essential, while others do not find it cost-effective at all. More than one respondent noted they were planning to reduce the amount of Yellow Page paper advertising they do because these ads are not a sufficient source of inquiries. Some of this may be due to the particular

COAST HILLS PARTNERS
SOLAR ELECTRIC DEALERS 2004: DYNAMIC MARKETS, SIGNIFICANT OPPORTUNITIES, CHALLENGING THREATS
demographics of the Bay Area, or of the target customers for solar, in that many seek out solar dealers online. Community events, trade shows and industry and/or “Green” events are the next most employed methods of outbound marketing. Participation typically involves companies setting up booths at the event or show and seeking to generate leads from potential customers there. A few companies bolster this presence by providing speakers for talks and panels at the event, if possible. Of these, Home & Garden shows, Solar Home Tours, as well as Builders’ shows were identified most frequently. Respondents held differing opinions on industry events, either finding them useful or viewing them primarily as “talking to the competition instead of customers.” Likewise, green events were either viewed well or as not attracting the right financial demographic. One trade-off mentioned by several respondents is the cost and time required to participate at shows and events, versus the time that could be spent in the field and money that could be spent elsewhere. Booths are costly (figures around $2000 for a “standard”-type booth were cited by a number of respondents), and they require personnel all day, typically, for the entire event. For some smaller dealers, participating in more than a few events per year is simply not feasible. Finally, a number of dealers utilize some form of direct mail, ranging from periodic newsletters to mailings targeted at specific prospects. A few others reported that they had conducted a direct mail campaign of some type in the past, but did not find it cost-effective. Table 5 summarizes these results (percentages total more than 100% because respondents reported using multiple marketing methods).
Table 5: Most Used Marketing Tools, by Percent of Respondents
Web-based advertising 100%
Customer references 86%
Web site (marketing only) 86%
Customer referrals 67%
Yellow Pages 67%
Community events & trade shows 62%
Industry or “Green” events 52%
Direct mail
© 2004-2005 COAST HILLS PARTNERS, INC. WWW.COASTHILLSPARTNERS.COM ALL RIGHTS RESERVED 91
52%
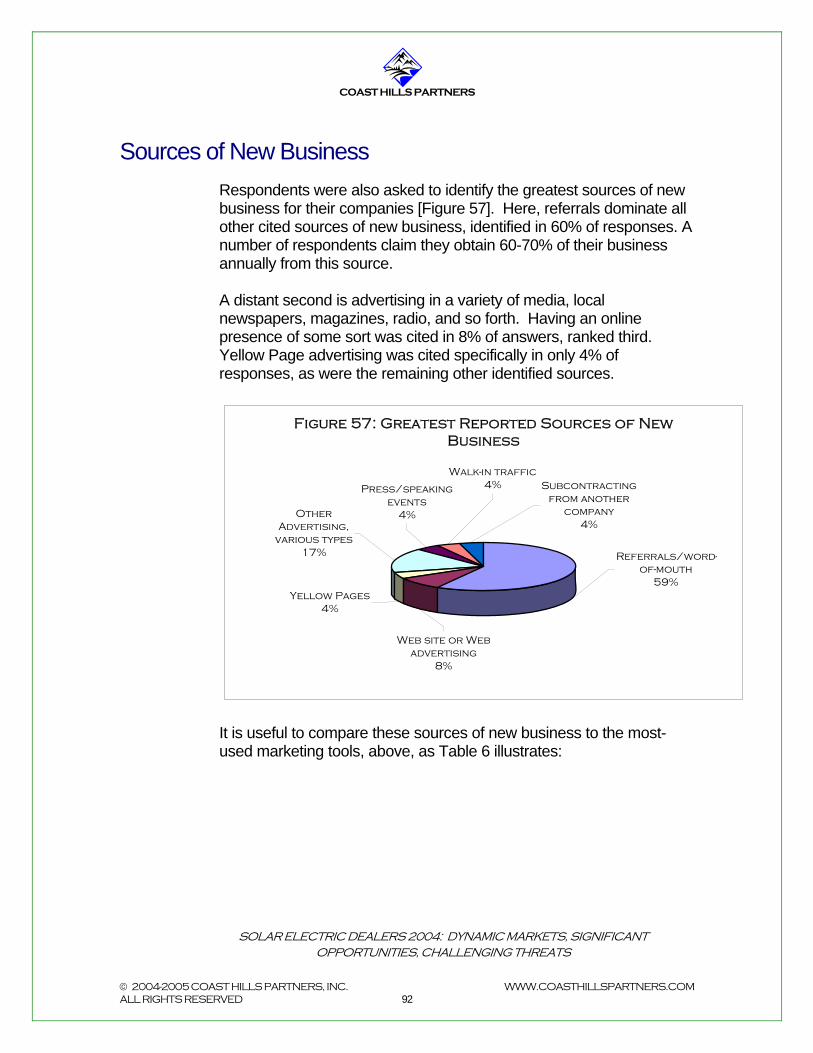
COAST HILLS PARTNERS
SOLAR ELECTRIC DEALERS 2004: DYNAMIC MARKETS, SIGNIFICANT OPPORTUNITIES, CHALLENGING THREATS
Sources of New Business Respondents were also asked to identify the greatest sources of new business for their companies [Figure 57]. Here, referrals dominate all other cited sources of new business, identified in 60% of responses. A number of respondents claim they obtain 60-70% of their business annually from this source. A distant second is advertising in a variety of media, local newspapers, magazines, radio, and so forth. Having an online presence of some sort was cited in 8% of answers, ranked third. Yellow Page advertising was cited specifically in only 4% of responses, as were the remaining other identified sources.
Figure 57: Greatest Reported Sources of New Business
Press/speaking events
4%
Walk-in traffic4%
Other Advertising,
various types17%
Web site or Web advertising
8%
Yellow Pages4%
Referrals/word-of-mouth
59%
Subcontracting from another
company4%
It is useful to compare these sources of new business to the most-used marketing tools, above, as Table 6 illustrates:
© 2004-2005 COAST HILLS PARTNERS, INC. WWW.COASTHILLSPARTNERS.COM ALL RIGHTS RESERVED 92

COAST HILLS PARTNERS
SOLAR ELECTRIC DEALERS 2004: DYNAMIC MARKETS, SIGNIFICANT OPPORTUNITIES, CHALLENGING THREATS
Table 6: Relative Importance of Top Marketing Tools in Generating New Business
Most Used Marketing Tools % of Companies
Using
New Business
Ranking
Web-based advertising 100% 3
Customer references 86% No ranking
Web site (marketing only) 86% 3
Customer referrals 67% 1
Yellow Pages 67% 4
Community events & trade shows
62% No ranking
Industry or “Green” events 52% No ranking
Direct mail 52% No ranking
Customer referrals are the top source of new business, and Web-based marketing is ranked third. However, advertising in other sources, such as local newspapers, ranked second as a source of new business, does not appear on the “most used tools” list. Similarly, there is no “source of new business” ranking for either events or direct mail, two marketing methods used by a large percentage of companies. There is no ranking for customer references, either, but this is perhaps explained by the fact that references are more used as a tool to help close sales, rather than as a tool to generate prospects and leads. In addition, given that they are almost required of every dealer and not having them could result in lost sales, having them in itself does not generate new business.
© 2004-2005 COAST HILLS PARTNERS, INC. WWW.COASTHILLSPARTNERS.COM ALL RIGHTS RESERVED 93
The lack of recognition for shows and events as business generators raises some interesting possibilities. Assuming the sample data are correct, it could be that the dealers participate at shows in order to build brand awareness, hoping to generate interest at these events, which will later come through as leads from other sources. Another reason could be to gain competitive intelligence, although this plus equipment training and speaking opportunities usually can be accomplished at an event without going to the expense of obtaining a booth.

COAST HILLS PARTNERS
SOLAR ELECTRIC DEALERS 2004: DYNAMIC MARKETS, SIGNIFICANT OPPORTUNITIES, CHALLENGING THREATS
In either case, unless they can show a clear return on investment, it may be that dealers that spend a large proportion of their marketing budgets on shows may want to re-think how some of those dollars are spent.
Marketing Personnel The number of personnel allocated to marketing activities varied a great deal amongst respondents, with several surveyed companies allocating 5% or 10% of a full-time equivalent (FTE) employee (i.e., 5-10% of one full-time employee’s time). At the high end, another dealer devotes three full-time personnel to marketing [Figure 58]. The average amount of personnel allocated to marketing is 71% of a full-time employee. The median allocation is 1.0 FTE. The sample shows a bi-modal distribution, in that the most frequently cited personnel allocations were 10% and 1.0 FTE. Thus there is an even distribution between the number of dealers devoting very little to marketing (10%) and those willing to dedicate one person (or designate a significant percentage of a few employees’ time) to marketing activities.
© 2004-2005 COAST HILLS PARTNERS, INC. WWW.COASTHILLSPARTNERS.COM ALL RIGHTS RESERVED 94
0.0
0.5
1.0
1.5
2.0
2.5
3.0
Fu
ll
-Tim
e E
qu
iva
le
nt
P
er
so
nn
el
1 2 3 4 5 6 7 8 9 10 11 12 13 14 15 16 17 18 19 20 21
Survey Respondents(0 = No Response)
Figure 58: Marketing Personnel per Respondent

COAST HILLS PARTNERS
SOLAR ELECTRIC DEALERS 2004: DYNAMIC MARKETS, SIGNIFICANT OPPORTUNITIES, CHALLENGING THREATS
Next, we looked at number of marketing personnel compared to company revenue, to test the hypothesis that larger dealers have a greater number of people devoted to marketing work [Figure 59]:
Figure 59: Number of Marketing personnel versus revenue
$0
$2
$4
$6
$8
$10
$12
$14
$16
$18
$20
0.0 0.5 1.0 1.5 2.0 2.5 3.0 3.5
Marketing Full-Time Equivalents
An
nu
al
re
ve
nu
e (
$M
M)
There is a generally positive trend line, although it is not conclusive. There are a significant number of distant outliers, which indicate different marketing strategies at work and/or differing degrees of effectiveness for various marketing approaches. In addition, the data do not indicate causality: It is not clear that more personnel allocated to marketing leads to greater revenue production, or if larger company size increases the likelihood that more personnel will be assigned to marketing.
Marketing Expenditures
© 2004-2005 COAST HILLS PARTNERS, INC. WWW.COASTHILLSPARTNERS.COM ALL RIGHTS RESERVED 95
Some respondents were able to provide the approximate amounts of their monthly or annual marketing expenditures; amounts for others were estimated using unit costs for activities derived from a variety of interviews. Amounts spent on marketing varied from a low of around $3,600/year to a high of $96,000/year [Figure 60]. This data excludes one very high outlier, a global player whose marketing budget is estimated to be in the millions of dollars per year for its solar and other

COAST HILLS PARTNERS
SOLAR ELECTRIC DEALERS 2004: DYNAMIC MARKETS, SIGNIFICANT OPPORTUNITIES, CHALLENGING THREATS
products. A more specific estimate for its solar business alone could not be made. Average annual marketing expenditure for the group is approximately $26,000, a value that is pulled upward by two high data points. The median, $24,000 and mode, $18,000, indicate perhaps a more representative value of $20,000 as typical for the group. The expenditures discussed here reflect cash costs only, and do not include the costs of employee or contractor time.
$0$10,000$20,000$30,000$40,000$50,000$60,000$70,000$80,000$90,000
$100,000
An
nu
al
Ma
rk
et
ing
E
xp
en
dit
ur
es
($
)
1 2 3 4 5 6 7 8 9 101112131415161718192021
Respondents
Figure 60: Estimated Annual Marketing Expenditures
© 2004-2005 COAST HILLS PARTNERS, INC. WWW.COASTHILLSPARTNERS.COM ALL RIGHTS RESERVED 96
Thus, full costs for some of the marketing activities cited by respondents may be understated (for example, trade show costs do not reflect the very real cost of employees being pulled out of the field).
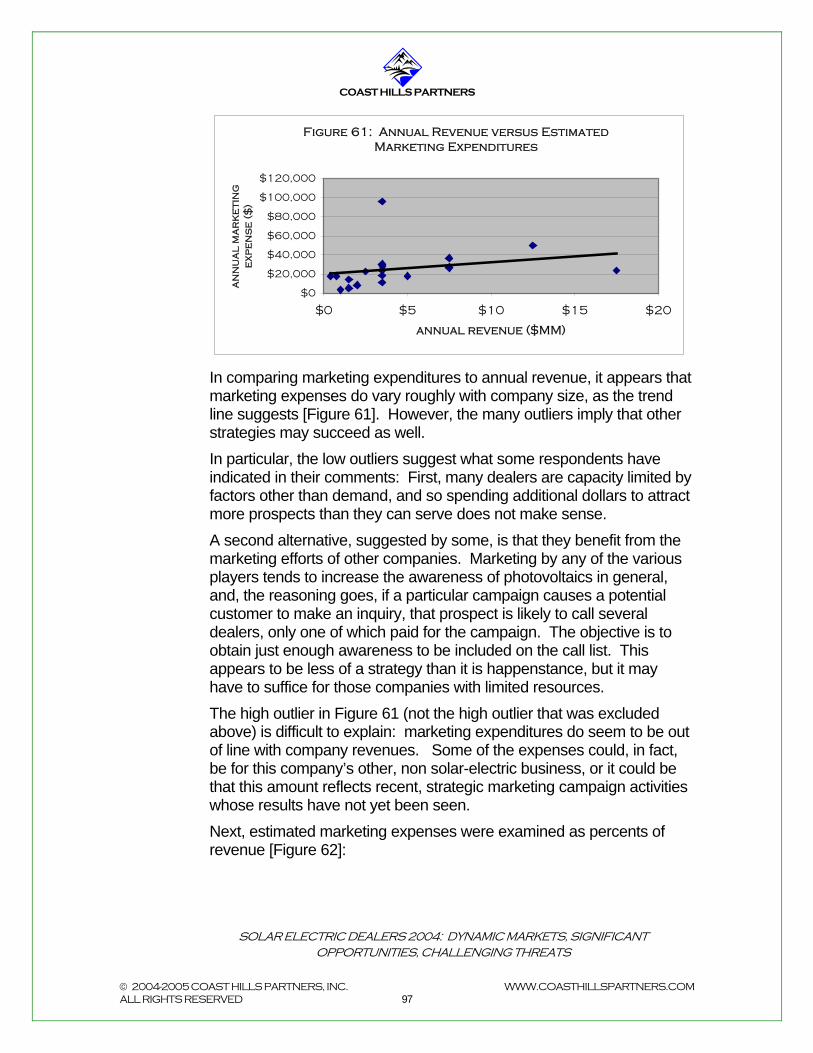
COAST HILLS PARTNERS
SOLAR ELECTRIC DEALERS 2004: DYNAMIC MARKETS, SIGNIFICANT OPPORTUNITIES, CHALLENGING THREATS
Figure 61: Annual Revenue versus Estimated Marketing Expenditures
$0
$20,000
$40,000
$60,000
$80,000
$100,000
$120,000
$0 $5 $10 $15 $20
annual revenue ($MM)
an
nu
al
ma
rk
et
ing
e
xp
en
se
($
)
In comparing marketing expenditures to annual revenue, it appears that marketing expenses do vary roughly with company size, as the trend line suggests [Figure 61]. However, the many outliers imply that other strategies may succeed as well. In particular, the low outliers suggest what some respondents have indicated in their comments: First, many dealers are capacity limited by factors other than demand, and so spending additional dollars to attract more prospects than they can serve does not make sense. A second alternative, suggested by some, is that they benefit from the marketing efforts of other companies. Marketing by any of the various players tends to increase the awareness of photovoltaics in general, and, the reasoning goes, if a particular campaign causes a potential customer to make an inquiry, that prospect is likely to call several dealers, only one of which paid for the campaign. The objective is to obtain just enough awareness to be included on the call list. This appears to be less of a strategy than it is happenstance, but it may have to suffice for those companies with limited resources. The high outlier in Figure 61 (not the high outlier that was excluded above) is difficult to explain: marketing expenditures do seem to be out of line with company revenues. Some of the expenses could, in fact, be for this company’s other, non solar-electric business, or it could be that this amount reflects recent, strategic marketing campaign activities whose results have not yet been seen.
© 2004-2005 COAST HILLS PARTNERS, INC. WWW.COASTHILLSPARTNERS.COM ALL RIGHTS RESERVED 97
Next, estimated marketing expenses were examined as percents of revenue [Figure 62]:
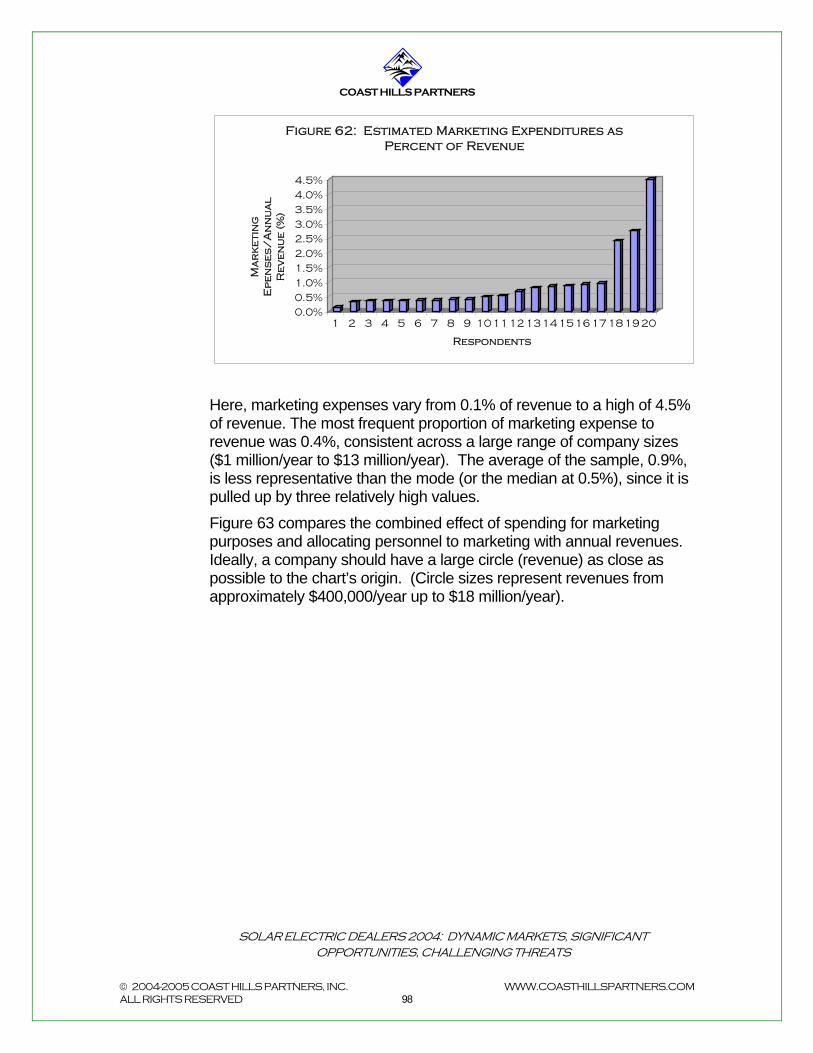
COAST HILLS PARTNERS
SOLAR ELECTRIC DEALERS 2004: DYNAMIC MARKETS, SIGNIFICANT OPPORTUNITIES, CHALLENGING THREATS
0.0%0.5%1.0%1.5%2.0%2.5%3.0%3.5%4.0%4.5%
Ma
rk
et
ing
E
pe
ns
es
/A
nn
ua
l
Re
ve
nu
e (
%)
1 2 3 4 5 6 7 8 9 1011121314151617181920
Respondents
Figure 62: Estimated Marketing Expenditures as Percent of Revenue
Here, marketing expenses vary from 0.1% of revenue to a high of 4.5% of revenue. The most frequent proportion of marketing expense to revenue was 0.4%, consistent across a large range of company sizes ($1 million/year to $13 million/year). The average of the sample, 0.9%, is less representative than the mode (or the median at 0.5%), since it is pulled up by three relatively high values.
© 2004-2005 COAST HILLS PARTNERS, INC. WWW.COASTHILLSPARTNERS.COM ALL RIGHTS RESERVED 98
Figure 63 compares the combined effect of spending for marketing purposes and allocating personnel to marketing with annual revenues. Ideally, a company should have a large circle (revenue) as close as possible to the chart’s origin. (Circle sizes represent revenues from approximately $400,000/year up to $18 million/year).

COAST HILLS PARTNERS
SOLAR ELECTRIC DEALERS 2004: DYNAMIC MARKETS, SIGNIFICANT OPPORTUNITIES, CHALLENGING THREATS
Figure 63: Revenue as Influenced by Marketing Budgets & Personnel
-$20,000
$0
$20,000
$40,000
$60,000
$80,000
$100,000
$120,000
-1.0 0.0 1.0 2.0 3.0 4.0
Marketing Personnel (Full-Time Equivalents)
Ma
rk
et
ing
E
xp
en
dit
ur
es
($
/Y
ea
r)
Circle Size = Annual Revenue
The data indicate that revenue does not necessarily increase with increased resources devoted to marketing. This could be due, first to how productively those resources are employed; and second, capacity constraints may limit how much business can actually be generated from even productive marketing activities. Some dealers appear to have found a “sweet spot” at 1.0 full-time equivalent marketing personnel and between $20K and $50K in marketing expenses per year, achieving the largest revenue levels at this level of marketing resources. It may be that this level is the most efficient for companies in this broad size range; although it may also be that these dealers are successful more due to the effectiveness of specific strategies employed than the amount of resources allocated. The marketing activities conducted by these companies do not differ significantly from those reported by others; thus further research is required to determine the true success factors at work.
Summary and Conclusions
© 2004-2005 COAST HILLS PARTNERS, INC. WWW.COASTHILLSPARTNERS.COM ALL RIGHTS RESERVED 99
The typical solar dealer in this sample employs less than one full-time person for marketing, but utilizes a variety of marketing tools. These tools include Web-based advertising and a Web site, customer references and referrals, trade shows and industry events, Yellow Page advertisements and some direct mail. Interestingly, the tools most used do not necessarily map to those that bring in the most new

COAST HILLS PARTNERS
SOLAR ELECTRIC DEALERS 2004: DYNAMIC MARKETS, SIGNIFICANT OPPORTUNITIES, CHALLENGING THREATS
business. Typical annual marketing expenses are in the $18,000 - $26,000 range, plus approximately 70% of one person’s time. This type of marketing approach will suffice in the future if demand outpaces dealers’ ability to supply photovoltaic systems. As panel shortages ease and/or as competition increases, cost-effective, differentiating marketing strategies become critical. With limited resources available for marketing efforts, it is essential that solar electric dealers look critically at the performance of the marketing tools they select. Tracking leads generated from individual sources through close of the sale -- and associating specific revenues and expenses with them – can enable dealers to compare returns on investment for the different methods used, and thereby fine-tune marketing efforts for the best results. In addition, as competition grows, marketing becomes increasingly about brand building, differentiation, and strategic positioning as well as about sales promotion. Rather than using a series of separate marketing tools for individual lead generation efforts, dealers will need an overall marketing plan tied to a specific set of strategic goals in order to be successful. Further research by individual players is warranted to improve their return on marketing resource investment.
© 2004-2005 COAST HILLS PARTNERS, INC. WWW.COASTHILLSPARTNERS.COM ALL RIGHTS RESERVED 100

COAST HILLS PARTNERS
SOLAR ELECTRIC DEALERS 2004: DYNAMIC MARKETS, SIGNIFICANT OPPORTUNITIES, CHALLENGING THREATS
X. Company
Motivations
In one of the final survey questions, respondents were asked to identify the rationale for their companies entering the photovoltaic marketplace. These motivations are illustrated in Figure 64:
Figure 64: Rationale for Entering Solar Business
0 1 2 3 4 5 6 7 8 9 10 11 12
No response
Desire to create alternative to PG&E
Enthusiasm for solar technology
Desire to help reduce foreign oildependence
Good business opportunity
Desire to help environment
Number of Responses
© 2004-2005 COAST HILLS PARTNERS, INC. WWW.COASTHILLSPARTNERS.COM ALL RIGHTS RESERVED 101
Respondents could provide multiple responses. The most frequent dual answer was pairing “Good business opportunity” (an expected motivation) with one other. Of all motivations, the desire to contribute positively to the environment was cited most often (33% of responses), followed by good business opportunity (27%). The desires to either help reduce dependence on foreign oil or to create an alternative to PG&E reflect the desires of many individuals to make a
COAST HILLS PARTNERS
SOLAR ELECTRIC DEALERS 2004: DYNAMIC MARKETS, SIGNIFICANT OPPORTUNITIES, CHALLENGING THREATS
difference in what is perceived to be a dysfunctional energy system in the U.S. 12% of responses pinpointed enthusiasm for solar technology itself as a reason for being in the business. This could reflect a love of the technology purely for the technology’s sake or it could also reflect some of the technology’s environmental benefits as well. Of all responses, desire to accomplish an altruistic goal was cited 54% of the time. The desire to capitalize on a good financial opportunity was cited half as often. This prompts the speculation that solar business owners and management are motivated somewhat differently than many others in different business sectors. Verifying this would require sampling representatives from other industries about their respective motivations. Nevertheless, the desire to make a positive difference along the variety of dimensions cited here was evident among many survey respondents. This phenomenon perhaps has helped to create a common sense of purpose among many players in the photovoltaic distribution industry, as noted by a number of respondents.
Summary and Conclusions A majority of solar electric dealers appear to have entered this business in order to accomplish some altruistic goal, typically related to the environment or to energy policy. Respondents cited these as the primary business motivation or in as goals in tandem with pursuing an attractive business opportunity.
© 2004-2005 COAST HILLS PARTNERS, INC. WWW.COASTHILLSPARTNERS.COM ALL RIGHTS RESERVED 102
COAST HILLS PARTNERS
SOLAR ELECTRIC DEALERS 2004: DYNAMIC MARKETS, SIGNIFICANT OPPORTUNITIES, CHALLENGING THREATS
XI. Conclusion: Findings &
Recommendations
The photovoltaic market in the Greater Bay Area today, and imminently in the U.S. as a whole, is exciting and dynamic, filled with opportunities and risks. Those players seeking to capitalize on these opportunities can learn from the history of the Greater Bay Area market to-date and the track records that have been created so far. Following are the findings and recommendations of this report:
Findings
Customers are now motivated by more than just the environment. Economics are playing an increasingly important role, broadening the potential customer base. Residential customer motivations now include financial savings and power generation independence as well as environmental concern. Commercial business is also growing rapidly, driven by the positive economic returns available with solar.
© 2004-2005 COAST HILLS PARTNERS, INC. WWW.COASTHILLSPARTNERS.COM ALL RIGHTS RESERVED 103
The Northern California photovoltaic market for 2004 is estimated at $182 million, and at that level represents the fourth largest solar market in the world. The California market as a whole is expected to reach $359 million this year. Cumulative annual revenue growth rates have averaged 135% in the Greater

COAST HILLS PARTNERS
SOLAR ELECTRIC DEALERS 2004: DYNAMIC MARKETS, SIGNIFICANT OPPORTUNITIES, CHALLENGING THREATS
Bay Area since 1998, and although year-to-year growth has slowed in the past two years, the market is still expanding at around 40% annually.
The relative size and age of this market, plus the broadening
customer motivations and types within it, suggest that the Greater Bay Area may serve as a reasonable predictor for the behavior of newer solar electric markets in the U.S.
The factors most immediately promoting ongoing solar
electric market growth are increasing electric rates, growing concern about the costs of the current, fossil fuel-based energy system in the U.S., and broadening public awareness of solar as a viable alternative, coupled with increasing – if inconsistent—government support for renewable energy.
Factors potentially limiting growth include continuing or
additional supply shortfalls, unpredictable government support of purchase incentives, and dealers’ own challenges successfully managing company growth.
Photovoltaic dealers today are typically owner-financed small businesses of around $4 million in sales with approximately ten employees plus contractors. They are primarily focused on the residential market but are increasingly turning toward commercial business. Annual net profitability before tax is likely under 10%.
The competitive dynamics in this industry are challenging, characterized by a densely populated field of dealers, limited information availability, generally interchangeable products, lack of scale, and inadequate differentiation among players. Unless the market continues to expand faster than competitors can meet demand, these conditions point to a likely shakeout in the future.
© 2004-2005 COAST HILLS PARTNERS, INC. WWW.COASTHILLSPARTNERS.COM ALL RIGHTS RESERVED 104
Further research is critical for players who seek to understand and capitalize on the opportunities in this category. Key areas for investigation and development of operational recommendations include: in-depth customer analysis; marketing strategies and tactics; scale economics, resource

COAST HILLS PARTNERS
SOLAR ELECTRIC DEALERS 2004: DYNAMIC MARKETS, SIGNIFICANT OPPORTUNITIES, CHALLENGING THREATS
leverage and cost structure reduction; strategic operations improvements; and analysis of other markets.
Recommendations Strategic
Solar electric dealers must achieve scale and create sustainable, differentiated positioning. Companies must create reasons for doing business with them that are distinct from their competitors’ and must leverage their resources to a point where scale economies – and therefore lower cost structures -- can be achieved in order to remain competitive. Photovoltaic dealers therefore must:
Develop strategic marketing plans that cost-effectively drive sales while building a distinct, defensible brand and positioning. Carefully track and evaluate the returns on investment for alternative marketing approaches and integrate the best ones into a coordinated plan to drive sales growth, build competitive strength and profitability, and facilitate strategic maneuvers. Position the company based upon an accurate and unique source of competitive advantage.
Grow commercial business as a means of leveraging
sales, purchasing, and delivery resources. The larger deals typical of commercial and municipal opportunities can enable dealers to capture greater revenue per amount of sales effort, and likewise can enable lower unit costs through greater purchasing power and experience curve effects.
Reduce costs wherever possible. Lowering product
delivery cost structure is essential to photovoltaics’ economic viability in the absence of incentives. While the majority of the current cost gap must be closed in manufacturing, every percentage decrease in distribution costs, including dealers’ costs, is an important contribution toward this goal. In addition, lower cost structures improve profitability and competitiveness.
© 2004-2005 COAST HILLS PARTNERS, INC. WWW.COASTHILLSPARTNERS.COM ALL RIGHTS RESERVED 105
COAST HILLS PARTNERS
SOLAR ELECTRIC DEALERS 2004: DYNAMIC MARKETS, SIGNIFICANT OPPORTUNITIES, CHALLENGING THREATS
Implement protective strategies, especially smaller players with less opportunity to develop scale. Developing niche segments with specialized market knowledge and clientele can both differentiate individual dealers and insulate against price pressures in the broader market. In addition, players can potentially increase buying power and reduce product costs through cooperative purchasing organizations or similar sourcing mechanisms.
Become and remain active in the political advocacy
surrounding incentive programs. In short, dealers must participate in the political process to insure that their industry needs are met, or else allow other players to determine their destinies.
Policy
Incentive programs have provided an essential catalyst for the photovoltaic market in California. Given where the market stands now and the effects of incentive changes on dealers, the following points are critical to future policy discussions. Government agencies promoting renewable energy sources must:
Ensure that incentive systems remain consistent and predictable. Interruptions in funding or negative, unplanned changes in incentives only serve to undermine growth of the industry the incentives were intended to stimulate.
Take into account global market conditions (e.g.,
unanticipated worldwide supply shortages), as well as slower than anticipated growth in demand, where programs are intended to adjust over time. Positive changes in incentive programs such as these should have a beneficial effect on the industry, so long as the rationale and appropriate future expectations resulting from them are communicated. Alternatively, tie downward adjustments in incentive amounts to total megawattage of installations, or another metric that directly measures industry progress.
© 2004-2005 COAST HILLS PARTNERS, INC. WWW.COASTHILLSPARTNERS.COM ALL RIGHTS RESERVED 106
Account for the fact that many of the industry players are very small businesses for which cash flow and timing are critical

COAST HILLS PARTNERS
SOLAR ELECTRIC DEALERS 2004: DYNAMIC MARKETS, SIGNIFICANT OPPORTUNITIES, CHALLENGING THREATS
issues. Emphasize timely return of rebates and set clear expectations for timeframes.
The photovoltaic market in California is ready to take off, which is what the state’s incentive programs are intended to accomplish. It must not be hindered by uncertainties or interruptions. Allowing these to occur simply reduces the return on the public funds invested, and hinders the achievement of renewable energy policy goals.
Further Research
Additional research in this category will be critical for those players wishing to take leadership positions in the photovoltaic distribution channel. Coast Hills Partners is pursuing further analysis in several important areas. Examples include:
Evaluation and development of effective marketing strategies and tactics
Investigation and creation of strategies to achieve scale
economies or other mechanisms to increase resource leverage in product sourcing and service delivery
Design of operational strategies to improve competitive advantage and reduce costs
© 2004-2005 COAST HILLS PARTNERS, INC. WWW.COASTHILLSPARTNERS.COM ALL RIGHTS RESERVED 107
Analysis of additional state markets to determine market potential, target customer attributes, and entry strategies.

COAST HILLS PARTNERS
SOLAR ELECTRIC DEALERS 2004: DYNAMIC MARKETS, SIGNIFICANT OPPORTUNITIES, CHALLENGING THREATS
XII. Study Methodology
Twenty-one solar electric dealers serving the greater San Francisco Bay Area were surveyed for this study. The sample of potential respondents was drawn from several lists of solar electric system dealers: the California Energy Commission (CEC) list of renewable energy dealers, SolarAccess.com’s company database, SBC Smart Yellow Pages, and San Francisco Peninsula Yellow Pages. The survey was described to potential participants as follows:
“We are currently running a project to better understand the solar electric residential and commercial markets. Solar system dealers will be interviewed for their perspectives on recent market growth and dynamics, how they approach their markets, and what they see as opportunities, risks, and future prospects over the next 1-5 years. To protect all participants, this is a confidential survey; no participating company names will appear in the survey results. In return for their contribution, companies completing the survey will receive a free copy of the results. ”
The surveys were conducted over a six-week period in July and September 2004. All but two of the surveys were completed verbally, either in person or on the phone with a company representative. The remaining two surveys were completed online.
© 2004-2005 COAST HILLS PARTNERS, INC. WWW.COASTHILLSPARTNERS.COM ALL RIGHTS RESERVED 108
As stated, the names of participating companies are not listed as such in order to preserve their confidentiality.

COAST HILLS PARTNERS
SOLAR ELECTRIC DEALERS 2004: DYNAMIC MARKETS, SIGNIFICANT OPPORTUNITIES, CHALLENGING THREATS
Survey respondents typically represented senior company management, as discussed previously. The survey respondent profile is reproduced here:
Table 7: Survey Respondents
Owner/President/CEO 9 43% Sales/Marketing Director 6 29% Sales 4 19% Other
2 10%
TOTAL 21
The majority of survey questions were open-ended (i.e., respondent could answer in any way he/she liked. Other questions were structured as Check One/Check All That Apply, for ease of response. The survey took between 20 and 45 minutes to administer, depending on the time available and the amount of the detail the respondent was able to provide. For a number of questions, individual responses were coded and then aggregated for analysis and presentation. In some graphics, trend lines are indicated. These have been produced using simple linear regression analysis. The survey itself is reproduced below. The survey evolved slightly over the course of the interviews, to eliminate questions that were not yielding useful information and to clarify others.
© 2004-2005 COAST HILLS PARTNERS, INC. WWW.COASTHILLSPARTNERS.COM ALL RIGHTS RESERVED 109
100%

COAST HILLS PARTNERS
SOLAR ELECTRIC DEALERS 2004: DYNAMIC MARKETS, SIGNIFICANT OPPORTUNITIES, CHALLENGING THREATS
Solar Systems Provider Business Survey
Company _______________________ Phone__________ Date___________
Contact ________________________ Title __________________________
1. How long has the company been in business? ___________
What market segments do you serve? (Check all that apply): __ Residential __ Commercial __ Wholesale __ Other__________________
2. What geographic area(s) do you serve? (Check all counties that apply):
__ Amador __ Napa __ Sonoma __ Alpine __ Sacramento __ Sutter __ Alameda __ San Benito __ Stanislaus __ Calaveras __ San Francisco __ Yolo __ Contra Costa __ San Joaquin __ Yuba __ El Dorado __ San Mateo __ Fresno __ Santa Clara __ Other __ Marin __ Santa Cruz county(ies) ______
__ Merced __ Solano ________________ __ Monterey
__ Other states _________________________ __ Other countries ______________________
3. Who are your target customer(s): Key characteristics:
© 2004-2005 COAST HILLS PARTNERS, INC. WWW.COASTHILLSPARTNERS.COM ALL RIGHTS RESERVED 110
4. Business conditions:

COAST HILLS PARTNERS
SOLAR ELECTRIC DEALERS 2004: DYNAMIC MARKETS, SIGNIFICANT OPPORTUNITIES, CHALLENGING THREATS
a. Has business improved/worsened/stayed same over last 24 months?
b. What do you predict for the next 24 months?
c. What market trends are you noticing? d. How is the company planning to handle future growth?
___ Grow as rapidly as possible __ Stay the same __ Grow more slowly/manageably __ Do not know __ Do not expect growth
e. What is your greatest capacity constraint (ability to install, availability of
equipment, etc.) f. How does oil & electricity price volatility affect your business? g. What will likely be the effect on your business if rebates & tax
incentives for renewable energy are phased out? h. What opportunities &/or threats do you see for your business in the
next 5 years?
5. Average sale size ($ & kW) Increasing or not? Y/N
6. Annual revenue range:
__ <$500K __$500k - <$1MM __$1-<2MM __$2-<5MM __$5-10MM __$10-25MM __>$25MM
7. Whom do you regard as your major competitors?
© 2004-2005 COAST HILLS PARTNERS, INC. WWW.COASTHILLSPARTNERS.COM ALL RIGHTS RESERVED 111

COAST HILLS PARTNERS
SOLAR ELECTRIC DEALERS 2004: DYNAMIC MARKETS, SIGNIFICANT OPPORTUNITIES, CHALLENGING THREATS
8. What is your source of competitive advantage/Why are you better?
9. How many customers does company have?
10. How many new customers are typically added per year?
11. What is the greatest source of new business for you (referrals, advertising, etc.)?
12. What other ways does the company market its products and services? (Check all that apply): __ Customer references __ Web site __ Web-based advertising __ Print advertising (Where: __ Yellow Pages __Local newspapers __Other____) __ Other advertising ____________ __ Collateral __ Community events __ Renewable energy industry or “green” events __ Direct mail __ Telemarketing __ Sales cold calls __ Public relations __ Other __________________________________________________________
How much time & money does the company typically spend on marketing per month? Hours:___________________ $: _________________
13. What is the average $/watt that you quote to customers? Residential/Commercial
14. How many employees at the company? ___
If you do not have employees, from where do you source your contractors & how many do you typically use?
© 2004-2005 COAST HILLS PARTNERS, INC. WWW.COASTHILLSPARTNERS.COM ALL RIGHTS RESERVED 112

COAST HILLS PARTNERS
SOLAR ELECTRIC DEALERS 2004: DYNAMIC MARKETS, SIGNIFICANT OPPORTUNITIES, CHALLENGING THREATS
15. What product lines do you distribute (for panels, inverters, & other)?
a. Why did the company choose these?
b. Typical markup to your list price: __%
16. From where do you source your equipment (distributors, manufacturers)?
17. How is company capitalized? (Check all that apply) __ Owner financed __ Small group of private investors __ Loan(s) (__ Bank __SBA __Other_____________) __Venture Capital or other professional private equity __Division of a larger company (__Public or __Private) __Publicly traded company
18. What was/were the reason(s) for starting this business, if you know? (Check
all that apply):
__ Good opportunity; make money __ Desire to help reduce country’s dependence on foreign oil __ Desire to help reduce pollution from fossil fuels __ Other: _______________________________________________ __ Do not know
Thanks for your time!
© 2004-2005 COAST HILLS PARTNERS, INC. WWW.COASTHILLSPARTNERS.COM ALL RIGHTS RESERVED 113

COAST HILLS PARTNERS
SOLAR ELECTRIC DEALERS 2004: DYNAMIC MARKETS, SIGNIFICANT OPPORTUNITIES, CHALLENGING THREATS
XIII. About Coast Hills
Partners
Coast Hills Partners is a market research and investment firm working with renewable, high technologies that improve the environment, enable sustainable economic growth, and advance the quality of life – in short, that create a better world. Activities include market analysis, strategic and operational consulting, business plan development, and active investment.
The study’s author, Meredith McClintock, has performed broad-ranging market research and analysis of the solar industry, including co-authoring The Economics of Solar Energy for California, a white paper written for Governor Schwarzenegger’s office in support of the Governor’s Million Solar Roofs Initiative. Ms. McClintock possesses twenty years of experience in marketing, sales, and business development leadership positions in a variety of technology fields. Prior to Coast Hills Partners, she served as Senior VP, Marketing, and VP, Marketing and Sales, at the business e-commerce start-up Instill Corporation, where she established the company’s positioning and recognized leadership in its industry and closed two of its first three major accounts. Ms. McClintock came to Instill following a series of executive, line management positions at General Electric, where she was responsible for business units of up to $70 million in sales. Earlier, she led Marketing at a materials science and aerospace start-up later acquired by General Dynamics. Ms. McClintock also participated as a core volunteer in the founding of two successful new schools, The Girls’ Middle School and Summit Preparatory High School. She holds an M.B.A. from the Stanford Graduate School of Business and an A.B., magna cum laude and Phi Beta Kappa, from Dartmouth College.
© 2004-2005 COAST HILLS PARTNERS, INC. WWW.COASTHILLSPARTNERS.COM ALL RIGHTS RESERVED 114