Embed Size (px)
Citation preview

Simulating gym capacity based on Unisport Töölö arrival rates
30E00400 Simulation project
Okko Hakola

Introduction
Töölö Unisport is very crowded from time to time There is a lot of randomness and uncertainty
involved
Suitable subject for simulating system capacity and waiting times
The model gets complicated fast

Not all machines are used in this simulation

The Model
Inter-arrival times follow exponential distribution
They are simulated with inverse method
λ is derived from Unisport crowdedness data
changes as hour changes
Arrive Movement 1
Movement 10
Movement 2 ......
Machine optionsPick first one free
Machine optionsPick first one free
Machine options Pick first one free
Waiting
Waiting
Waiting
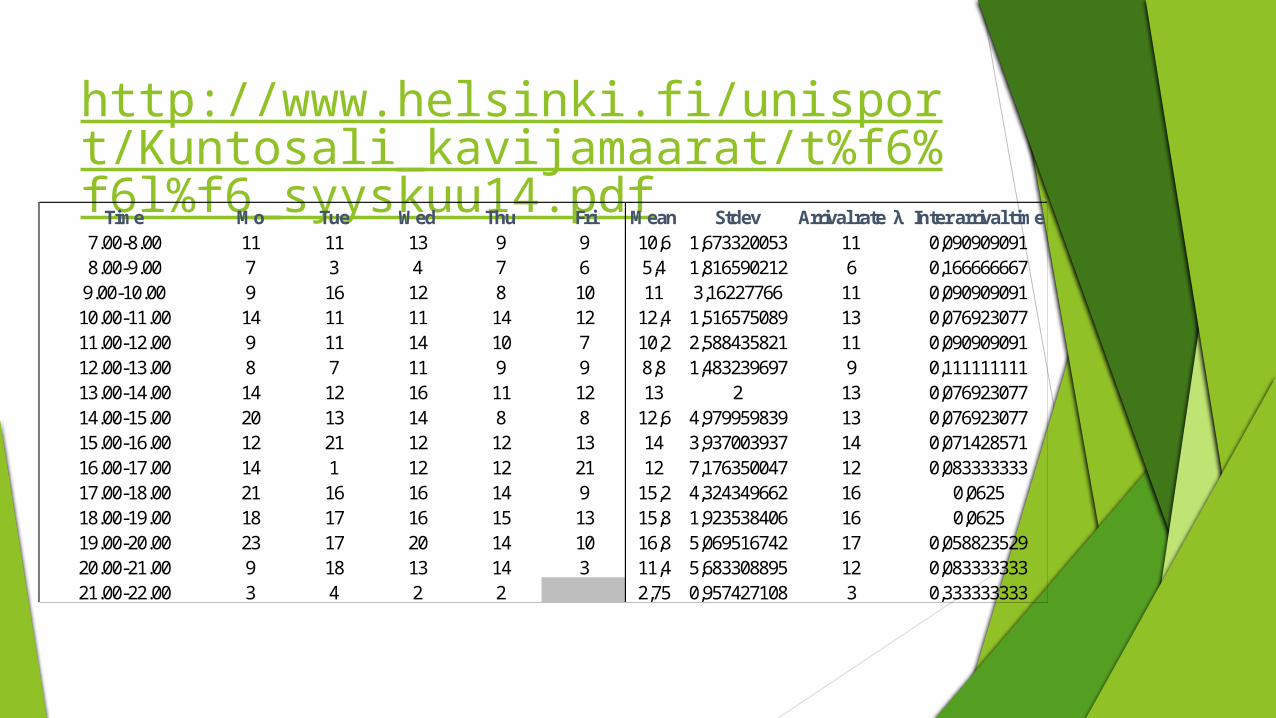
http://www.helsinki.fi/unisport/Kuntosali_kavijamaarat/t%f6%f6l%f6_syyskuu14.pdf
Time Mo Tue Wed Thu Fri Mean Stdev Arrival rate λ Inter arrival time7.00-8.00 11 11 13 9 9 10,6 1,673320053 11 0,0909090918.00-9.00 7 3 4 7 6 5,4 1,816590212 6 0,166666667
9.00-10.00 9 16 12 8 10 11 3,16227766 11 0,09090909110.00-11.00 14 11 11 14 12 12,4 1,516575089 13 0,07692307711.00-12.00 9 11 14 10 7 10,2 2,588435821 11 0,09090909112.00-13.00 8 7 11 9 9 8,8 1,483239697 9 0,11111111113.00-14.00 14 12 16 11 12 13 2 13 0,07692307714.00-15.00 20 13 14 8 8 12,6 4,979959839 13 0,07692307715.00-16.00 12 21 12 12 13 14 3,937003937 14 0,07142857116.00-17.00 14 1 12 12 21 12 7,176350047 12 0,08333333317.00-18.00 21 16 16 14 9 15,2 4,324349662 16 0,062518.00-19.00 18 17 16 15 13 15,8 1,923538406 16 0,062519.00-20.00 23 17 20 14 10 16,8 5,069516742 17 0,05882352920.00-21.00 9 18 13 14 3 11,4 5,683308895 12 0,08333333321.00-22.00 3 4 2 2 2,75 0,957427108 3 0,333333333

Imaginary workout plan
Movement # Whole Body Sets Repetitions Time/repetition Possible machines1 Warmup Whole 1 1 U(1/12,1/3) Cross-trainer 1 Cross-trainer 2 Cross-trainer 3 Treadmill 1 Treadmill 22 Squat 4 U(8,12) U(1/3600,4/3600) Rack 1 Rack 23 Leg press 3 U(8,12) U(1/3600,4/3600) Leg press 1 Leg press 24 Deadlift 4 U(8,12) U(1/3600,4/3600) Barbells 1 Barbells 25 Chinups 3 U(8,12) U(1/3600,4/3600) Chin-up 1 Chin-up 2 Lat pull6 Cable seated row/shoulder push 3 U(8,12) U(1/3600,4/3600) Lower back Shoulders push up7 Bench press 4 U(8,12) U(1/3600,4/3600) Bench press 1 Bench press 28 Bicep curls 4 U(8,12) U(1/3600,4/3600) Bench 1 Bench 2 Bench 39 Cable pushdown 4 U(8,12) U(1/3600,4/3600) Cables 1 Cables 210 Abs 3 U(8,12) U(1/3600,4/3600) Abs 1 Abs 2 Abs 3
Time between sets U(1/60,2/20)

”Service times” for movements
Aerobic movement: U~(5min, 20min)
20 min is the Unisport max
Other movements: U~(1sec, 4sec) per repetition
Repetitions: U~(8,12)
Times between sets: U~(1min, 2min)
Uniforms are used for repetition times, because I assume repetition times vary a lot from person to person
For repetition numbers it was also convenient
Easy to change to normal distribution etc.

Simulation
1. Simulate inter-arrival times
2. Simulate serving times
3. Assign customers to movements and their machines
4. Calculate waiting times
5. Take statistics
6. Repeat average and others using Data-Table
7. Analyze

Count Random number Inter-arrival time (clock dependent) Clock Customer
U0
1 0,213860122 0,021874595 0,021874595 12 0,076785067 0,007263019 0,029137613 23 0,141063724 0,013823686 0,042961299 34 0,791809732 0,142663897 0,185625196 45 0,124160522 0,012052041 0,197677237 56 0,755301686 0,127975382 0,325652619 67 0,228690652 0,023605978 0,349258597 78 0,751227297 0,126474149 0,475732746 89 0,694683421 0,107855098 0,583587843 9
10 0,252516019 0,0264584 0,610046244 1011 0,355398578 0,039920282 0,649966526 1112 0,140766122 0,013792193 0,663758719 1213 0,35897997 0,04042678 0,704185499 1314 0,083770064 0,007953448 0,712138946 1415 0,718186797 0,115137348 0,827276294 1516 0,414159184 0,048609743 0,875886037 16
ݔ ൌ��ൌ�ͳߣ� � ͳൌݑ�
Arrivals and the clock

M1 M2 M3 M4 M5 M6 M7 M8 M9 M10
1 2 3 4 5 6 7 8 9 100,029989777 0,0770951 0,06133366 0,109158 0,073613 0,022371 0,051848 0,068327379 0,060346148 0,1195460,244347934 0,0367107 0,00796867 0,082061 0,046053 0,074788 0,134178 0,015762168 0,121111201 0,0800750,142724326 0,059199 0,02481298 0,04204 0,089312 0,038412 0,089061 0,038808887 0,079443855 0,0713370,013571523 0,1195982 0,02765518 0,10736 0,109697 0,064208 0,141597 0,034988672 0,08560737 0,0969910,190478819 0,0435704 0,03648402 0,106151 0,020305 0,061118 0,101462 0,115126363 0,021336734 0,072390,209284824 0,0526354 0,10633744 0,069674 0,072222 0,091682 0,127928 0,072301592 0,161284426 0,0485740,047615072 0,1025319 0,06380841 0,040493 0,058178 0,088049 0,054817 0,076393119 0,047120976 0,0429540,236091033 0,0789709 0,00494475 0,148444 0,082516 0,072184 0,068096 0,056490396 0,039219776 0,0142110,079635471 0,1222331 0,11155271 0,07798 0,05847 0,051606 0,02732 0,043626728 0,163059948 0,0437990,045201639 0,1389008 0,02404688 0,063069 0,083521 0,042981 0,049036 0,114661239 0,106551808 0,0266620,102925007 0,1338951 0,02937927 0,120258 0,020132 0,112778 0,131637 0,053576304 0,116917556 0,0334950,055844532 0,1387096 0,10749427 0,122575 0,096913 0,056982 0,093383 0,139393232 0,046331876 0,0317630,112378313 0,049691 0,04878447 0,076016 0,105992 0,097687 0,085216 0,157670407 0,121054535 0,1026360,117206952 0,1555321 0,11996196 0,132641 0,023895 0,047648 0,058517 0,116603726 0,127051332 0,1187570,093474215 0,0729606 0,03484523 0,06976 0,099498 0,048886 0,074042 0,042827501 0,014267256 0,0674070,151749687 0,0773996 0,08923596 0,102989 0,033463 0,068493 0,105161 0,133330839 0,110845341 0,079223
Serving times of movements=(sets*(repetitions*time/repetition+time between sets).
”Serving times”
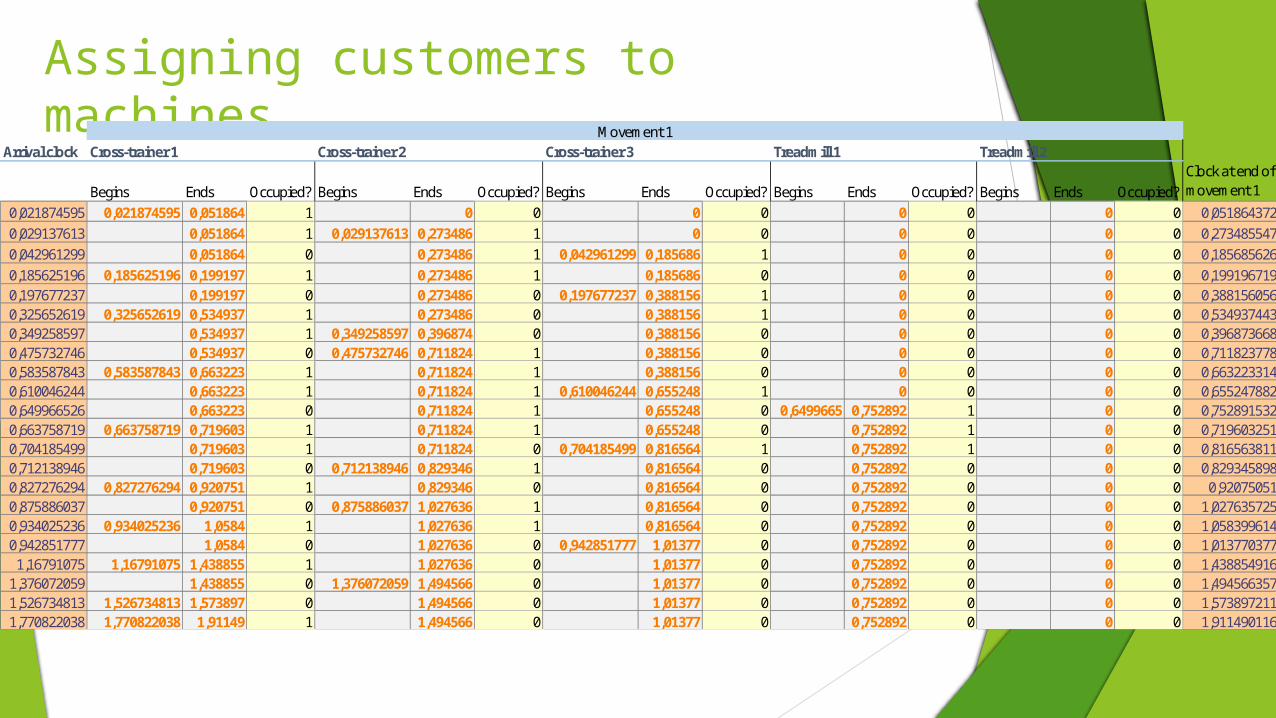
Assigning customers to machines
Arrival clock Cross-trainer 1 Cross-trainer 2 Cross-trainer 3 Treadmill 1 Treadmill 2
Begins Ends Occupied? Begins Ends Occupied? Begins Ends Occupied? Begins Ends Occupied? Begins Ends Occupied?Clock at end of movement 1
0,021874595 0,021874595 0,051864 1 0 0 0 0 0 0 0 0 0,0518643720,029137613 0,051864 1 0,029137613 0,273486 1 0 0 0 0 0 0 0,2734855470,042961299 0,051864 0 0,273486 1 0,042961299 0,185686 1 0 0 0 0 0,1856856260,185625196 0,185625196 0,199197 1 0,273486 1 0,185686 0 0 0 0 0 0,1991967190,197677237 0,199197 0 0,273486 0 0,197677237 0,388156 1 0 0 0 0 0,3881560560,325652619 0,325652619 0,534937 1 0,273486 0 0,388156 1 0 0 0 0 0,5349374430,349258597 0,534937 1 0,349258597 0,396874 0 0,388156 0 0 0 0 0 0,3968736680,475732746 0,534937 0 0,475732746 0,711824 1 0,388156 0 0 0 0 0 0,7118237780,583587843 0,583587843 0,663223 1 0,711824 1 0,388156 0 0 0 0 0 0,6632233140,610046244 0,663223 1 0,711824 1 0,610046244 0,655248 1 0 0 0 0 0,6552478820,649966526 0,663223 0 0,711824 1 0,655248 0 0,6499665 0,752892 1 0 0 0,7528915320,663758719 0,663758719 0,719603 1 0,711824 1 0,655248 0 0,752892 1 0 0 0,7196032510,704185499 0,719603 1 0,711824 0 0,704185499 0,816564 1 0,752892 1 0 0 0,8165638110,712138946 0,719603 0 0,712138946 0,829346 1 0,816564 0 0,752892 0 0 0 0,8293458980,827276294 0,827276294 0,920751 1 0,829346 0 0,816564 0 0,752892 0 0 0 0,920750510,875886037 0,920751 0 0,875886037 1,027636 1 0,816564 0 0,752892 0 0 0 1,0276357250,934025236 0,934025236 1,0584 1 1,027636 1 0,816564 0 0,752892 0 0 0 1,0583996140,942851777 1,0584 0 1,027636 0 0,942851777 1,01377 0 0,752892 0 0 0 1,013770377
1,16791075 1,16791075 1,438855 1 1,027636 0 1,01377 0 0,752892 0 0 0 1,4388549161,376072059 1,438855 0 1,376072059 1,494566 0 1,01377 0 0,752892 0 0 0 1,4945663571,526734813 1,526734813 1,573897 0 1,494566 0 1,01377 0 0,752892 0 0 0 1,5738972111,770822038 1,770822038 1,91149 1 1,494566 0 1,01377 0 0,752892 0 0 0 1,911490116
Movement 1

System statistics from Data Table analysis (n=500)Averages and statistics of the replications in seconds
Whole workout in hours Arriv-M1 M1-M2 M2-M3 M3-M4 M4-M5 M5-M6 M6-M7 M7-M8 M8-M9 M9-M10
TOTAL time
Mean 0,96066401 1,206182 194,6151 27,61721 89,68459 1,521112 34,23245 84,37241 6,35025 96,36117 1,413271 537,3738Stdev 0,041192247 2,191366 71,28229 9,03782 36,76929 1,21792 9,705413 29,29266 3,793051 30,98273 1,211048 141,5925Std error 0,001842173 0,098001 3,187841 0,404184 1,644373 0,054467 0,434039 1,310008 0,16963 1,38559 0,05416 6,332207Min 0,869256609 0 57,50543 8,084163 24,75367 0 13,90527 30,9084 0,437752 39,60995 0 221,9124Max 1,172037206 23,04431 580,3904 77,19827 291,3033 6,335351 70,19339 223,6238 38,11927 258,4095 7,914859 1301,925
2 Squat Rack 1 Rack 24 Deadlift Barbells 1 Barbells 27 Bench press Bench press 1 Bench press 29 Cable pushdown Cables 1 Cables 2

Adding machines to bottleneck movements
Averages and statistics of the replications in secondsWhole workout in hours Arriv-M1 M1-M2
TOTAL time
Mean 0,881496356 1,018278 38,231 255,3116Stdev 0,021476988 1,694854 17,492 64,97161Std error 0,00096048 0,075796 0,7822 2,905619Min 0,827679181 0 3,9458 83,45129Max 0,97422678 18,29542 123,45 584,5118

Peak hours

Sensitivity of inter-arrival rates (Lambdas and waiting)


Assumptions and limitations
Most important assumptions and limitations: 1 person at a time in a movement and no ”in between” Serving times are overly simplified Arrival rates are only from 1 month Only machines which I decided are used in the workout(most common at
Unisport) 1 workout for everyone and strict order No people in after 21.30 People are allowed to finish their workouts
In order to simulate you must simplify and assign rules and assumptions in a way that still represents the system well enough
Conclusion and recommendations for future
Simulating a gym gets complicated really fast
The model gives an idea how much one has to wait between movements to the most popular machines
Recommendations: Unisport should add space and machines to increase capacity
Future simulations:
All machines
Different workouts
Better serving times