Embed Size (px)
Citation preview

I N D I A – R E P O R T2014
IIAR - NASHVILLE
PRESENTATION BYSAMIR SHAH – RVC – INDIA / SOUTH ASIA.

India is expected to be the 4th largest economy and will continue to be the 2nd largest population in the world by 2025
18%
US
Russia
359 mn
1.45 bn
EU – 27
India
China
132 mn
Brazil
1.43 bn
469 mn
213 mn
2%
3%
6%
World Population by 2025 – 8,000 mn
Total population
Region’s population as a % of total world’s population
Sources: United Nations population studies (Medium variant prospects); Goldman Sachs Economic Research (GDP estimates); International Monetary Fund; Reed Analysis
4%
18%
Top 10 GDP Countries by 2025

GEN


In developing countries more than 40% of the food losses occur at post harvest and processing levels, while in industrialized countries, more than 40% of the food losses occur at retail and consumer levels. Food waste at consumer level in industrialized countries (222 million ton) is almost as high as the total net food production in sub Saharan Africa (230 million ton).

INDIA STATISTICS

INDIA STATISTICS: WHEAT EXPORTS

INDIA STATISTICS: MEAT EXPORTS


PHM-Cold Store Integration(Value Chain)
Most of the cold stores are stand alone units (84%), only 16% being part of a network (value chain). Transport services were not provided by 80% of the cold storage units. Of the 20% that provided transportation, 52% had an outsourced asset base.

ORGANIZATIONS / ASSOCIATIONS INVOLVED IN FOOD PROCESSING INDUSTRY.
MOFPI MINISTRY OF FOOD PROCESSING
NCCD NATIONAL CENTER OF COLD CHAIN DEVELOPMENT
APEDA AGRICULTURAL & PROCESSED PRODUCT EXPORT DEVELOPMENT AUTHORITY.
MPEDA MARINE PRODUCT EXPORT DEVELOPMENT AUTHORITY.
NDDB NATIONAL DAIRY DEVELOPMENT BOARD.
FOCS FEDERATION OF COLD STORES.
NHB NATIONAL HORTICULTURE BOARD.
NMFP NATIONAL MISSION ON FOOD PROCESSING.

INDIA 12TH - 5 YEAR PLAN

INDIA 12TH - 5 YEAR PLAN ( 2012 – 2017 )

SCHEMES PURPOSE INVESTMENT PROMOTION
MEGA FOOD PARKS STRONG FOOD PROCESSING INDUSTRY WITH EFFICIENT SUPPLY CHAIN INCLUDING COLLECTION CENTERS , PPC, CPC, COLD CHAIN INFRASTRUCTURE, EACH MFP WILL HAVE APPROX 30/35 FP UNITS & EMPLOYS APPROX 30000 PEOPLE.
APPROX 42 MILLION USD
SUBSIDY OF 50% OF PROJECT COST
EXCLUDING LAND. ( MAX OF USD 8.3 MILL)
COLD CHAIN COLD CHAIN FACILITY FOR AGRI PRODUCE, FISH , MEAT, LINKAGE FROM FARM TO CONSUMER. ( COLD STORES/ CA STORES/ IQF)
APPROX COST 4 MILL USD
SUBSIDY OF 50% OF PLANT & MACHINERY COST A MAX OF USD 1.6 MILL)
MORDERIZATION OF ABATTOIRS
MORDERIZATION OF SLAUGHTER HOUSES A MUST FOR MEAT PLANT.
VARIABLE BASED ON SIZE
MAX SUBSIDY OF USD 2.5 MILL.
R&D , CODEX , PROMOTIONAL ACTIVITIES.
UNIVERSITY:100% SUPSIDY ON COST OF LAB EQUI & 25% OF CIVIL WORK.PRIVATE SECTOR 50% COST OF LAB EQUIP & 25% COST OF CIVIL WORK.
SCHEMES PROMOTED BY GOI FOR ENCOURAGING INVESTEMENT IN FOOD PROCESSING

INDIA 12TH - 5 YEAR PLAN ( 2012 – 2017 )

INDIA 12TH - 5 YEAR PLAN ( 2012 – 2017 )

INDIA 12TH - 5 YEAR PLAN ( 2012 – 2017 )

INDIA 12TH - 5 YEAR PLAN ( 2012 – 2017 )

INDIA 12TH - 5 YEAR PLAN ( 2012 – 2017 )

INDIA 12TH - 5 YEAR PLAN ( 2012 – 2017 )

INDIA 12TH - 5 YEAR PLAN ( 2012 – 2017 )

INDIA 12TH - 5 YEAR PLAN ( 2012 – 2017 )

INDIA 12TH - 5 YEAR PLAN ( 2012 – 2017 )

PART 2 :: NATIONAL MISSION ON FOOD PROCESSING
PROMOTE FACILITIES FOR POST HARVEST OPERATIONS SUCH AS COLD STORAGESDECENTRIZAING THE IMPLEMENTATION OF GOVT SCHEMES TO INCREASE REACH.
AUGMENT THE CAPACITY OF FOOD PROCESSING SECTOR TECHNOLOGICALLY-CAPITAL INFUSION- HAND HOLDINGINSTITUTIONIZE TRAINING – FOR EASY AVAILABILITY OF MANPOWER
RAISE STANDARD OF FOOD SAFETY & HYGIENCE TO MEET FSSAI NORMSFACILIATE FOOD PROCESSING INDUSTRY TO ADOPT HACCP & ISO CERTIFICATION.
TO AUGMENT SUPPLY FROM FARM TO FORK.
INDIA 12TH - 5 YEAR PLAN ( 2012 – 2017 )

PART 3 : NATIONAL CENTER OF COLD CHAIN DEVELOPMENT - A TASK FORCE
AN AUTONOMOUS NODAL AGENCY TO DEVELOP COLD CHAIN IN INDIA.
THINK TANK TO GOVT – TRANSLATE INDUSTRIES RECOMMENDATON TO POLICY
CREATE PRIVATE INVESTMENT ENVIROMENT IN COLD CHAIN SECTOR
ADDRESS CONCERNS ON STANDARDS & PROTOCOLS
PROMOTE & DEVELOP NEW TECHNOLOGIES & ADAPTION IN INDIA.
CREATE AWARENESS PROGRAMMES FOR BEST PRODUCT HANDLING PRACTICES FOR SPECIFIC REQUIRMENTS AND CONDITIONS.
Recommend guidelines to minimise environment impact and promote sustainability in the cold-chain.

INDIA 12TH - 5 YEAR PLAN ( 2012 – 2017 )

FOREIGN DIRECT INVESTMENT IN INDIA
2007-08 2008-09 2009-10 2010-11 2011-12 2012-130
50
100
150
200
250
300
350
400
450 FD1
FD1

NOMENCLATURES
CAGR COMPOUND ANNUAL GROWTH RATE
FSSAI FOOD SAFETY & STANDARDS AUTHORITY OF INDIA
PMH POST HARVEST INTEGRATION

REFRENCES
www.fao.org
www.12thplan.gov.in
www.planningcommission.ni.in
www.emerson.com/india
Central Institute of Post Harvest Engg & Tech
Post Harvest Intergration

Prospect for cold chain development in the next decade

Availability of Cold Storages
• India has 6,488 cold storage with a cumulative installed capacity of approximately 30 million Metric Tons
• More than 30% of the cold storage units (~10 mill tons) have been built in the previous10 years and reports states another 30+ million tons capacity is to be built
• 12th Five year plan targets 40 lakh MT for cold chain infrastructure & reefer transport

Difference in reefer exports between peak
month and slack month per country

Role of Govt. in development process

High Operating Expenditure will see change• About 28% of the total expenses for cold storages in India is accounted for by
energy expenses compared to only 10% in the West
• About 30-35% of the losses can be reduced by transporting the freshly harvested fruits and vegetables in refrigerated containers or in suitable containers, crates etc.
• Investment costs in the back-up systems of cold storages further makes the setting up of cold storage difficult, unviable and uneconomical
• Alternate sources of non-conventional energy to be tapped.
CHALLENGES :
Govt. policy interventions to develop
integrated Cold Chain
• No Clear cut policy on cold chain development, presently.
• Need for Adoption of modern Technology in Warehousing Business Model of Cold
Chain Infrastructure.
• Enforcement of Technical Standards for Specialized / Reefer Transport System
as regulatory tools for claiming subsidies.• Generating minimum critical mass of Skilled Man-Power.• Creating synergy for Indian produce and institutions.
• Specialized Purpose Vehicle (SPV) for Cold Chain Logistics Initiative.
• National Centre for Cold Chain Development (NCCD) activation.
CHALLENGES

The gap in cold storage capacity in
various states
• Cold Storage Requirement: 611.30 lakh MT
• Present Capacity: 242.98 lakh MT
• Gap: 368.32 Lakh MT
• 12th Five year plan targets 40 lakh MT for cold chain infrastructure & reefer transport
Source: DMI & NSE study 2010
CHALLENGES

Energy Saving
• Power consumption in most projects 0.16 units/day/MT. ( for 5000MT against ideal of 0.18-0.20 unit/day/MT, against 0.14 ideal.
• 10 -15% energy saving, with automation
• Weight loss reduced 8 -10% to 2.3% presently
• Quality of the produced improvedUse of Automationlike VFD, PLC especially in CA Store.
• Change of trend for automation
• Standards help in selection of equipment
STRENGTH IN CHANGE :

Socio - Economic Impact of Cold Chain
• Farming Community getting better price encouraged their bargaining power.• Availability of large period of fruit like Apple 9 months, Carrot & Lemon 5-6 months
In onion through out of the year.
• Diversification and improved quality of processed potato and seed potato.• Wide varities of F&V imported through cold chain.
• Enhancement of processing industry raw material and LCC.
STRENGTH IN CHANGE:

2009 2013E 2017F0.0
2.0
4.0
6.0
8.0
10.0
12.0
14.0
2.0
4.7
12.8
Indian Cold Chain industry is expected to grow at a CAGR of ~28% over the next 4 years and reach a market size of ~USD 13 Bn in 2017 and is largely unorganised in nature. Thereby, presenting a great opportunity.
Cold Chain Industry in India (in USD Bn) Growing annually at 28% the total value of cold chain
industry in India is expected to reach ~USD 13 billion by 2017 through increased investments, modernization of existing facilities, and establishment of new ventures via private and government partnerships
India’s cold chain industry is still evolving, not well organized and operating below capacity
The Indian cold chain market is highly fragmented with more than 3,500 companies in the whole value system
Organized players contribute only ~8%–10% of the cold chain industry market
Most equipment in use is outdated and single commodity based
Need for cold chain –
‒ 11% of world’s total vegetables production is accounted by India alone but India’s share in global vegetable trade is only 1.7%
‒ 127 Million Tonnes of milk was produced in 2011-12, but cold storage capacity is only available for 70,000-80,000 Tonnes of milk
‒ 20%-30% of fish production is annually wasted in India
‒ ~25,000 unregistered slaughter houses are present in India, which generally lack chilling facilities
23.3% C
AGR
28.3
% C
AG
R
Source: Assocham, US Commercial Service, Media Reports, Reed Analysis
OPPORTUNITIES :

India offers great market potential for cold chain logistic solution providers, including refrigerated transport
Temperature Controlled Vehicles Market in India According to industry estimates, approximately 104
million metric tons of perishable produce is transported between cities each year
Of this figure, about 100 million metric tons moves via non–reefer mode and only four million metric tons is transported by reefer
Even though, India has about 250 reefer transport operators (mostly small & non integrated firms) that transport perishable products and >30,000 refrigerated vehicles currently ply in India
Majority of the refrigerated vehicles (~80%) are utilized for milk and milk products transportation
The high cost of transportation is a major challenge for refrigerated vehicles market
Key growth drivers include meat products export , rising demand for confectionary, frozen food etc.
Source: Assocham, Reed Analysis
2009 2013E 2017F -
50
100
150
200
250
300
350
-
10,000
20,000
30,000
40,000
50,000
60,000
80
152
316
27,400
36,000
51,800
USD Mn Units
OPPORTUNITIES :

Cold stores are the major revenue contributors of the Indian Cold Chain industry and are majorly used for storing potatoes. However, the market is gradually getting organised and focus towards multi purpose cold storages is risingTemperature Controlled Warehouse Market in India
There are ~5,381 number of total cold chain storages in India with 95% of total storage capacity under private players
~36% these cold storages in India have capacity below 1,000 MT
65% of India’s cold chain storage capacity is contributed by the states of Uttar Pradesh and West Bengal
With the current capacity only less than 11% of what is produced can be stored
Cold storage capacity is expected to grow at ~13% per annum on a sustained basis over the next 4 years, with the organized market growing at a faster pace of ~20%
Key growth drivers include growth in organized retail and food service industry, government’s initiatives, rising export demand for processed and frozen food
Source: Assocham, E&Y, Reed Analysis
2009 2013E 2017F0.0
2.0
4.0
6.0
8.0
10.0
12.0
14.0
0
5
10
15
20
25
30
35
40
45
50
2.0
4.6
12.5
17
29
47
USD Bn Mn Tonnes
Cold Storage Price-Volume Analysis
75.4%
23.1%
0.3% 0.8% 0.4%
Potatoes
Multi Purpose
Fruits & Vegetables
Meat & Fish
Milk Products
Huge variation in the share of potatoes storage capacity and revenue generation
Share of multi purpose cold storages is low in storage capacity but high in revenue generation
There is growing focus towards multi-purpose cold storages
20.0%
54.0%
6.0%
12.0%
8.0%

The Government of India recognizes that development of cold chain is an essential next step in upgrading India’s food processing industry and therefore offers many incentives for promoting growth
•FDI allowed through automatic route
100% FDI
•Since 2011-12, cold chain has been given the infrastructure status .
Infrastructure Status
•Up to 40% of the cost
Viability Gap Funding
• 5% concession on import duty, service tax exemption, excise duty exemption on several items. Subsidy of over 25% to 33.3% on the cold storage project cost.
Monetary & Tax Benefits
•Established in 2011, to look into matters related to cold chain infrastructure
Establishment of National Centre for Cold Chain Development
•Proposed financial outplay for cold chain infrastructure & food parks of ~ USD 335 Mn & USD 650 Mn respectively. Over 50%-70% capital grant on projects
Growing Emphasis On Food Parks & Integrated Cold Chain Development
Source: Assocham, Reed Analysis
SUMMARY:

Compliance cost and benefit to economy
- Pack house, Ropeways, Conveyor belts etc: 400-Cold storage with mezzanine floors: 2,400-Advance Cold storages: 640-CA Storages: 1,440-Onion storage: 750-Refrigerated vans: 500-Multi-modal transport system for horticulture produce: 100-Fruit Ripening Chambers: 800
• Total: 7,030 (Rs. Crores in 12th Plan Working Group Report).• Investment of about Rs 7,000 crore to go upto Rs 18,000 crores, on the
conservative estimates.• Sectors such as meat, fish, poultry, dairy products, confectionery and
pharmaceuticals to double to Rs 40,000 crores.

Importance of standards for healthydevelopment of cold chain projects

Cold Chain industry in India

The India Opportunity

Doing Business in India

India Statistics

Also, the Indian economy has been witnessing healthy growth rates in the past with the services sector making the major contribution to the economy
2008 2009 2010 2011 2012 2013 2014 2015 2016 2017 20180.0
2.0
4.0
6.0
8.0
10.0
12.0
3.9
8.5
10.5
6.3
3.23.8
5.1
6.3 6.5 6.7 6.7
Real GDP Growth
Source: Worldbank
The share of agriculture has been declining over the past few years and the trend is expected to continue in the future.
However, the government realizes that a service sector based strategy may not be sustainable over a long horizon.
Accordingly, it is expected that policy push on infrastructure and acceleration in the pace of reforms and investment in key sectors, is likely to keep India on its high growth trajectory.
1990 2000 2010 20200%
10%
20%
30%
40%
50%
60%
70%
80%
90%
100%
34% 27%17% 10%
23%23%
26%26%
43% 50% 57% 64%
Agriculture Manufacturing ServicesSource: Economic Survey of India
GDP – Sector Contribution

India’s economic growth is driven primarily by domestic market (private consumption), followed by investments…
Source: Worldbank
2008 2009 2010 2011 20120
10
20
30
40
50
60
70
80
90
100
59 57 56 59 60
11 12 1112 12
32 32 32 31 30
Private Consumption Government Consumption
Gross Fixed Investment
2008 2009 2010 2011 20120%
2%
4%
6%
8%
10%
12%
14%
16%
7%
7%
9%
8%
4%
10%
14%
6%
9%
4%
4%
8%
14%
4%
2%
Private Consumption Government Consumption
Gross Fixed Investment
Private Consumption, Government Consumption & Investment (as % of GDP)
Private Consumption, Government Consumption and Investment Growth Rate
India GDP(USD 1.8 trillion)
Private Consumption(USD 1,105 billion)
Government Consumption(USD 221 billion)
Gross Fixed Investment (USD 553 billion)

2006 2007 2008 2009 2010 2011 2012 2013 2014 2015 2016 2017 2018
-10.0
-5.0
0.0
5.0
10.0
15.0
20.0
9.3 9.8
3.9
8.5
10.5
6.3
3.2 3.85.1
6.3 6.5 6.7 6.7
12.714.2
9.6 9.210.4
9.37.7 7.6 7.3 7.0 7.0 7.0 7.0
4.0
6.15.2
-0.3
7.5
2.70.9
2.5 2.5 3.2 3.3 3.5 3.5
8.2 8.5
5.2
-7.8
4.5 4.33.4
1.5
3.03.5 3.5 3.5 3.5
India China Brazil Russia
….thereby making its growth more sustainable, resilient and relatively more consistent than other BRIC countries
Source: Worldbank
Real GDP Growth Rate
GDP Growth
India & China fared well during the credit crunch compared to Brazil & Russia, who had negative growth rates.
While India and China are expected to witness similar GDP growth rates (~7%) over the forecast period.
Comparatively, both Brazil and Russia are expected to register lower GDP growth rates
Growth Drivers
Private Consumption key contributor to GDP growth in India, Brazil and Russia.
Compared to this, China’s growth is driven by capital investments (~46%).
Country Inflation % (CPI) 1
FDI (as % of GDP) 1
GDP Share (in %)1
Private Consumption
Government Consumption
Gross Fixed Investment
India 10.4 1.3 60% 12% 30%
China 2.7 3.1 36% 14% 46%
Brazil 5.4 2.7 62% 21% 18%
Russia 5.1 1.6 48% 19% 22%
Forecast
Note: 1) 2012 figures

However, there are few moderate risks associated with economic growth in India
Exchange Rate
Inflation
Fiscal Deficit
Governance & Transparency
Risks to Growth

Logistics in India

FY 13 FY 180.0
50.0
100.0
150.0
200.0
250.0
300.0
350.0
400.0
450.0
14.2 35.5
223.2
364.7
Organised Unorganised
The logistics industry in India has strong growth drivers, is highly fragmented and provides ample opportunities for international companies to establish their presence
Japan
USA
Europe
China
India
0% 10% 20% 30% 40% 50% 60% 70% 80% 90% 100%
80%
57%
40%
10%
6%
Percentage of logistics activity by organized sector Logistics spend (in USD bn)
237.3
400.2
CAGR - ~20%
CAGR - ~10%
CAGR - ~11%
Favourable demographics driving demand
Increasing urbanization, spread of modern retail and cluster-based manufacturing
Rising exports (~13% CAGR between FY08 and FY13) and imports (~14% CAGR between FY08 and FY13)
Demand for higher end services & infrastructure driven by greater presence of MNCs & maturity in end-users
Strong growth drivers for organized logistics include
Source: World Bank report on trade logistics 007, SPA Research Source: Oxford economics Global economic data bank; 13% of GDP is assumed as logistics spend in FY13; 11% of GDP is assumed as logistics spend in FY18

Key growth opportunities in the logistics sector in India
2011-12 2012-13 2013-14 2014-150
500
1,000
1,500
2,000
2,500
1,6001,722
1,8521,993
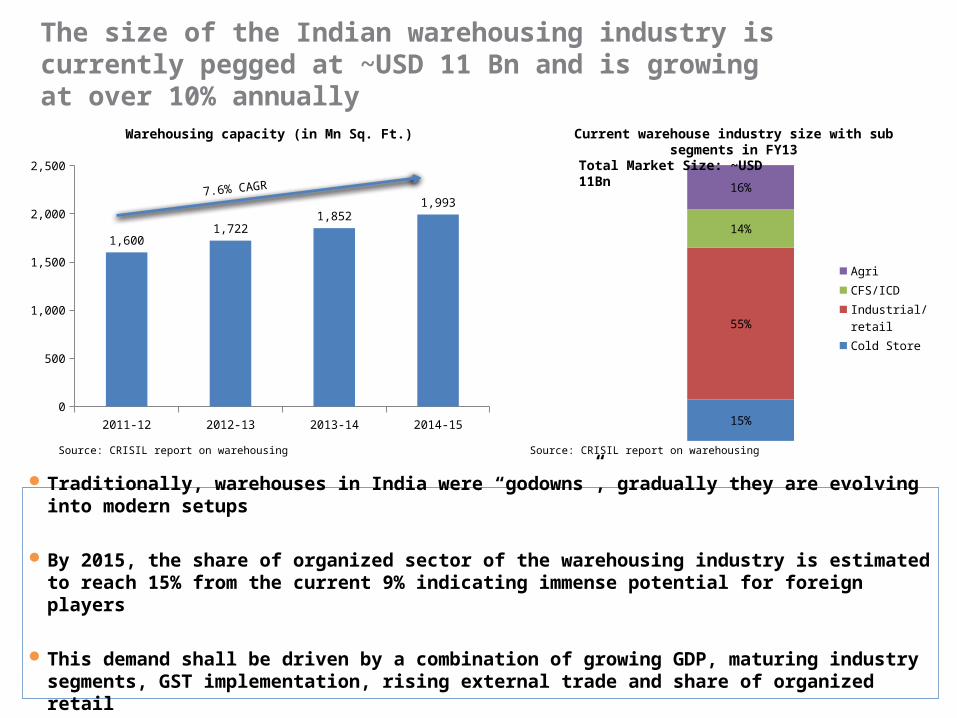
The size of the Indian warehousing industry is currently pegged at ~USD 11 Bn and is growing at over 10% annually
Warehousing capacity (in Mn Sq. Ft.) Current warehouse industry size with sub segments in FY13
Traditionally, warehouses in India were “godowns”, gradually they are evolving into modern setups
By 2015, the share of organized sector of the warehousing industry is estimated to reach 15% from the current 9% indicating immense potential for foreign players
This demand shall be driven by a combination of growing GDP, maturing industry segments, GST implementation, rising external trade and share of organized retail
Source: CRISIL report on warehousing Source: CRISIL report on warehousing
7.6% CAGR
15%
55%
14%
16%
Agri
CFS/ICD
Industrial/retail
Cold Store
Total Market Size: ~USD 11Bn

Huge emerging opportunities for foreign companies in the Indian cold chain industry, which is undergoing a major change, due to Government focus on food preservation
Size of Cold Chain industry in India (in USD Bn)
2009 2013E 2017F0.0
2.0
4.0
6.0
8.0
10.0
12.0
14.0
2.0
4.7
12.8
25.8% CAGR
Drivers of the Cold Chain Industry in India
Budget 2011-2012 provided infrastructurestatus to the cold chain sector
Growth in organized retail
Government initiatives
Demand from pharma
India is the second largest producer of vegetables and fruits in the world after China
Source: Assocham, US Commercial Service, Media Reports, Reed Analysis

INDIA CHALLENGES: