Embed Size (px)
Citation preview

Earnings Results 2Q16 August, 2016

2
Disclaimer
This presentation may contain certain forward-looking projections and trends that neither
represent realized financial results nor historical information.
These forward-looking projections and trends are subject to risk and uncertainty, and
future results may differ materially from the projections. Many of these risks and
uncertainties are related to factors that are beyond CCR’s ability to control or to estimate,
such as market conditions, currency swings, the behavior of other market participants, the
actions of regulatory agencies, the ability of the company to continue to obtain financing,
changes in the political and social context in which CCR operates or economic trends or
conditions, including changes in the rate of inflation and changes in consumer confidence
on a global, national or regional scale.
Readers are advised not to fully trust these projections and trends. CCR is not obliged to
publish any revision of these projections and trends that should reflect new events or
circumstances after the realization of this presentation.

TRAFFIC:
Consolidated proforma traffic¹, excluding Ponte and MSVia, decreased 3.7% in 2Q16.
ADJUSTED EBITDA:
Proforma adjusted EBITDA in the same basis2 increased 5.9%, with margin of 63.3% (+1.9 p.p.).
NET PROFIT:
Net profit in the same basis2 reached R$ 147.8 million, a 36.8% decrease in 2Q16.
INDEBTNESS:
Issuances totalizing R$ 4.0 billion with extension of debt profile.
CORPORATIVE HIGHLIGHT:
Signature of the Private Instrument of Agreement of Purchase and Sale for the purchase of
additional participation in ViaRio and binding proposal for the increase of participation in ViaQuatro,
according to the Material Facts of 06/30/16.
3
2Q16 Highlights
1 Including the proportional traffic of Renovias. 2 Same-basis figures exclude: (ii) new businesses, either non-operating, under assisted operation, or which were not included in the portfolio during at least one of the
comparison periods: Metrô Bahia, MSVia and TAS; (ii) Ponte, whose agreement ended on May 31, 2015; and (iii) additionally, in profit in the same comparison basis
and in same-basis pro-forma comparisons, it excludes Controlar, ViaRio and VLT.

1- Net revenue excludes construction revenue.
2- Same-basis figures exclude: (ii) new businesses, either non-operating, under assisted operation, or which were not included in the portfolio during at least one of
the comparison periods: Metrô Bahia, MSVia and TAS; (ii) Ponte, whose agreement ended on May 31, 2015; and (iii) additionally, in profit in the same comparison
basis and in same-basis pro-forma comparisons, it excludes Controlar, ViaRio and VLT.
3- Calculated by adding net revenue, construction revenue, costs of services and administrative expenses
4- The adjusted EBIT and EBITDA margins were calculated by dividing EBIT and EBITDA by net revenue, excluding construction revenue, as required by IFRS.
5- Calculated excluding non-cash expenses: depreciation and amortization, the provision for maintenance and the recognition of prepaid concession expenses.
4
Financial Highlights – 2Q16
Net Revenues1 1,424.4 1,599.6 12.3% 1,657.3 1,865.8 12.6%
Adjusted Net Revenues on the same basis2 1,389.6 1,414.8 1.8% 1,620.3 1,665.2 2.8%
Adjusted EBIT3 583.0 634.7 8.9% 682.1 738.5 8.3%
Adjusted EBIT Mg.4 40.9% 39.7% -1.2 p.p. 41.2% 39.6% -1.6 p.p.
EBIT on the same basis2 602.1 591.8 -1.7% 701.5 694.0 -1.1%
EBIT Mg. on the same basis2 43.3% 41.8% -.,5 p.p. 43.3% 41.7% -1.6 p.p.
Adjusted EBITDA5 845.2 960.2 13.6% 980.9 1,106.7 12.8%
Adjusted EBITDA Mg.4 59.3% 60.0% +0.7 p.p. 59.2% 59.3% +0.1 p.p.
Adjusted EBITDA on the same basis2 858.7 908.4 5.8% 994.7 1,053.3 5.9%
Adjusted EBITDA Mg. on the same basis2 61.8% 64.2% +2.4 p.p. 61.4% 63.3% +1.9 p.p
Net Income 183.7 145.7 -20.7% 183.7 145.7 -20.7%
Net Income on the same basis2 234.0 147.8 -36.8% 234.0 147.8 -36.8%
2Q15 2Q16 Chg %Financial Indicators (R$ MM) 2Q15 2Q16 Chg %
IFRS Proforma

5
Traffic – Quarter Change (Proforma*)
Consolidated – MM Equivalent Vehicle
Revenue and traffic 2Q16 X 2Q15 (%)
* Information including Renovias which is contemplated in the proforma method.
Excluding Ponte
and MSVia
234,478 (-3.7%)
253,194211,840 237,859
238,811 253,634
263,465
2Q11 2Q12 2Q13 2Q14 2Q15 2Q16
-3.5 -6.4
2.7
-7.5 -5.4
-1.9 -2.4 -4.3
-0.7
5.9 7.8
-2.7 -1.8
1.7
8.9
0.1
AutoBAn NovaDutra RodoNorte ViaLagos ViaOeste Renovias RodoAnel SPVias
Traffic Toll Revenues

6
Revenue Analysis (Proforma*)
Payment Means
Gross Operating Revenues Gross Revenue Breakdown
* Including the proportional results of jointly-owned subsidiaries.
AutoBAn22.9%
NovaDutra14.1%
ViaOeste11.5%
RodoNorte9.0%
Airports10.2%
SPVias7.2%
STP3.9%
MSVia3.6%
ViaQuatro3.1%
RodoAnel2.9%
TAS2.3%
Renovias1.9%
Barcas1.8%
ViaLagos1.6%
Ohers4.0%
69% 70% 70% 70%
31% 30% 30% 30%
2Q13 2Q14 2Q15 2Q16
Electronic Cash
84% 84% 78% 74%
16% 16% 22% 26%
2Q13 2Q14 2Q15 2Q16
Toll Others

1,475.7
1,906.0
1400.436 13 1 25
310 27 18 506
2Q15 Depreciationand
Amortization
Third-partyServices
GrantingPower andAdvanced
Expenses
PersonnelCosts
ConstructionCosts
MaintenanceProvision
OtherCosts
2Q16 NewProjects
2Q16SameBasis
7
IFRS Costs Evolution
Total Costs (R$ MM)
Conclusion of civil works in NovaDutra
and Rodonorte
New business and
Ponte
New business
Capex (New business)
Same-basis
Cash Cost: R$
528 MM (-4.0%)
Update of estimates and
technichal specification
7% 12% 49% 29% 18% 0.6% Same-basis
Cash Cost: R$
550 MM
ProformaSame-
basis Cash
Cost: R$ 633
MM (-2.1%)
65% 18%

981
1,1061,053
(53)
2Q15Proforma
EBITDA
2Q16Proforma
EBITDA
NewProjects
and Ponte
2Q16Proforma
EBITDASameBasis
8
Proforma EBITDA*
59.2%
of Mg.
59.3%
of Mg. 63.3%
of Mg.
* Same-basis figures exclude: (i) new businesses, either non-operating, under assisted operation, or which were not included in the portfolio during at least one of the
comparison periods: Metrô Bahia, MSVia and TAS; (ii) Ponte, whose agreement ended on May 31, 2015; and (iii) additionally, it excludes Controlar, ViaRio and VLT.
*
2Q15 Same basis
R$ MM 994.7
61.4% of Mg.
2Q16 Same basis
R$ MM 1,053.3
(+5.9%)
R$ MM

389.2
501.7 142.0 1.5 15.8 141.8
2.9
66.2 6.9
37.1 13.4
2Q15 NetFinancial Result
Income fromHedge
Operation
Monetary variation on
loans, financ. and debentures
Monetary Variation on
Liabilities related to the Granting
Power
Exchange Rate Variation on Loans and Financing
Present Value Adjustment of Maintenance
Prov. and
Liabilities related to the Granting
Power
Interest on Loans,
Financing and Debentures
Investment Income and
Other Income
Fair Value ofHedge
Operation
Others 2Q16 NetFinancial Result
9
IFRS Financial Results
• Chg. of average CDI 2Q16 X 2Q15 = +1.0 p.p.
• Gross Debt = R$ 14.7 B (+20.0%)
28%
R$ MM

10
Net Income
R$ MM
Same basis
R$ 246 MM
* Same-basis amounts exclude: (i) new businesses, either non-operating, under assisted operation, or which were not included in the portfolio during at least one of the
comparison periods: Metrô Bahia, MSVia and TAS; (ii) Ponte, whose agreement ended on May 31, 2015; and (iii) additionally, it excludes Controlar, ViaRio and VLT.
*
Same basis
R$ 147.8 MM
(-36.8%) 183.7
145.72 147.8
2Q15Net
Income
2Q16Net
Income
NewProjects
and Ponte
2Q16Net Income
SameBasis
Gross hedged debt by indexer
11
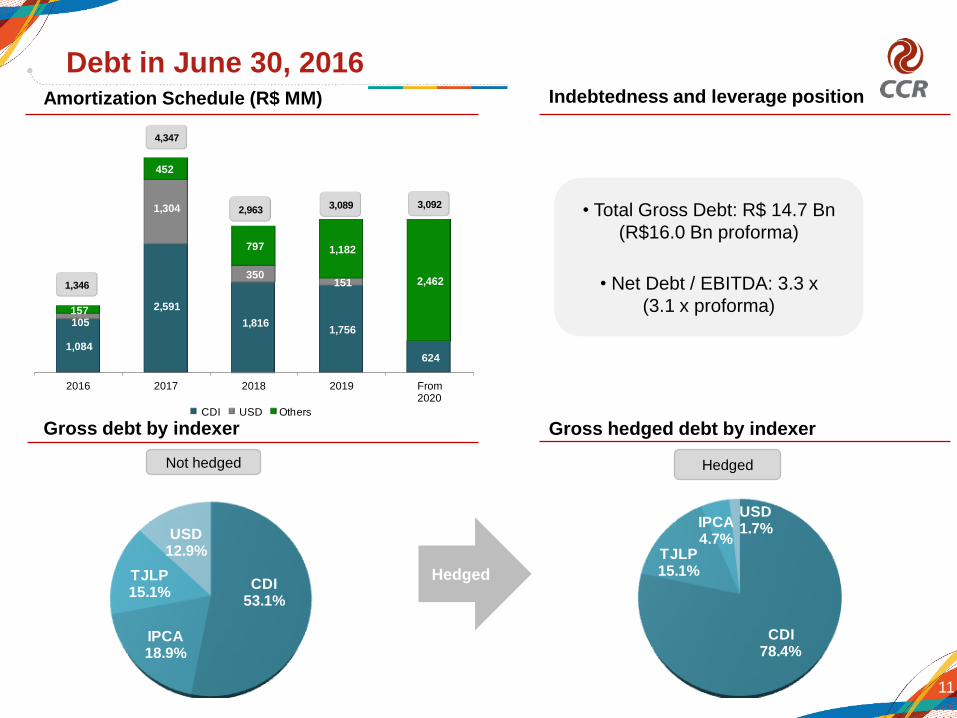
Debt in June 30, 2016 Amortization Schedule (R$ MM) Indebtedness and leverage position
• Total Gross Debt: R$ 14.7 Bn
(R$16.0 Bn proforma)
• Net Debt / EBITDA: 3.3 x
(3.1 x proforma)
Gross debt by indexer
Not hedged Hedged
CDI78.4%
TJLP15.1%
IPCA4.7%
USD1.7%
CDI53.1%
IPCA18.9%
TJLP15.1%
USD12.9%
Hedged
1,084
2,591
1,816 1,756
624
105
1,304
350 151
157
452
797 1,182
2,462
2016 2017 2018 2019 From2020
CDI USD Others
3,0923,0892,963
4,347
1,346

12
Debt Structure and Amortization
Amortization 2016 - 2017 Amortization schedule
Amortization (R$ MM) 2016 2017
AutoBan 283 549
Metrô Bahia 236 610
Barcas 199 0
ViaOeste 154 275
CCR 118 879
CPC 89 417
NovaDutra 85 346
CAP 58 0
RodoAnel Oeste 49 835
CCR USA Airpot 41 40
SPVias 21 155
BHAirport 1 80
CCR Espanha 0 96
Outras 13 64
TOTAL 1,346 4,347
TOTAL AMORTIZATION 1,346 4,347
In R$ billion
Extension of debt
profile
4,84,0
6,1
1,3
4,3
9,1
2016 2017 From 2018
Mar-16 Jun-16

13
2Q16 Funding
Concessionaire Date Amount (R$ MM) Debt Average Cost Maturity
SAMM Apr-16 55.0 Commercial Paper 115.32% CDI Mar-17
BARCAS Apr-16 191.0 Commercial Paper 128.50% CDI Oct-16
VIA LAGOS Apr-16 65.0 Debentures (issuance) 118.00% CDI Apr-18
CCR Apr-16 300.0 Resolution 4131 124.95% CDI Apr-17
AUTOBAN Apr-16 177.5 Resolution 4131 124.80% CDI Apr-18
BH AIRPORT Apr-16 22.5 BNDES TJLP + 2.66% p.a. Jul-17
BH AIRPORT Apr-16 7.5 BNDES TJLP + 3.45% p.a. Jul-17
MSVIA Apr-16 587.0 BNDES LP TJLP + 2.00% p.a. Mar-39
VIAQUATRO May-16 165.0 Debentures (inssuance) CDI + % 1.5 p.a. May-17
VIARIO May-16 140.4 CCB CDI + % 4.5 p.a. Aug-16
RODOANEL May-16 750.0 Debentures (inssuance) CDI + % 3.8 p.a. May-19
METRÔ BAHIA May-16 200.0 Debentures (inssuance) CDI + % 3.95 p.a. May-18
METRÔ BAHIA Jun-16 187.0 BNDES LP TJLP + 3.18% p.a. Oct-42
SPVIAS Jun-16 1,200.00 Debentures (inssuance) 129.30% CDI May-21
Total 4,047.9
Concessionaire Date Amount (R$ MM) Debt Average Cost Maturity
Curaçao Jun-16 18.0 USD Long Term Facility 4.20% p.a. Jul-26
Total 18.0 USD
14
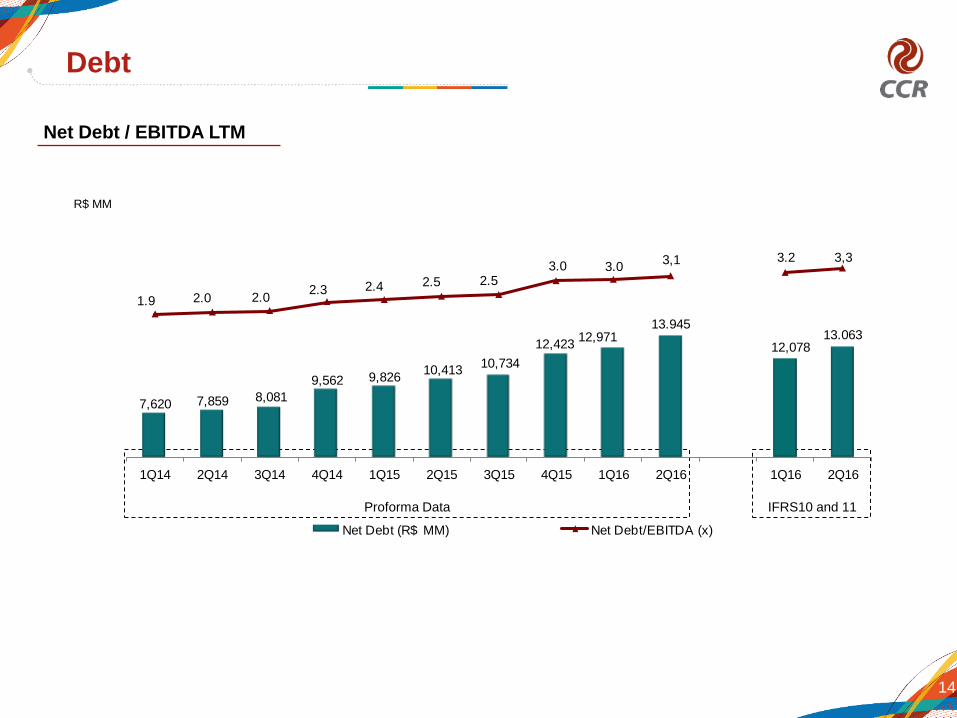
Debt
Net Debt / EBITDA LTM
IFRS10 and 11
Proforma Data
R$ MM
7,620 7,859 8,081
9,562 9,82610,413
10,734
12,423 12,078
13.94512,971 13.063
3.0
1.9 2.0 2.02.3 2.4 2.5 2.5
3.03,1 3.2 3,3
-2,5
-1,5
-0,5
0,5
1,5
2,5
3,5
4.000
6.000
8.000
10.000
12.000
14.000
16.000
18.000
20.000
1Q14 2Q14 3Q14 4Q14 1Q15 2Q15 3Q15 4Q15 1Q16 2Q16 1Q16 2Q16
Net Debt (R$ MM) Net Debt/EBITDA (x)

15
Investments and Maintenance
1- The investments made by the Company, which will be reimbursed by the granting authority as monetary consideration or contribution,
compose the financial assets.
2- For 100% of the project, at 1Q16 the total investment was R$269.8 million, of which R$16.3 million is related to the portion of the
Concessionaire and R$220.4 million to the Granting Authority.
3- Includes CCR, MTH, CPC and eliminations.
2Q16
R$ MM
AutoBAn 21.0 1.1 22.1 5.0 0.0
NovaDutra 17.3 0.8 18.1 12.6 0.0
ViaOeste 12.0 0.9 12.9 1.8 0.0
RodoNorte (100%) 82.1 1.3 83.4 3.2 0.0
Ponte 0.0 0.0 0.0 0.0 0.0
ViaLagos 3.5 0.1 3.6 0.0 0.0
SPVias 3.6 0.6 4.2 7.4 0.0
ViaQuatro (60%) 63.8 0.5 64.3 0.0 0.0
Renovias (40%) 0.2 0.2 0.4 3.2 0.0
RodoAnel (100%) 6.2 0.2 6.4 3.8 0.0
SAMM 0.7 6.1 6.8 0.0 0.0
ViaRio2 (33.33%) 21.9 0.8 22.7 0.0 0.0
Quito 4.3 0.0 4.3 0.0 0.0
San José 6.9 0.0 6.9 0.0 0.0
Curaçao 4.5 0.0 4.5 0.0 0.0
Barcas 0.1 0.1 0.2 0.0 0.0
VLT (24.88%) 43.1 0.1 43.2 0.0 93.0
Metrô Bahia 235.6 5.7 241.3 0.0 286.3
BH Airport 133.6 1.2 134.8 0.0 0.0
MSVia 101.3 3.7 105.0 0.0 0.0
STP (34.24%) 2.0 0.7 2.7 0.0 0.0
Other3 0.2 5.9 6.1 0.0 0.0
Consolidated 763.8 30.0 793.9 37.0 379.3
Proforma
Financial
Asset1
ImprovementsEquipments
and OthersTotal
Maintenance
Cost
Intangible AssetsPerformed
maintenance