Embed Size (px)
Citation preview

A data-driven optimization process that goes beyond lead capture
Optimizing the Lead
Brian CarrollExecutive Director, Revenue OptimizationMECLABS

2
Session SpeakerBrian CarrollExecutive Director of Revenue OptimizationMECLABS
Brian Carroll is Executive Director of Applied Research at MECLABS and CEO of InTouch, part of the MECLABS Group. Author of the bestseller, Lead Generation for the Complex Sale, Carroll is a leading expert in lead generation and he's profiled and regularly quoted in numerous publications.
Carroll also speaks to 20,000 people a year on improving sales effectiveness and lead generation strategies. He has been profiled and regularly quoted in numerous publications such as BtoB magazine, Selling Power, The Wall Street Journal, Entrepreneur, Target Marketing, Inc., Marketing News, DM News, MarketingProfs, MarketingSherpa, Software CEO and CMO Magazine.
@brianjcarroll
3
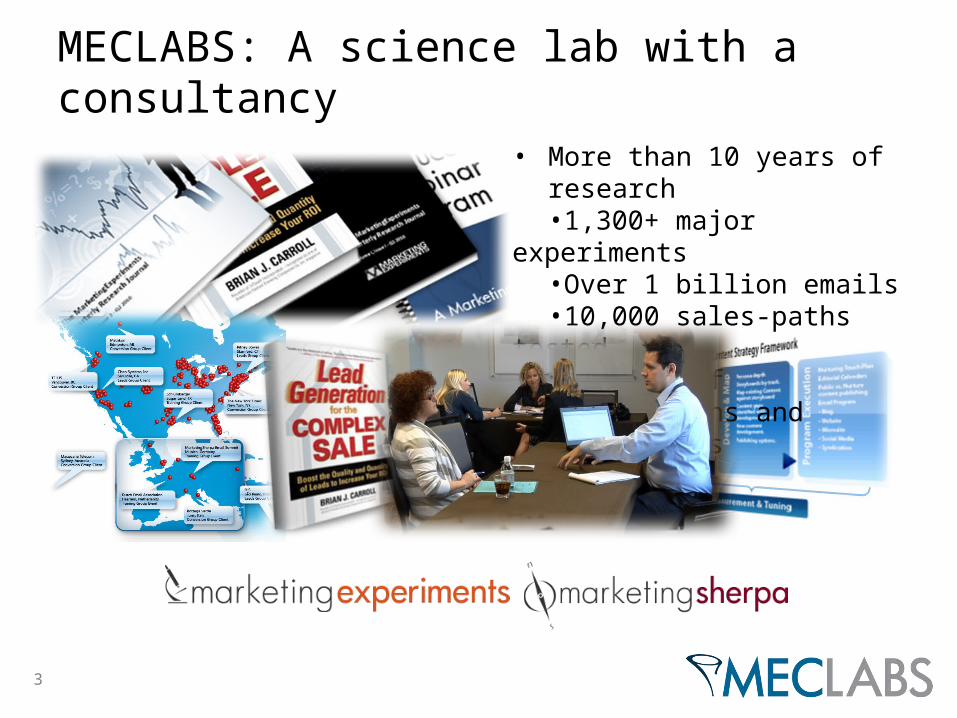
MECLABS: A science lab with a consultancy
• More than 10 years of research•1,300+ major experiments•Over 1 billion emails•10,000 sales-paths tested
• Hundreds of publications and conferences

4
We build custom micro research labs within companies around the world

Optimizing the Lead
Identify the right companies and people
Segment, score and prioritize
Initiate a memorable conversation
Nurture regardless of time to buy
1
2
3
4

Segment, score and prioritize
Initiate a memorable conversation
Nurture regardless of time to buy
2
3
4
Optimizing the Lead
Identify the right companies and people1

Case StudyTesting quality data and teleprospecting - How a telecom firm reduced prospecting costs by over 60%

8
Response-to-Sales-Accepted-Lead Conversion Rate 10% Lead-to-Sale
Conversion Rate 20%8
Tele-Prospecting
Funnel
Inside Sales
Funnel
Dial
Connection
Conversation
Buyer Conversation
Qualified Account
Acknowledged Need
Sales-Ready Lead
Sales-Validated Leads
Dial
Connection
Conversation
Buyer Conversation
Valid Lead
Forecast
Verbal Commitment
Deal
1

9
Case Study
Background: A telecom organization engaged MECLABS for lead generation
Objective: To determine if higher-cost/higher-quality data can drive down overall cost-per-lead, so we can focus on the most efficient list source.
Primary research question: Which campaign data source will drive the most efficient value?
Test Design: Four multi-source lists, a user-generated list, and a single-source list were tested under consistent experiment conditions, with 300 accounts and 80 hours of teleprospecting hours.
Experiment ID: Networking equipment company funnel optimization testLocation: MECLABS Primary Research LibraryTest Protocol: CS31556
Research Notes:
1

10
Case Study: Test design
Per segment: 300 accounts, 80 hours of calling*
Segments Record cost Validated
Multi-source 1 $24.00 Phone – role-based
Multi-source 2 $14.50 Phone – title-based
Multi-source 3 $6.00 Phone – validated
Multi-source 4 $3.00 Email – validated
User-generated $1.00 Business cards
Single-source $0.49 No validation
1

11
Case Study: Per record cost
Multi 1 Multi 2 Multi 3 Multi 4 User-gen Single$0
$5
$10
$15
$20
$25
$30
$24
$1
1

12
Case Study: Results
Segments Record cost
No longer with company
Dials to disqualify
Dials to sales-ready lead
Multi-source 1 $24.00 1% 90 77
Multi-source 2 $14.50 .06% 53 110
Multi-source 3 $6.00 14% 27 127
Multi-source 4 $3.00 23% 26 135
User-generated $1.00 67% 11 240
Single-source $0.49 13.3% 7 210
1

13
Case Study: Results and ROI
Segments Record cost
Call-per-lead
List count Leads Cost-per-
lead List cost
Multi-source 1 $24.00 77 1000 312 $373.45 $24,000
Multi-source 2 $14.50 110 1560 312 $496.00 $22,620
Multi-source 3 $6.00 127 2475 312 $536.58 $14,850
Multi-source 4 $3.00 135 2810 312 $546.75 $8,430
User-generated $1.00 240 9350 312 $954.00 $9,350
Single-source $0.49 210 13100 312 $828.95 $6,380
1

14
Case Study: Cost per lead
Multi 1 Multi 2 Multi 3 Multi 4 User-gen Single$0
$200
$400
$600
$800
$1,000
$1,200
$954
$373
1

15
Case Study: Results and ROI
Segments Record cost
Call-per-lead
List count Leads Cost-
per-lead List cost Call cost
Multi-source 1 $24.00 77 1000 312 $373.45 $24,000 $92,400
Multi-source 2 $14.50 110 1560 312 $496.00 $22,620 $132,132
Multi-source 3 $6.00 127 2475 312 $536.58 $14,850 $152,460
Multi-source 4 $3.00 135 2810 312 $546.75 $8,430 $162,278
User-generated $1.00 240 9350 312 $954.00 $9,350 $287,980
Single-source $0.49 210 13100 312 $828.95 $6,380 $252,175
1

16
Case Study: Cost of calling
Multi 1 Multi 2 Multi 3 Multi 4 User-gen Single$0
$50,000
$100,000
$150,000
$200,000
$250,000
$300,000
$350,000
$288k
$92k
1

17
Case Study: Results
Segments Record cost Cost-per-lead List cost Call cost Total cost
Multi 1 $24 $373 $24,000 $92,400 $116,400
User-gen $1 $954 $9,350 $287,980 $297,330
Difference ($14,650) $195,580 $180,930
60.85% Decrease in campaign costs
The $26/record list requires over 60% more list and teleprospecting investment than the $1/record list
1

18
Case Study: Results
What you need to understand: The ‘best deal’ list results in a campaign that is 2.5 more costly than the most efficient list.*
60.85% Decrease in campaign costs
The $26/record list requires over 60% more list and teleprospecting investment than the $1/record list
1

Identify the right companies and peopleKey Takeaways
• “Cheap” data is really expensive.• The less you spend on data, the more you will spend
on teleprospecting.• We must see list acquisition as strategic, not simply
transactional.
1

Identify the right companies and people
Initiate a memorable conversation
Nurture regardless of time to buy
1
3
4
Optimizing the Lead
Segment, score and prioritize2

21
Sample Marketing and Sales Process
Lead Capture
Segment and Score Leads
Qualify and Nurture
Sales Engagement
Analyze Results
Capture leads
Normalize data
Enrich data
Merge de-dupe
Segment leads by potential
Apply lead score:
lead data lead behavior
ULD
Qualify phone-ready leads
Distribute sales- ready leads
Analyze data
Close the loop
Leads converted
Sales pipeline
Sales closed
Overview deck
Opportunity
Approach deck
Proposal and LOA
Close
2

22
Step 1. Lead Capture
Web inquiries
Sales generated
Subscribers
Social mediaInquiries
Event registrants and attendees
Webinar registrants / inquiries
Enrich data
Unusabledatastore
Merge and de-dupe
Normalize data
External firmographic
data
2

23
Step 2. Segment & Score Leads
Segment forNext Action
Sales Qualification & Discovery
Human Interpretation (qualitative)
Segmentation based on potential
(quantitative)Lead Scoring
Phone Qualification & Discovery
Touch points(e.g., what content have they engaged?)
Match Function and DM Role : Champion/influencer or DMkr?
FIT? Meets minimum ICP :> $Xmillion Rev. and industry fit
Candidate-Supplied Data(e.g., Registration Forms)
Lead Capture
Segment & Score
Qualify & Nurture
Sales Engagement
Analyze Results
OpportunityScoring
2

Case StudyHow an technology reduced cost per lead by 75%

Background: A B2B eDiscovery technology and services provider had 25 list sources available. Data was assigned to sales reps as new list sources were attained without regard for list source performance.
Goal: To drive most efficient pipeline and revenue through teleprospecting
Primary research question: Which list will drive the most efficient lead generation?
Approach: Prioritize calling based on the quality and efficiency of the list sources. Each source was called for 80 to 100 hours.
Experiment ID: (Protected)Location: MECLABS Leads Group LibraryTest Protocol Number: TP1226
Research Notes:
�
25
Experiment: Background2

26
Experiment #2: The client request
• Marketing campaign and media source driven lists
• Lists were prioritized chronologically
• Focus on testing a new media source
Other possible reasons:• A lot of money was spent on
list/sponsorship• Client liked X event• Gut feel
2

27
Experiment #2: ResultsList Source Leads Calls DM
ContactsWebcast 1/18/11 Registered 7 58 10Show-6/16/2011 7 151 25Webcast 1/18/11 Registered & Attended 3 85 172010 Los Angeles 2 67 10Lead List 7.2 42 1550 163Document Review 1 43 6List 4/12/2011 2 87 8Prospects_Bay Area_CA 4 185 142011 New York 8 372 48Phase 2 list 5 245 28Event list 5.5.2011 2 112 15Google campaign 5-4-2011 1 62 32010 – Booth 9/23/10 3 267 18Show - 5/20/2010 1 89 4Phase 1 list 4 416 24Notes list 2010-05-24 7 753 62Expo and Conference 2010 5 570 53Annual meeting 2010-11-15 8 968 105Exchange list 2010-05-24 3 404 282010: webcast 7 972 94Webcast - 2/10/11 3 454 44Sponsorship summer 2010 1 162 10One Master Append 2010-06-15 11 2259 132List 5-5-2011 1 278 31Final List 2010-06-24 1 578 40Total 139 11187 992
2
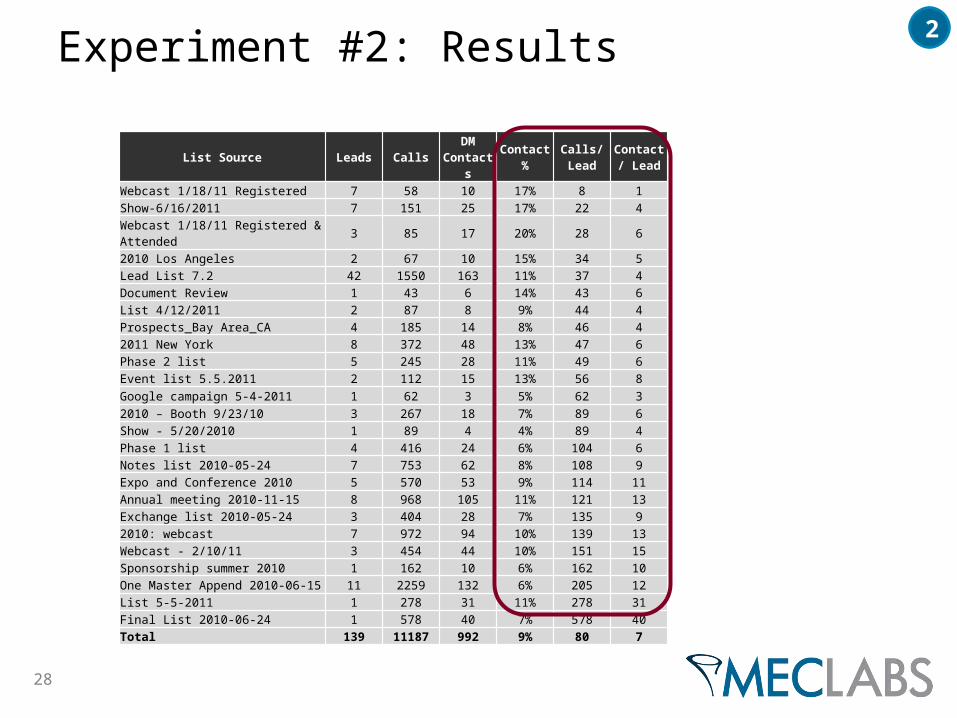
28
List Source Leads Calls DM Contacts Contact % Calls/Lead Contact/
LeadWebcast 1/18/11 Registered 7 58 10 17% 8 1Show-6/16/2011 7 151 25 17% 22 4Webcast 1/18/11 Registered & Attended 3 85 17 20% 28 62010 Los Angeles 2 67 10 15% 34 5Lead List 7.2 42 1550 163 11% 37 4Document Review 1 43 6 14% 43 6List 4/12/2011 2 87 8 9% 44 4Prospects_Bay Area_CA 4 185 14 8% 46 42011 New York 8 372 48 13% 47 6Phase 2 list 5 245 28 11% 49 6Event list 5.5.2011 2 112 15 13% 56 8Google campaign 5-4-2011 1 62 3 5% 62 32010 – Booth 9/23/10 3 267 18 7% 89 6Show - 5/20/2010 1 89 4 4% 89 4Phase 1 list 4 416 24 6% 104 6Notes list 2010-05-24 7 753 62 8% 108 9Expo and Conference 2010 5 570 53 9% 114 11Annual meeting 2010-11-15 8 968 105 11% 121 13Exchange list 2010-05-24 3 404 28 7% 135 92010: webcast 7 972 94 10% 139 13Webcast - 2/10/11 3 454 44 10% 151 15Sponsorship summer 2010 1 162 10 6% 162 10One Master Append 2010-06-15 11 2259 132 6% 205 12List 5-5-2011 1 278 31 11% 278 31Final List 2010-06-24 1 578 40 7% 578 40Total 139 11187 992 9% 80 7
Experiment #2: Results 2

29
List Source Leads Calls DM Contacts Contact % Calls/Lead Contact/
Lead Hours Calling Cost Cost/Lead
Webcast 1/18/11 Registered 7 58 10 17% 8 1 6 $ 348 $ 50 Show-6/16/2011 7 151 25 17% 22 4 15 $ 906 $ 129 Webcast 1/18/11 Registered & Attended 3 85 17 20% 28 6 9 $ 510 $ 170 2010 Los Angeles 2 67 10 15% 34 5 7 $ 402 $ 201 Lead List 7.2 42 1550 163 11% 37 4 155 $ 9,300 $ 221 Document Review 1 43 6 14% 43 6 4 $ 258 $ 258 List 4/12/2011 2 87 8 9% 44 4 9 $ 522 $ 261 Prospects_Bay Area_CA 4 185 14 8% 46 4 19 $ 1,110 $ 278 2011 New York 8 372 48 13% 47 6 37 $ 2,232 $ 279 Phase 2 list 5 245 28 11% 49 6 25 $ 1,470 $ 294 Event list 5.5.2011 2 112 15 13% 56 8 11 $ 672 $ 336 Google campaign 5-4-2011 1 62 3 5% 62 3 6 $ 372 $ 372 2010 – Booth 9/23/10 3 267 18 7% 89 6 27 $ 1,602 $ 534 Show - 5/20/2010 1 89 4 4% 89 4 9 $ 534 $ 534 Phase 1 list 4 416 24 6% 104 6 42 $ 2,496 $ 624 Notes list 2010-05-24 7 753 62 8% 108 9 75 $ 4,518 $ 645 Expo and Conference 2010 5 570 53 9% 114 11 57 $ 3,420 $ 684 Annual meeting 2010-11-15 8 968 105 11% 121 13 97 $ 5,808 $ 726 Exchange list 2010-05-24 3 404 28 7% 135 9 40 $ 2,424 $ 808 2010: webcast 7 972 94 10% 139 13 97 $ 5,832 $ 833 Webcast - 2/10/11 3 454 44 10% 151 15 45 $ 2,724 $ 908 Sponsorship summer 2010 1 162 10 6% 162 10 16 $ 972 $ 972 One Master Append 2010-06-15 11 2259 132 6% 205 12 226 $ 13,554 $ 1,232 List 5-5-2011 1 278 31 11% 278 31 28 $ 1,668 $ 1,668 Final List 2010-06-24 1 578 40 7% 578 40 58 $ 3,468 $ 3,468 Total 139 11187 992 9% 80 7 1119 $ 67,122 $ 483
Experiment #2: Results 2

30
Experiment #2: Results (not prioritized)
List Source Leads Calls DM Contacts Contact % Calls/Lead Contact/
Lead Hours Calling Cost Cost/Lead
2010 – Booth 9/23/10 3 267 18 7% 89 6 27 $ 1,602 $ 534 Show - 5/20/2010 1 89 4 4% 89 4 9 $ 534 $ 534 Phase 1 list 4 416 24 6% 104 6 42 $ 2,496 $ 624 Notes list 2010-05-24 7 753 62 8% 108 9 75 $ 4,518 $ 645 Expo and Conference 2010 5 570 53 9% 114 11 57 $ 3,420 $ 684 Annual meeting 2010-11-15 8 968 105 11% 121 13 97 $ 5,808 $ 726 Exchange list 2010-05-24 3 404 28 7% 135 9 40 $ 2,424 $ 808 2010: webcast 7 972 94 10% 139 13 97 $ 5,832 $ 833 Webcast - 2/10/11 3 454 44 10% 151 15 45 $ 2,724 $ 908 Sponsorship summer 2010 1 162 10 6% 162 10 16 $ 972 $ 972 One Master Append 2010-06-15 11 2259 132 6% 205 12 226 $ 13,554 $ 1,232 List 5-5-2011 1 278 31 11% 278 31 28 $ 1,668 $ 1,668 Final List 2010-06-24 1 578 40 7% 578 40 58 $ 3,468 $ 3,468 Total 55 8170 645 8% 149 12 817 $ 49,020 $ 891
2

31
List Source Leads Calls DM Contacts Contact % Calls/Lead Contact/
Lead Hours Calling Cost Cost/Lead
Webcast 1/18/11 Registered 7 58 10 17% 8 1 6 $ 348 $ 50 Show-6/16/2011 7 151 25 17% 22 4 15 $ 906 $ 129 Webcast 1/18/11 Registered & Attended 3 85 17 20% 28 6 9 $ 510 $ 170 2010 Los Angeles 2 67 10 15% 34 5 7 $ 402 $ 201 Lead List 7.2 42 1550 163 11% 37 4 155 $ 9,300 $ 221 Document Review 1 43 6 14% 43 6 4 $ 258 $ 258 List 4/12/2011 2 87 8 9% 44 4 9 $ 522 $ 261 Prospects_Bay Area_CA 4 185 14 8% 46 4 19 $ 1,110 $ 278 2011 New York 8 372 48 13% 47 6 37 $ 2,232 $ 279 Phase 2 list 5 245 28 11% 49 6 25 $ 1,470 $ 294 Event list 5.5.2011 2 112 15 13% 56 8 11 $ 672 $ 336 Google campaign 5-4-2011 1 62 3 5% 62 3 6 $ 372 $ 372 Total 84 3017 347 12% 36 4 301.7 $ 18,102 $ 216
Experiment #2: Results (prioritized) 2

Approach Calls/Lead Cost/Lead
Worst Case 149 $891Average 80 $483Optimized 36 $216Difference 113 $675
What you need to understand: The overall calling cost per lead would decrease by 76% if the calling team focused on the client’s most efficient lists.
32
Results
!
75% Decrease in calling cost per lead
2

Segment, score and prioritize: takeaways
• You don't always need to start with a new list. You can optimize the ROI from your current lists by testing and prioritizing.
• Testing lists gives you the ability to guide your present and future marketing initiatives.
• Over time, testing will reveal patterns customer behavior.
• However, in your testing, don’t neglect qualitative analysis (e.g., conversations, questions, objections)
2

34
List Quality Guidelines
Bad: A disqualified lead for every 25 calls
Average: A disqualified lead for every 50 calls
Better: A disqualified lead for every 100 calls
Bad: A sales lead for every 100 calls
Average: A sales lead for every 50 calls
Better: A sales lead for every 25 calls
Dials to Sale: LOWER is better
Dials to Disqualifications: HIGHER is better
2

Identify the right companies and people
Segment, score and prioritize
Nurture regardless of time to buy
1
2
4
Optimizing the Lead
Initiate a memorable conversation3

36
Timing+
Relevance
Memorable
3

37
Timing+
Relevance
Memorable
TIME YOUR TOUCHES
3

38
Lead Generation Model
INQUIRY CUSTOMER
Identify Need
Make Decision
3

39
Lead Generation Model
INQUIRY CUSTOMERLEAD
Research Solutions
Identify Need
Make Decision
3

40
Lead Generation Model
INQUIRY CUSTOMERLEAD SALES-READY LEAD
Research Solutions
Develop Short List
Identify Need
Make Decision
3

41
Lead Generation Model
INQUIRY CUSTOMERQUALIFIED PROSPECT
LEAD SALES-READY LEAD
Research Solutions
Develop Short List
Identify Need
Review Proposals
Make Decision
3

42
Lead Generation Model
INQUIRY CUSTOMERQUALIFIED PROSPECT
LEAD SALES-READY LEAD
Research Solutions
Develop Short List
Identify Need
Review Proposals
Make Decision
BrandingAdvertising
PR
SEOWebsite
Direct Mail
Events Tradeshows
Webinars
Outbound calls
Inbound 800#
Lead Nurture
Opt-in Email
Conference Calls
Face to Face
Follow-up
3

43
Lead Generation Model
INQUIRY CUSTOMERQUALIFIED PROSPECT
LEAD SALES-READY LEAD
Research Solutions
Develop Short List
Identify Need
Review Proposals
Make Decision
BrandingAdvertising
PR
SEOWebsite
Direct Mail
Outbound calls
Inbound 800#
Lead Nurture
Opt-in Email
Conference Calls
Face to Face
Follow-up
Broadly TargetedLess InteractiveLess Measurable
Narrowly TargetedHighly Interactive
Highly Measurable
3
Events Tradeshows
Webinars

44
Multi-modal Lead Generation3

Identify the right companies and people
Segment, score and prioritize
Initiate a memorable conversation
1
2
3
Optimizing the Lead
Nurture regardless of time to buy4

46
Case Study
Background: An IT management firm engaged MECLABS for lead generation
$80 million annual revenue100 channel partners27 sales people, 10 marketers
Objective: To determine if basic lead management can improve pipeline
Test Design: Creation of a ULD, lead qualification, lead nurturing, clear lead handoff and feedback process.
Experiment ID: IT desktop management firmLocation: MECLABS Leads Group Research LibraryTest Protocol: LG4028
Research Notes:
4

Case Study: Challenges
• < 2% lead-to-sale pipeline conversion• Marketing felt leads were going into a “black hole”• No closed-loop feedback process• Unable to measure ROI
More activity but the same results*
4

48
Case Study: The approach
Closed Loop Feedback
Marketing Pipeline
Sales Pipeline
Customers
Returned Prospects
Events, Events, Summits, Guides, Subscribers, Website, Teleprospecting
Sales Ready Leads
Not a Fit
Sales Generated
Leads
Existing Clients
CRM
Measure ROI
HANDOFF
Level 3,4,5 Leads
Inquiries (Level 1)
Nurturing (Level 2)
4

49
Case Study: Results
375% Increase in sales-ready leads
200% Improved lead-to-sales opportunity
$4.9 M Additional sales pipeline in 8 months
4

50
Case Study: Results
375% Increase in sales-ready leads
200% Improved lead-to-sales opportunity
$4.9M Additional sales pipeline in 8 months
What you need to understand: By actively nurturing and closing the loop, improved lead to sales opportunity and pipeline increases are achieved*
4

51
Understand Audience
Organize Content
Track Results and
Engagement
Execute Tracks
Messaging Strategy
A relevant, consistent conversation with viable potential customers, regardless of their timing to buy.
• Touch• Track• Follow-
Up1
• Touch• Track• Follow-
Up2
• Touch• Track• Follow-
Up3
• Touch• Track• Follow-
Up4
Progressive Lead Movement Across Buying Stages
What is lead nurturing?4

52
Align messaging to roles and needs
Connect with your personas:• Project Leader• CIO• Contact Center• Field Service Center• Executive Sponsor• Stakeholders
CIO Q1
Month 1 Free executive report via direct mail with follow-up call
Month 2 Invitation to executive roundtable via email with follow-up call
Month 3 Link to relevant Podcast via email with follow-up voicemail
IT Director Q1
Month 1 3rd party article via email and voicemail
Month 2 3rd party article via email with follow-up
Month 3 Link to relevant webinar via email with follow-up call
IT Manager Q1
Month 1 Relevant white paper via email with voicemail
Month 2 Direct mail piece
Month 3 Invitation to webcast via email with follow-up call
Multi-track lead nurturing timeline
Client Plan for Q1 Audience: 3 Contacts Deep
4

53
Align messaging to roles and needs
Connect with your personas:• Project Leader• CIO• Contact Center• Field Service Center• Executive Sponsor• Stakeholders
CIO Q1
Month 1 Free executive report via direct mail with follow-up call
Month 2 Invitation to executive roundtable via e-mail with follow-up call
Month 3 Link to relevant Podcast via e-mail with follow-up voicemail
IT Director Q1
Month 1 3rd party article via e-mail and voice mail
Month 2 3rd party article via e-mail with follow-up
Month 3 Link to relevant webinar via e-mail with follow-up call
IT Manager Q1
Month 1 Relevant white paper via e-mail with voice mail
Month 2 Direct mail piece
Month 3 Invitation to webcast via e-mail with follow-up call
Multi-track lead nurturing timeline
Client Plan for Q1 Audience: 3 Contacts Deep
BUILD YOURTRACKS
4

54
Repurpose quality content
Research chart
4

55
Repurpose quality content
Tactical tool download
Blog post
Video clipWebinar
Research chart
4

56
Measure and refine
Tactical tool download
Blog post
Video clipWebinar
Research chart
RegistrantsAttendees
Replays
ViewsLikes/DislikesSocial Shares
Page viewsComments
Social Shares
OpensClickthroughs
Shares
DownloadsSocial SharesLead Capture
4

Optimizing the Lead
Identify the right companies and people
Segment, score and prioritize
Initiate a memorable conversation
Nurture regardless of time to buy
1
2
3
4

58
Takeaways: Identify
Collaborate with your sales team to determine and do list testing
1

59
Takeaways: Prioritize
Set up a process that allows your team to increase pipeline velocity
2
60
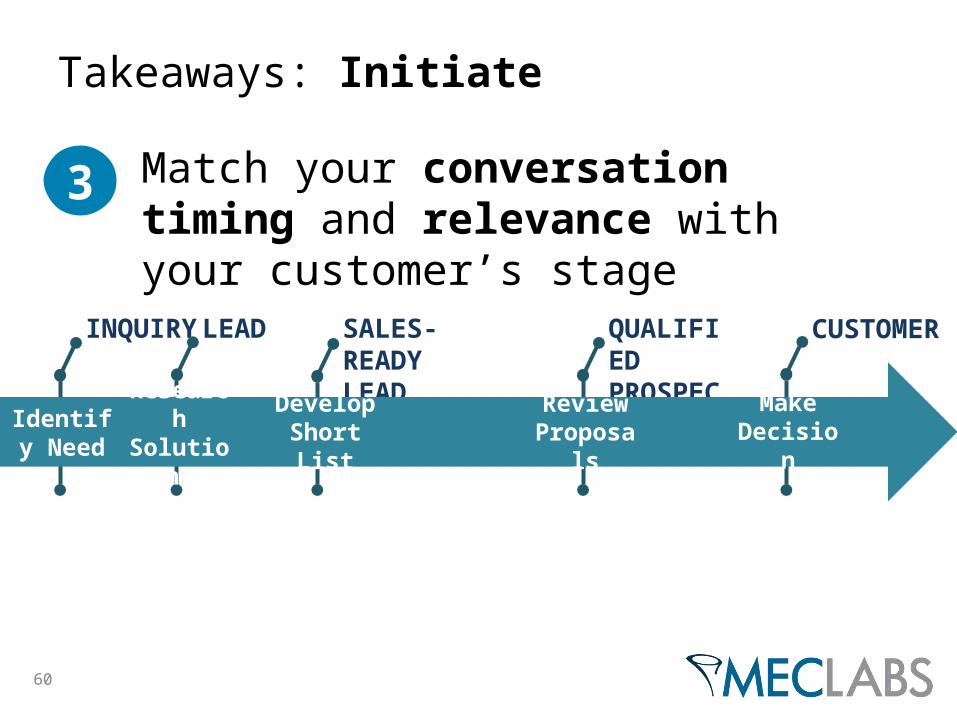
Takeaways: Initiate
Match your conversation timing and relevance with your customer’s stage
3
INQUIRY CUSTOMERQUALIFIED PROSPECT
LEAD SALES-READY LEAD
Research Solutions
Develop Short List
Identify Need
Review Proposals
Make Decision

61
Takeaways: Nurture
Nurture leads, regardless of time to buy4

62
Submit your Research Application:MECLABS.com/contact

Questions?

A data-driven optimization process that goes beyond lead capture
Optimizing the Lead
Brian CarrollExecutive Director, Revenue OptimizationMECLABS

![[1998] 3 R.C.S. SUCCESSION ORDON c. GRAIL 437 · Jane Carroll, Marie Suzanne Carroll, Joan Gregory Carroll, Margaret Jane Carroll, Shelagh Carroll and Laing Douglas Marie Suzanne](https://img.dokumen.tips/doc/110x75/5e89eca40a561e2394069fac/1998-3-rcs-succession-ordon-c-grail-437-jane-carroll-marie-suzanne-carroll.jpg)