Embed Size (px)
Citation preview

1

2
TABLE OF CONTENTS
Cover Page 1
Report Objective 3
Company Background 3
Dividend Discount Method 3
Beta Selection 3
Security Market Line 5
Dividend Growth 5
Stock Valuation Based on Dividend Growth 6
Free Cash Flow Method 9
Forecasted Financial Statements 10
Sales Growth 10
Percent of Sales Ratios 11
Forecasting the Income Statement 11
Forecasting the Balance Sheet 12
Calculation of Free Cash Flows 12
Calculation of WACC 13
Discounted Free Cash Flows 13
Intrinsic Value Based on Free Cash Flows 14
Free Cash Flow Method Interpretation 14
Comparables Method 14
Comparables Method Interpretation 15
Nike’s Intrinsic Stock Price 16
Sensitivity Analysis 17
Scenario Analysis 18
Conclusion 19
Works Cited 20
3
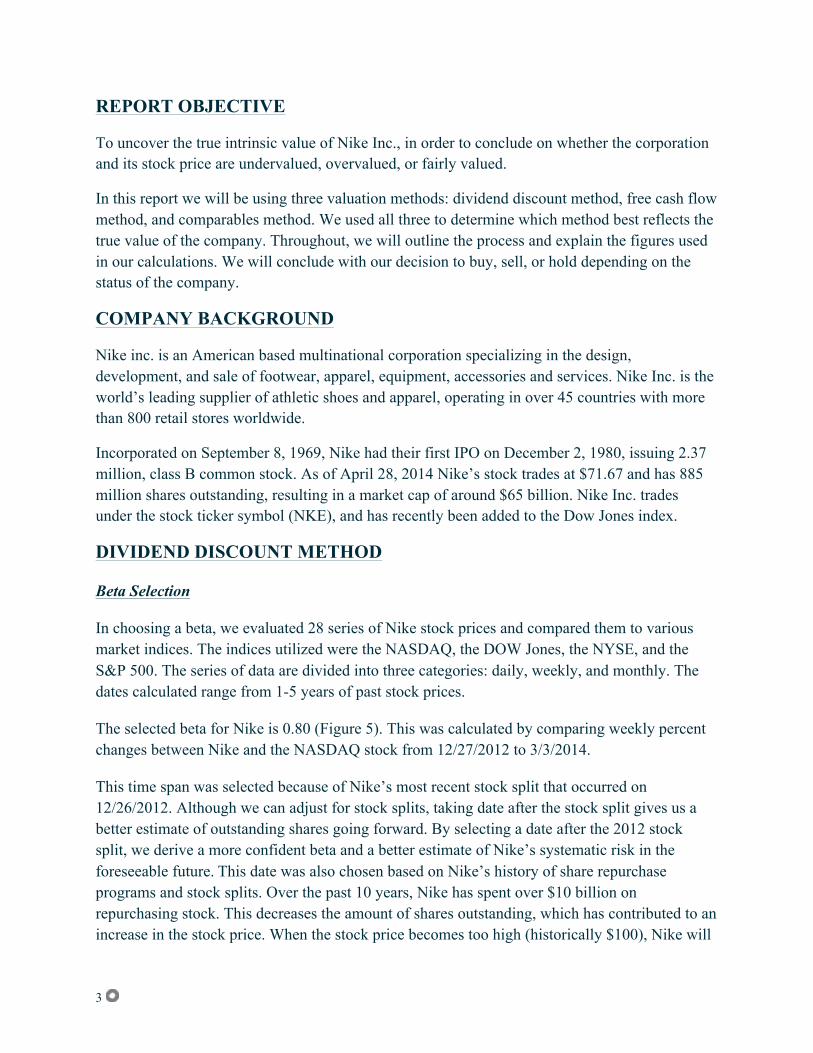
REPORT OBJECTIVE
To uncover the true intrinsic value of Nike Inc., in order to conclude on whether the corporation and its stock price are undervalued, overvalued, or fairly valued.
In this report we will be using three valuation methods: dividend discount method, free cash flow method, and comparables method. We used all three to determine which method best reflects the true value of the company. Throughout, we will outline the process and explain the figures used in our calculations. We will conclude with our decision to buy, sell, or hold depending on the status of the company.
COMPANY BACKGROUND
Nike inc. is an American based multinational corporation specializing in the design, development, and sale of footwear, apparel, equipment, accessories and services. Nike Inc. is the world’s leading supplier of athletic shoes and apparel, operating in over 45 countries with more than 800 retail stores worldwide.
Incorporated on September 8, 1969, Nike had their first IPO on December 2, 1980, issuing 2.37 million, class B common stock. As of April 28, 2014 Nike’s stock trades at $71.67 and has 885 million shares outstanding, resulting in a market cap of around $65 billion. Nike Inc. trades under the stock ticker symbol (NKE), and has recently been added to the Dow Jones index.
DIVIDEND DISCOUNT METHOD
Beta Selection
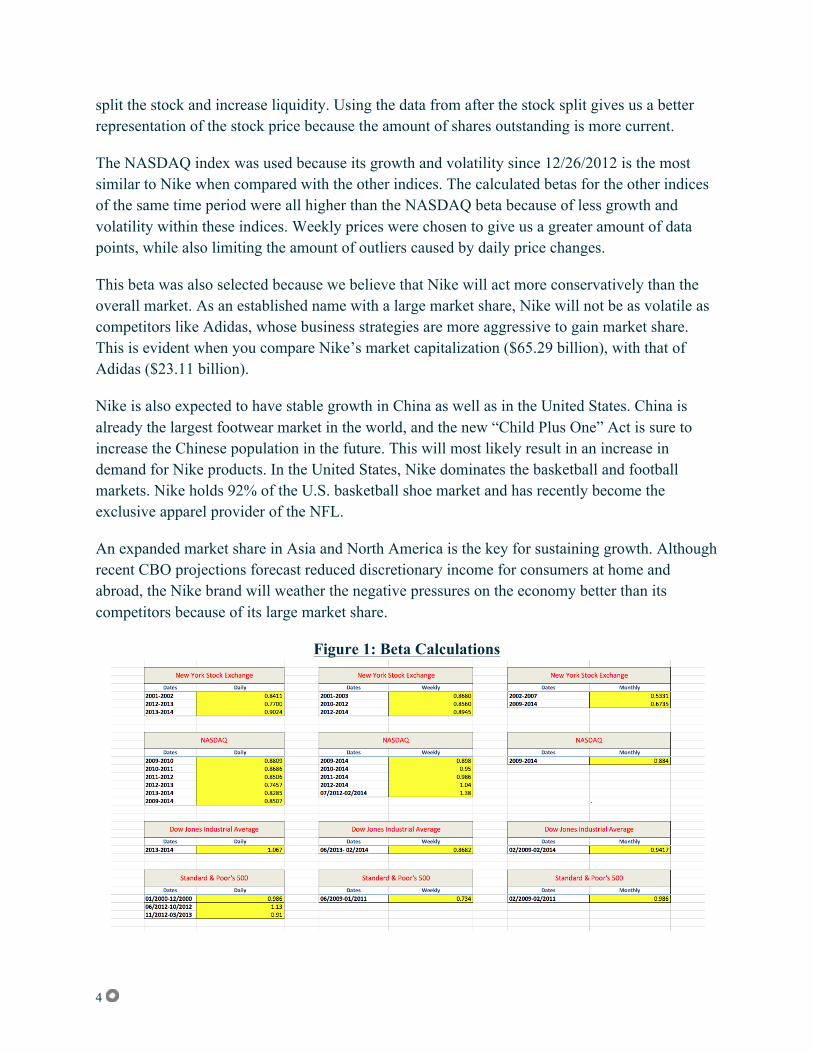
In choosing a beta, we evaluated 28 series of Nike stock prices and compared them to various market indices. The indices utilized were the NASDAQ, the DOW Jones, the NYSE, and the S&P 500. The series of data are divided into three categories: daily, weekly, and monthly. The dates calculated range from 1-5 years of past stock prices.
The selected beta for Nike is 0.80 (Figure 5). This was calculated by comparing weekly percent changes between Nike and the NASDAQ stock from 12/27/2012 to 3/3/2014.
This time span was selected because of Nike’s most recent stock split that occurred on 12/26/2012. Although we can adjust for stock splits, taking date after the stock split gives us a better estimate of outstanding shares going forward. By selecting a date after the 2012 stock split, we derive a more confident beta and a better estimate of Nike’s systematic risk in the foreseeable future. This date was also chosen based on Nike’s history of share repurchase programs and stock splits. Over the past 10 years, Nike has spent over $10 billion on repurchasing stock. This decreases the amount of shares outstanding, which has contributed to an increase in the stock price. When the stock price becomes too high (historically $100), Nike will
4
split the stock and increase liquidity. Using the data from after the stock split gives us a better representation of the stock price because the amount of shares outstanding is more current.
The NASDAQ index was used because its growth and volatility since 12/26/2012 is the most similar to Nike when compared with the other indices. The calculated betas for the other indices of the same time period were all higher than the NASDAQ beta because of less growth and volatility within these indices. Weekly prices were chosen to give us a greater amount of data points, while also limiting the amount of outliers caused by daily price changes.
This beta was also selected because we believe that Nike will act more conservatively than the overall market. As an established name with a large market share, Nike will not be as volatile as competitors like Adidas, whose business strategies are more aggressive to gain market share. This is evident when you compare Nike’s market capitalization ($65.29 billion), with that of Adidas ($23.11 billion).
Nike is also expected to have stable growth in China as well as in the United States. China is already the largest footwear market in the world, and the new “Child Plus One” Act is sure to increase the Chinese population in the future. This will most likely result in an increase in demand for Nike products. In the United States, Nike dominates the basketball and football markets. Nike holds 92% of the U.S. basketball shoe market and has recently become the exclusive apparel provider of the NFL.
An expanded market share in Asia and North America is the key for sustaining growth. Although recent CBO projections forecast reduced discretionary income for consumers at home and abroad, the Nike brand will weather the negative pressures on the economy better than its competitors because of its large market share.
Figure 1: Beta Calculations

5
Security Market Line
The security market line was calculated by using the CAPM formula, explained below.
SML: ks = krf + β(km −krf )
Where:
ks = cost of equity krf = risk-free rate β = beta km = market rate km − krf = market risk premium
Our risk-free rate is the rate provided for the project: 3.00%.
Our beta is 0.80.
The market risk premium is based on the historical average given by the textbook: 7.8%.
k s = .03 + .80(.108 − .03)
k s = .03 + .80(.078)
ks = 0.0924
ks = cost of equity = 9.24%
Dividend Growth
Dividend prices for the past seven years were taken from Yahoo Finance. The yearly dividend for 2007 was $0.42, and the most recent dividend was $0.90 (Figure 4). By plugging these numbers into a financial calculator, we calculated a dividend growth rate of 13.77%.
N = 6 years of compounding PV = -0.415 FV = 0.9 PMT = 0 I/Y = 13.77

6
Figure 2: Dividend Growth
Nike, Inc.’s calculated dividend growth rate of 13.77% was greater than the cost of capital of equity of 9.24%, which is the reason why it is necessary to utilize the supernormal growth model for the stock price calculation instead of Gordon’s Growth Model. The current growth rate of 13.77% is not sustainable compared to the cost of equity and must be replaced by a long-term growth rate. The long-term growth rate we have selected is 5%. By coming up with a dividend growth rate of 5%, we estimated an aggressive long-term growth rate in order to keep Nike’s stock price elevated. Because of this, we expect that Nike is more than likely going to reward its stockholders for the next five years with increased dividend payments.
Nike, Inc. should also be able to sustain a higher dividend growth rate in the future due to the company’s maturity and little need for a high retention rate to maintain operations. The fact that they have had the ability to repurchase so much stock in recent years is proof of that. Nike has excess cash, and is choosing to return this cash to its investors. For the year ending May 31, 2013, 54% of Nike’s net income went towards repurchasing stock, and 28% was paid in dividends. This also illustrates the notion that Nike has little desire to grow in the short-term, and would rather increase stockholders’ return.
Stock Valuation Based on Dividend Growth
Nike’s estimated intrinsic value is $32.40, but the stock is trading at $71.67 as of April 28, 2014. Our estimated value of Nike is $28 billion, while the market values Nike, Inc. at $63 billion. This spread occurs because Nike has a small dividend relative to the stock price. Because our growth model is based on dividend growth, the stock is overvalued. A buyer looking for dividends would price the stock at a similar price. Nike’s investors are more interested in this stock because of the potential growth and capital gains. A current price-to-earnings ratio of 21.20 clearly

7
indicates that investors are choosing to purchase Nike stock for its steady growth and low risk, rather than for its dividends.
This can be illustrated when you substitute dividends with earnings per share in the growth model. By replacing the $0.90 dividend with the 2013 EPS of $2.69, the NPV of the stock becomes $96.84, resulting in a market undervaluation of $25.17.
In conclusion, we feel that this stock is a sell based on the dividend-discount method.
Figure 3: Supernormal Dividend Growth Model

8
Figure 4: Dividend payments from 2007 - 2014
9
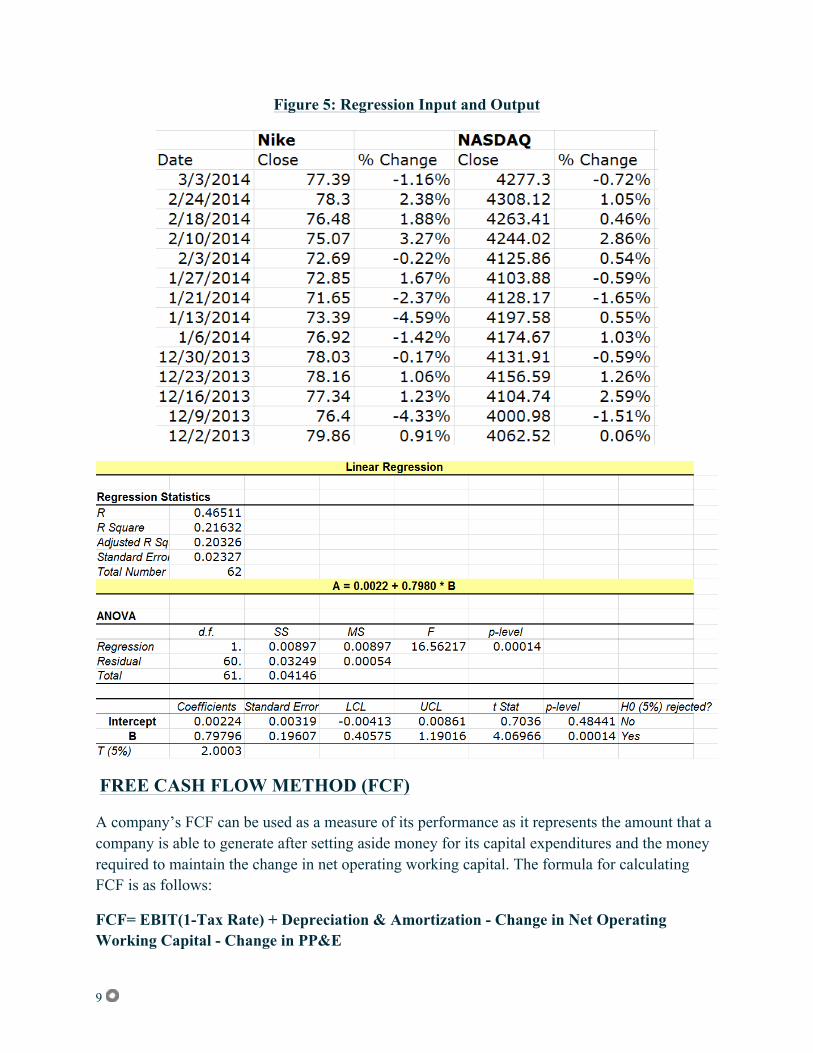
Figure 5: Regression Input and Output
FREE CASH FLOW METHOD (FCF)
A company’s FCF can be used as a measure of its performance as it represents the amount that a company is able to generate after setting aside money for its capital expenditures and the money required to maintain the change in net operating working capital. The formula for calculating FCF is as follows:
FCF= EBIT(1-Tax Rate) + Depreciation & Amortization - Change in Net Operating Working Capital - Change in PP&E

10
Forecasted Financial Statements
Using the FCF method, we are able to assess Nike’s performance by projecting its growth for the next five years, from 2013-2018. Once we forecast Nike’s financial statements and calculate the FCF’s, we can estimate its intrinsic value.
We based our calculations on 10 years of historical financial data for Nike, obtained from Mergent Online.
Sales Growth
In order to proceed with forecasting financial statements, we first need to project Nike’s growth rate. We calculated a growth rate based upon the values of Nike’s growth in sales over the past 10 years using a natural log regression. While this growth rate calculated to 7.95%, a higher growth rate is needed to accurately represent Nike’s future growth. This is because this range includes the 2008-2009 recession.
By taking a natural log regression from 2010-2013, we derived a rate of 10.56% (Figure 6). This date range was used because it calculates Nike’s growth after the recession of 2008-2009. This range was also used because it includes the 2012 Olympics, which lead to a large increase in sales for Nike. In 2016, Nike once again will sponsor the Olympics. This will most likely lead to a sales increase similar to 2012’s.
Because we are two years from the 2016 Olympics, taking a growth rate starting two years before the 2012 Olympics (2010) should give us an accurate estimate of growth for the next five years. This growth rate of 10.56% was used to determine Nike’s revenue growth through 2018. The growth rate then decreases to a long-term rate of 3%.
Figure 6: Sales Growth
11
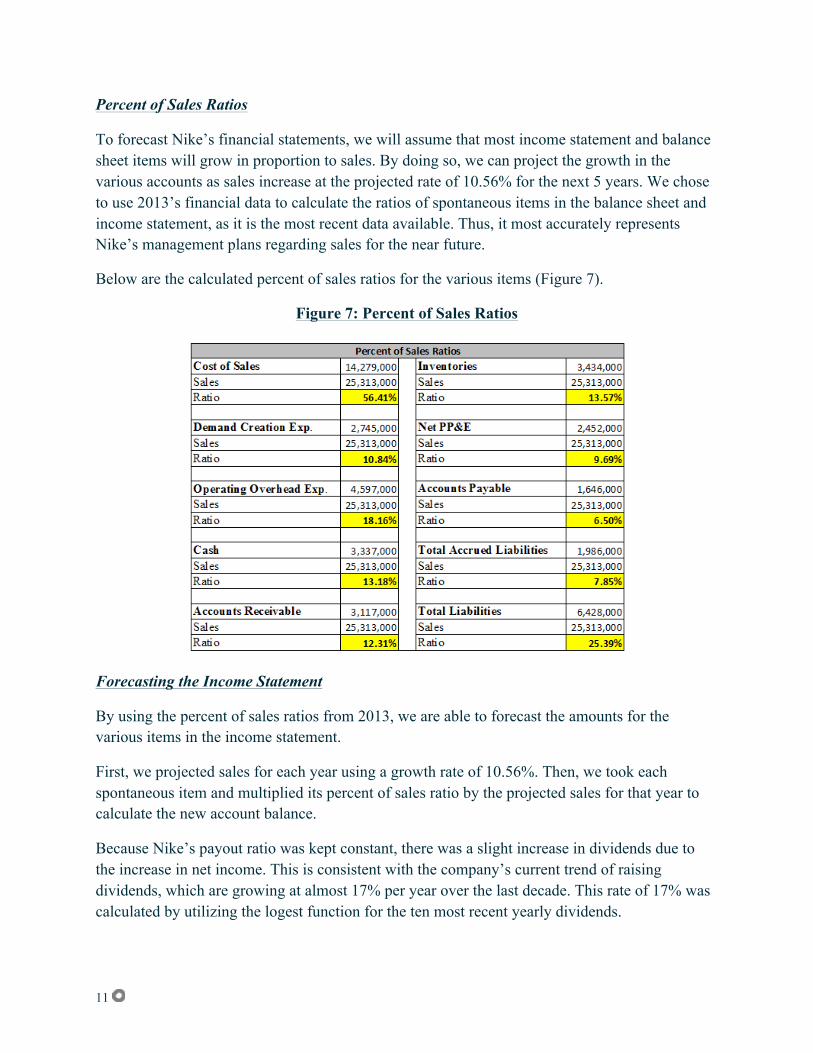
Percent of Sales Ratios
To forecast Nike’s financial statements, we will assume that most income statement and balance sheet items will grow in proportion to sales. By doing so, we can project the growth in the various accounts as sales increase at the projected rate of 10.56% for the next 5 years. We chose to use 2013’s financial data to calculate the ratios of spontaneous items in the balance sheet and income statement, as it is the most recent data available. Thus, it most accurately represents Nike’s management plans regarding sales for the near future.
Below are the calculated percent of sales ratios for the various items (Figure 7).
Figure 7: Percent of Sales Ratios
Forecasting the Income Statement
By using the percent of sales ratios from 2013, we are able to forecast the amounts for the various items in the income statement.
First, we projected sales for each year using a growth rate of 10.56%. Then, we took each spontaneous item and multiplied its percent of sales ratio by the projected sales for that year to calculate the new account balance.
Because Nike’s payout ratio was kept constant, there was a slight increase in dividends due to the increase in net income. This is consistent with the company’s current trend of raising dividends, which are growing at almost 17% per year over the last decade. This rate of 17% was calculated by utilizing the logest function for the ten most recent yearly dividends.

12
Forecasting the Balance Sheet
The percent of sales method was also used when calculating Nike’s forecasted balance sheet. Major accounts that correlate with sales include: cash, accounts receivable, inventories, PP&E, accounts payable, and accruals.
When calculating the balance sheet, Nike’s liabilities and stockholder’s equity exceeded their total assets in all 5 years, meaning that the company will have excess capital. Since we cannot determine how Nike will choose to spend these funds, a “plug” account was used in the assets section to balance the accounts. This “plug” account brought our Net New Financing (NNF) to a “0” balance, and no second passes were needed. Detailed adjustments for NNF are shown below (Figure 8).
Figure 8: NNF Adjustments
Calculation of Free Cash Flow (FCF)
Free cash flow was calculated using the following formula:
FCF= EBIT(1-Tax Rate) + Depreciation & Amortization - Change in Net Operating Working Capital - Change in PP&E
Net operating working capital (NOWC) is the difference between current operating assets and current operating liabilities. The formula for NOWC is the following:
NOWC = (Cash + Accounts Receivable + Inventories + Deferred Income Taxes + Prepaid Expenses) - (Accounts Payable + Total Accrued Liabilities + Income Taxes Payable)
Nike’s terminal value is added to the final cash flow to calculate the long-term value of the corporation. The terminal rate used is the expected rate of inflation, 3%. The formula for terminal value is as follows:
Terminal Value = CF^6 / (WACC - terminal rate) = $58,579,104

13
Calculation of Weighted Average Cost of Capital (WACC)
WACC was calculated by taking the weighted average of Nike’s cost of debt and cost of equity.
Nike’s cost of debt was obtained by reviewing the company’s most recent bond issuance. On April 23, 2014, Nike issued $1 billion worth of bonds. The bonds consisted of $500 million of 2.25% 10-year notes, and $500 million of 3.625% 30-year notes. By averaging the two, we derived a cost of debt of 2.94%.
Nike’s cost of equity was determined by our CAPM calculation from our beta project. This rate is 9.24%. Steps for calculating this rate were provided earlier in the Dividend Discount Method.
While Nike’s market capitalization is $65.29 billion, the company declared a stock repurchase of $8 billion in 2012. According to an April 7, 2014 article in the Portland Business Journal, Nike CFO Don Blair stated that Nike has spent $2.5 billion out of this $8 billion. By subtracting the remaining $5.5 billion from Nike’s market capitalization, we derived a future market capitalization of $59.79 billion.
Since 98% of the company’s market cap is equity, most of the WACC is based on the cost of equity, 9.24%. This is all common equity as Nike has no preferred stock.
The tax rate was calculated by dividing 2013’s income tax expense by Nike’s income before taxes.
Tax Rate = Income tax expense (808,000) / Income (3,272,000) = 24.69%
The resulting WACC is 9.10%, shown below(Figure 9).
Figure 9: WACC Calculation
Discounted Free Cash Flows
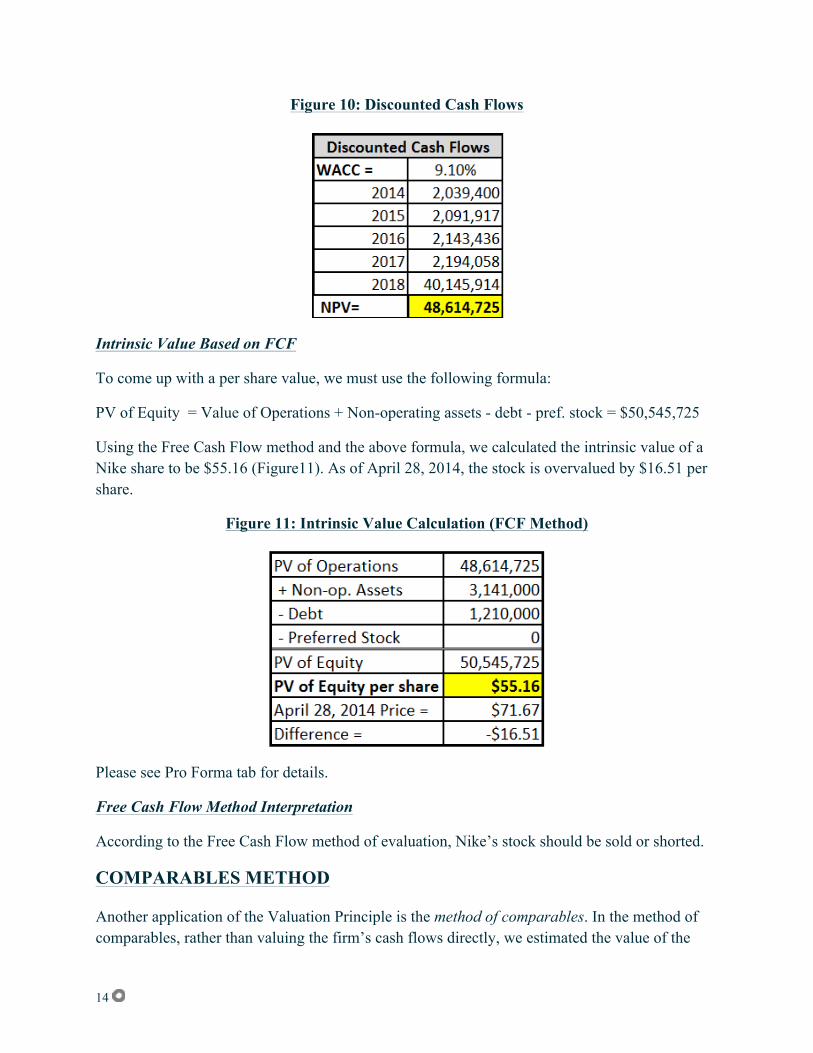
By taking the net present value of the five yearly cash flows, we can derive Nike’s value of operations. To arrive at this present value, we discounted the cash flows at Nike’s weighted cost of capital: 9.10%. The value of operations calculated to $48,614,725 (Figure 10).
14
Figure 10: Discounted Cash Flows
Intrinsic Value Based on FCF
To come up with a per share value, we must use the following formula:
PV of Equity = Value of Operations + Non-operating assets - debt - pref. stock = $50,545,725
Using the Free Cash Flow method and the above formula, we calculated the intrinsic value of a Nike share to be $55.16 (Figure11). As of April 28, 2014, the stock is overvalued by $16.51 per share.
Figure 11: Intrinsic Value Calculation (FCF Method)
Please see Pro Forma tab for details.
Free Cash Flow Method Interpretation
According to the Free Cash Flow method of evaluation, Nike’s stock should be sold or shorted.
COMPARABLES METHOD
Another application of the Valuation Principle is the method of comparables. In the method of comparables, rather than valuing the firm’s cash flows directly, we estimated the value of the

15
firm based on the value of other, comparable firms or investments that we expect will generate very similar cash flows in the future. We obtained Nike valuation ratios and Textile - Apparel Footwear & Accessories industry ratios from Reuters. Some companies listed in this industry include: Adidas, Foot Locker, and Skechers. Industry ratios are credited to Reuters, while Nike ratios have been calculated by our team (Figure 12).
Figure 12: Nike Comparables Ratios
Comparables Method Interpretation
The use of a valuation multiple based on comparables is best viewed as a shortcut. In addition to its simplicity, the multiples approach has the advantage of being based on actual stock prices of real firms, rather than on what may be unrealistic forecasts of future cash flows. However, the most important shortcoming of the comparables approach is that it does not take into account materially important differences among firms.
The price-to-earnings method is unreliable because net income can be manipulated by accountants. The price-to-sales ratio is flawed because it does not take cost of goods sold into consideration. The price-to-book fails because it relies on book value of common equity, not market value.

16
So, we choose the price-to-cash flow ratio as the best multiple, as cash is important to every company. It also adds back depreciation and amortization charges that reduce net income. Thus, Nike’s price of $71.25 is overvalued against the industry by $37.66.
NIKE’S INTRINSIC STOCK PRICE
Intrinsic Value of Nike Corporation Common Stock: $55.16 (FCF Method)
Current market price (4/28/2014): $71.67
Accurate evaluation of a current stock value is critical to any successful investor. The difficulty is that no matter what method you choose to rely on, valuation requires many assumptions about future events. Since these events are impossible to predict correctly, valuation methods require expertise in forecasting economic conditions within business sectors, regions, countries and even geo-political events. On top of this complex range of data, there are fluctuations in currency, central banks manipulating interest rates, and new technology evolving at every turn.
There are numerous methods that analysts utilize, but for the purposes of this project, we focused on three: the Dividend Discount model, the FCF method, and the Comparables method.
First, we used the dividend discount method, which values the current stock value by predicting future dividends and discounting them back to present value. This method gave us a current valuation of $32.40
The second method used was the discounted free cash flow method, whereby we forecasted the sales growth and earnings of Nike, and discounted the free cash flows back to present value by using WACC. We compared our valuation to Nike’s actual valuation in the open market. This method gave us a stock price of $55.16.
Lastly, we used the comparables method. This calculation was based on the price to cash flow ratio. The stock price was computed by taking the industry average of price to cash flow and multiplying it by Nike’s cash flow per share. This resulted in a value of $37.66.
Our group has chosen to use the FCF method as our intrinsic value because we believe it is the most accurate valuation method. This is because it is the most detailed, as it accounts for sales growth, dividend growth, and the company’s cost of capital. This method also calculates its intrinsic value by using the actual income statement and balance sheet of Nike, Inc. These numbers are all relevant and specific to the company.
We chose not to use the other two methods for reasons already listed in this report. The dividend discount model severely undervalued Nike because of their low dividends relative to stock price. The comparative methods is best regarded as a shortcut, and does not take into account future growth.

17
The values of each method are listed below.
Intrinsic Evaluations
*FCF Method $55.16
Comparable Method $37.66
Div Discount Method $32.40
Current Nike Shares $71.67
*Note: All models show an overvaluation of Nike’s current share price, with the FCF Model being our most accurate valuation method.
SENSITIVITY ANALYSIS
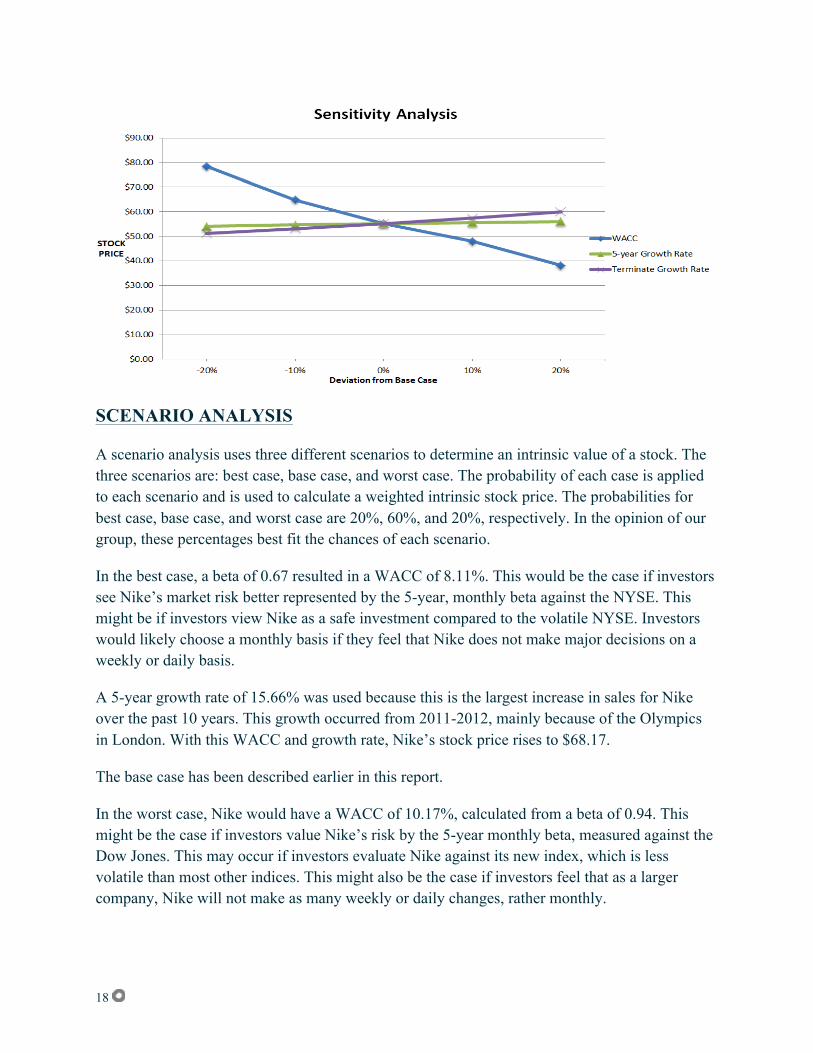
A sensitivity analysis was conducted on Nike’s intrinsic stock price obtained from the free cash flow model. In this analysis, the firm’s WACC, 5-year growth rate, and terminal growth rate were modified in 10% increments to demonstrate the impact it has on the stock price.
This activity demonstrates that changes in WACC have a higher impact on Nike’s stock price than changes in the firm’s growth rates. As WACC increases, the stock price decreases dramatically, whereas changes in 5-year and terminal growth rates cause very little changes in the stock price. This is because a larger WACC translates to a lower present value of the cash flows.
According to the FCF model, in order to increase stock price, Nike’s management must focus on decreasing their cost of capital. Nike has already begun this with their most recent bond issuance, with coupon rates that are “the lowest among similar corporate bonds issued in the U.S. this year (2013), according to recent data compiled by Bloomberg” (Mead, 2013). If Nike can lower their rate of equity also, they will see their stock price rise.
Figure 13: Sensitivity Analysis
18
SCENARIO ANALYSIS
A scenario analysis uses three different scenarios to determine an intrinsic value of a stock. The three scenarios are: best case, base case, and worst case. The probability of each case is applied to each scenario and is used to calculate a weighted intrinsic stock price. The probabilities for best case, base case, and worst case are 20%, 60%, and 20%, respectively. In the opinion of our group, these percentages best fit the chances of each scenario.
In the best case, a beta of 0.67 resulted in a WACC of 8.11%. This would be the case if investors see Nike’s market risk better represented by the 5-year, monthly beta against the NYSE. This might be if investors view Nike as a safe investment compared to the volatile NYSE. Investors would likely choose a monthly basis if they feel that Nike does not make major decisions on a weekly or daily basis.
A 5-year growth rate of 15.66% was used because this is the largest increase in sales for Nike over the past 10 years. This growth occurred from 2011-2012, mainly because of the Olympics in London. With this WACC and growth rate, Nike’s stock price rises to $68.17.
The base case has been described earlier in this report.
In the worst case, Nike would have a WACC of 10.17%, calculated from a beta of 0.94. This might be the case if investors value Nike’s risk by the 5-year monthly beta, measured against the Dow Jones. This may occur if investors evaluate Nike against its new index, which is less volatile than most other indices. This might also be the case if investors feel that as a larger company, Nike will not make as many weekly or daily changes, rather monthly.

19
In the worst case, Nike was given a 5-year growth rate of 2.95%. This rate comes from 2008-2009, when Nike was forced to deal with the global recession. With this WACC and growth rate, Nike’s stock price drops to $43.30.
Figure 14: Scenario Analysis
CONCLUSION
Nike’s stock price is overvalued, thus leading to our decision to sell. As of April 28, 2014, Nike is trading at $71.67, $16.51 more than our calculated intrinsic stock price of $55.16 (FCF Method). We chose this price because we believe that the FCF method is the most accurate method of stock evaluation. When comparing Nike’s stock price to its intrinsic value using three valuation methods, all three resulted in values lower than what Nike is currently trading at.
Our position to sell is further confirmed by the decrease in stock price since we started this project. From February 26, 2014, to April 28, 2014, Nike’s stock price has dropped from $78.42 to $71.67.
While we believe that Nike stock should be sold today, it may be a stable investment in the near future. If the corporation continues to repurchase shares and increase dividends, value will be added to investors. Because Nike is already a mature company, one should not invest based on future growth potential or capital gains. Investors must wait until dividends increase and there are fewer outstanding shares.

20
Works Cited
Badenhausen, K. (2012, July 20). Why Nike Owns U.S. Olympic Basketball. Forbes. Retrieved March 12, 2014, from http://www.forbes.com/sites/kurtbadenhausen/2012/07/20/why-nike-owns-us-olympic-basketball/
Business & Financial News, Breaking US & International News | Reuters.com. (n.d.). Reuters. Retrieved April 30, 2014, from http://www.reuters.com/
Congressional Budget Office. (n.d.). The Budget and Economic Outlook: 2014 to 2024. Retrieved March 10, 2014, from http://www.cbo.gov/publication/45010
Demick, B. (2013, November 15). China eases its one-child policy. Los Angeles Times. Retrieved March 10, 2014, from http://articles.latimes.com/2013/nov/15/world/la-fg-china-one-child-20131116
Dillon, D. (n.d.). NFL getting ready to transition to new Nike era for apparel. SI.com. Retrieved March 13, 2014, from http://sportsillustrated.cnn.com/2012/writers/dennis_dillon/04/02/nike/
Kish, M. (2014, April 7). Nike's $8 billion stock buyback passes $2.5 billion - Portland Business Journal. Widgets RSS. Retrieved April 30, 2014, from http://www.bizjournals.com/portland/blog/threads_and_laces/2014/04/nikes-8-billion-stock-buyback-passes-2-5-billion.html?utm_source=feedburner&utm_medium=feed
Mead, C. (2013, April 23). Nike Raises $1 Billion in Bonds With First Debt Sale Since 2003. Bloomberg.com. Retrieved April 30, 2014, from http://www.bloomberg.com/news/2013-04-23/nike-said-to-plan-1-billion-bond-sale-in-first-issue-since-2003.html
Research and Markets: China Footwear Outlook to 2017. (n.d.). Press release distribution, EDGAR filing, XBRL, regulatory filings. Retrieved March 13, 2014, from http://www.businesswire.com/news/home/20130912006282/en/Research-Markets-China-Footwear-Outlook-2017#.UyE6ayhBA20
Siemers, E. (n.d.). Nike announces two-for-one stock split. Widgets RSS. Retrieved March 13, 2014, from http://www.bizjournals.com/portland/blog/threads_and_laces/2012/11/nike-issues-two-for-one-stock-split.html?page=all
Taborek, N. (n.d.). Dow Jones Industrials to Add Goldman Sachs, Nike Shares.Bloomberg.com. Retrieved April 30, 2014, from http://www.bloomberg.com/news/2013-09-10/dow-jones-industrial-average-to-add-goldman-sachs-visa-nike.html
The official corporate website for Nike. (n.d.). NIKE, Inc.. Retrieved March 10, 2014, from http://nikeinc.com/

21
Valuing A Stock With Supernormal Dividend Growth Rates. (n.d.). Investopedia. Retrieved March 13, 2014, from http://www.investopedia.com/articles/fundamental-analysis/11/supernormal-growth-analysis.asp
Warner, M. (2012, September 20). Nike Approves $8 Billion Stock Buyback. The Wall Street Journal. Retrieved April 30, 2014, from http://online.wsj.com/news/articles/SB100008
Yahoo Finance - Business Finance, Stock Market, Quotes, News. (n.d.). Yahoo Finance. Retrieved March 12, 2014, from http://finance.yahoo.com/