Embed Size (px)
Citation preview
SW Dairy Exporters Update
23rd September 2015
Hamish Renton
Best practice exporting
• If focusing on the right markets, exporting can be very valuable.
• Must take advantage of trade grants and maximize trade fairs.
• It is important to get advice on the right people to deal with and consider which products are best to trade.
• Enlist a trade adviser or business partner.
• Persevere in setting up meetings with buyers.
2
3
4
5
6
7
8
9
10
11

Dairy Exports trade focus • Gul Foods show, record British exhibitors and largest ever pavillion.
• Successful FHC show in Shanghai – largest every UK contingent.
• National Dairy Exporters Forum established March 2013 (over 80 companies engaged).
• Close work with DEFRA and Industry to streamline Health Certificate process.
• Dedicated Dairy Exports specialist resource within UKTI helped over 100 companies – another 50 planned.
• Butter deficit heading towards a surplus in the coming years through combination of inward investment and trade support.
• Dairy powder exports volumes seen large increase.
12
So, some solid success…..but more to be done in dairy.
13
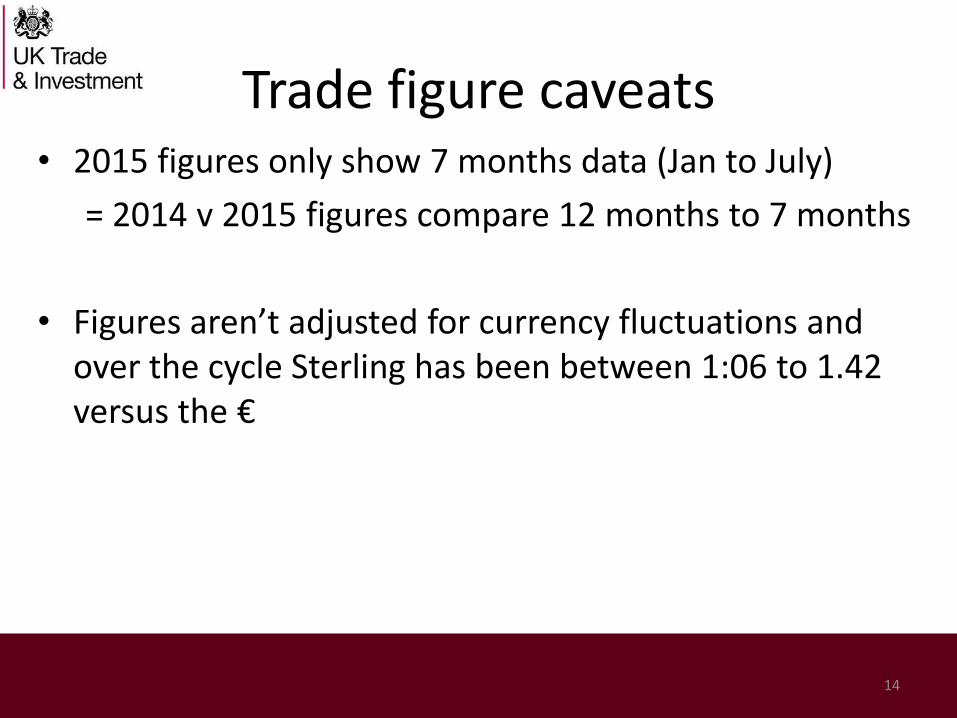
Trade figure caveats • 2015 figures only show 7 months data (Jan to July)
= 2014 v 2015 figures compare 12 months to 7 months
• Figures aren’t adjusted for currency fluctuations and over the cycle Sterling has been between 1:06 to 1.42 versus the €
14

UK Dairy Exports – value (£)
15
• Year on year growth in value terms last 3 years despite Sterling’s appreciation.
• C 70% increase in total exports and trebling of No EU28 exports in 5 year period.
• Trade outside the UK growing faster than within the EU28, but EU28 is key.
2015 = January - July
0
100
200
300
400
500
600
700
800
900
1000
2009 2010 2011 2012 2013 2014 2015
Value (£m)
Year
Exports to out of EU
Exports to EU
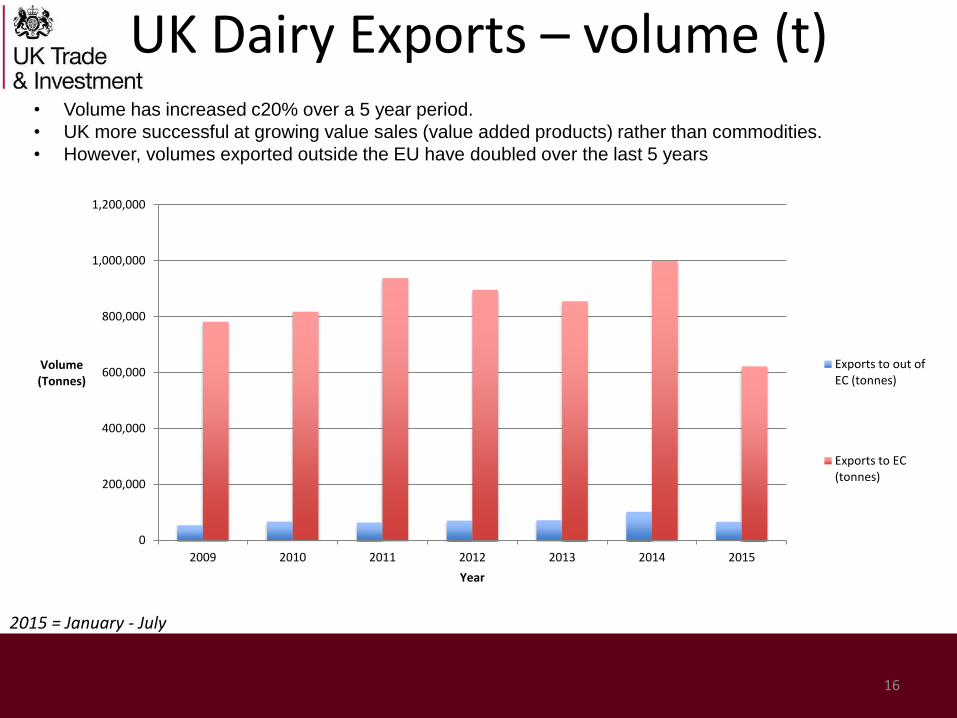
UK Dairy Exports – volume (t)
16
• Volume has increased c20% over a 5 year period.
• UK more successful at growing value sales (value added products) rather than commodities.
• However, volumes exported outside the EU have doubled over the last 5 years
2015 = January - July
0
200,000
400,000
600,000
800,000
1,000,000
1,200,000
2009 2010 2011 2012 2013 2014 2015
Volume (Tonnes)
Year
Exports to out of EC (tonnes)
Exports to EC (tonnes)
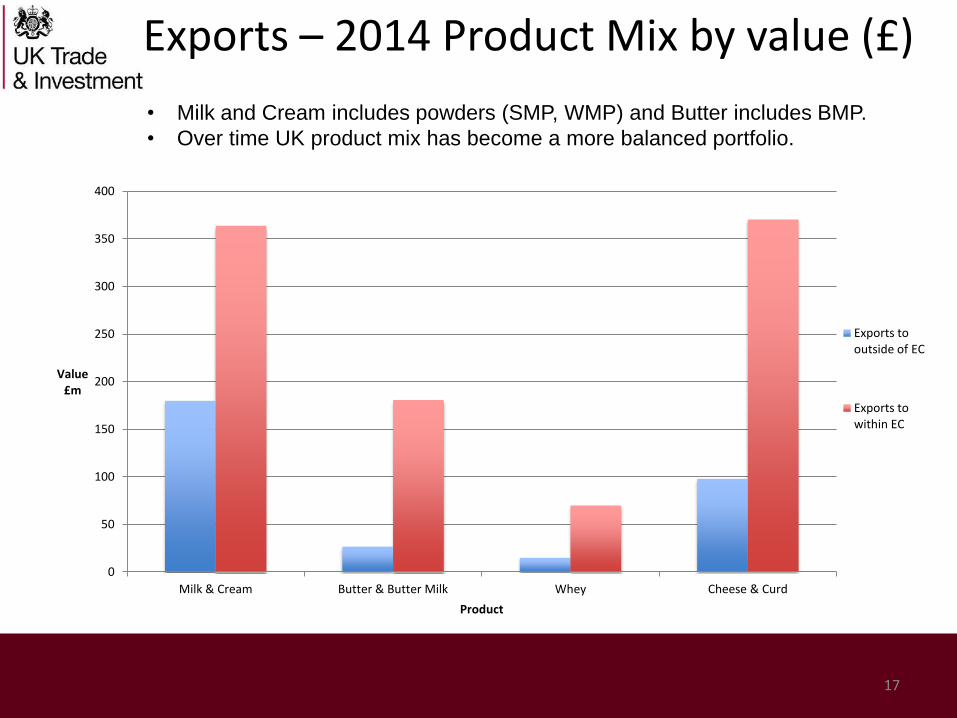
Exports – 2014 Product Mix by value (£)
17
• Milk and Cream includes powders (SMP, WMP) and Butter includes BMP.
• Over time UK product mix has become a more balanced portfolio.
0
50
100
150
200
250
300
350
400
Milk & Cream Butter & Butter Milk Whey Cheese & Curd
Value £m
Product
Exports to outside of EC
Exports to within EC
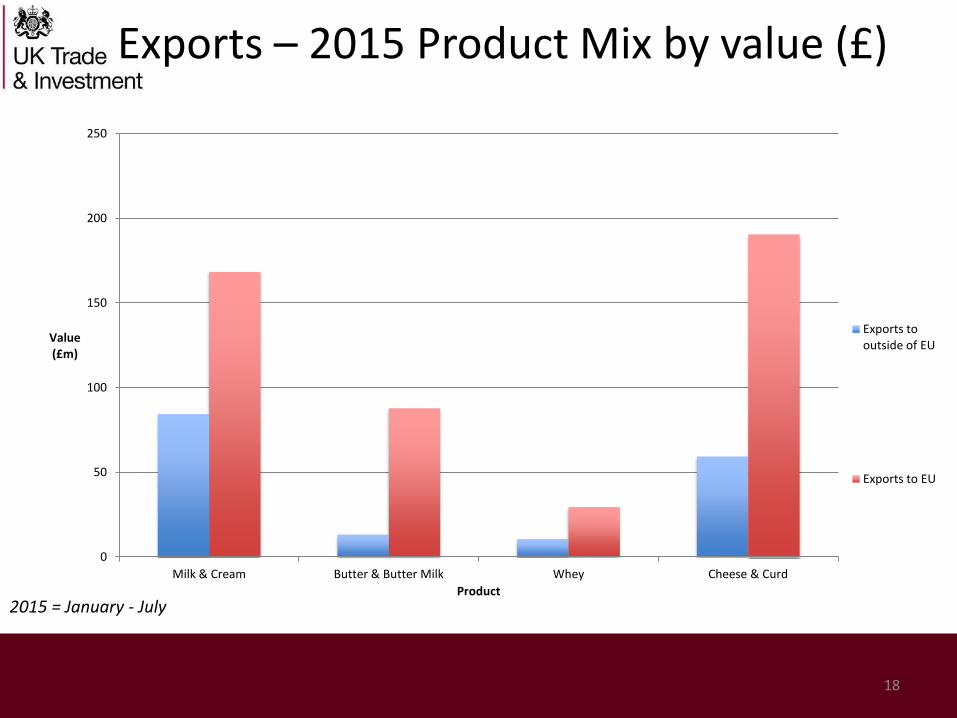
Exports – 2015 Product Mix by value (£)
18
2015 = January - July
0
50
100
150
200
250
Milk & Cream Butter & Butter Milk Whey Cheese & Curd
Value (£m)
Product
Exports to outside of EU
Exports to EU
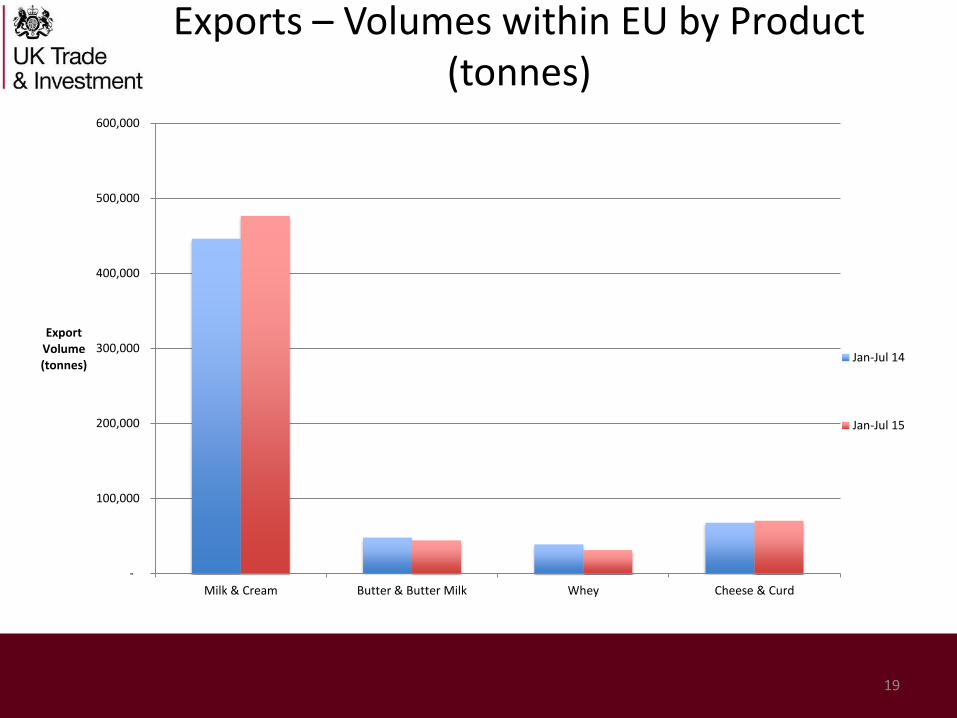
Exports – Volumes within EU by Product (tonnes)
19
-
100,000
200,000
300,000
400,000
500,000
600,000
Milk & Cream Butter & Butter Milk Whey Cheese & Curd
Export Volume (tonnes)
Jan-Jul 14
Jan-Jul 15
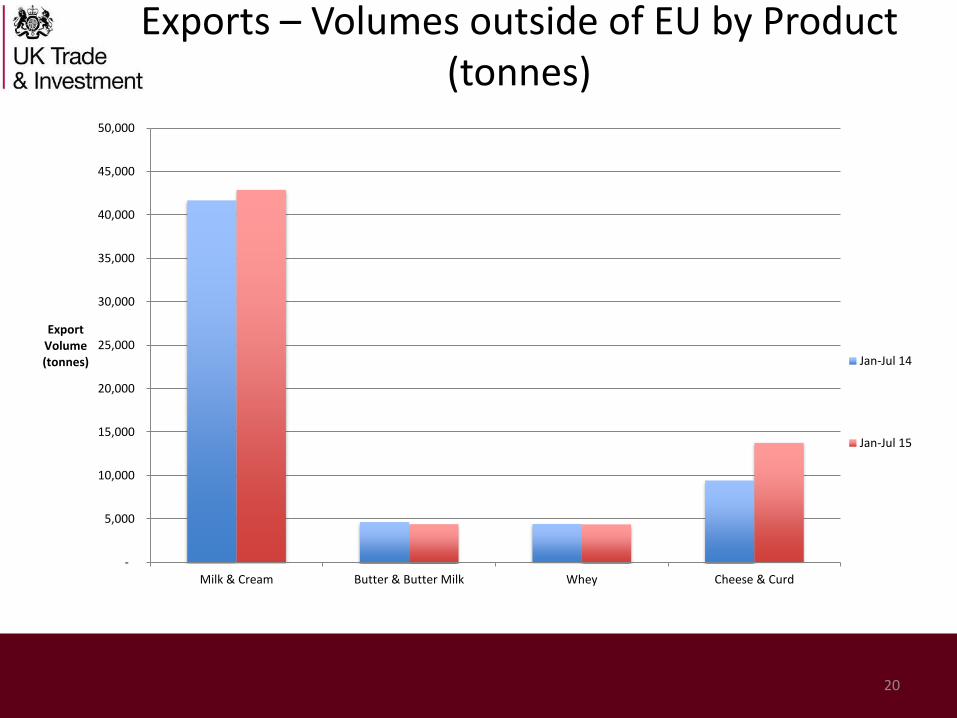
Exports – Volumes outside of EU by Product (tonnes)
20
-
5,000
10,000
15,000
20,000
25,000
30,000
35,000
40,000
45,000
50,000
Milk & Cream Butter & Butter Milk Whey Cheese & Curd
Export Volume (tonnes) Jan-Jul 14
Jan-Jul 15
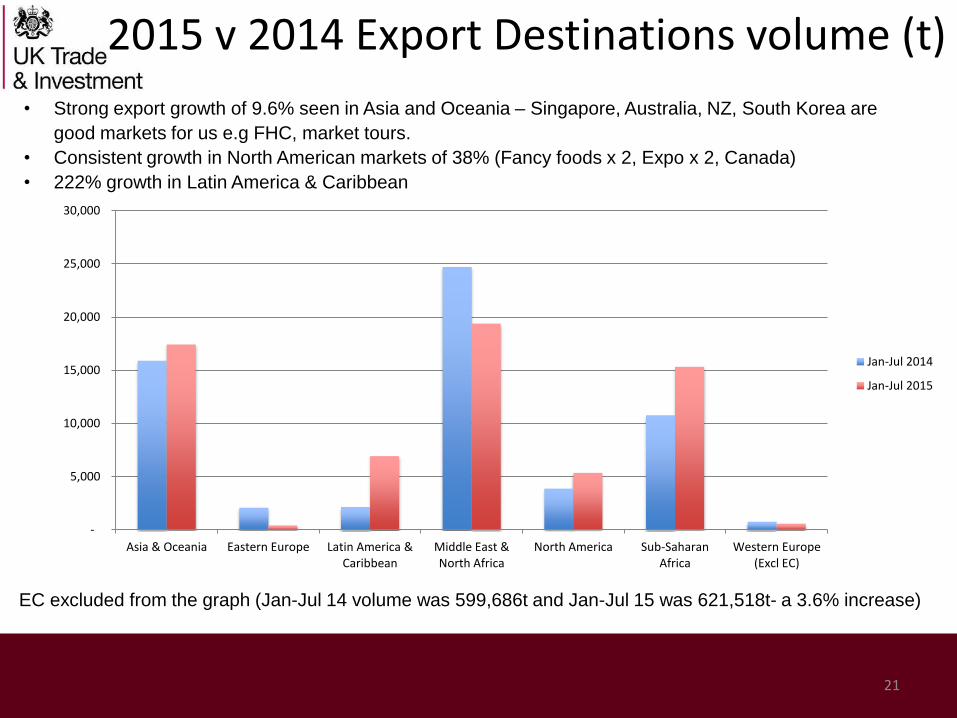
2015 v 2014 Export Destinations volume (t)
21
EC excluded from the graph (Jan-Jul 14 volume was 599,686t and Jan-Jul 15 was 621,518t- a 3.6% increase)
• Strong export growth of 9.6% seen in Asia and Oceania – Singapore, Australia, NZ, South Korea are
good markets for us e.g FHC, market tours.
• Consistent growth in North American markets of 38% (Fancy foods x 2, Expo x 2, Canada)
• 222% growth in Latin America & Caribbean
-
5,000
10,000
15,000
20,000
25,000
30,000
Asia & Oceania Eastern Europe Latin America & Caribbean
Middle East & North Africa
North America Sub-Saharan Africa
Western Europe (Excl EC)
Jan-Jul 2014
Jan-Jul 2015

Top 10 EU Export Destinations (excl. IR)
22
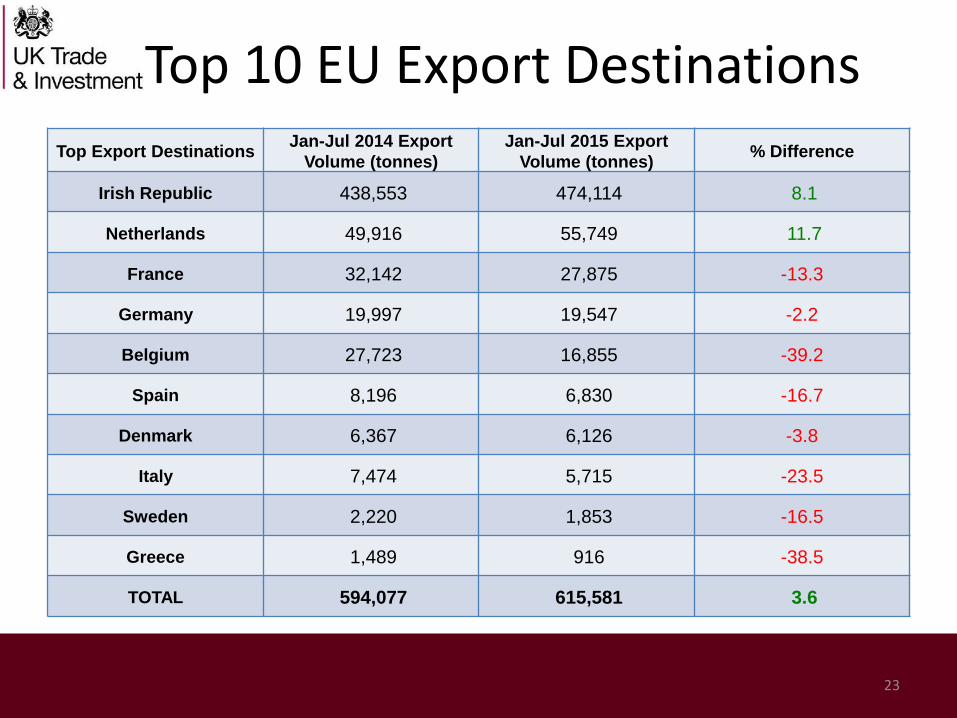
This Top 10 accounts for 99% of UK dairy export volume into the EU. Export volume increased 3.6% in total from 2014, mainly due to a 8.1% increase in volumes exported to Irish Republic. If Irish volumes are excluded, the export volume in the rest of the top has fallen 9% on last year.
-
10,000
20,000
30,000
40,000
50,000
60,000
Netherlands France Germany Belgium Spain Denmark Italy Sweden Greece
Export Volume (tonnes)
Jan-Jul 2014
Jan-Jul 2015
Top 10 EU Export Destinations
23
Top Export Destinations Jan-Jul 2014 Export
Volume (tonnes)
Jan-Jul 2015 Export
Volume (tonnes) % Difference
Irish Republic 438,553 474,114 8.1
Netherlands 49,916 55,749 11.7
France 32,142 27,875 -13.3
Germany 19,997 19,547 -2.2
Belgium 27,723 16,855 -39.2
Spain 8,196 6,830 -16.7
Denmark 6,367 6,126 -3.8
Italy 7,474 5,715 -23.5
Sweden 2,220 1,853 -16.5
Greece 1,489 916 -38.5
TOTAL 594,077 615,581 3.6
Top 10 Non- EU Export Destinations
24
N/A
-
2,000
4,000
6,000
8,000
10,000
12,000
14,000
16,000
18,000
China US Algeria South Africa UAE Cuba Hong Kong Libya Ivory Coast Saudi Arabia
Export Volume (tonnes) Jan-Jul 2014
Jan-Jul 2015

Top 10 Non- EU Export Destinations
25
Top Export Destinations Jan-Jul 2014 Export
Volume (tonnes)
Jan-Jul 2015 Export
Volume (tonnes) % Difference
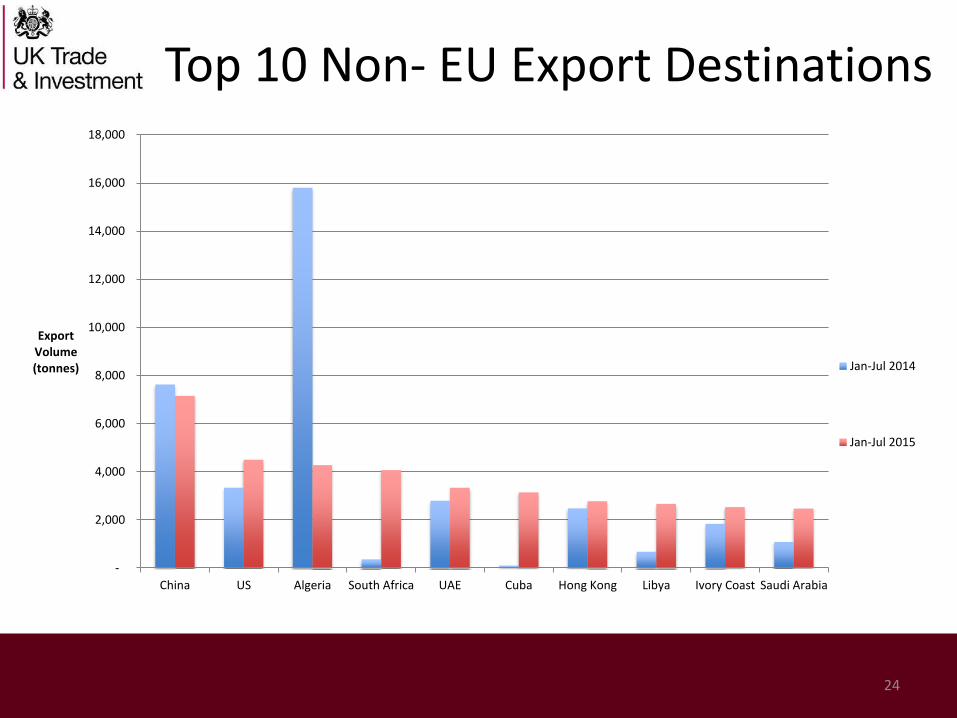
China 7,623 7,154 -6.2
US 3,334 4,496 34.8
Algeria 15,802 4,274 -73.0
South Africa 359 4,068 1,031.8
UAE 2,795 3,333 19.3
Cuba 100 3,140 3,040.0
Hong Kong 2,477 2,774 12.0
Libya 677 2,667 293.9
Ivory Coast 1,831 2,529 38.1
Saudi Arabia 1,082 2,466 127.9
TOTAL 36,081 36,901 2.3
Exports to North America
26
• 72% majority of respondents plan to invest in and engage with new customers in
international markets over the next five years.
• Western Europe is the most popular market for exports, though food and drink companies
are increasingly looking elsewhere, perhaps partly down to the instability of the Eurozone.
• 49% of UK food and drink firms are now looking to North America for export opportunities. It
has overtaken the Far East/Asia as the second market of interest for exporters after Western
Europe.
• Dairy and cheese are largely accountable for this increased interest with £40m of cheese
exports going to the US last year.

TAP Funded Food & Drink Events – 2nd half of 2015/16
27
Event Name Partner to deliver City Country Dates
ANUGA PS8 - Food & Drink Exporters Association (FDEA) Cologne Germany 10/10/15-
14/10/15
Host Milan 2015 Catering Equipment Suppliers Association Milan Italy 23/10/15-
27/10/15
Speciality Food Festival/Sweets Middle
East/Seafex PS8 - Food & Drink Exporters Association (FDEA) Dubai UAE
27/10/15-
29/10/15
Natural Products Scandinavia 2015 Birmingham Chamber of Commerce & Industry Malmo Sweden 01/11/15-
02/11/15
Brau Beviale 2015 Brewing Food & Beverage Industry Suppliers
Association Nuremberg Germany
10/11/15-
12/11-15
FHC - Food & Hotel China PS8 - Food & Drink Exporters Association (FDEA) Shanghai China 11/11/15-
13/11/15
Fi Europe 2015 (food ingredients) Birmingham Chamber of Commerce & Industry Paris France 01/12/15-
03/12/15
Winter Fancy Food PS8 - Food & Drink Exporters Association (FDEA) San Franciso USA 17/01/16-
19/01/16
ISM PS8 - Food & Drink Exporters Association (FDEA) Cologne Germany 31/01/16-
03/02/16
Biofach PS8 - Food & Drink Exporters Association (FDEA) Nuremberg Germany 10/02/16-
13/02/16
Gulfood Catering Equipment Suppliers Association Dubai UAE 21/02/16-
25/02/16
Gulfood PS8 - Food & Drink Exporters Association (FDEA) Dubai UAE 21/02/16-
25/02/16
Foodex PS8 - Food & Drink Exporters Association (FDEA) Tokyo Japan 08/03/16-
11/03/16