Embed Size (px)
Citation preview
Mock Projection of
Financial Statement
Jai Krishnan S14MBA1011
Disclaimer:This report was prepared only for the class purpose for MBA at VIT University (Chennai Campus) as a part of a course. Some values are
modified. Not all values are as per the balance sheet. Source of data are based on internet.

The Profile
• Reliance Communications Ltd. (commonly called RCOM) is an Indian Internet access (commonly called "broadband") and telecommunications company headquartered in Navi Mumbai, India.• RCOM is India's second largest telecom operator, only after Bharti
Airtel. • It is the 15th largest operator with over 150 million subscribers. • Established in 2004, it is a subsidiary of Reliance Group.• The total employees working in Reliance Communication is 18070.• It has customer base of 118 million in mobile communication.

Objective
• To project the P/L A/c.• Projection of Balance Sheet.• Cash Flow / Fund Flow Statement.• A Take Over Proposal.

Fixed Investment Cost of Proposal

Operational Cost

Projected Balance Sheet

Contd..
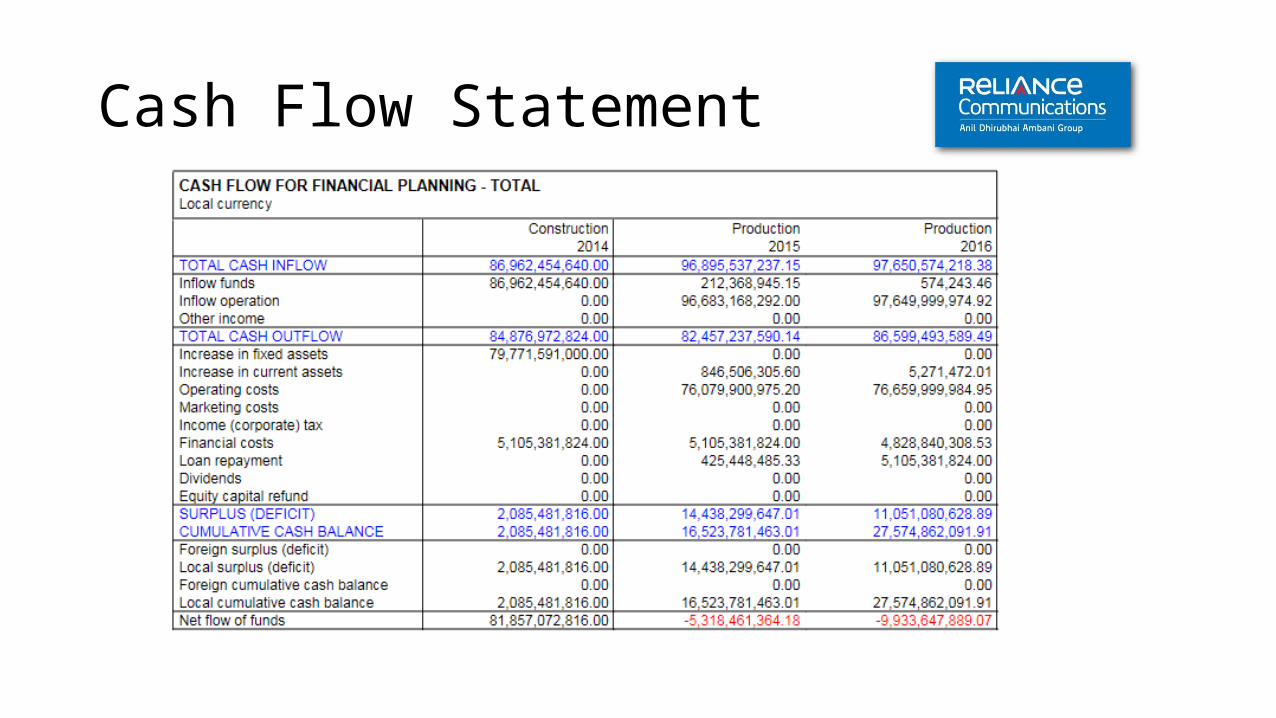
Cash Flow Statement

Contd..

Assumptions
• The sales units is given as 200.• The salary of the labor is given as Rs.5000• The escalation is given as 1%.• The Discounting Factor is given as 10%.

Assumptions
• The Business is assumed to be a Going Concern.Sales (INR) IRR
95,725,909,200.000000 24.71
100,125,909,200.000000 29.97
110,125,909,200.000000 41.9
120,125,909,200.000000 53.82
140,125,909,200.000000 77.64
RAW MATERIAL IRR
3071,77,727.60 19.93
2871,77,727.60 24.71
2571,77,727.60 31.89
2071,77,727.60 43.85

IRR/ MODIFIED IRR
If the Escalation rises from 1% to 6% , then the IRR will increase to 27%

Regression Graph Using SAS

Thank You