Embed Size (px)
Citation preview

www.centennialcoal.com.au
14th Annual Longwall Conference - October 2015
Mick Cairney Executive General Manager Operations
Centennial Coal Company Limited
Surviving the downturn: Challenges & Opportunities

Disclaimer
2
In attending or viewing this presentation you agree to be bound by the following terms and conditions.
This presentation has been prepared by Centennial Coal Company Limited (the Company). This presentation may contain informati on (including information derived from publicly available sources) that has not been independently verified by the Company.
Any forward looking information in this presentation has been prepared on the basis of a number of current assumptions which may ultimately prove to be materially incorrect. Therefore actual results, outcomes and achievements may be materially greater or less than estimated . This presentation should not be relied upon as a forecast by the Company.
Neither the Company nor its directors, officers, employees or advisors make any representation or warranty and accordingly no reliance should be placed on the fairness, accuracy, completeness or reliability of the information contained in this presentation. To the maxim um extent permitted by law, the Company its directors, officers, employees or advisors do not accept any liability for any errors, omissions or loss (inc luding because of negligence or otherwise) arising, directly or indirectly, from any use of this presentation or information contained in this presentation.
This presentation is for information purposes only and does not constitute or form part of any offer for sale or issue for any securities or an offer or invitation to purchase or subscribe for any such securities.
This presentation and its contents must not be distributed, transmitted or viewed by any person in any jurisdiction where the distribution, transmission or viewing of this presentation would be unlawful under the securities or other laws of that or any other jurisdiction.
This presentation and its content is not intended to be relied upon as advice to investors or potential investors and does no t take into account an individual investor’s investment objectives or financial situation. Investors or potential investors should consider their individual circumstances and consult professional advisors where appropriate.
All financial data is expressed in Australian dollars unless otherwise stated.

95% of Australia’s coal exports come
from the Sydney & Bowen Basins
In NSW, coal contributes:
• 20,000 direct jobs
• 90,000 indirect jobs
• 84% of State electricity
• 22% of NSW goods & services
export revenue
• $1.3 billion in mining royalties
• Many billions to the State
economy in direct purchases
NSW has 18 billion tonnes of
estimated recoverable coal reserves
NSW has flexibility to expand future
coal supplies/infrastructure
Coal is the State’s largest export industry and main
source of electricity
3

World Demand for Electricity
World electricity capacity under
construction or approved Projected electricity generation by fuel
Coal is the world’s fastest growing fuel. It provides 40% of the world’s
electricity, 70% of global steel and much of the world’s cement.
4

World Demand for Electricity
5
Fuel Mix in Our Region

6
Growing Energy Needs

7
Poverty Reduction

COAL21 Fund
• World-first voluntary levy on coal producers
• Facilitating demonstration of low emissions coal technologies
• Targeted co-investment with other stakeholders (Government, electricity
generators, equipment suppliers, other industry investors)
Over A$300m committed to 14 projects
• Low emissions coal technology achievements in Australia: Successfully captured CO2 at Queensland’s Callide coal-fired power plant – the world’s
largest demonstration so far
Successfully sequestered 65,000 tonnes of CO2 in a depleted gas field in Victoria’s
Otway Basin
Now intensifying the search for storage sites in QLD, NSW, VIC and WA
Contributing to the international R&D effort:
- to solve unexpected problems encountered by large scale demonstration projects
- to reduce methane emissions at operating coal mines
8

Carbon Emission Reductions
9

HELE Projects at Work
10

Devices need a holiday too - Swiss consumer
awareness raising campaign
A saving of 65 GWh just by turning devices off for four weeks.
11

Market Trends
Global Thermal Coal Market: 2015 vs 2014
Indonesia Australia Russia Columbia S.Africa USA India Others Other N.Asia Europe China*
Demand continues to grow with India leading the
growth
-10 Mt
Note: * Steam coal imports only
SUPPLY TRENDS DEMAND TRENDS
12
-40 Mt
+2 Mt +4 Mt +2 Mt +3 Mt
-5 Mt
+20 Mt +15 Mt +3 Mt
-40 Mt
-4 Mt
USA : significant domestic demand falls pressure producers as does, strengthened US$
Russia : diverted to more coal to Asia due to lower UK import, still benefit from Rouble depreciation
Indonesia : coal exports fall due low China demand, huge oversupply on LCV
coal, new government policy; use of
domestic currency
Australia : tight HCV coal supply, HA coal
finds alternative buyers in India and Malaysia with larger discount due to
falling Chinese demand. Take-or-pay forces
producers to export more coal
Colombia : night coal railing ban has limited impact to coal export, new port capacity to support export
South Africa : continued political and
social issues; limited rail capacity; uncertain
expansion; high competition in India
market
Thermal market continues to be oversupplied. Premium coals are
trending tighter while off-spec coal is trending to more oversupply
Europe : increased carbon pricing,
gas-switching, increased renewable energy and
coal-fired capacity retirements per IED program will reduce
coal burn
China : oversupply in domestic market despite production cuts by major producers, weak power demand, high hydro and risk of failing trace elements test lower import
India : demand growth still strong and domestic coal sector reforms can not contain import growth in the short-term, infrastructure constraint remains Others : South
America and Turkey drive demand growth
Other Asia : about 15 GW are expected to come online in the next two to three years although some projects are still facing environmental and regulatory challenges

China Thermal Coal Market Review
13 *Note: Does NOT include lignite imports c.50Mtpa
CHINA ANNUALIZED ACTUAL IMPORT 1Q13-2Q15*
CHINA THERMAL COAL IMPORTS/EXPORTS*
CHINA DOMESTIC COAL PRICES
93 103
147 135
96
14 7 5 4 2 2
2010 2011 2012 2013 2014 2015F
Import
Export
Sou rces: Banpu MS&L Estimates
Un it: Mt 152
148 140 159 167 135 116 122 84 86
1Q13 2Q13 3Q13 4Q13 1Q14 2Q14 3Q14 4Q14 1Q15 2Q15
Import
Export
Un it: Mt
200400600800
1,000
Apr-
12
Jun-1
2
Aug-1
2
Oct
-12
Dec-1
2
Feb-1
3
Apr-
13
Jun-1
3
Aug-1
3
Oct
-13
Dec-1
3
Feb-1
4
Apr-
14
Jun-1
4
Aug-1
4
Oct
-14
Dec-1
4
Feb-1
5
Apr-
15
Jun-1
5
> 5,800 kcal/kg> 5,500 kcal/kg> 5,000 kcal/kg
392 343
CHINA
175
428
COMMENTS
Sou rce: www.sxcoal.com/cn 4 August 2015
Chinese domestic coal market continues to
be oversupplied despite production cuts by
major producers
Weak economic performance has led to
weak power demand
Coal imports declined further than expected
- High rainfall increased hydropower and
reduced coal burn in southern and
eastern provinces
- Continued emphasis on pollution control
especially along coastal provinces
- Trace elements testing has added
uncertainty to some imported coal due to
the risk of having coal failing inspections
- Commissioned 7.7 GW of new solar
power in the first half of this year
Un it: RMB/t

India Thermal Coal Market Review
14
INDIA THERMAL COAL IMPORTS*
INDIA ANNUALIZED ACTUAL IMPORT 1Q13-2Q15
Sou rces:: Salva Report India, Banpu MS&L Estimates
131
159 135
120 126
163 168
197
171 180
1Q13 2Q13 3Q13 4Q13 1Q14 2Q14 3Q14 4Q14 1Q15 2Q15
Un it: Mt
Un it: Mt
Indian coal industry reform is unlikely to increase output to planned 1 billion tonnes by 2020
Insufficient domestic coal supply will continue with imported coal required to fill the gap
Infrastructure bottlenecks still constrain the rate of import growth
Coal remains the cheapest source of power generation in India, and much higher quality import coal is at price parity with domestic coal in coastal locations
INDIA
Note: *includes lignite grade imports (approximately 25% - 30%)
COMMENTS
68 87
107
136 163
2010 2011 2012 2013 2014 2015F
184

Market Trends
Prices are expected to continue to drift
15
FOB Newcastle Price Forecast @ 6322 GAR
2011 Average US$121.24/ton
2012 Average US$96.67/ton
2013 Average US$85.28/ton
-20.3%
Forward price
as of 12 Jan 2015
2014 Average US$70.95/ton
2015F Average US$69.13/ton Wood Mackenzie Forecast
Forecast
15
Centennial Coal
16
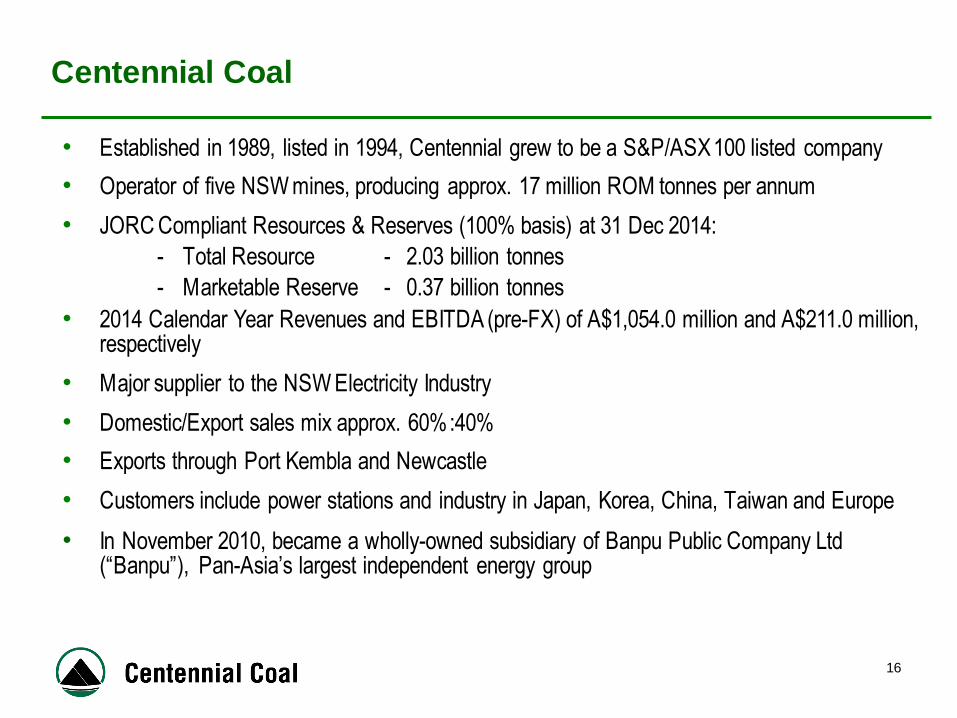
• Established in 1989, listed in 1994, Centennial grew to be a S&P/ASX 100 listed company
• Operator of five NSW mines, producing approx. 17 million ROM tonnes per annum
• JORC Compliant Resources & Reserves (100% basis) at 31 Dec 2014:
- Total Resource - 2.03 billion tonnes
- Marketable Reserve - 0.37 billion tonnes
• 2014 Calendar Year Revenues and EBITDA (pre-FX) of A$1,054.0 million and A$211.0 million, respectively
• Major supplier to the NSW Electricity Industry
• Domestic/Export sales mix approx. 60%:40%
• Exports through Port Kembla and Newcastle
• Customers include power stations and industry in Japan, Korea, China, Taiwan and Europe
• In November 2010, became a wholly-owned subsidiary of Banpu Public Company Ltd (“Banpu”), Pan-Asia’s largest independent energy group

Banpu – “The Asian Face of Energy”
Coal Business - 2015
17
Gaohe : Longwall Mine
8mtpa , 3 LWs Operating
Hebi : Longwall Mine
1.5 Mtpa
Mandalong : LW 6mtpa
Springvale: LW 5mtpa
Clarence: CM 2.8mtpa
Myuna: CM 2.2mtpa
Airly: CM 1mtpa
Charbon: O/C Rehab
Angus Place: C&M
Newstan: C&M
Mannering C&M
Hebi (40%)
CHINA
Gaohe (45%)
AUSTRALIA
Centennial (100%)
INDONESIA
ITM (65%)
Hunnu (100%)
MONGOLIA
Tsant Uul : coal-to-chemicals pilot plant
completed; trial output
Unst Khudag : further exploration underway
Altai Nuurs : mining awaiting government
approvals
Indominco: 15.0 Mt
Trubaindo: 7.2 Mt
Bharinto; 2.5 Mt
Kitadin Tandung Mayang; 1.8 Mt
Kitadin-Embalut; 1.3Mt
Jorong; 1.3 Mt

Banpu – “The Asian Face of Energy”
CHINA
SLG (30%) (COD 2017)
1,200MW
Luannan (100%) 123MW*
Zhengding (100%) 83MW*
Zouping (70%) 180MW*
Hongsa (40%) (COD 2015) 1,878MW
LAOS
THAILAND
BLCP (50%) 1,434MW
BLCP : 50% 0wned 14,34 MW expansion
plan being prepared
POWER PLANT
POWER PROJECT
Luannan: 100% owned 123MW
Zhengding : 100% owned 139MW by 2015
Zouping: 70% opwned 232MW by 2017
Shanxi Luguang : JV formed, plant design underway
Hongsa:
1,878MW 94% complete
Power Business - 2015
18
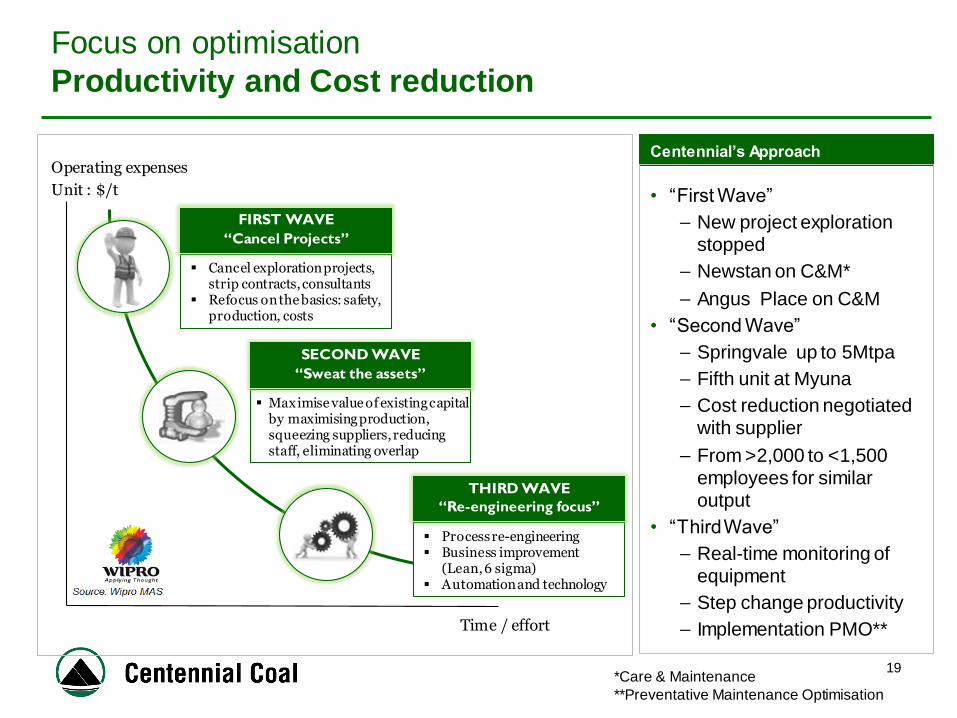
Focus on optimisation
Productivity and Cost reduction
19
Centennial’s Approach
• “First Wave”
– New project exploration stopped
– Newstan on C&M*
– Angus Place on C&M
• “Second Wave”
– Springvale up to 5Mtpa
– Fifth unit at Myuna
– Cost reduction negotiated with supplier
– From >2,000 to <1,500 employees for similar output
• “Third Wave”
– Real-time monitoring of equipment
– Step change productivity
– Implementation PMO**
Time / effort
Operating expenses
Unit : $/t
Process re-engineering Business improvement
(Lean, 6 sigma) Automation and technology
THIRD WAVE
“Re-engineering focus”
Maximise value of existing capital by maximising production, squeezing suppliers, reducing staff, eliminating overlap
SECOND WAVE
“Sweat the assets”
Cancel exploration projects, strip contracts, consultants
Refocus on the basics: safety, production, costs
FIRST WAVE
“Cancel Projects”
*Care & Maintenance
**Preventative Maintenance Optimisation

Step Change Productivity and Cost reduction –
includes a Behavioural Approach
20

21
Step Change Productivity and Cost reduction –
includes a Behavioural Approach
• Uncertainty
• Ambiguity
• Lack of:
– Input
– Feedback
– Resources
– Reward / Recognition
• System and Organisational Equity

22
Step Change Productivity and Cost reduction –
includes a Behavioural Approach
Reduced workplace
stress
Increased workplace
stress
Increased organisational
commitment
Reduced organisational
commitment
Convergent
Positive workplace
culture
Compliant
Negative workplace
culture
Organisational Commitment Model
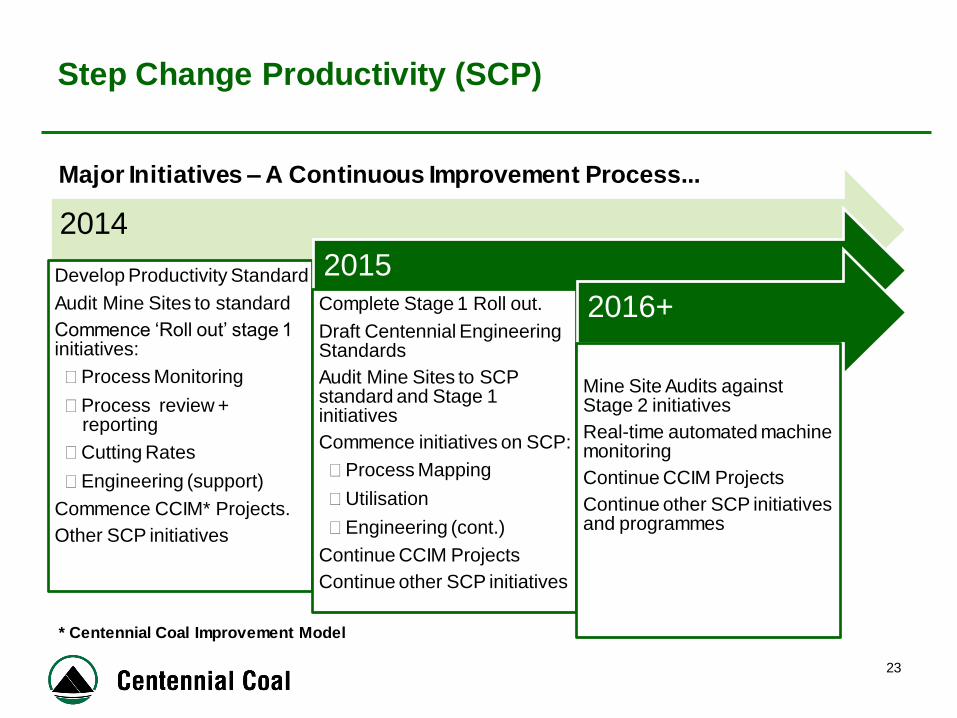
Step Change Productivity (SCP)
2014
Develop Productivity Standard
Audit Mine Sites to standard
Commence ‘Roll out’ stage 1 initiatives:
Process Monitoring
Process review + reporting
Cutting Rates
Engineering (support)
Commence CCIM* Projects.
Other SCP initiatives
2015 Complete Stage 1 Roll out.
Draft Centennial Engineering Standards
Audit Mine Sites to SCP standard and Stage 1 initiatives
Commence initiatives on SCP:
Process Mapping
Utilisation
Engineering (cont.)
Continue CCIM Projects
Continue other SCP initiatives
2016+
Mine Site Audits against Stage 2 initiatives
Real-time automated machine monitoring
Continue CCIM Projects
Continue other SCP initiatives and programmes
23
Major Initiatives – A Continuous Improvement Process...
* Centennial Coal Improvement Model
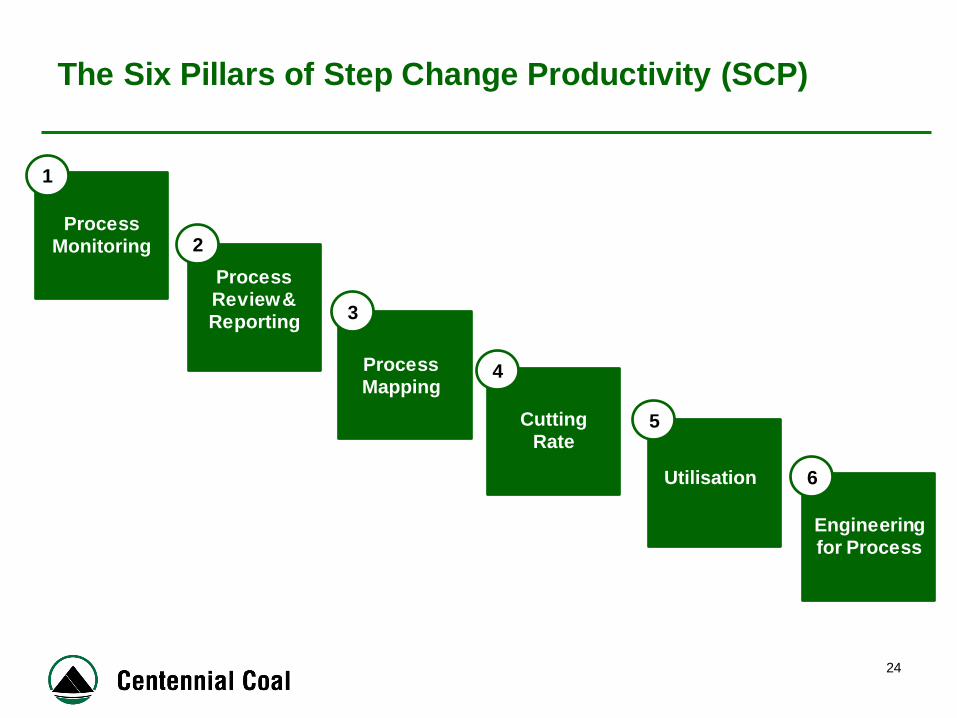
The Six Pillars of Step Change Productivity (SCP)
24
Process Monitoring
Process Review & Reporting
Process Mapping
Cutting Rate
Utilisation
Engineering for Process
1
2
3
4
5
6

Productivity and Equipment Utilisation
Process Monitoring (Pillar 1)
Key focus areas:
• Monitor all production processes
• Real time process monitoring to surface
• Real time delay reporting automated direct to Pulse
• Standardise display locations
25
Data download machine
Productivity stats
and machine
performance
CCIM

Productivity and Equipment Utilisation
Process Review & Reporting (Pillar 2)
Key focus areas:
• Standardise dashboard display of KPIs
• Standardise pre and post-shift handover
• Standardise reporting of KPIs
• Standardise review processes
• Standardise communication of production KPIs
26

Productivity and Equipment Utilisation
Process Mapping (Pillar 3)
Key Focus Areas:
• Further develop process mapping systems for all processes at all sites
• Develop internal standards for process mapping to promote work equity across all shifts
• Automate task planning in WMS / Pulse from process map chainage
27

Productivity and Equipment Utilisation
Cutting Rates (Pillar 4)
Key Focus Areas:
• All mine sites to monitor, review and report against the same operational KPIs
• Each crew starting a shift will be given the information required to know:
Safety issues at the mine
How they performed on their last shift
The targets and tasks to be completed on the shift
• Review meetings at the end of the shift to validate shift results
28
Centennial Dashboard

Productivity and Equipment Utilisation
Utilisation (Pillar 5)
Key Focus Areas:
• Set KPI target for utilisation
• Standardisation of utilisation monitoring, reporting and review
• Review mine operating plan to optimise utilisation efficiency
• Develop a “Tactical” Real Time Monitoring Report for each process to:
Facilitate process review for front line managers post shift
Facilitates real time data analysis in order to identify process inefficiencies
29

Productivity and Equipment Utilisation
LW Automation
Background:
• LW equipment at Mandalong and Springvale Mines have full automation capability which was not being fully utilised
• Run of face shearer automation currently in use at both sites
• Automation should help achieve consistent cutting rates, consistent roof and floor horizon, reduction of human exposure to environmental conditions
Key Initiatives:
• Review current/proposed/available cutting cycles
• Update and test software (simulation/complete training)
• Full automation trial on site
• Implement Centennial automation standard across all sites
• Staged implementation of agreed automation 30
Productivity and Equipment Utilisation
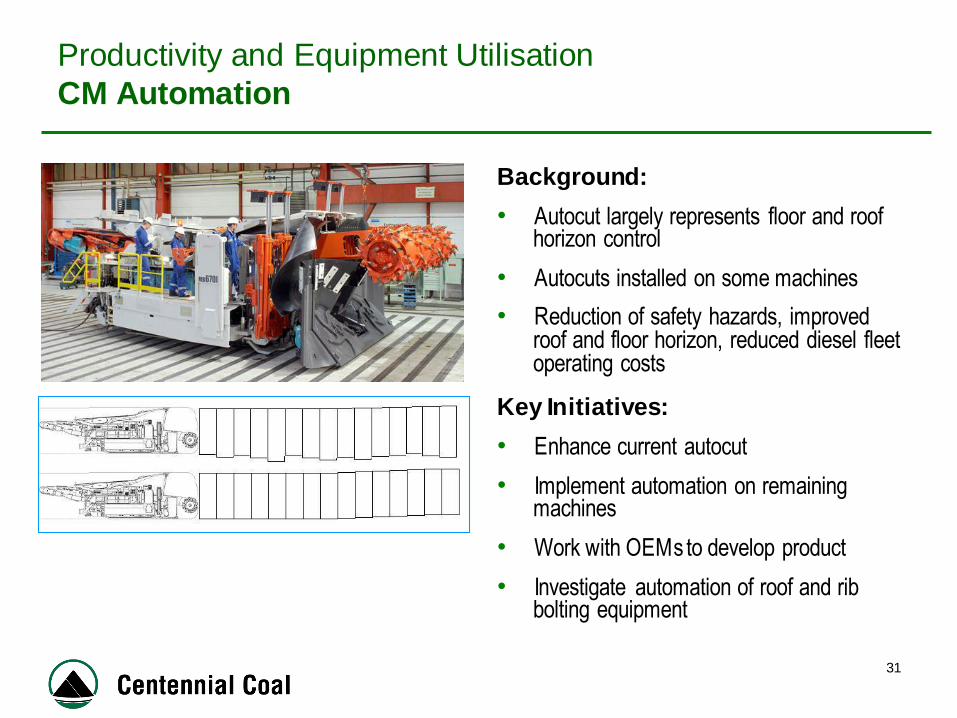
CM Automation
Background:
• Autocut largely represents floor and roof horizon control
• Autocuts installed on some machines
• Reduction of safety hazards, improved roof and floor horizon, reduced diesel fleet operating costs
Key Initiatives:
• Enhance current autocut
• Implement automation on remaining machines
• Work with OEMs to develop product
• Investigate automation of roof and rib bolting equipment
31

Productivity and Equipment Utilisation
Operations Support Centre
Background:
• All longwalls fully monitored locally (at site)
• Limited monitoring of other key processes
Key Initiatives:
• Establish Operations Support Monitoring Centre
• Pre-empt process and machine needs and opportunities
32
Remote Location
Mandalong LW Springvale LW
Real-time data Real-time
feedback Real-time data
Real-time feedback

Productivity –
Significant Labour Productivity Improving
33
Productivity (T/Emp/Yr)
2013 2014 2015 2013 2014 2015 2013 2014 2015 2013 2014 2015 2013 2014 2015 2013 2014 2015 2013 2014 2015
ROM Production (mt) 0.0 0.5 0.7 1.5 0.8 0.7 2.4 2.6 2.9 4.9 5.9 5.8 1.6 1.9 2.2 2.8 3.5 4.4 13.1 15.1 16.6
No of Employees 4 51 68 137 71 46 235 244 248 436 446 433 235 261 281 325 328 384 1,372 1,401 1,460
Productivity (T/Emp/Yr) 0 9,443 10,237 10,908 11,263 15,023 10,043 10,483 11,493 11,212 13,316 13,290 6,960 7,181 7,786 8,473 10,633 11,403 9,572 10,807 11,342
Airly Charbon Clarence Mandalong Myuna Springvale Total (100%)
0
2,000
4,000
6,000
8,000
10,000
12,000
14,000
16,000
2015 CEY based on YTD Actuals & Forecast for remainder of the year.

Productivity –
Significant Multi Factor Productivity Improvements
34
T/Input $m
2008 2009 2010 2011 2012 2013 2014 2015B
↑195% over 3 years
Multi Factor Productivity = Tonnes per Input Dollar of Labour & Capital Costs (2015 $)

Centennial Mining Cash Costs –
Significant Savings Have Been Achieved
35
Total Cost (A$m)
2011 2012 2013 2014 2015B
Labour & Oncosts Stores & Supplies Repairs & Maintenance
General Expenses Opencut/Auger Unit Cost (A$/ROM T)
16%
8%9%
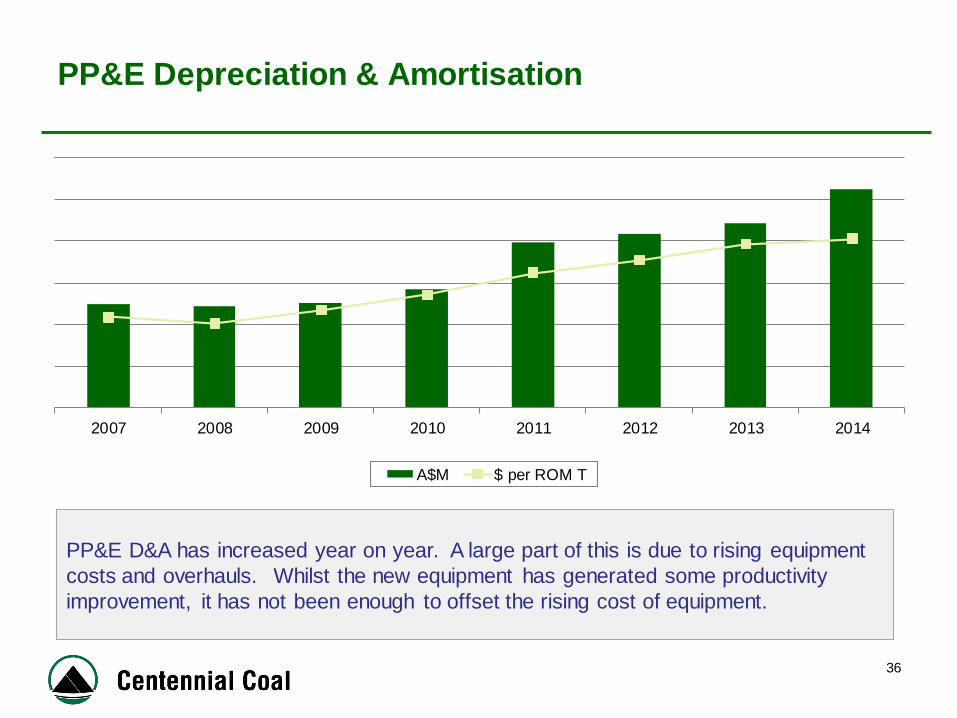
PP&E Depreciation & Amortisation
36
PP&E D&A has increased year on year. A large part of this is due to rising equipment
costs and overhauls. Whilst the new equipment has generated some productivity
improvement, it has not been enough to offset the rising cost of equipment.
2007 2008 2009 2010 2011 2012 2013 2014
A$M $ per ROM T
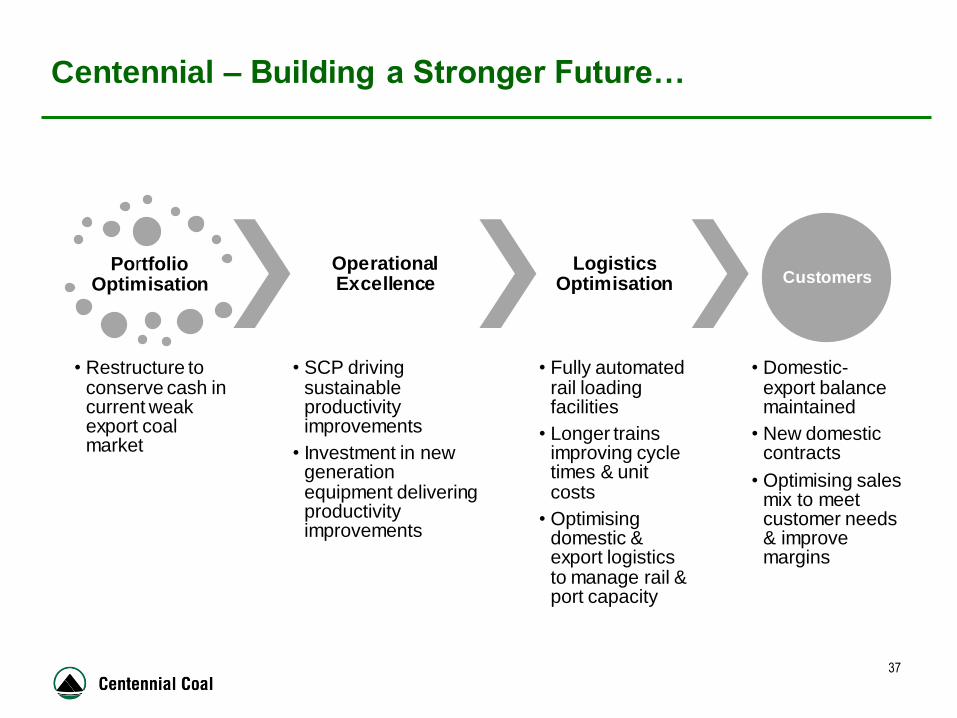
Centennial – Building a Stronger Future…
37
Portfolio Optimisation
• Restructure to conserve cash in current weak export coal market
Operational Excellence
• SCP driving sustainable productivity improvements
• Investment in new generation equipment delivering productivity improvements
Logistics Optimisation
• Fully automated rail loading facilities
• Longer trains improving cycle times & unit costs
• Optimising domestic & export logistics to manage rail & port capacity
Customers
• Domestic- export balance maintained
• New domestic contracts
• Optimising sales mix to meet customer needs & improve margins
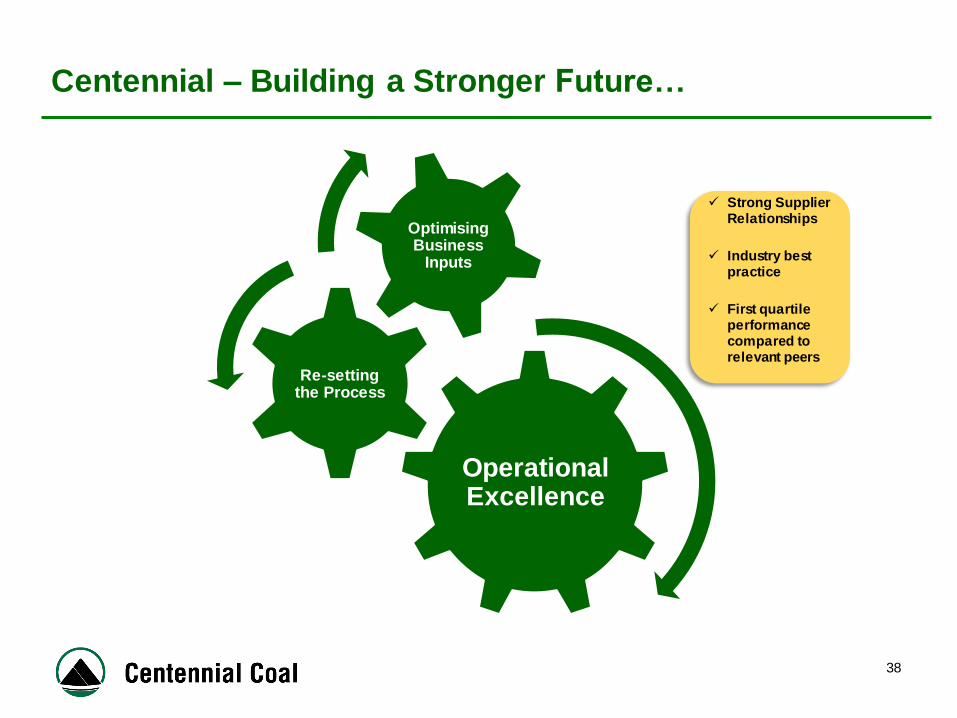
Centennial – Building a Stronger Future…
38
Operational Excellence
Re-setting the Process
Optimising Business
Inputs
Strong Supplier Relationships
Industry best practice
First quartile performance compared to relevant peers

Centennial – Building a Stronger Future…
39
Thank You