Embed Size (px)
Citation preview

New Venture Finance Concepts
TOPIC 4
1
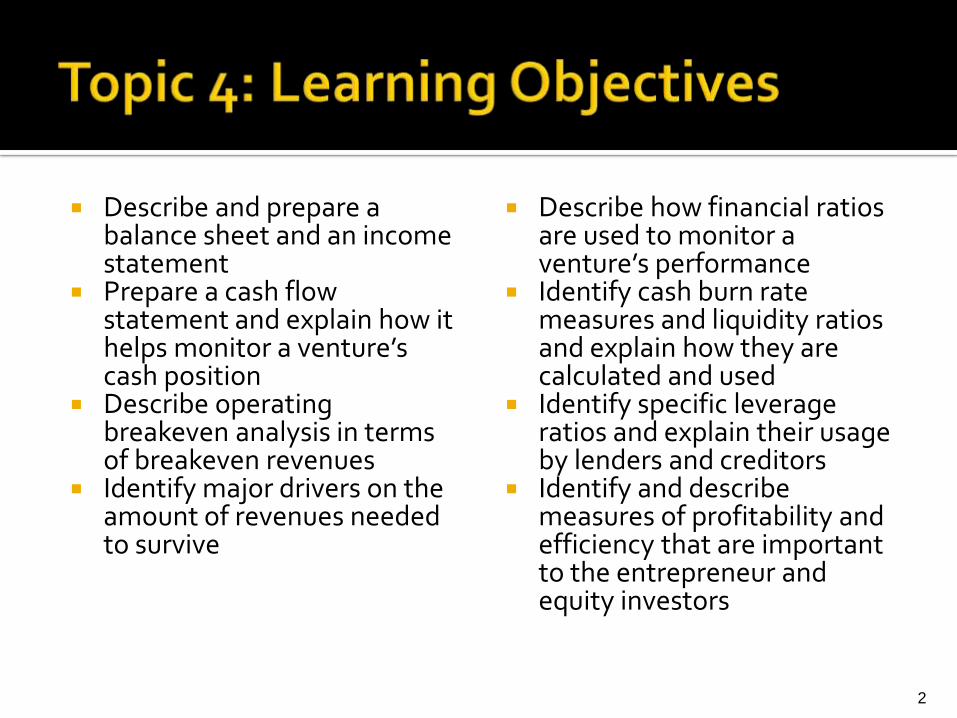
Describe and prepare a balance sheet and an income statement
Prepare a cash flow statement and explain how it helps monitor a venture’s cash position
Describe operating breakeven analysis in terms of breakeven revenues
Identify major drivers on the amount of revenues needed to survive
Describe how financial ratios are used to monitor a venture’s performance
Identify cash burn rate measures and liquidity ratios and explain how they are calculated and used
Identify specific leverage ratios and explain their usage by lenders and creditors
Identify and describe measures of profitability and efficiency that are important to the entrepreneur and equity investors
2

Generally Accepted Accounting Principles (GAAP): guidelines that set out the manner and form for
presenting accounting information Accrual Accounting:
the practice of recording economic activity when recognized rather than waiting until realized
Depreciation: reduction in value of a fixed asset over its expected life
intended to reflect the usage of wearing out of the asset Accumulated Depreciation:
sum of all previous depreciation amounts charged to fixed assets
3

Balance Sheet:financial statement that provides a snapshot of a venture’s financial position as of a specific date
Balance Sheet Equation:Total Assets = Total Liabilities + Owners’ Equity
Assets:financial, physical and intangible items owned or controlled by the business
Owners’ Equity:equity capital contributed by the owners of the venture is shown after listing all liabilities
4

Current Assets:cash & other assets that are expected to be converted into cash in less than one year Cash:
▪ amount of coin, currency, and checking account balances
Receivables:▪ credit sales made to customers
Inventories:▪ raw materials, work-in-process, and finished products which
the venture hopes to sell Fixed Assets:
assets with expected lives of greater than one year
5

Current Liabilities: Payables:
▪ short-term liabilities owed to suppliers for purchases made on credit
Accrued Wages:▪ liabilities owned to employees for previously completed work
Bank Loan:▪ interest-bearing loan of one year or less from a commercial bank
Long-Term Debts: loans that have maturities of longer than one year
Capital Leases: long-term, noncancelable leases whereby the owner
receives payments that cover the cost of the equipment plus a return on investment in the equipment
6

Income Statement: financial statement that reports the revenues generated
and expenses incurred over an accounting period Sales or Revenues:
funds earned from selling a product or providing a service Gross Earnings:
net sales (after deducting returns and allowances) minus the cost of production
Net Income (or Profit): bottom line measure after all operating expenses,
financing costs, and taxes have been deducted from net sales
7

Statement of Cash Flows:
shows how cash, reflected in accrual accounting, flowed into and out of a firm during a specific period of operation
Can be used to determine if a venture has been building or burning cash
“Net Cash Burn” occurs when the sum of cash flows from “operations” and “investing” is negative
8

Assume: Company started business on January 1, began
production on July 1, and sold first unit in August▪ Sold 1,200 units @ $100/unit during the year ▪ Sold 100 units each in August and September; Sold 250 units each in
October and November; and Sold 500 units each in December
▪ All sales on credit, payable by customer in 30 days
Other expenses include:▪ Rent – $500/month
▪ Marketing – $12,500 (for the year)
▪ Other administrative expenses – $1,500/month
▪ Depreciation expense – assume 20 year useful life
9

Assume: Company produced 1,600 units
▪ Produced 200 units each in July and August and Produced 300 units each in September, October, November and December
Cost to produce each unit:▪ Cost of parts, materials, etc. – $50/unit
▪ Cost of direct labor – $15/unit
All materials for production were purchased at the beginning of the month they were used▪ All materials were purchased on credit, payable to supplier in
30 days
10

Other assumptions:
Company applied for and received two credit cards totaling a $30,000 line of credit with an introductory rate of 0% for the first 12 months
▪ Two cards held a $25,000 balance as of December 31
$3,000 of administrative wages incurred in December were paid the next month (in January)
11
12
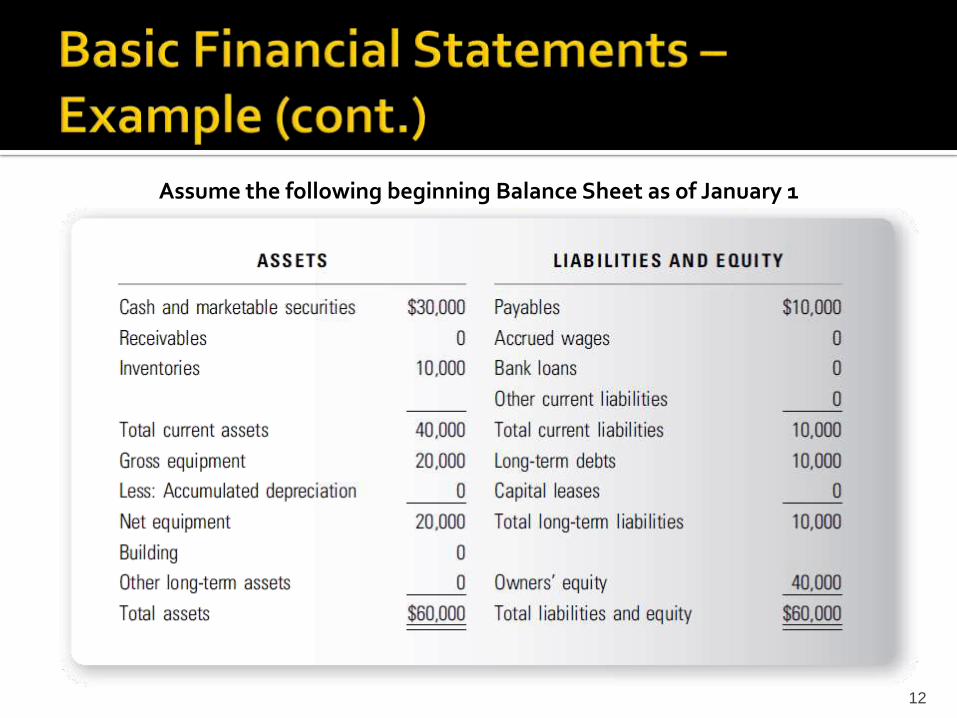
Assume the following beginning Balance Sheet as of January 1

13
Income Statement as of December 31

14
Basic Production Schedule as of December 31

15
Cash Flow Statement as of December 31

16
Balance Sheet as of December 31
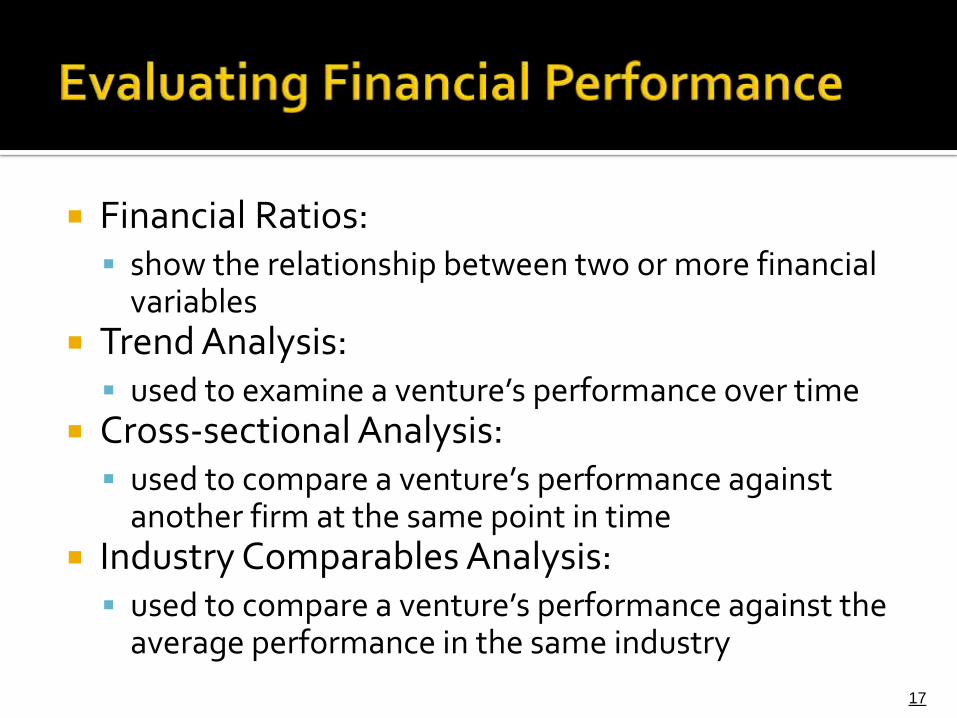
Financial Ratios: show the relationship between two or more financial
variables Trend Analysis:
used to examine a venture’s performance over time Cross-sectional Analysis:
used to compare a venture’s performance against another firm at the same point in time
Industry Comparables Analysis: used to compare a venture’s performance against the
average performance in the same industry
17

18
Measures of Financial Performance by Life Cycle Stage

19
Company ABC Income Statement for Years Ended 2009 and 2010

20
Company ABC Balance Sheet for Years Ended 2008, 2009, and 2010

21
Company ABC Statement of Cash Flows for Years Ended 2009 and 2010

Net Cash Burn Rate:
represents the amount of cash expended on the venture’s operating and financing expenses and its capital investments in assets net of the cash generated from operations (sales) and financing
= Cash burn rate – Cash build rate
22
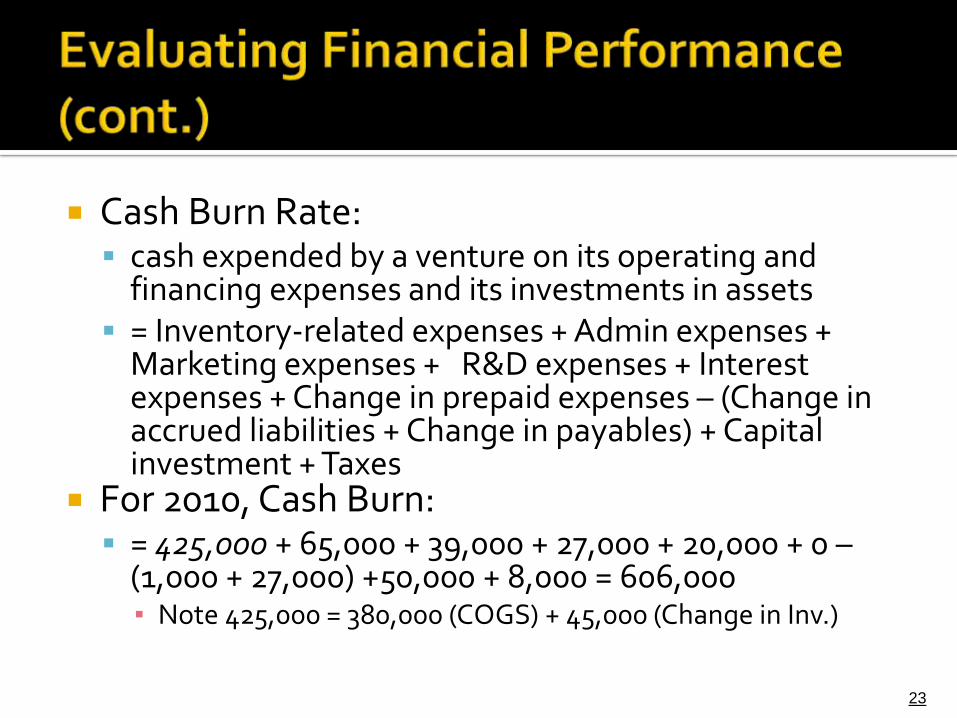
Cash Burn Rate: cash expended by a venture on its operating and
financing expenses and its investments in assets = Inventory-related expenses + Admin expenses +
Marketing expenses + R&D expenses + Interest expenses + Change in prepaid expenses – (Change in accrued liabilities + Change in payables) + Capital investment + Taxes
For 2010, Cash Burn: = 425,000 + 65,000 + 39,000 + 27,000 + 20,000 + 0 –
(1,000 + 27,000) +50,000 + 8,000 = 606,000▪ Note 425,000 = 380,000 (COGS) + 45,000 (Change in Inv.)
23

Cash Build Rate:
Cash build for a fixed period of time, typically a month
= Net Sales – Increase in Receivables
For 2010, Cash Build:
= 575,000 - 30,000 = 545,000
Net Cash Burn
= Cash burn – Cash build
= 606,000 - 545,000 = 61,000
24

Liquidity Ratios:Indicates the ability to pay short-term liabilities when they come due Current Ratio:
= Average current assets/Average current liabilities= ((250,000+180,000)/2) ÷ ((204,000+110,000)/2)= 1.37
Quick Ratio = (Average current assets – Average inventories)/Average current liabilities(= (250,000 +180,000)/2 – (140,000+95,000)/2) ÷ ((204,000 + 110,000)/2)= .62
25

26
Operating Cycle
Operating Cycle –time required to purchase, produce, and sell the venture’s products plus the time needed to collect receivables if the sales are on credit

Cash Conversion Cycle:
sum of the inventory-to-sale conversion period and the sales-to-cash conversion period less the purchase-to-payment conversion period
Conversion Period Ratio:
indicates the average time it takes in days to convert certain current assets and current liability accounts into cash
27

Inventory-to-Sales Conversion Period:
is the period required to convert purchased materials into the sale of finished costs and represents the amount of cash tied up in inventories
= Average Inventories/(CoGS / 365)
= ((140,000 + 95,000)/2) ÷ (380,000/365)
= 112.9 days
What drives this number?
28

Sales-to-Cash Conversion Period:
measures the average days of sales committed to the extension of trade credit
= Average Receivables/(Net Sales/365)
= ((105,000 + 75,000)/2) ÷ (575,000/365)
= 57.1 days
What is the significance of this measure?
29
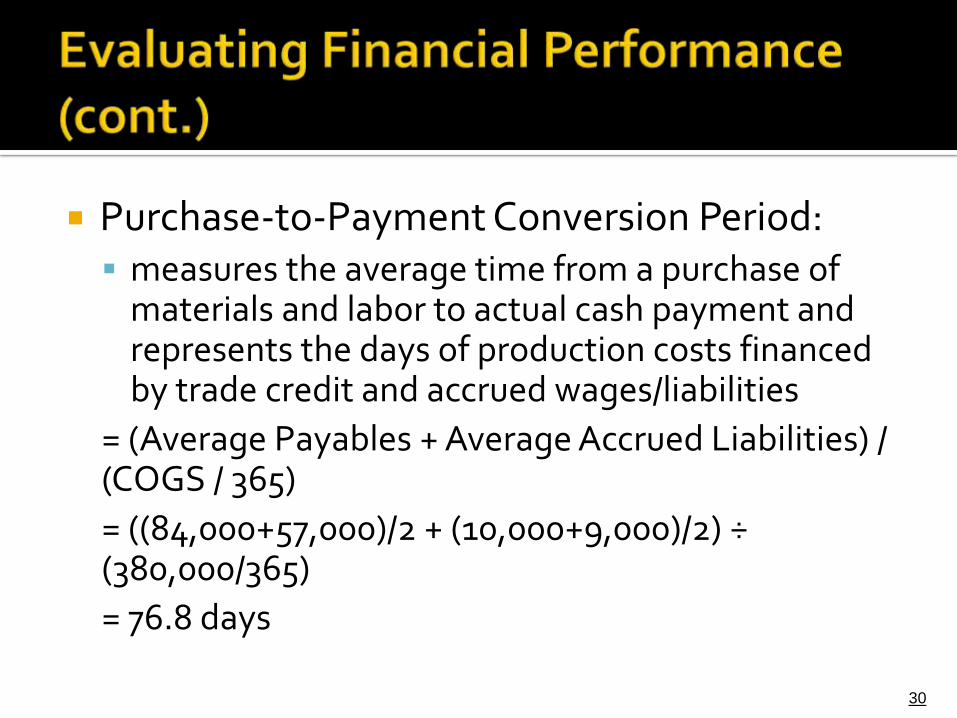
Purchase-to-Payment Conversion Period: measures the average time from a purchase of
materials and labor to actual cash payment and represents the days of production costs financed by trade credit and accrued wages/liabilities
= (Average Payables + Average Accrued Liabilities) / (COGS / 365)
= ((84,000+57,000)/2 + (10,000+9,000)/2) ÷(380,000/365)
= 76.8 days
30
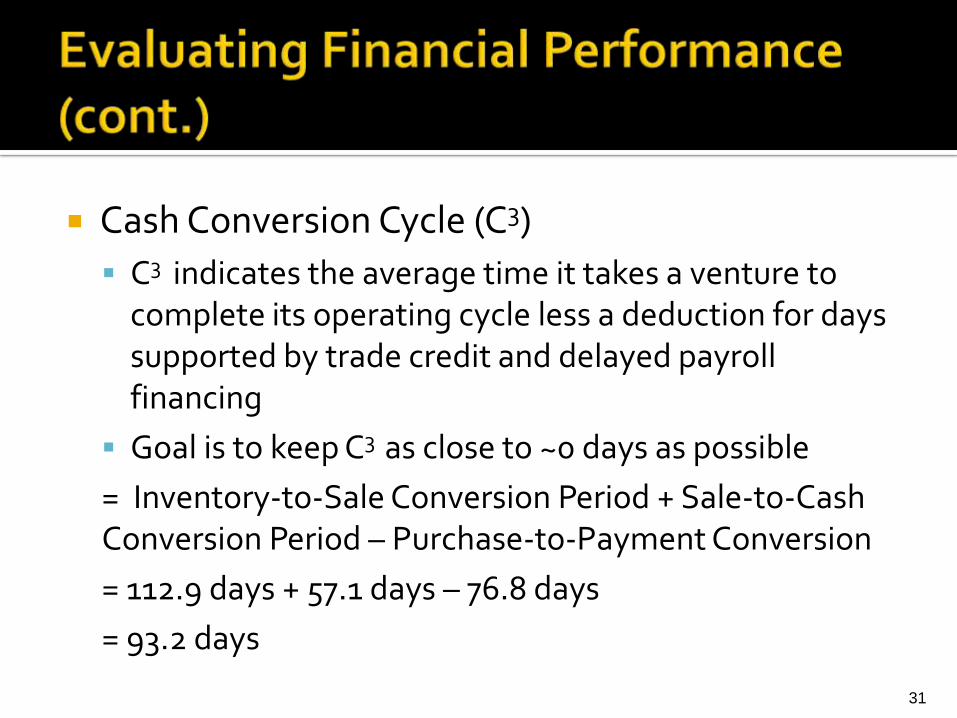
Cash Conversion Cycle (C3)
C3 indicates the average time it takes a venture to complete its operating cycle less a deduction for days supported by trade credit and delayed payroll financing
Goal is to keep C3 as close to ~0 days as possible
= Inventory-to-Sale Conversion Period + Sale-to-Cash Conversion Period – Purchase-to-Payment Conversion
= 112.9 days + 57.1 days – 76.8 days
= 93.2 days
31

32
Interpreting Changes in Conversion Times

Leverage Ratio:
indicates the extent to which the venture is in debt and its ability to repay its debt obligations
Loan Principal Amount:
dollar amount borrowed from a lender
Interest:
dollar amount paid on the loan to a lender as compensation for making the loan
33
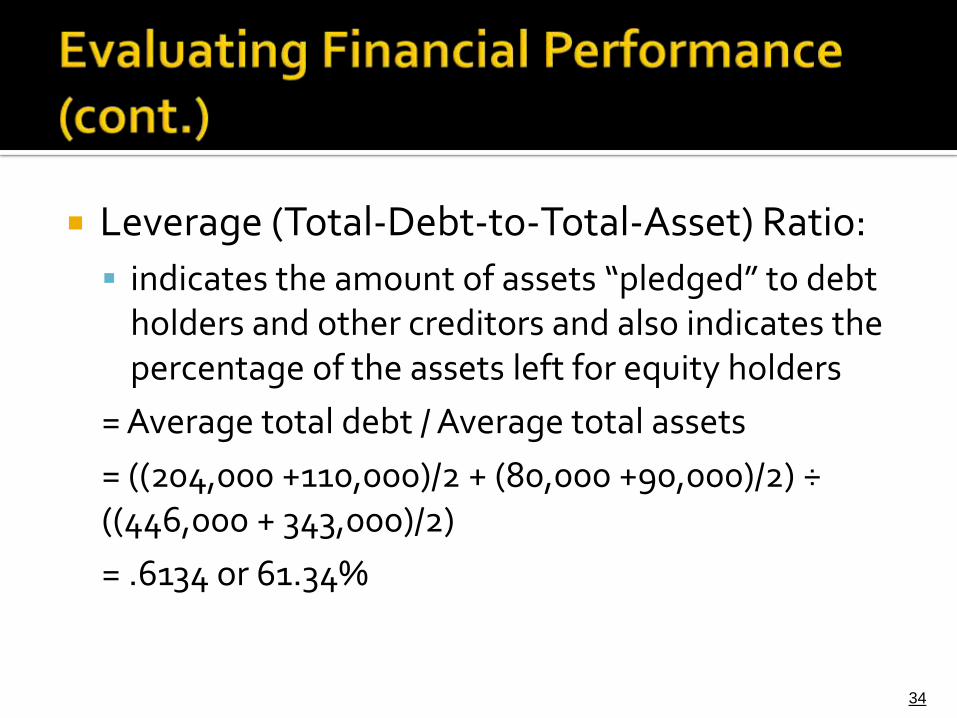
Leverage (Total-Debt-to-Total-Asset) Ratio:
indicates the amount of assets “pledged” to debt holders and other creditors and also indicates the percentage of the assets left for equity holders
= Average total debt / Average total assets
= ((204,000 +110,000)/2 + (80,000 +90,000)/2) ÷((446,000 + 343,000)/2)
= .6134 or 61.34%
34
35
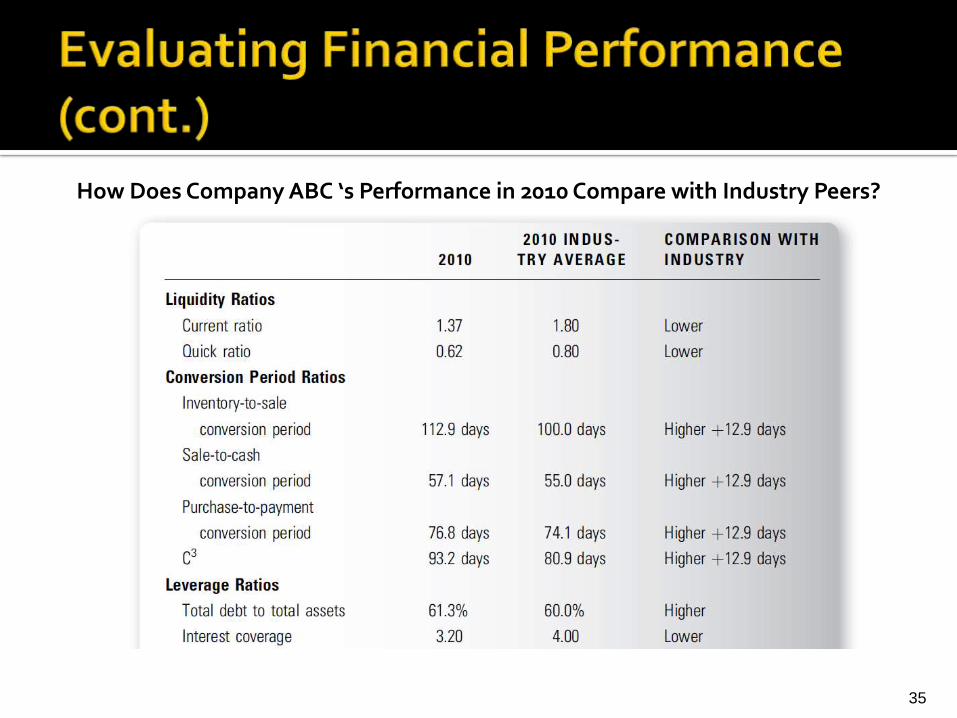
How Does Company ABC ‘s Performance in 2010 Compare with Industry Peers?
36
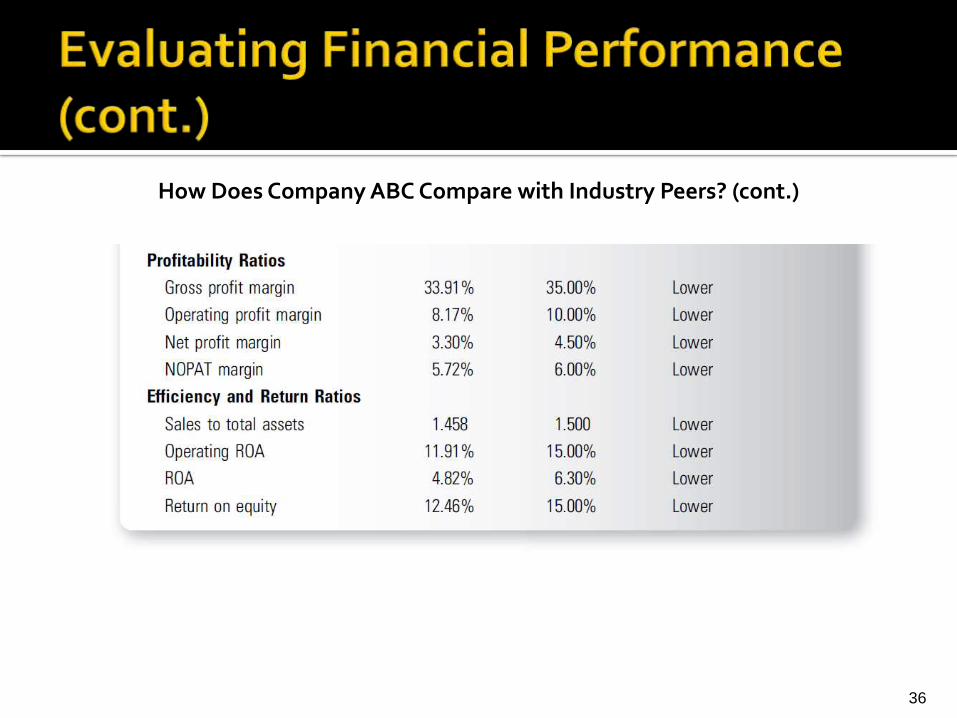
How Does Company ABC Compare with Industry Peers? (cont.)