Embed Size (px)
Citation preview

Market Research
How Well Do You Listen?
1011 Highway 6 SouthSuite 120Houston, Texas 77077281 759 3600www.gelbconsulting.com

Agenda
• Getting Started
• Qualitative Techniques
• Quantitative Techniques
• Closing

GETTING STARTED
“Your most unhappy customers are your greatest source of learning.”
Bill Gates

Marketing Research Defined
Systematic design, collection,
analysis, and reporting of data
and findings relevant to a specific
marketing situation facing a company

Experience Mapping
Customer Advisory Boards
Market Segmentation
Market Trends
Measurement with Dashboards (on-going)
Subscriptions (usually annual)
Quantitative
Qualitative
Brand Equity Tracking
Employee Alignment
Advertising Effectiveness
Concept Testing
Customer Experience
Referring Physician Satisfaction
Marketing Effectiveness
Media Usage
Awareness, Attitude, Usage Studies

The Marketing Research Process

Managing Research Quality

Contrasting Approaches
Qualitative Quantitative
No predetermined categories of analysis Standardized measure
Small group of people, large amount of in-depth probing
Large numbers of people, limited number of questions, broad data, generalized results
Greater understanding of individual differences Greater understanding of group similarities
Naturalistic and inductive Hypothetical and deductive
Longer, more detailed outcome Succinct, easily aggregated
Subjective Objective
Interpretive Statistical
NOT anecdotal, but organizedRigorous questionnaire design
required

Prescriptions
• Some objective feedback is better than none at all
• Counts are good, but comments add insight
• The objective of research is to reduce, not eliminate
decision risk
• You will often find a solution requires more than data
(e.g., management experience, staff expertise,
consensus)
• Always take action on what you’ve learned

QUALITATIVE TECHNIQUES

Definition
Qualitative research is intended to gain an understanding of the underlying reasons and
motivations behind decisions. It is unstructured in that the questions asked are formulated as the
research proceeds (i.e., dynamic). It typically uses small samples. It produces non-statistical
findings.

Techniques
• Focus Groups
• In-depth Interviews
• Focus Panels
– Respondents meet multiple times
• Creativity Sessions
– Respondents work on “problem
solving”
• Shopability Studies
– Field trip to actual site where
consumers are observed
• Mystery Shopper
– Trained researcher acts like a
consumer
• Ethnographic/Observational
• Researcher works in the world of the
respondent
• Online Focus Groups
• Occurs in a “virtual facility”
• Piggyback Groups
• Group A respondents participate in a
group while Group B observes, then
Group B discussed Group A
• Experience Mapping
• Individual and small group interviews
guided by process diagram
• Customer Advisory Boards

When Focus Groups Go Wrong
Type of intervention Description
Flipchart• Make something abstract more real by using illustrations• Write respondents’ words and ask if they see a trend
Concept Statement• Provide respondents with a typed statement of an idea• Ask them to grade it• Circle positives, cross out negatives, star strongest element
Audio/Video Stimuli• Write reaction down, then share• Discuss & grade elements
Picture Sort• Utilize unrelated visuals to trigger feelings about or images of a product/brand/company
Eulogy• Imagine X is gone and you’ve been asked to write the eulogy• Tell me about its life, accomplishments, family, and how it will be remembered
Board of directors• Everyone is given a title (CEO, VP of Marketing, etc.)• Give them a problem to solve in their “board meeting”
Empty Chair• Imagine the head of X is in the chair in front of you• Ask respondents to tell this person what they think about __

• Experience Mapping is an in-depth qualitative research technique that utilizes
a visual cue (the experience map) to help patients, family members, and/or
referring physicians recall specific episodes in their journey
• This technique allows us to assess the customer’s entire experience, rather
than one particular encounter
– Expectations prior to their first encounter with you
– Multiple activities throughout their journey (e.g., parking, check-in, exams, follow-up)
– Multiple touchpoints, or ways in which they interact with you (e.g., materials,
conversations, website)
– Recognizes changes in attitudes, if any, throughout their experience
• The experience map provides a framework for action:
– Each step has experience stewards (e.g., nursing, auxiliary) who are responsible for
delivery
– Every steward can appreciate the relationship of their actions to the remainder of the
patient journey
– Interactions or “touchpoints” are categorized at each step
Experience Mapping

Experience Map

Making Experience Mapping a Standard
• M. D. Anderson, the world’s #1 ranked cancer
center, has made an institution-wide
commitment to experience mapping. Including
radiation oncology, GU, thoracic, lymphoma,
and pediatric, the marketing organization has
partnered with service lines.
• Each service line uses experience mapping to
understand current expectations and develop
meaningful action plans for growth.
• Outputs have guided branding the Children’s
Cancer Hospital, deploying a decision map for
GU patients, and informing advertising
campaigns.

Blitz User Testing
• Blitz User Testing is an interactive, in-depth
interviewing process in which users
complete tasks and provide their opinions
regarding features of websites
• Facilitators record actions and ask follow-
up questions regarding expectations and
recommendations for improvement
• Each session begins and concludes with a
group discussion to summarize
recommendations for the website evaluated

Provide more efficient access and adequate content to create value
Element Patient Assessment Patient Recommendations
Design Aesthetically pleasing, but
layouts cluttered
Patients want to know the
key message for each page
Navigation Patients are not given a clear
path to detailed content
Patients want direction on
where to go first
Content Patients want to know more
about the Duke patient
experience
Find content ideas in
sources of patient anxiety
Functionality Patients found some existing
features desirable, but also
difficult to find/use
Patients want tools that
make being a patient easier
Element order is not indicative of relative importance
Source: McKeever, Bonds; Marketing Health Services
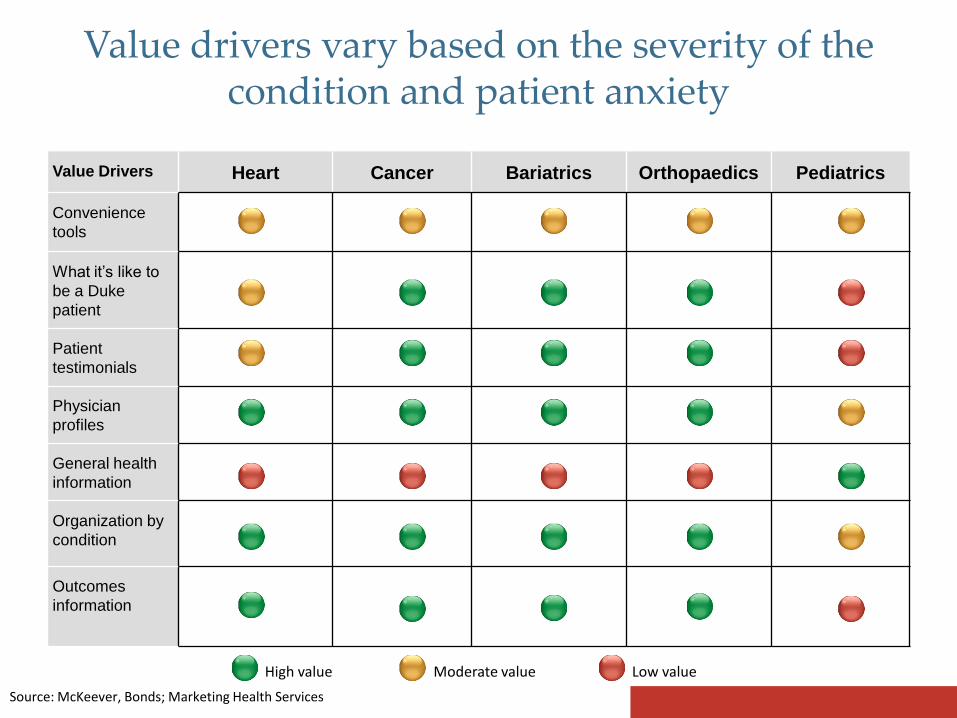
Value drivers vary based on the severity of the condition and patient anxiety
Value Drivers Heart Cancer Bariatrics Orthopaedics Pediatrics
Convenience
tools
What it’s like to
be a Duke
patient
Patient
testimonials
Physician
profiles
General health
information
Organization by
condition
Outcomes
information
High value Moderate value Low value
Source: McKeever, Bonds; Marketing Health Services

QUANTITATIVE TECHNIQUES

Definition
Quantitative research is intended to quantify the
data and generalize results from the sample to
the population of interest. It is structured in that
every respondent is asked the same questions
consistently. It typically uses large samples and
produces statistical findings.

Techniques
• Satisfaction Surveys
• Concept Testing
• Brand Equity Measurement
• Market Segmentation
• Market Trends Data
• Customer Experience Dashboard
• Awareness, Attitude and Usage (AAU)

Keys To Quantitative Success
Issue Description
Sample•Questionnaire must be designed to screen out respondents•Online sampling has become much better
Validity• Audit telephone and mall intercept interviews• Look for completeness, especially online
Interpretation• Avoid generalizing small samples• Note sample sizes on all charts
Contact Method• Ensure you have a “good list”•Consider all sources (e.g., conferences for referring physicians)
Questionnaire Design•Begin with the end in mind•Understand how question phrasing can affect analysis
Length•Questionnaires getting shorter and more specific•More advanced techniques can help make survey more efficient

Brand Equity Measurement
A trusted brand consistently delivers superior value compared to competing
brands
Familiarity is required for consumers to recognize and choose brands
Brand Equity
= Familiarity X Trust
= Familiarity X (CV + CD + CE)
The quality of the experience delivered by the organization; how well the brand lives up to its promise
The criteria used by decision makers to establish the considered set
The attributes used to distinguish
product/services from one company to
another

HIGHERIMPORTANCE
LOWERIMPORTANCE
Brand equity can best be built around treating people as a person and being more supportive
High performance Moderate performance Low performance
Strengthening the Brand
Competitive Difference
Customer Value
Respected
Knowledgeable
Modern
Cleanliness of facility
Friendly overall staff
Consistent Experience
Treats patient as a whole person
Attentive
Medical outcome
Supportive
Frequently recommended by my current physician
How well overall concerns are addressed
Frequently recommended by a trusted friend or family member
Has the top or highly rated doctors
Likelihood of Future Use Overall Reputation Overall Satisfaction

Brand Building Checklist
Target profiles
Targets’ awareness and understanding of services provided
Clarity about the benefits (and costs) associated with your services
Understanding of how one hospital is distinguished from another
Brand performance against local and national benchmarks
Strength of current position
Willingness of organization to change to deliver on new brand
promise
Believability of new positioning
Source: Marketing Health Services, McKeever, DeVries (Barnes-Jewish Hospital)

Market Segmentation
Customer Value
Analysis
What are the key buying
factors?
What is the relative
importance of key buying
factors?
How do customers rate
our performance
on these factors?
How do customers rate
our competitors’ performance
on these factors?
CVA shows how buyers make purchase decisions and relates this to their satisfaction with your offering.
CVA moves beyond customer satisfaction by focusing the organization’s attention on those components that create the most value for the customer.
CVA measures competitive advantages and disadvantages based on market-perceived quality and market-perceived price in context of the importance measures.
CVA is comprised of 4 question areas.

Decision Process Model Overview
28
Doctor Refers Doctor Offers Several Options and Patient Chooses
Patient Requests
Patient Accepts Patient Requests Alternative Referral
“Non-Chooser” “Chooser”
Examining patient and physician empowerment in decision making process is
important to understanding how influential stakeholders and the brand are to the
process. This “Decision Process Model,” published by Kathy DeVries in Market
Health Services, provides key insights on targets and the most important factors
in driving decisions.

Segments can be better identified on behavior and attitudes, not diagnosis or final selection
Doctor Refers
77%
Doctor Offers
Several Options
and Patient
Chooses
8%
Patient
Requests
10%
Patient Accepts
72%
Patient
Requests
Alternative
Referral
5%
“Non-Chooser” “Chooser”
72% 23%Doctor Refers: My doctor chose for me
Doctor Offers Several Options: Actual text here
Patient Requests: I chose with little or no physician input
Patient Requests Alternative: My doctor made a recommendation, but I asked for alternatives; I
chose despite my physician’s discouragement
N=583
29
Source: BJH Siteman Survey

Choosers have higher incidence of switching
All who changed hospitals (74 out of 583) - note drivers of satisfaction
10%
90%
23%
77%
patients who switched treatment provider
patients who did not switched treatment provider
Chooser Non-chooser

Overview
Activity
• Trigger event is documented in CRM
• System Sends Email to Online Survey
• Custom workflow rules and triggers inside of your system automatically email invitations when new patients are added to the system
Response
• Patients complete questionnaires relevant to their experience
• Patient responses are then stored in database
Escalation
• At-risk patient responses are escalated for service recovery
• Designees track resolution to issues
Monitoring
• Search and review results in dynamic tables for benchmarking
• Review open-ended responses for themes, new product ideas, and economic impact

EXAMPLE
The At Risk Report brings at-risk issues to the attention of those designated in the system.
This provides your organization an immediate opportunity to take action and monitor problem resolution.
Account Managers and/or Executives are alerted to responses that warn that a client may be At-Risk. Actions are suggested or assigned.Each step taken to resolve an issue is stored in the system and available for postmortem.
Systematic Escalation

EXAMPLE
The Report Card view provides an overview of key metrics.
This view is most commonly used by executives to review the overall performance for geographic areas or divisions.
Build your own custom crosstabs using the “Cross Tab” Builder
A snapshot of results can be taken at an Administrator’s discretion, exported to PDF, and then emailed to account executives.
Trending

Experience Dashboard Results
• Memorial Hermann Health System
implemented a comprehensive
customer service initiative to
provide exceptional patient
experiences.
• Our initial scope of work for
outpatient service was an
experience mapping exercise to
outline key steps in the process.
• This tool allows patients to share
their experiences through survey
kiosks located at the clinic,
escalates dissatisfied patient
responses for service recovery
action and distributes results to
internal stakeholders in real-time.

Executives Expect ROMI
Source: 2009 Gelb study of academic medical center marketing executives

Demonstrating Results
Awareness Interest Choice AdvocacyAdvertising
TelevisionRadioOnlinePrintSponsorships
Houston 3% lift to 86%
Nationally no change
Call center volume increased 31%
19,000 Microsite visits per month
600% increase in online traffic from last campaign
Visitors from all states in US
More than 700 online self-referrals after online ad exposure
Significant increase in patient volume, institution met FY09 business goals
All featured service lines increased in patient volume
$300,000+ online donations received from individuals exposed to the campaign
Average of 5 "Tell Us Your Story" online submissions per month
In Closing…
• These are just a few of the latest tools
• Your marketing strategy and information needs should
guide their use
• Research “reports” are a waste of money
• The information is only as valuable as your willingness to
use it
• If you do nothing else…demonstrate results
ABOUT GELB

Gelb Consulting Group, Inc. is a strategic marketing firm that merges analysis, strategy and technology to help clients build and sustain revenue growth.
Gelb helps organizations maximize their potential. Our collaborative and information-driven approach forms clarity of purpose for action.
We are here to help you understand the complexities of your market to develop and implement the right strategies. We use advanced research techniques to understand your market, strategic decision frameworks to determine the best deployment of your resources, and technology to monitor your successes.
For over 45 years, we have worked with executives to: – Develop Strategic Marketing Plans– Build Trusted Brands– Manage Customer Experiences– Launch New Products– Develop New Products– Protect Their Brands

BrandStrategy
Marketing Research
Marketing Strategy
Experience Management
Product Innovation and Go-to-Market
Marketing Dashboards
Expert Witness
Interim CMO
Scope of Service


![Listen Libertarians!: A Review of John Tomasi's Free ... · John Tomasi's new book, Free Market Fairness [2012], has been well-received as "one of the very best philosophical treatments](https://img.dokumen.tips/doc/110x75/5e5ef87ad45b6a328705e520/listen-libertarians-a-review-of-john-tomasis-free-john-tomasis-new-book.jpg)