Embed Size (px)
Citation preview
By Completing the Quality Picture
Managing the Supply Chain

Quality Challenges within an Organization
INTERNAL INFRASTRUCTURE
Brand Owner
MESERP
Manufacturing & Packaging
Finance & Sales
Quality Management
EQMS
Regulatory Bodies
Master CAPA
Master Change Control
Master Deviations
Master Investigation
SUPPLY CHAIN
Tier 1 Suppliers
Contract Manufacturers &
Packagers
No Quality Visibility
Tier 2, 3 Suppliers & Supplier’s
SuppliersDistribution
Retail
Consumers
VALUE CHAIN

Example: Contract Spending Grouping and Rations
3
32%
DIRECT
25%
ENTERPRISE
22%
SALES & MKTG
21%
R&D MGT
Raw Materials
Packaging
Contract Mfg.
Transportation
Capital
9%
6%
8%
5%
4%
Services
Corp Svs
IT
Energy
Telecom
16%
4%
3%
1%
1%
Creative
Marketing
Promotion
Meetings
Travel
3K
2K
4K
5K
2K
18K
2K
3K
1K
1K
6%
6%
8%
5%
3%
5K
5K
15K
36K
20K
Services
Corp Svs
12%
9%
24K
11K
% ofCosts# Suppliers
% ofCosts# Suppliers
% ofCosts# Suppliers
% ofCosts# Suppliers
3 categories are under scrutiny by Regulatory Agencies – Must be fully audited
Quality Transaction
s20K
10K
100K
Total 9K 23% 130K

The Challenge
4
BusinessImpact
Overhead Costs Out of Stock Costs Organizational
Impact Compliance &
Litigation
MarketImpact
Time = Money Poor Quality =
Danger Poor Quality
Affects Brand Reputation
Raw Material Supplier
Product shipped late Product damaged Manufacturing delays Scrap, delays in Mfg &
shipping
Issues
Manufacturing Facility
Distribution delays
Impact
Packaging
Product out of spec Product mislabeled Shipped wrong
product Manufacturing Facility
Issues
Issue not captured Dangerous
product distributed
Impact
Contract Manufacturers & Packagers
Issues Not Captured: Poor quality product
delivered
Issue
Distributor
Issue not captured Poor quality
product delivered
Impact
Poor information+
No visibility
Inconsistent processes
+
Reactive Environment=
Pharmacy (Out of Stock)
Consumers
Distributor

Supplier Quality Management
Addressing the Challenge
5
Raw Material Supplier
Packager
Contract Manufacturers &
Packagers
Consistent Quality
Manufacturing Quality
Few Manufacturing Delays
Fewer Shipping Delays
Less Product Quarantined
Less Waste/Rework Protected Supply Chain
Quality Processes
Interactive Supplier Scorecard
Real-Time
Consistent
Accurate
TrackWise Analytics
On-Time Shipping Fewer Damaged
Products
Product In Spec Accurate Labeling Right Product Shipped
Product In Spec Accurate Labeling Correct Product
Shipped Fewer Damaged
Products
Better Visibility
Efficiency
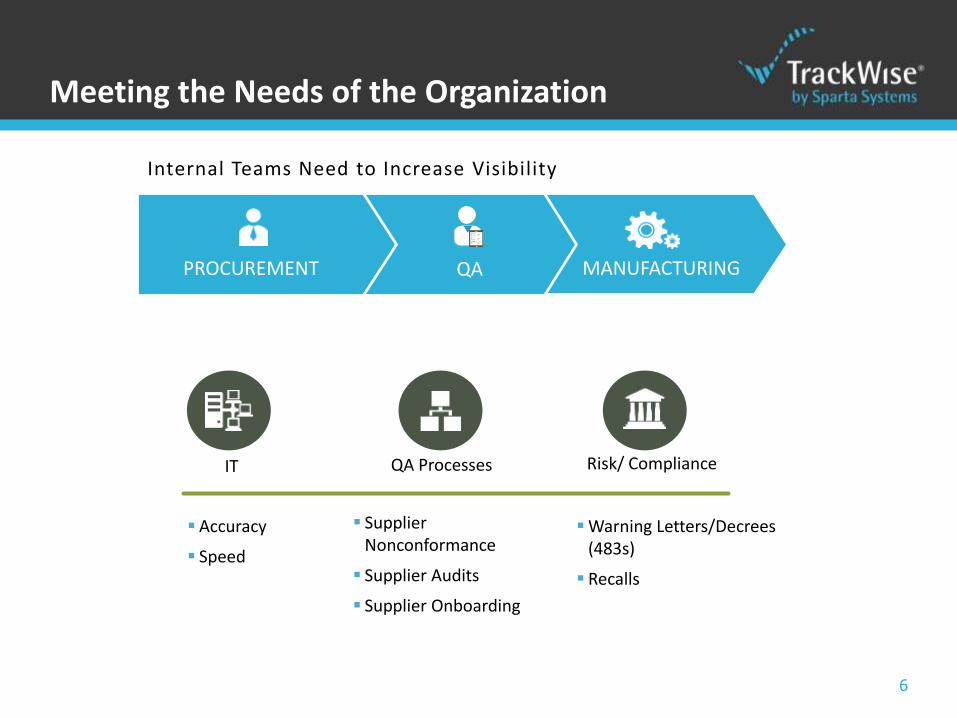
Meeting the Needs of the Organization
6
IT
Accuracy
Speed
QA Processes
Supplier Nonconformance
Supplier Audits
Supplier Onboarding
Risk/ Compliance
Warning Letters/Decrees (483s)
Recalls
Internal Teams Need to Increase Visibility
QA MANUFACTURINGPROCUREMENT

The Challenge Technology Driving Efficiency & Accuracy
7
TrackWise Analytics
Lost or incomplete data at time of business decision
Days or months to
receive data
Paper-based Audits
Resulting in negativemonetary impact
Manufacturing Process
ISSUE VOLUME
Quality Processes
On Premise
SQM
TIME
ACCURACY
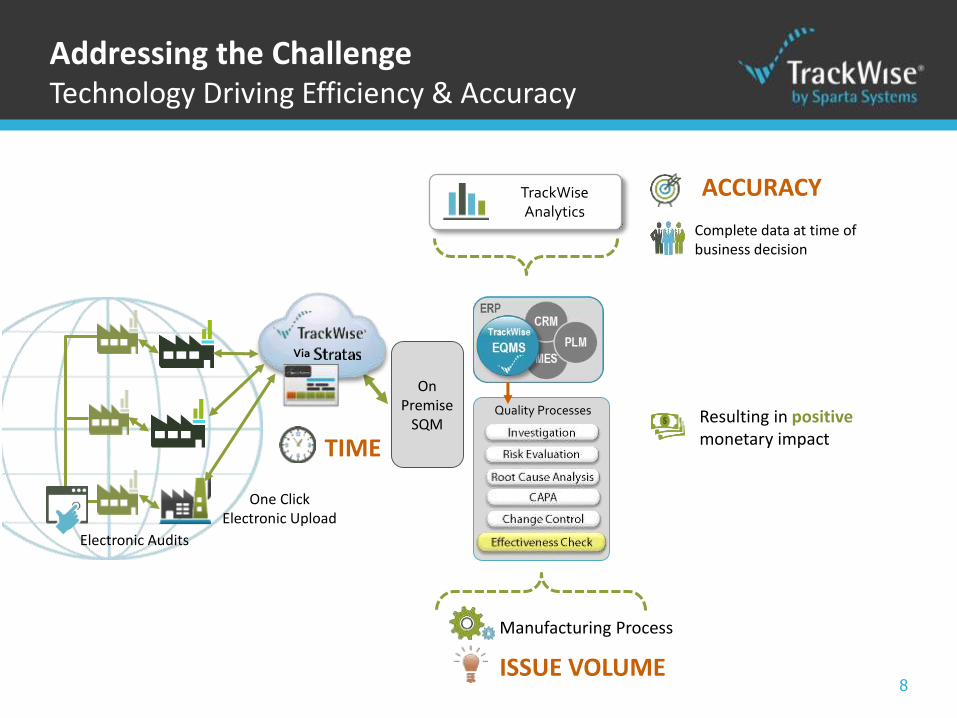
Addressing the ChallengeTechnology Driving Efficiency & Accuracy
8
Complete data at time of business decision
Electronic Audits
One Click Electronic Upload
Resulting in positive monetary impact
Manufacturing Process
ISSUE VOLUME
Quality Processes
On Premise
SQM
TIME
ACCURACY
Via
TrackWise Analytics
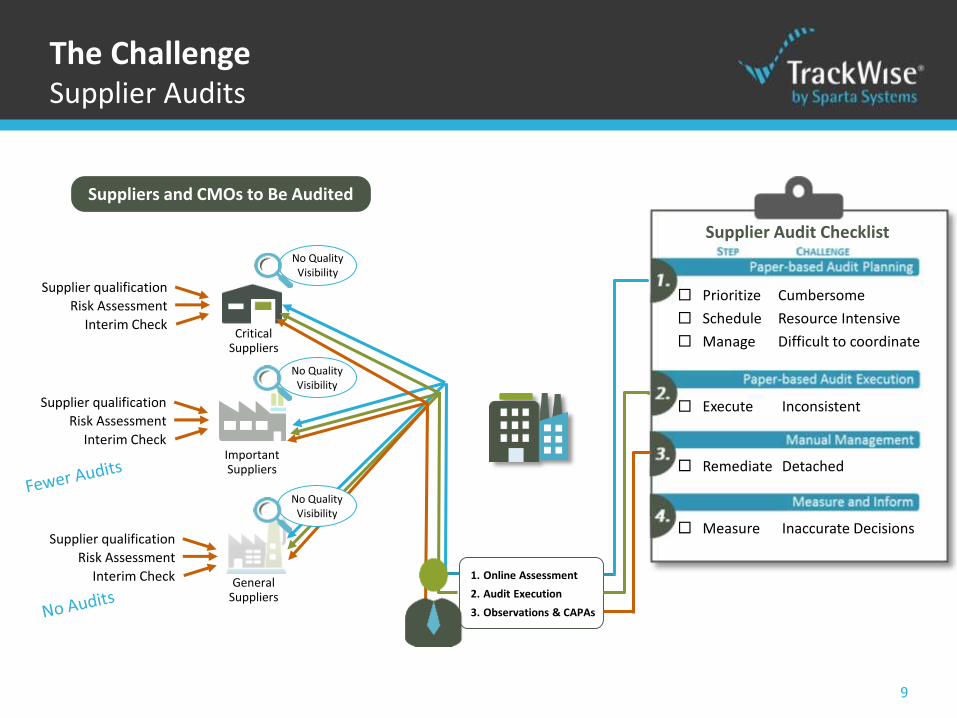
The ChallengeSupplier Audits
9
Suppliers and CMOs to Be Audited
Critical Suppliers
ImportantSuppliers
General Suppliers
No Quality Visibility
Supplier qualification
Risk Assessment
Interim Check
Supplier qualification
Risk Assessment
Interim Check
Supplier qualification
Risk Assessment
Interim Check
No Quality Visibility
1. Online Assessment
2. Audit Execution
3. Observations & CAPAs
Supplier Audit Checklist
Prioritize
Schedule
Manage
Cumbersome
Resource Intensive
Difficult to coordinate
Execute Inconsistent
Remediate Detached
Measure Inaccurate Decisions
No Quality Visibility

Addressing the ChallengeSupplier Audits
10
Critical Suppliers
ImportantSuppliers
General Suppliers
Prioritize
Schedule
Manage
Informed
Systematic
Efficient
Execute Consistent
Remediate Integrated
Measure Accurate
Decisions
Complete
Measure and Inform
Audit Management
Audit Execution
Audit Planning
Supplier Audit Checklist
1. Online Assessment
2. Audit Execution
3. Observations & CAPAs
Suppliers and CMOs to Be Audited
Supplier qualification
Risk Assessment
Interim Check
Supplier qualification
Risk Assessment
Interim Check
Supplier qualification
Risk Assessment
Interim Check

The ChallengeProduct Non-Conformance
Paper based Management
Slow Response Detached
Issue Identified
Notification
SCAR
Reviewed
Action Item
Extension Approved
Product Damaged
Notification Received
Supplier Response
Due Date Extension
Product Damaged (Repeat Issue)
Quarantine
Days or months to receive data
No Visibility
Quality Processes
Product Manufactured
Product Shipped
Issue Missed
Poor Quality = Danger
Poor Quality = Brand Reputation
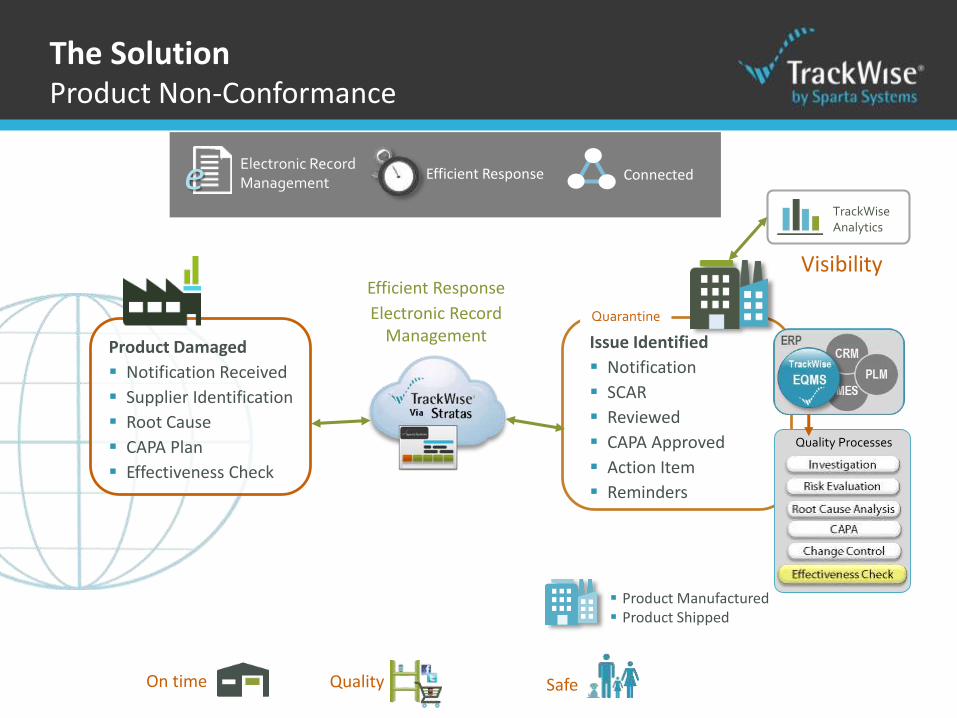
The SolutionProduct Non-Conformance
Quarantine
SafeQuality
Visibility
Quality Processes
Issue Identified
Notification
SCAR
Reviewed
CAPA Approved
Action Item
Reminders
Product Damaged
Notification Received
Supplier Identification
Root Cause
CAPA Plan
Effectiveness Check
Electronic Record Management
Efficient Response Connectede
On time
TrackWise Analytics
Efficient Response
Product Manufactured Product Shipped
Electronic Record Management

The ChallengeSupplier Onboarding
13
Supplier A
Inconsistent Processes
Inefficient Management
Poor Recordkeeping
Onboarding x Supplier x Materialo Raw Material x 1,000’s
Poor Onboarding and subsequent management leading to:
Less Compliance
More Risk
Higher Costs
Material #1 Cert
Material #2 Cert
Product Manufactured
Non-Compliant Certs. = Danger
Poor Recordkeeping = Brand Risk
ManufacturingFacility 2
Material Certification
Material #1 Received – Improperly Filed PLM – Cert Flagged - Out of
Date
Material Certification
Material #2 No Cert Received PLM – Supplier Flagged w/
Cert

The SolutionSupplier Onboarding
14
Supplier A
Consistent Processes Efficient Management Electronic Recordkeeping
Onboarding x Supplier x Material Raw Material x 1,000’s
Automated onboarding and subsequent management leading to:
Material #1 Cert
Material #2 Cert
Product Manufactured
Compliant Certs. = Quality
Sound Recordkeeping = Brand Protection
ManufacturingFacility 2
Certification
Doc Posted
Business Rules
Safe Material
Material #1
Supplier Onboarding
Received
Systematic
Efficient
Delivered
Material #2
Certification
Doc Posted
Business Rules
Safe Material
Received
Systematic
Efficient
Delivered
Au
tom
ate
d P
roce
ssing
SQ
M

VP Procurement VP of QAVP
Manufacturing
Stratas – Supplier ScorecardAccurate Data When you need it
15
Manufacturing Metrics
Greater Transparency
Better Accountability
More Efficiencies
Net Effects
PROCESS FLOW METRICS
8 Materials Waiting Time
Quotient
MWTQ Percent (%)
Ratio of waiting time for materials to total
manufacturing lead time (TML)
9 Line Efficiency LE Percent (%)
Ratio of actual process throughput to the
theoretical idea throughput based on the pace
and cycle time at the bottleneck station.
QUALITY METRICS
10 Scrap Rates SR Percent (%)
Percentage of units starting as raw material that
are lost as scrap from all steps in the process.
11 Rework Rates RR Percent (%)
Percentage of units starting as raw material that
have to be reworked at least once in the
process.
FINANCIAL METRICS
12 Cost per Part CPP $/unit
Total cost per unit for raw materials, processing
and indirect overhead.

Stratas Protecting the Supply Chain from Supplier Issues
16
Manufacturer 1
Manufacturer 2
Manufacturer 3
Contract Manufacturers
Suppliers
Packagers
Certified
Trending Negative
Certified
Not Certified
Certified
Remediate
SQM by Manufacturing
Facility
CorporateDistributors
Retail
Industrial
Internet
Consumer
Can you get to the data you need to protect your entire supply chain?
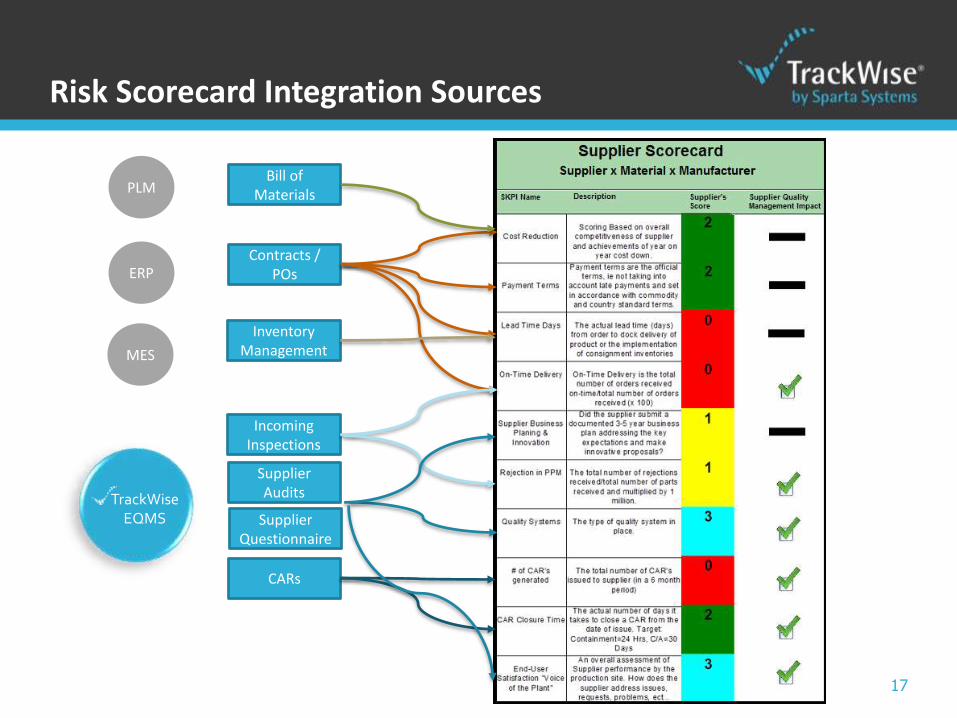
Risk Scorecard Integration Sources
17
Supplier Audits
CARs
Incoming Inspections
Contracts / POs
Inventory Management
Bill of Materials
Supplier Questionnaire
TrackWise EQMS
MES
ERP
PLM