Embed Size (px)
Citation preview

[email protected] @lkuceo PMI Congress Warsaw 2013, Copyright Lean Kanban Inc.
PresenterDavid J. Anderson
CEO, Lean Kanban Inc.
PMI CongressWarsaw
December 2013Release 1.0
Improving Service Delivery with KanbanThe Role of the Project Manager

[email protected] @lkuceo PMI Congress Warsaw 2013, Copyright Lean Kanban Inc.
Who are you, really?
Do you spend your time…
Scheduling meetings?Coordinating participation?
Collecting data?Reporting status?
Sending communications?Running down problems?
Sounds like administrative work!
You must be the “project secretary”?

[email protected] @lkuceo PMI Congress Warsaw 2013, Copyright Lean Kanban Inc.
Perhaps that isn’t a sexy enough title?
No!I’m a Fire Fighter!
My projects would fail without me
Ah!
So, you are the hero?
Is it a disaster movie?

[email protected] @lkuceo PMI Congress Warsaw 2013, Copyright Lean Kanban Inc.
Who do you really want to be?Leader?
Director?
Risk Manager?
Service Delivery Manager?
All of the above???
What is stopping you from achieving
this?
What hinders you from being all that
you can be?

[email protected] @lkuceo PMI Congress Warsaw 2013, Copyright Lean Kanban Inc.
Let Kanban help you!
Kanban systems help organizations improve
predictability of knowledge worker
activities
Reliable, predictable, trustworthy services
Retire your firefighter hat and
your project management water
cannon!
Kanban enables project managers to
realize their full potential…
… to manage risk, lead with
confidence, delight customers

[email protected] @lkuceo PMI Congress Warsaw 2013, Copyright Lean Kanban Inc.
What is a kanban system?

[email protected] @lkuceo PMI Congress Warsaw 2013, Copyright Lean Kanban Inc.
A Kanban Systems consists of “kanban” (かんばん ) signal cards in
circulation

[email protected] @lkuceo PMI Congress Warsaw 2013, Copyright Lean Kanban Inc.
Understanding Kanban Systems

[email protected] @lkuceo PMI Congress Warsaw 2013, Copyright Lean Kanban Inc.
H
FF OM
NK
J
I
Pull
Kanban systems are pull systems
Ideas
D
E
A
I
DevReady
G
5Ongoing
Development Testing
Done3 3
TestReady
5
F
B
CPull
Pull
*
There is capacity here
UATReleaseReady
∞ ∞
Pulling work from development will create
capacity here too –the pull signals move
upstream!
Now we have capacity to replenish our ready
buffer

[email protected] @lkuceo PMI Congress Warsaw 2013, Copyright Lean Kanban Inc.
Commitment is deferred
H
EC A
I
D
Commitment point
FF FF FF F
G
Pull
Wish to avoid discard after commitment
IdeasDev
Ready5
Ongoing
Development Testing
Done3 3
TestReady
5
UATReleaseReady
∞ ∞
We are committing to getting started. We are certain we want
to take delivery.
Ideas remain optional and (ideally) unprioritized

[email protected] @lkuceo PMI Congress Warsaw 2013, Copyright Lean Kanban Inc.
Focus on blocked work & re-work
H EC A
D
FF FMLP F
G
IdeasDev
Ready5
Ongoing
Development Testing
Done3 3
TestReady
5
UATReleaseReady
∞ ∞
12
34
Defect
BlockingIssue
Project managers must develop a capability
for…
issue managementrisk identification
root cause analysis, risk reduction &
mitigation

[email protected] @lkuceo PMI Congress Warsaw 2013, Copyright Lean Kanban Inc.
Implications of Using a Kanban System
We must choose…
What to work on now?
What to leave until later?
What to abandon?
Kanban Systems focus our attention
on…
Scheduling&
Risk Management

[email protected] @lkuceo PMI Congress Warsaw 2013, Copyright Lean Kanban Inc.
Metrics with Kanban Systems

[email protected] @lkuceo PMI Congress Warsaw 2013, Copyright Lean Kanban Inc.
TestReady
FF FF FF F
Defining Kanban System Lead Time
H
E
C A
I
G
DPull
System Lead TimeM
IdeasDev
Ready5
Ongoing
Development Testing
Done3 35
UATReleaseReady
∞ ∞
The clock starts ticking when we accept the customers order, not
when it is placed!
Until then customer orders are merely available options
Kanban system lead time ends when the
item reaches the first ∞
queue

[email protected] @lkuceo PMI Congress Warsaw 2013, Copyright Lean Kanban Inc.
Observe Service Delivery Capability*
5 10 15 20 25 30 40 45 55 65 More02468
101214
Service A
Frequency
Lead Time (Days)
5 10 15 20 25 30 More0
5
10
15
20
25
30
Service B
Frequency
Lead Time in Days
Mean 17 daysMean 12 days
Median~9 days
Median ~9 days
Possible2nd Mode?
85% 15 days
98% 30 days
85% ~40 days
98% 70+ days
*Data from CME Group Nynex Exchange, New York

[email protected] @lkuceo PMI Congress Warsaw 2013, Copyright Lean Kanban Inc.
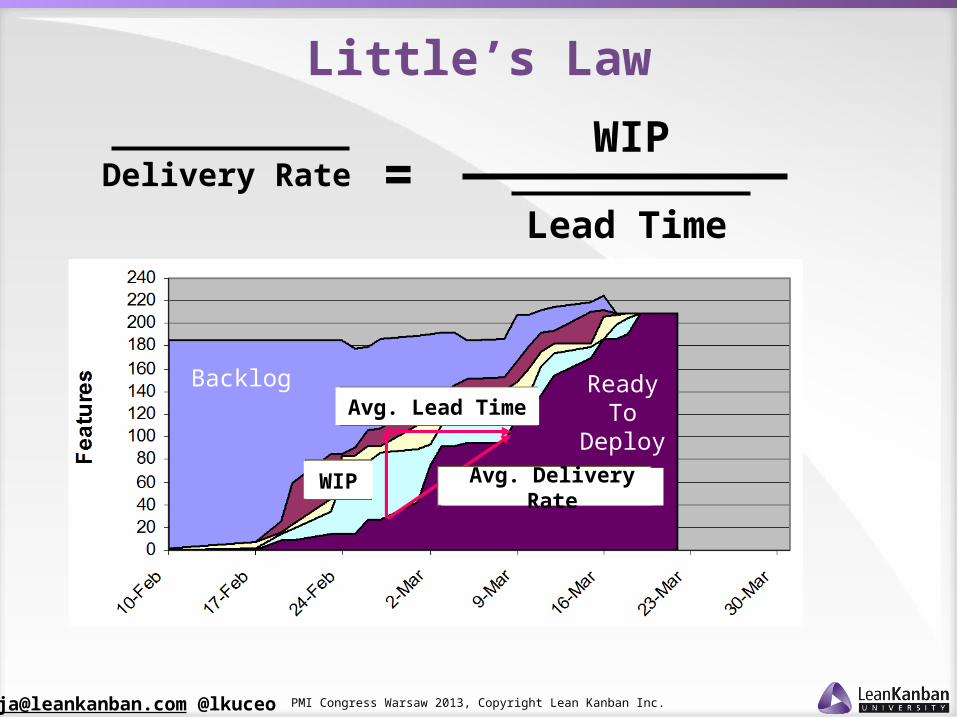
Delivery Rate(out of kanban system) Lead Time
(thru kanban system)
WIP=
Avg. Lead Time
Avg. Delivery Rate
WIP
IdeasReleaseReady
Little’s Law

[email protected] @lkuceo PMI Congress Warsaw 2013, Copyright Lean Kanban Inc.
TestReady
Flow Efficiency
FH E
C A
I
GD
GYPB
DEMN
P1
AB
Lead TimeWaiting Waiting WaitingWorking
* Zsolt Fabok, Lean Agile Scotland, Sep 2012, Lean Kanban France, Oct 2012** Hakan Forss, Lean Kanban France, Oct 2013
IdeasDev
Ready5
Ongoing
Development Testing
Done3 35
UATReleaseReady
∞ ∞Flow efficiency measures the percentage of total lead time
actually spent adding value (or knowledge) versus waitingFlow efficiency = Work Time x 100%
Lead TimeFlow efficiencies of 1-5% are commonly reported. *, **
> 40% is good! Multitasking means time spent in working columns is often waiting
time
Working

[email protected] @lkuceo PMI Congress Warsaw 2013, Copyright Lean Kanban Inc.
TestReady
Implications of low Flow Efficiency
FH E
C A
I
GD
GYPB
DEMN
P1
AB
Lead TimeWaiting Waiting WaitingWorking
IdeasDev
Ready5
Ongoing
Development Testing
Done3 35
UATReleaseReady
∞ ∞
Working
Low flow efficiency means that most of
lead time is influenced by environmental factors that are
unlikely to change soon
As a result, lead time is not very
sensitive to specific people involved or
their individual capabilities

[email protected] @lkuceo PMI Congress Warsaw 2013, Copyright Lean Kanban Inc.
Role of the Project Manager

[email protected] @lkuceo PMI Congress Warsaw 2013, Copyright Lean Kanban Inc.
Roles & Responsibilities
Kanban is usually implemented by the function managers, so what is the role
for the project manager?
Kanban provides an opportunity for all management roles to think differently,
focusing on real business risks

[email protected] @lkuceo PMI Congress Warsaw 2013, Copyright Lean Kanban Inc.
When should we start something?
impa
ct
When we need it
85th percentile
Ideal StartHere
Commitment point
If we start too early, we forgo the option and opportunity to do something else that may
provide value.
If we start too late we risk incurring the cost of delay
With a 6 in 7 chance of on-time delivery, we can always
expedite to insure on-time delivery
time

[email protected] @lkuceo PMI Congress Warsaw 2013, Copyright Lean Kanban Inc.
Risk Management trims the tail
85th percentile
mean
Identify risks, their likelihood & impact
(delay that extends lead time).
Eliminating risks or reducing their impact trims the tail on the
distribution.
Trimming the tail moves the mean to the left,
increasing delivery rate!
Risks often cause long lead times

[email protected] @lkuceo PMI Congress Warsaw 2013, Copyright Lean Kanban Inc.
Blocker Clustering
http://www.klausleopold.com/2013/09/blocker-clusters-problems-are-not.html

[email protected] @lkuceo PMI Congress Warsaw 2013, Copyright Lean Kanban Inc.
Seeing Services in your Organization

[email protected] @lkuceo PMI Congress Warsaw 2013, Copyright Lean Kanban Inc.
What Service Do You Provide?

[email protected] @lkuceo PMI Congress Warsaw 2013, Copyright Lean Kanban Inc.
Column WIP Limit = 5
Testing is a shared service across 5
dev teams
In this example, testing was off-
shore in Chennai, India

[email protected] @lkuceo PMI Congress Warsaw 2013, Copyright Lean Kanban Inc.
(some of the) orange tickets are avatars for people
from shared services such as
enterprise architecture and user experience
design

[email protected] @lkuceo PMI Congress Warsaw 2013, Copyright Lean Kanban Inc.
5 lanes each with a dev team providing a
software development service to the
project

[email protected] @lkuceo PMI Congress Warsaw 2013, Copyright Lean Kanban Inc.
Column WIP Limits
Clinical Validation Testing,
Deployment,P.O. Acceptance
All are shared services across 3
dev teams

[email protected] @lkuceo PMI Congress Warsaw 2013, Copyright Lean Kanban Inc.
Scaling up for large projects

[email protected] @lkuceo PMI Congress Warsaw 2013, Copyright Lean Kanban Inc.
TestReady
S
R
QP
ON
F
Projects are just big batches of work
H
E
C A
I
G
D
M
ProjectScope
DevReady
5Ongoing
Development Testing
Done3 35
UATReleaseReady
∞ ∞

[email protected] @lkuceo PMI Congress Warsaw 2013, Copyright Lean Kanban Inc.
TestReady
S
RQ
PO
NF
Calculate duration to complete the batch
H
E
C
I
GD
M
DevReady
5Ongoing
Development Testing
Done3 35
UATReleaseReady
∞ ∞
This is overly simplistic is it
not?
Only a little!
Let me show you more!
ProjectScope

[email protected] @lkuceo PMI Congress Warsaw 2013, Copyright Lean Kanban Inc.
Major project with two-tiered kanban board

[email protected] @lkuceo PMI Congress Warsaw 2013, Copyright Lean Kanban Inc.
Single Project Daily Meeting
In this example more than 40 people attend a standup for a large project with 5 concurrent development teams. The meeting is usually
completed in under 15 minutes
[email protected] @lkuceo PMI Congress Warsaw 2013, Copyright Lean Kanban Inc.
Delivery RateLead Time
WIP=
Avg. Lead Time
Avg. Delivery Rate
WIP
Backlog ReadyTo
Deploy
Little’s Law

[email protected] @lkuceo PMI Congress Warsaw 2013, Copyright Lean Kanban Inc.
Cumulative Flow andPredictive Modeling with S-Curve
Device Management Ike II Cumulative Flow
020406080
100120140160180200220240
Time
Feat
ures
Inventory Started Designed Coded Complete
Typical S-curve

[email protected] @lkuceo PMI Congress Warsaw 2013, Copyright Lean Kanban Inc.
Understanding Unplanned Work
Dark Matter
(emergent features)
Scope Creep
Original Scope
Dark matter planned as a 19% expansion over original scopeActual Dark Matter over final original scope is 26%Total scope compared to original commitment is 13% greater

[email protected] @lkuceo PMI Congress Warsaw 2013, Copyright Lean Kanban Inc.
TV/Movie Company in USA 2008
Initial Scope is 125 story pointsWithin days this total scope reaches 190 due to dark matter expansionManagement intervened on 4/21 to stop dark matter (deferring future scope to product backlog)Observed dark matter expansion is 52% but real number was much greater

[email protected] @lkuceo PMI Congress Warsaw 2013, Copyright Lean Kanban Inc.
Rules of Thumb for Dark Matter
Mature teams working in well
understood domains produce less dark
matter
Maybe 20%
Typical Agile teams produce 50% dark
matter
Immature teams may find 100-200%
more work than they planned

[email protected] @lkuceo PMI Congress Warsaw 2013, Copyright Lean Kanban Inc.
Determining the schedule
Refuse to answer the question,
“How long will it take?”
Instead ask, “when do you need it for?”
And facilitate a discussion about the cost of delay*
* Cost of delay is out-of-scope for this presentation due to time constraints

[email protected] @lkuceo PMI Congress Warsaw 2013, Copyright Lean Kanban Inc.
Determining the scopeWe need to
understand the height of the y-axis in a unit of measure
that is typical of work items normally
handled by this service/workflow
To do this quickly & cheaply some
statistical methods can be used
together with randomly sampled
analysis

[email protected] @lkuceo PMI Congress Warsaw 2013, Copyright Lean Kanban Inc.
Estimating using statistical methods …Randomly
sample, 5, 7 or 11 requirements
and analyze them. The more samples the less
risk in extrapolating the
result
Requirement # # of User Stories34 1753 2461 14
103 15151 20187 18209 18

[email protected] @lkuceo PMI Congress Warsaw 2013, Copyright Lean Kanban Inc.
… build a model …
User stories /
requirement
17 24mean22
Requirement # # of User Stories34 1753 2461 14
103 15151 20187 18209 18
There is a 90% chance that the
median lies between the lowest & highest
numbers in the sample.*
Make some educated guesses & build a
model
* “How to measure anything”, Douglas Hubbard

[email protected] @lkuceo PMI Congress Warsaw 2013, Copyright Lean Kanban Inc.
… complete the forecast
Let’s factor 30% for dark matter
based on historical
performance, team maturity & nature of domain
=> 85 x 1.3 = 110 requirements
~22 stories per requirement
Target scope is2200 stories

[email protected] @lkuceo PMI Congress Warsaw 2013, Copyright Lean Kanban Inc.
Make a long term plan to build platform replacement
Device Management Ike II Cumulative Flow
020406080
100120140160180200220240
Time
Feat
ures
Inventory Started Designed Coded Complete
Slope in middle3.5x - 5x slope
at ends 5x
Required delivery rate
2006 2008
During the middle 60% of the project schedule we need a delivery rate of 220 features per month
Initial Phase Hyper-productive Phase Closing Phase

[email protected] @lkuceo PMI Congress Warsaw 2013, Copyright Lean Kanban Inc.
Delivery RateLead Time
WIP=
Little’s Law
From observed capability
Treat as a fixed variable
Targetto
achieve plan
Calculated based on known lead time
capability & required delivery
rate
Determines staffing level
Changing the WIP limit without maintaining the staffing level ratio represents a change to the way of
working. It is a change to the process and will produce a change in the observed ‘common cause’
capability of the system
Plan based on currently observed capability and current working
practices. Do not assume process improvements.
If changing WIP to reduce undesirable effects (e.g.
multitasking), get new sample data (perform a spike) to observe
the new capability

[email protected] @lkuceo PMI Congress Warsaw 2013, Copyright Lean Kanban Inc.
55/week0.4 weeks
WIP = 22=
Using Little’s Law
From observed capability
Treat as a fixed variable
Targetto
achieve plan
Calculated based on known lead time
capability & required delivery
rate
Determines staffing level
At this point perhaps just a little black magic and experience may
be required.
Rounding 22 up to 25 would conveniently provide for 5 teams with a WIP limit of 5 items each
If our current working practices/process exhibited an
average WIP of 1 item per person then we require 25 people
organized in 5 teams of 5 people to complete the project on-time

[email protected] @lkuceo PMI Congress Warsaw 2013, Copyright Lean Kanban Inc.
Lead time
WIP in this area should be 25
items*
*photo taken early in the project
before it was fully staffed/loaded
Median lead time target is 2 days
Alert managers if beyond 5 days

[email protected] @lkuceo PMI Congress Warsaw 2013, Copyright Lean Kanban Inc.
ConclusionsKanban provides
transparency
Status of WIP is obvious
Most secretarial work is eliminated!
Project managers elevate their role to risk
manager!
Determine when to start work based on business
risks
Trim tail on lead time distribution to maintain
delivery rate

[email protected] @lkuceo PMI Congress Warsaw 2013, Copyright Lean Kanban Inc.
Upcoming Training in Europe
5-day Kanban Coaching Professional MasterclassLondon 3-7 Februaryhttp://djaa.com/kcpm-feb2014
2-day Advanced PractitionerOslo 10-11 February, 2014http://djaa.com/dja-ap0220141 Copenhagen 12-13 February, 2014http://djaa.com/dja-ap0220142

[email protected] @lkuceo PMI Congress Warsaw 2013, Copyright Lean Kanban Inc.
About
David Anderson is a thought leader in managing effective software teams. He leads a training, consulting, publishing and event planning business dedicated to developing, promoting and implementing sustainable evolutionary…He has 30 years experience in the high technology industry starting with computer games in the early 1980’s. He has led software teams delivering superior productivity and quality using innovative agile methods at large companies such as Sprint and Motorola.David is the pioneer of the Kanban Method an agile and evolutionary approach to change. His latest book, published in June 2012, is, Lessons in Agile Management – On the Road to Kanban.David leads Lean Kanban Inc., a global management training, events & publishing business dedicated to offering high quality, innovative, modern management training for the creative knowledge worker industries of the 21st Century.

[email protected] @lkuceo PMI Congress Warsaw 2013, Copyright Lean Kanban Inc.
The data on slide 15 was provided by Raymond Keating of CME Group.
Troy Magennis has pioneered the use of Douglas Hubbard’s statistical techniques in conjunction with Kanban and introduced Monte Carlo simulation to replace the 3-phase Z-model presented here
Klaus Leopold has been pioneering the use of blocker clustering to encourage project managers to focus on the greater added value of risk management and managing average lead time by curbing opportunity for long tail distributions
Acknowledgements

[email protected] @lkuceo PMI Congress Warsaw 2013, Copyright Lean Kanban Inc.