Embed Size (px)
Citation preview

Outline for Monday, July 7
� Remember
�Quiz on Friday
� Homework due Monday
� Review from Thursday� Review from Thursday
� Where do we get a demand curve?
� Application: oil speculators
� What causes shifts in curves?

Using the graph: summary
You should understand
� What do the demand and supply curves mean?
� What makes demand and supply shift or change?
� How do shifts change the equilibrium, where the � How do shifts change the equilibrium, where the curves intersect?
� What happens when we’re not at the equilibrium price? shortages and surpluses
� Remember that quantity responds to price:
� buyers choose how much to buy, not at what price to buy
� Sellers choose how much to sell, not at what price to sell

Assumption #1: Quantity responds to
price
� There are a lot of buyers and sellers
� This only applies to certain markets
� This means that no one can choose the price
� So buyers and sellers are both called price-takers� So buyers and sellers are both called price-takers
and this is called the price-taking assumption
� This also suggests that buyers and sellers all pay
and see the same price, so there are no
� Transaction costs
� Search costs

Assumption #2: Scarcity
� The economy must have scarce resources because…
If they are not scarce � an infinite amount of the
good could be made � so no one would pay for it

Assn. #3: Rationality
� Buyers and sellers will change their behavior so that
equilibrium is reached
S
surplus
E
D
pE
qE
p2
q2Sq2D
surplus

Approaching equilibrium
� How does a shortage get fixed?

Approaching equilibrium
� How does a shortage get fixed?
� New sellers, with higher costs, enter
� Current sellers produce more
� Low-value buyers re-sell to high-value buyers� Low-value buyers re-sell to high-value buyers

Approaching equilibrium
� How does a shortage get fixed?
� New sellers, with higher costs, enter
� Current sellers produce more
� Low-value buyers re-sell to high-value buyers� Low-value buyers re-sell to high-value buyers
� How does a surplus get fixed?

Supply & Demand Model
We assume We get
Assumption #1: Price-taking P � Q
Assumption #2: Scarcity P > 0
Assumption #3: Rationality EquilibriumAssumption #3: Rationality Equilibrium

Outline for Monday, July 7
� Remember
�Quiz on Friday
� Homework due Monday
� Review from Thursday� Review from Thursday
� Where do we get a demand curve?
� Application: oil speculators
� What causes shifts in curves?

Where do we get a demand curve?
� Suppose that, for lunch today, I’m willing to pay $5
for a burger, $4 for another burger, $2 for a third
and nothing for any more
� What next?� What next?

Where do we get a demand curve?
� Suppose that, for lunch today, I’m willing to pay $5
for a burger, $4 for another burger, $2 for a third
and nothing for any more
� This gives my demand schedule:� This gives my demand schedule:
� Let’s graph it…Note that it’s downwards sloping
$0 $1 $2 $3 $4 $5
Quantity Demanded 3 3 3 2 2 1

Where do we get a demand curve?
� Suppose there are two hamburger eaters with the
following schedules:$0 $1 $2 $3 $4 $5
Quantity demanded by A 3 3 3 2 2 1
Quantity demanded by B 11 6 3 2 1 1
� What is the total demand schedule?
Quantity demanded by B 11 6 3 2 1 1

Where do we get a demand curve?
� Suppose there are two hamburger eaters with the
following schedules:$0 $1 $2 $3 $4 $5
Quantity demanded by A 3 3 3 2 2 1
Quantity demanded by B 11 6 3 2 1 1
� Clearly the total demand is…
� Again, we have a downward sloping demand curve
Quantity demanded by B 11 6 3 2 1 1
Total quantity demanded 14 9 6 4 3 2

Where do we get a demand curve?
� Suppose that no one wants more than one Nintendo
Wii. Twenty consumers have the following
willingness-to-pay (in dollars): 500, 400, 100, 200,
300, 0, 600, 100, 200, 300, 400, 500, 200, 0, 0,
0, 100, 200, 300, 4000, 100, 200, 300, 400
� What is the demand schedule?

Where do we get a demand curve?
� Suppose that no one wants more than one Nintendo
Wii. Twenty consumers have the following
willingness-to-pay (in dollars): 500, 400, 100, 200,
300, 0, 600, 100, 200, 300, 400, 500, 200, 0, 0,
0, 100, 200, 300, 4000, 100, 200, 300, 400
� What is the demand schedule?$0 $100 $200 $300 $400 $500
Quantity demanded 20 16 13 9 6 3

Where do we get a demand curve?
� Suppose that no one wants more than one Nintendo
Wii. Twenty consumers have the following
willingness-to-pay (in dollars): 500, 400, 100, 200,
300, 0, 600, 100, 200, 300, 400, 500, 200, 0, 0,
0, 100, 200, 300, 4000, 100, 200, 300, 400
� What is the demand schedule?
� What price should Nintendo charge?
$0 $100 $200 $300 $400 $500
Quantity demanded 20 16 13 9 6 3

Where do we get the curves?
� For demand: add up, or aggregate, the price-
responses of individual consumers

Where do we get the curves?
� For demand: add up, or aggregate, the price-
responses of individual consumers
� For supply: do the same for firms� For supply: do the same for firms

Where do we get the curves?
� For demand: add up, or aggregate, the price-
responses of individual consumers
� For supply: do the same for firms� For supply: do the same for firms
� We add along the horizontal x-axis because we’re
concerned with the total amount supplied or
demanded
Outline for Monday, July 7
� Remember
�Quiz on Friday
� Homework due Monday
� Review from Thursday� Review from Thursday
� Where do we get a demand curve?
� Application: oil speculators
� What causes shifts in curves?

Oil speculators
� We’ll examine the positive claim “Oil speculation is
driving up prices” using Paul Krugman’s model

Oil speculators
� We’ll examine the positive claim “Oil speculation is
driving up prices” using Paul Krugman’s model
� I’ll present the model and the data used to test it
� As we go through it, think of what is missing that might � As we go through it, think of what is missing that might
change our conclusion

Oil speculators
Going long –
� Buy oil now, planning to sell it later
�Gain if price goes up sufficiently
P
Selling short –
� Have no oil, promise to deliver it later
�Gain if price drops
P

Oil speculators
Going long –
� Buy oil now, planning to sell it later
�Gain if price goes up sufficiently
P
Selling short –
� Have no oil, promise to deliver it later
�Gain if price drops
� We’re worried about the long-buyers
P

Oil speculators
� Suppose that, without speculators, demand and
supply would be in equilibrium at (PE, QE)

Oil speculators
� Suppose that, without speculators, demand and
supply would be in equilibrium at (PE, QE)
� Why do speculators drive up prices?

Oil speculators
� Suppose that, without speculators, demand and
supply would be in equilibrium at (PE, QE)
� Why do speculators drive up prices?
� How do speculators drive up prices?� How do speculators drive up prices?
Oil speculators
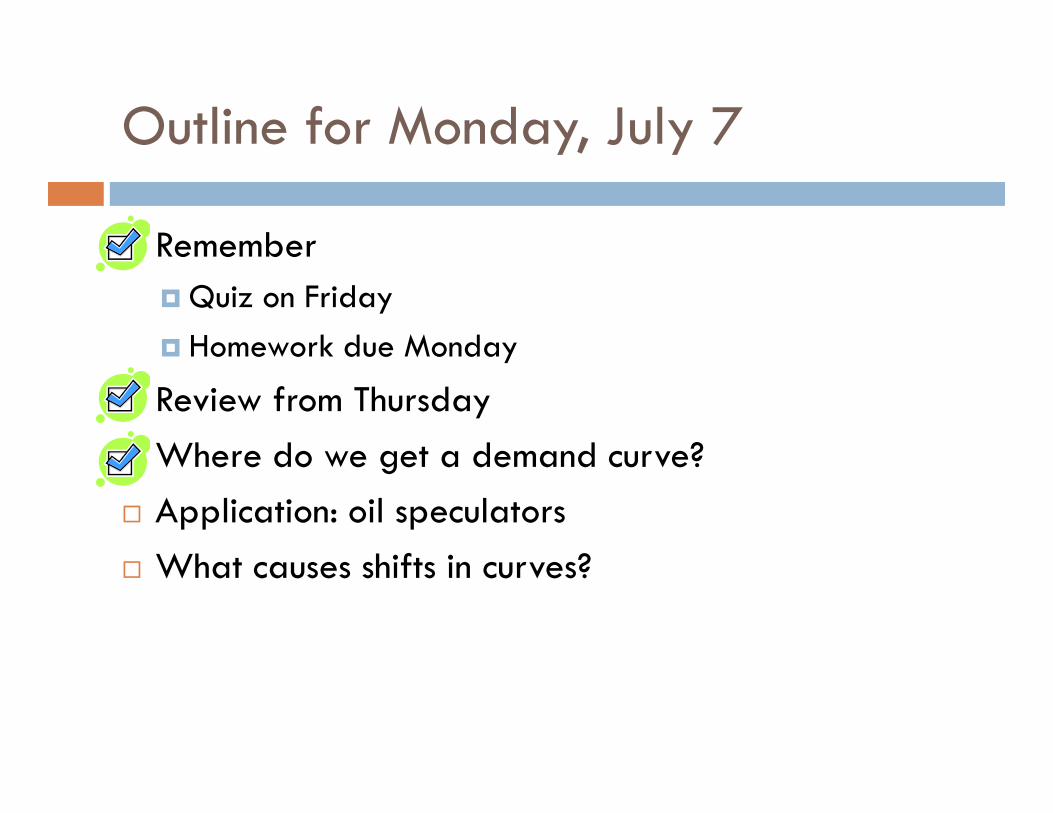
We observe We cannot observe
Current price P
Current quantity sold Q
Current consumption C
Speculators’ future price PF
Storage costs S
The demand curve
The supply curve
The equilibrium without speculators

Oil speculators
We observe We cannot observe
Current price P
Current quantity sold Q
Current consumption C
Speculators’ future price PF
Storage costs S
The demand curve
The supply curve
The equilibrium without speculators
� How can we test the claim that “Oil speculation is
driving up prices”?

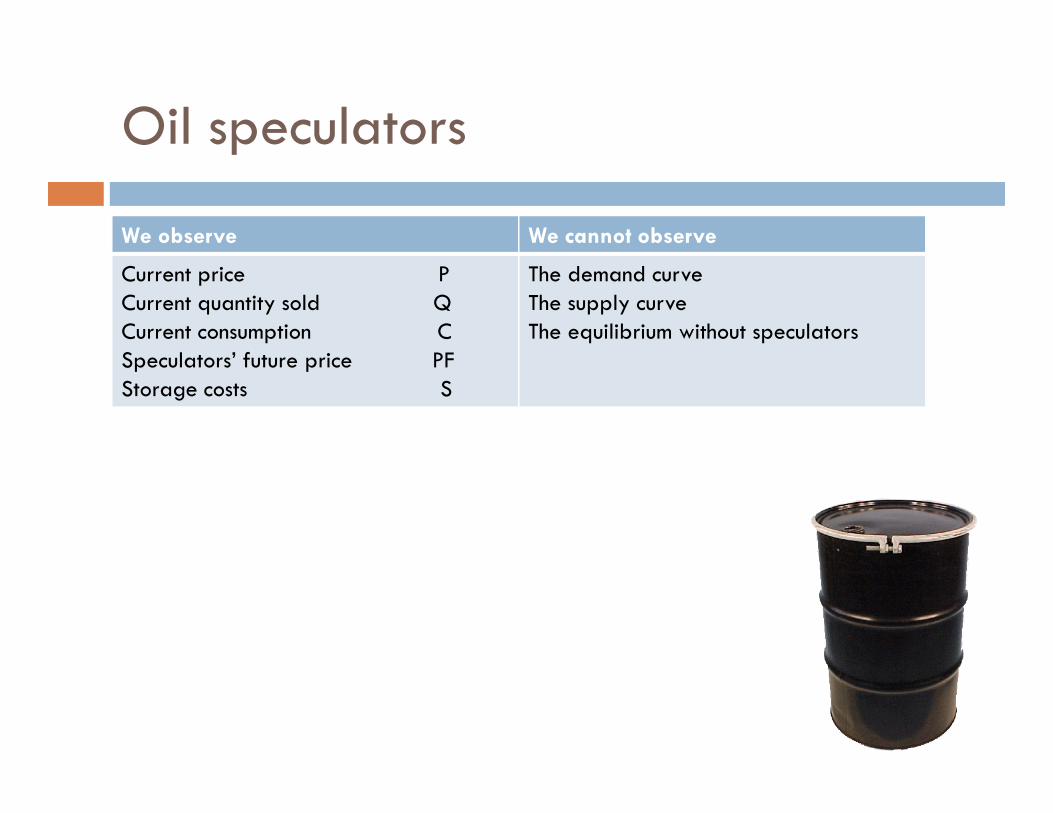
Oil speculators
� How can we test the claim that “Oil speculation is
driving up prices”?
�Oil storage should be high
Q – C >> 0Q – C >> 0
� Speculators’ future price should be high above current
prices
PF – P >> S

Oil speculators
� How can we test the claim that “Oil speculation is
driving up prices”?
�Oil storage should be high
Q – C >> 0Q – C >> 0
There’s only 55-days worth in storage
� Speculators’ future price should be high above current
prices
PF – P >> S
The price gap is not above storage costs

Oil speculators
� What is this model missing that might give us a
different answer?
� Are the numbers convincing?
Oil speculators

Oil speculators
� What is this model missing that might give us a
different answer?
� Are the numbers convincing?
� It’s still under investigation at the U.S. Commodities
and Futures Trading Commission

Outline for Monday, July 7
� Remember
�Quiz on Friday
� Homework due Monday
� Review from Thursday� Review from Thursday
� Where do we get a demand curve?
� Application: oil speculators
� What causes shifts in curves?

What shifts demand?
� Recall that a change or shift in demand is a change
in any factor besides the good’s own price. Like
what?

What shifts demand?
� A change or shift in demand may be caused by
� The price of a related good
�Gas price increases � demand for cars falls

What shifts demand?
� A change or shift in demand may be caused by
� The price of a related good
� Income
� Professors get a raise � demand for books increasesProfessors get a raise � demand for books increases
� Congress gives itself a raise � members can pay for their
own flights � demand for lobbyist-paid flights falls

What shifts demand?
� A change or shift in demand may be caused by
� The price of a related good
� Income
� Tastes� Tastes
� Shakira sings at the Super Bowl � demand goes up

What shifts demand?
� A change or shift in demand may be caused by
� The price of a related good
� Income
� Tastes� Tastes
� The number of buyers
� The border is closed � demand for anything sold along the
border falls

What shifts demand?
� A change or shift in demand may be caused by
� The price of a related good
� Income
� Tastes� Tastes
� The number of buyers
� Beliefs about the good’s properties
� Thabo Mbeki says potatoes slow AIDS � demand goes up

What shifts demand?
� A change or shift in demand may be caused by
� The price of a related good
� Income
� Tastes� Tastes
� The number of buyers
� Beliefs about the good’s properties
� Beliefs about future prices
�We expect a recession � demand for gold goes up

What shifts demand?
� A change or shift in demand may be caused by
� The price of a related good
� Income
� Tastes� Tastes
� The number of buyers
� Beliefs about the good’s properties
� Beliefs about future prices
�Maybe other stuff, too

What shifts demand?
� A change or shift in demand may be caused by
� The price of a related good
� Income
� Tastes� Tastes
� The number of buyers
� Beliefs about the good’s properties
� Beliefs about future prices
�Maybe other stuff, too
� Lets consider outside prices and income in more detail

Other goods’ prices
� Goods that go well together are complements
� Popcorn and movies, Windows and PCs, cereal and
milk

Other goods’ prices
� Goods that go well together are complements
�When a complement is more expensive, demand falls
�When a complement is cheaper, demand rises

Other goods’ prices
� Goods that go well together are complements
�When a complement is more expensive, demand falls
�When a complement is cheaper, demand rises
� Goods that can be substituted for each other are � Goods that can be substituted for each other are
substitutes
� Ice cream and frozen yogurt, lectures and books
≈ ?

Other goods’ prices
� Goods that go well together are complements
�When a complement is more expensive, demand falls
�When a complement is cheaper, demand rises
� Goods that can be substituted for each other are � Goods that can be substituted for each other are
substitutes
�When a substitute is more expensive, demand increases
�When a substitute is cheaper, demand falls
� Whether a good is a complement or substitute
depends on consumers’ tastes

Income
� Most goods we’ll consider are normal goods: as
income increases, so does demand
� Those goods with the opposite relationship are
called inferior goodscalled inferior goods

Income
� Most goods we’ll consider are normal goods: as
income increases, so does demand
� Those goods with the opposite relationship are
called inferior goodscalled inferior goods
� A single good can be both types at different
income levels
Income
� Demand for normal goods increases with income
� Other goods are called inferior
� A single good can be both

Income
� Demand for normal goods increases with income
� Other goods are called inferior
� A single good can be both
� Recall that the Law of Demand says demand falls
with price
� Goods whose demands rise with price are Giffen
goods
What shifts supply?
� A change or shift in supply may be caused by

What shifts supply?
� A change or shift in supply may be caused by
� Input prices
�Grain is more expensive � supply of burgers falls, both for
the bun and the burger

What shifts supply?
� A change or shift in supply may be caused by
� Input prices
� Technology
� The internet allows for cheaper music sales � supply The internet allows for cheaper music sales � supply
increases

What shifts supply?
� A change or shift in supply may be caused by
� Input prices
� Technology
� The number of sellers� The number of sellers
� New York City allows anyone to work a taxi � supply
increases

What shifts supply?
� A change or shift in supply may be caused by
� Input prices
� Technology
� The number of sellers� The number of sellers
� Beliefs about future prices
� The oil boom is ending � OPEC wants to sell while the price
is still high � current supply increases

What shifts supply?
� A change or shift in supply may be caused by
� Input prices
� Technology
� The number of sellers� The number of sellers
� Beliefs about future prices
�Maybe other stuff, too

What shifts supply?
� A change or shift in supply may be caused by
� Input prices
� Technology
� The number of sellers� The number of sellers
� Beliefs about future prices
�Maybe other stuff, too
�We’ll consider input prices in more detail when we
model the producer’s problem

Outline for Monday, July 7
� Remember
�Quiz on Friday
� Homework due Monday
� Review from Thursday� Review from Thursday
� Where do we get a demand curve?
� Application: oil speculators
� What causes shifts in curves?