Embed Size (px)
Citation preview

Chapter 2: Financial Statements, Cash Flows, and Taxes

Learning Objectives
1. DISCUSS GENERALLY ACCEPTED ACCOUNTING PRINCIPLES (GAAP) AND THEIR IMPORTANCE TO THE ECONOMY.
2. EXPLAIN THE BALANCE SHEET IDENTITY AND WHY A BALANCE SHEET MUST BALANCE.
3. DESCRIBE HOW MARKET-VALUE BALANCE SHEETS DIFFER FROM BOOK-VALUE BALANCE SHEETS.

Learning Objectives
4. IDENTIFY THE BASIC EQUATION FOR THE INCOME STATEMENT AND THE INFORMATION IT PROVIDES.
5. UNDERSTAND THE CALCULATION OF CASH FLOWS FROM OPERATING, INVESTING, AND FINANCING ACTIVITIES REQUIRED IN THE STATEMENT OF CASH FLOWS.
6. EXPLAIN HOW THE FOUR MAJOR FINANCIAL STATEMENTS DISCUSSED IN THIS CHAPTER ARE RELATED.

Learning Objectives
7. IDENTIFY THE CASH FLOW TO A FIRM’S INVESTORS USING ITS FINANCIAL STATEMENTS.
8. DISCUSS THE DIFFERENCE BETWEEN AVERAGE AND MARGINAL TAX RATES.

Financial Statements
o PURPOSE OF FINANCIAL STATEMENTS• Provide stakeholders a foundation
for evaluating the financial health of a firm
creditorsemployeesmanagementstockholders

Financial Statements
o PURPOSE OF FINANCIAL STATEMENTS• Provide stakeholders a foundation
for evaluating the financial health of a firm.
customersgeneral Publicregulatorssuppliers

Financial Statements
o PURPOSE OF FINANCIAL STATEMENTS• Evaluate a firm’s internal
environmentefficiencyeffectivenessrisk level

Financial Statements
o PURPOSE OF FINANCIAL STATEMENTS• Evaluate a firm’s interaction with
the external environmentcorporate citizenshipsocial responsibilityassessment of the external environmentresponse to the external environment

Financial Statements
o PURPOSE OF FINANCIAL STATEMENTS• Provide information about the
performance of the firmstakeholders want to compare actual vs. potential performance

Financial Statements and Accounting Principles
o GAAP• Generally Accepted Accounting
Principles (GAAP)accounting rules and standards that public companies must adhere to when they prepare financial statements and reportsestablished by the Financial Accounting Standards Board (FASB) and authorized by the Securities and Exchange Commission (SEC)

Financial Statements and Accounting Principles
o INTERNATIONAL GAAP• Uniform accounting rules and
procedures promoted by the International Accounting Standards Board
• Firms in the European Union are moving toward a “European GAAP”
• Economic and political pressure is building in the United States and Europe to develop a unified accounting system

Financial Statements and Accounting Principles
o GAAP• Guidelines, not rules
Firms have discretion about how their financial information is presented.No two firms are required to have identical statements.

Financial Statements and Accounting Principles
o GAAP• Guidelines, not rules.
Alternative terms on financial statements– balance sheet, statement of financial condition– income statement, statement of operations, profit and loss
statement– cost-of-goods-sold, cost-of -sales, cost-of-revenue, cost-of-
services-sold

Financial Statements and Accounting Principles
o FIVE IMPORTANT ACCOUNTING PRINCIPLES1. Assumption of Arm’s Length
TransactionParties involved in an economic transaction arrive at a decision independently and rationally.
2. Cost PrincipleAsset values are recorded at the cost for which they were acquired.

Financial Statements and Accounting Principles
o FIVE IMPORTANT ACCOUNTING PRINCIPLES3. Realization Principle
Revenue is recognized when a transaction is completed, although cash may be received earlier or later.
4. Matching PrincipleRevenue is matched with the expense incurred to generate it.

Financial Statements and Accounting Principles
o FIVE IMPORTANT ACCOUNTING PRINCIPLES5. Going Concern Assumption
Assume a company will continue to operate for the predictable future.
Financial Statements and Accounting Principles
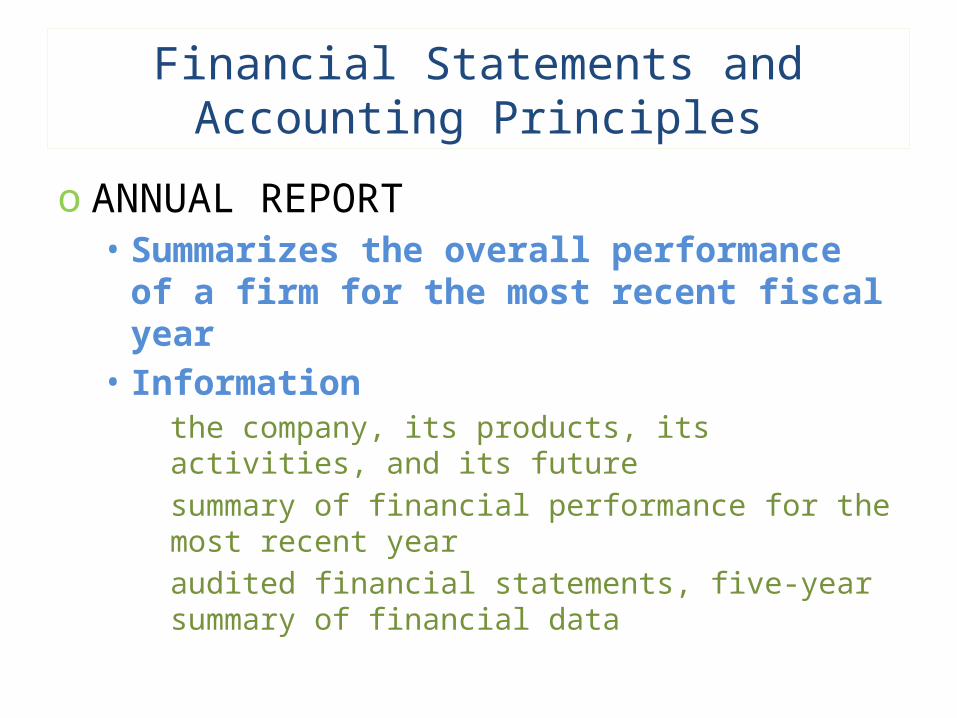
o ANNUAL REPORT• Summarizes the overall
performance of a firm for the most recent fiscal year
• Informationthe company, its products, its activities, and its futuresummary of financial performance for the most recent yearaudited financial statements, five-year summary of financial data

The Balance Sheet
o FIRM ASSETS & FUNDING AT A POINT IN TIME• Left side of a balance shows assets a
firm owns and uses to generate revenue
• Right side of the balance sheet shows sources of the funds used to acquire assets
)1.3('EquityrsStockholdeTotalsLiabilitieTotal
AssetsTotal

Diaz Manufacturing Balance Sheets as of December 31

The Balance Sheet
o ITEM ORDER• Assets listed in order of liquidity• Liabilities listed in order in which
they are due to be paid• Stockholders’ equity listed last
Common stockholders are entitled to assets remaining after all other providers of funds are paid.

The Balance Sheet
o CURRENT ASSETS• Assets likely to be converted to cash
within a year (or one operating cycle)
marketable securitiesaccounts receivableinventory

The Balance Sheet
o CURRENT LIABILITIES• Liabilities scheduled to be paid
within a year (or one operating cycle)
accounts payable accrued wagesdebt with less than a year’s maturitytaxes

The Balance Sheet
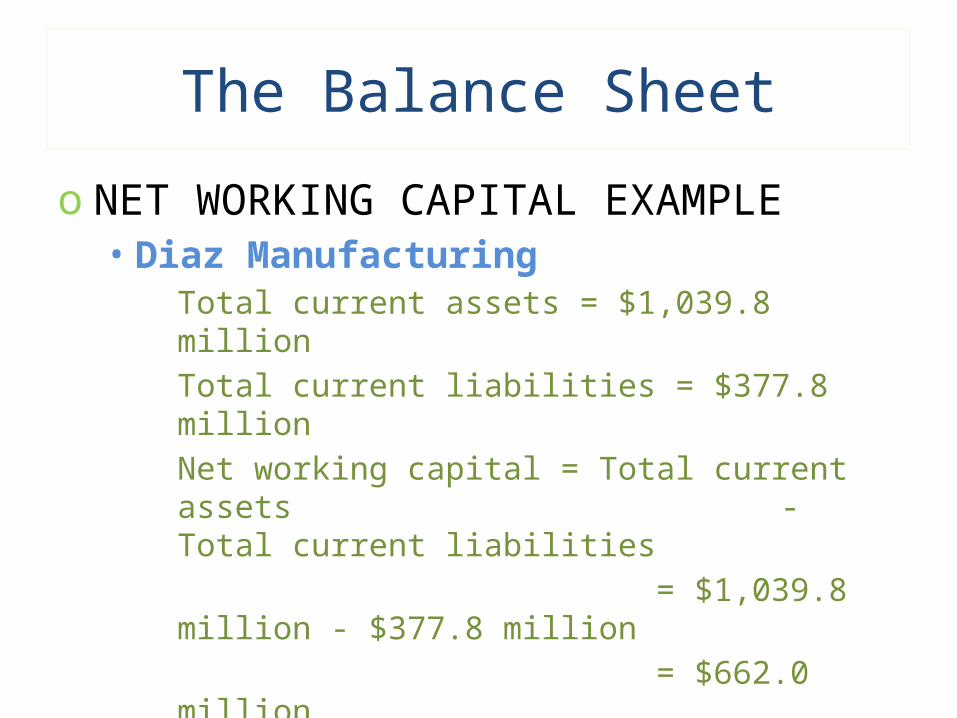
o NET WORKING CAPITAL
(3.2)sLiabilitie Current Total -
AssetsCurrent Total Capital WorkingNet
The Balance Sheet
o NET WORKING CAPITAL EXAMPLE• Diaz Manufacturing
Total current assets = $1,039.8 millionTotal current liabilities = $377.8 millionNet working capital = Total current assets
- Total current liabilities = $1,039.8 million - $377.8 million = $662.0 million

The Balance Sheet
o INVENTORY ACCOUNTING• Inventory (least liquid current
asset) reported using one of two methods
FIFO (first-in-first-out) assumes merchandise is sold in the order it was acquired by a firm.LIFO (last-in-first-out) assumes merchandise is sold in the reverse of the order it was acquired by a firm.
The Balance Sheet
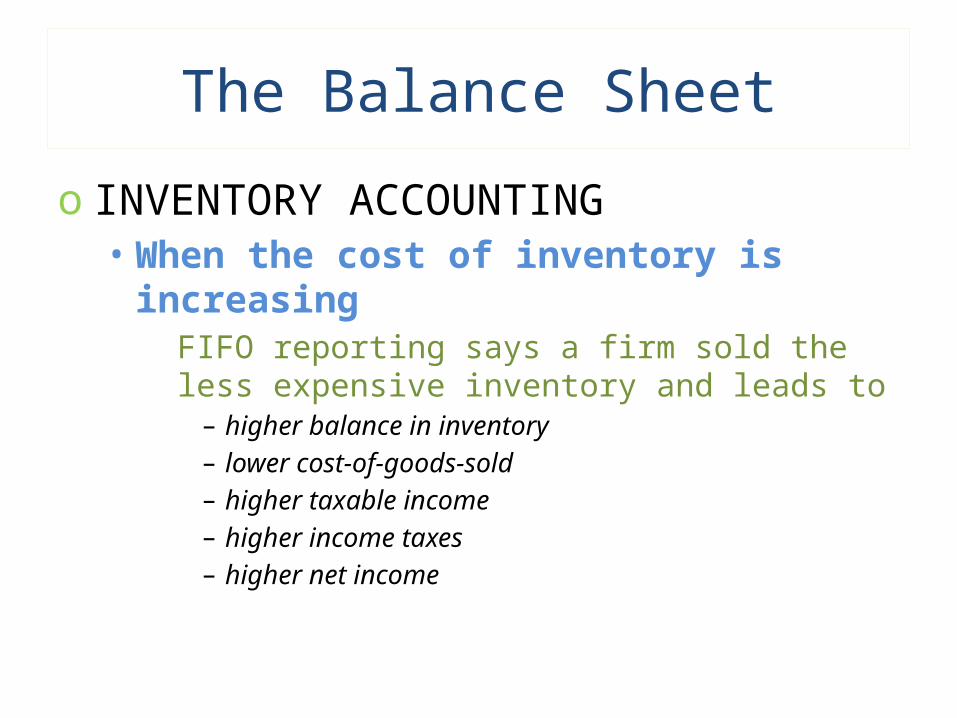
o INVENTORY ACCOUNTING• When the cost of inventory is
increasingFIFO reporting says a firm sold the less expensive inventory and leads to
– higher balance in inventory– lower cost-of-goods-sold– higher taxable income– higher income taxes– higher net income

The Balance Sheet
o INVENTORY ACCOUNTING• When the cost of inventory is
increasingLIFO reporting says a firm sold the more expensive inventory and leads to
– lower balance in inventory– higher cost-of-goods-sold– lower taxable income– lower income taxes– lower net income

The Balance Sheet
o INVENTORY ACCOUNTING• When the cost of inventory is
decreasingFIFO reporting says a firm sold the more expensive inventory and leads to
– lower balance in inventory– higher cost-of-goods-sold– lower taxable income– lower income taxes– lower net income

The Balance Sheet
o INVENTORY ACCOUNTING• When the cost of inventory is
decreasingLIFO reporting says a firm sold the less expensive inventory and leads to
– higher balance in inventory– lower cost-of-goods-sold– higher taxable income– higher income taxes– higher net income

The Balance Sheet
o INVENTORY ACCOUNTING• Firms may switch from one
inventory accounting method to the other under extraordinary circumstances but not frequently

The Balance Sheet
o LONG-TERM ASSETS• Real Assets
landbuildingsequipment
• Intangible Assetsgoodwillpatentscopyrights

The Balance Sheet
o LONG-TERM ASSETS• Real assets decline with use and are
depreciatedDepreciation expense reduces taxable income and income taxes.Assets are depreciated using either the straight line or accelerated depreciation method.
• Intangible assets lose value over time and are amortized (equivalent to depreciated)
The Balance Sheet
o LONG-TERM LIABILITIES• Long-term debt
bank loansmortgagesbonds with a maturity longer than one year

The Balance Sheet
o EQUITY • Common Stock
ownership with control in a firm
• Preferred Stockownership without control in a firmfeatures make it an equity security that resembles debt
The Balance Sheet
o OTHER BALANCE SHEET ACCOUNTS• Retained earnings
Profit kept and used to acquire assets.
• Treasury stockShares of its own stock a firm holds rather than sell them to the public.

Market Value vs. Book Value
o RECORDING ASSET VALUE• Assets are traditionally reported at
historical cost on a balance sheet• Balance sheet amount does not
reflect current market value – only the acquisition cost

Market Value vs. Book Value
o ASSET VALUATION• Better information is provided to
management and investors by marking-to-market — reporting balance sheet items at current market values
difficult to determine market values of assets
• The difference between the market values of assets and liabilities is a realistic estimate of the market value of shareholders’ equity

The Income Statement
o INCOME STATEMENT: OVERVIEW• Measures the profitability of a firm
for a reporting period• Revenue is income from selling
products and services – for cash or credit
• Expenses include costs of providing products and services, and asset utilization (depreciation and amortization) (3.3) Expenses – Revenues income Net

Diaz Manufacturing Income Statements

The Income Statement
o NET INCOME EXAMPLE• Diaz Manufacturing
Revenues = $1,563.7 millionExpenses = $1,445.2 millionNet Income = Revenues – Expenses
= $1,563.7 million - $1,445.2 million = $ 118.5 million

The Income Statement
o DEPRECIATION• The cost of a physical asset, such as
plant or machinery, is written off over its lifetime. This is called depreciation, a non-cash expense
• Firms use one of these depreciation methods
straight-line depreciationaccelerated depreciation
– Firms may choose to use one for internal purposes and another for tax purposes or for statements released to the public.

The Income Statement
o AMORTIZATION• Amortization expense is related to
using intangible assetsgoodwillpatentslicenses
– Like depreciation, it is a non-cash expense.

The Income Statement
o EXTRAORDINARY ITEM • Income or expense associated with
events that are infrequent and abnormal
separated from the results of ordinary incomeshown separately on the income statement

The Income Statement
o EBITDA AND EBIT• Earnings-before-interest-taxes-
depreciation-and-amortization (EBITDA)
income from selling goods and services minus the cost of providing them
• Earnings-before-interest-and-taxes (EBIT)
EBITDA minus depreciation and amortization

The Income Statement
o EBT AND NI• Earnings-before-taxes (EBT)
EBIT minus interest expensetaxable income
• Net income (NI)EBT minus taxes

Statement of Retained Earnings
o RETAINED EARNINGS• Shows cumulative effect of
adjustments to shareholders’ equity resulting from profit, losses, and paying dividends
• Shows changes in the account for a period based on profit, loss, or dividend paid

Diaz Manufacturing Statement of Retained Earnings

Cash Flows
o NET CASH FLOWS VERSUS NET INCOME• Accountants focus on net income
and shareholders focus on net cash flows. These are not the same because of delays in inflows and outflows, and non-cash revenues and expenses

Cash Flows
o CASH FLOWS TO INVESTORS• Cash flows available to investors
from operating activities (CFOA)
(3.4) expenses Noncash
TaxesCurrent – EBIT CFOA
Cash Flows
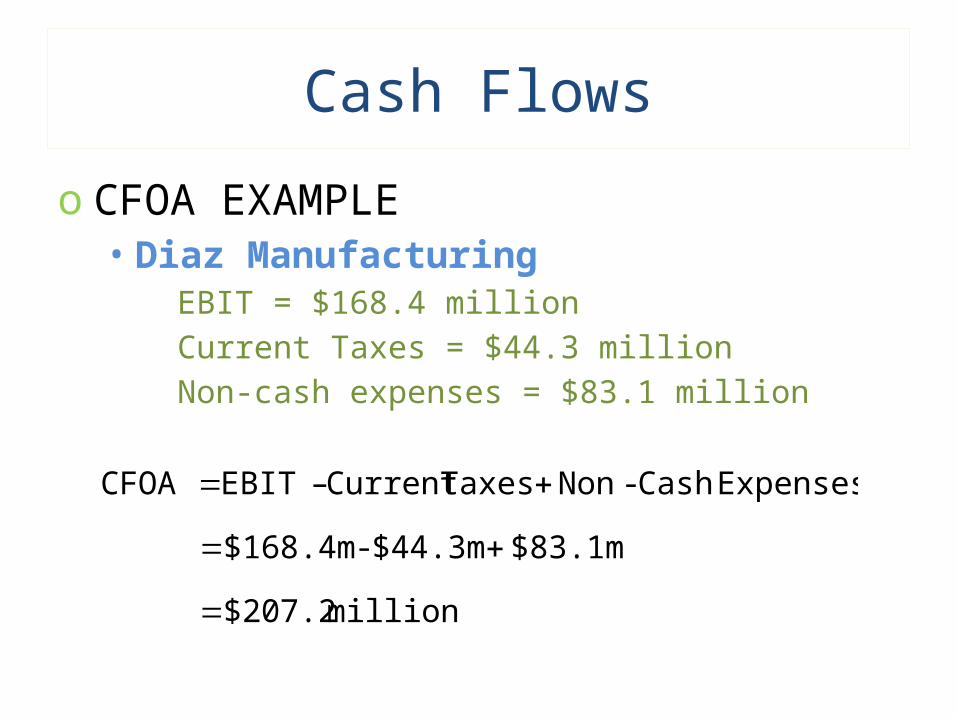
o CFOA EXAMPLE• Diaz Manufacturing
EBIT = $168.4 millionCurrent Taxes = $44.3 millionNon-cash expenses = $83.1 million
million $207.2
$83.1m $44.3m - $168.4m
Expenses Cash-Non Taxes Current – EBIT CFOA

Cash Flows
o CASH FLOWS TO WORKING CAPITAL• To compute the net cash flows into
or out of working capital
(3.5) NWC- NWC CFNWCPeriod PreviousPeriod Current

Cash Flows
o CFNWC EXAMPLE• Diaz Manufacturing
NWC 2011 = $662.0 millionNWC 2010 = $342.0 million
million $320.0
$342.0 - $662.0m
NWC – NWC CFNWC201020112011

Cash Flows
o STATEMENT OF CASH FLOWS• Summarizes cash outflows and cash
inflows during a period• Cash flows result from operating
activities, investing activities, and financing activities
• Net cash flows equals cash inflows minus cash outflows

Diaz Manufacturing Statement of Cash Flows

Cash Flows
o STATEMENT OF CASH FLOWS ORGANIZATION• Operating Activities
cash inflows– sell goods and services
cash outflows– raw materials– inventory– salaries and wages– utilities– rent

Cash Flows
o STATEMENT OF CASH FLOWS ORGANIZATION• Investing Activities
cash outflows and inflows due to– buying and selling long-term assets such as plant and
equipment– buying and selling bonds and stocks issued by other firms

Cash Flows
o STATEMENT OF CASH FLOWS ORGANIZATION• Financing Activities
cash inflow– issue debt– issue equity– borrow money
cash outflow– pay interest or dividends– repay loan principal– purchase treasury stock

Interrelations Among the Financial Statements

Federal Income Tax
o CORPORATE INCOME TAX• U.S. has a progressive tax with rates
ranging from 15 percent to 39 percent
higher taxable income = higher the tax liability

Corporate Tax Rates for 2010

Federal Income Tax
o AVERAGE VERSUS MARGINAL TAX RATE• Average tax rate
total taxes paid divided by taxable income for the period
• Marginal tax raterate paid on the last dollar earned or the next dollar that will be earned

Federal Income Tax
o DIVIDENDS AND INTEREST ARE NOT EQUAL• U.S. tax code
allows interest payments on debt to reduce firms’ taxable incomedoes not allow dividend payments to equity to reduce firms’ taxable income
– debt financing has a lower cost relative to equity financing