Embed Size (px)
Citation preview
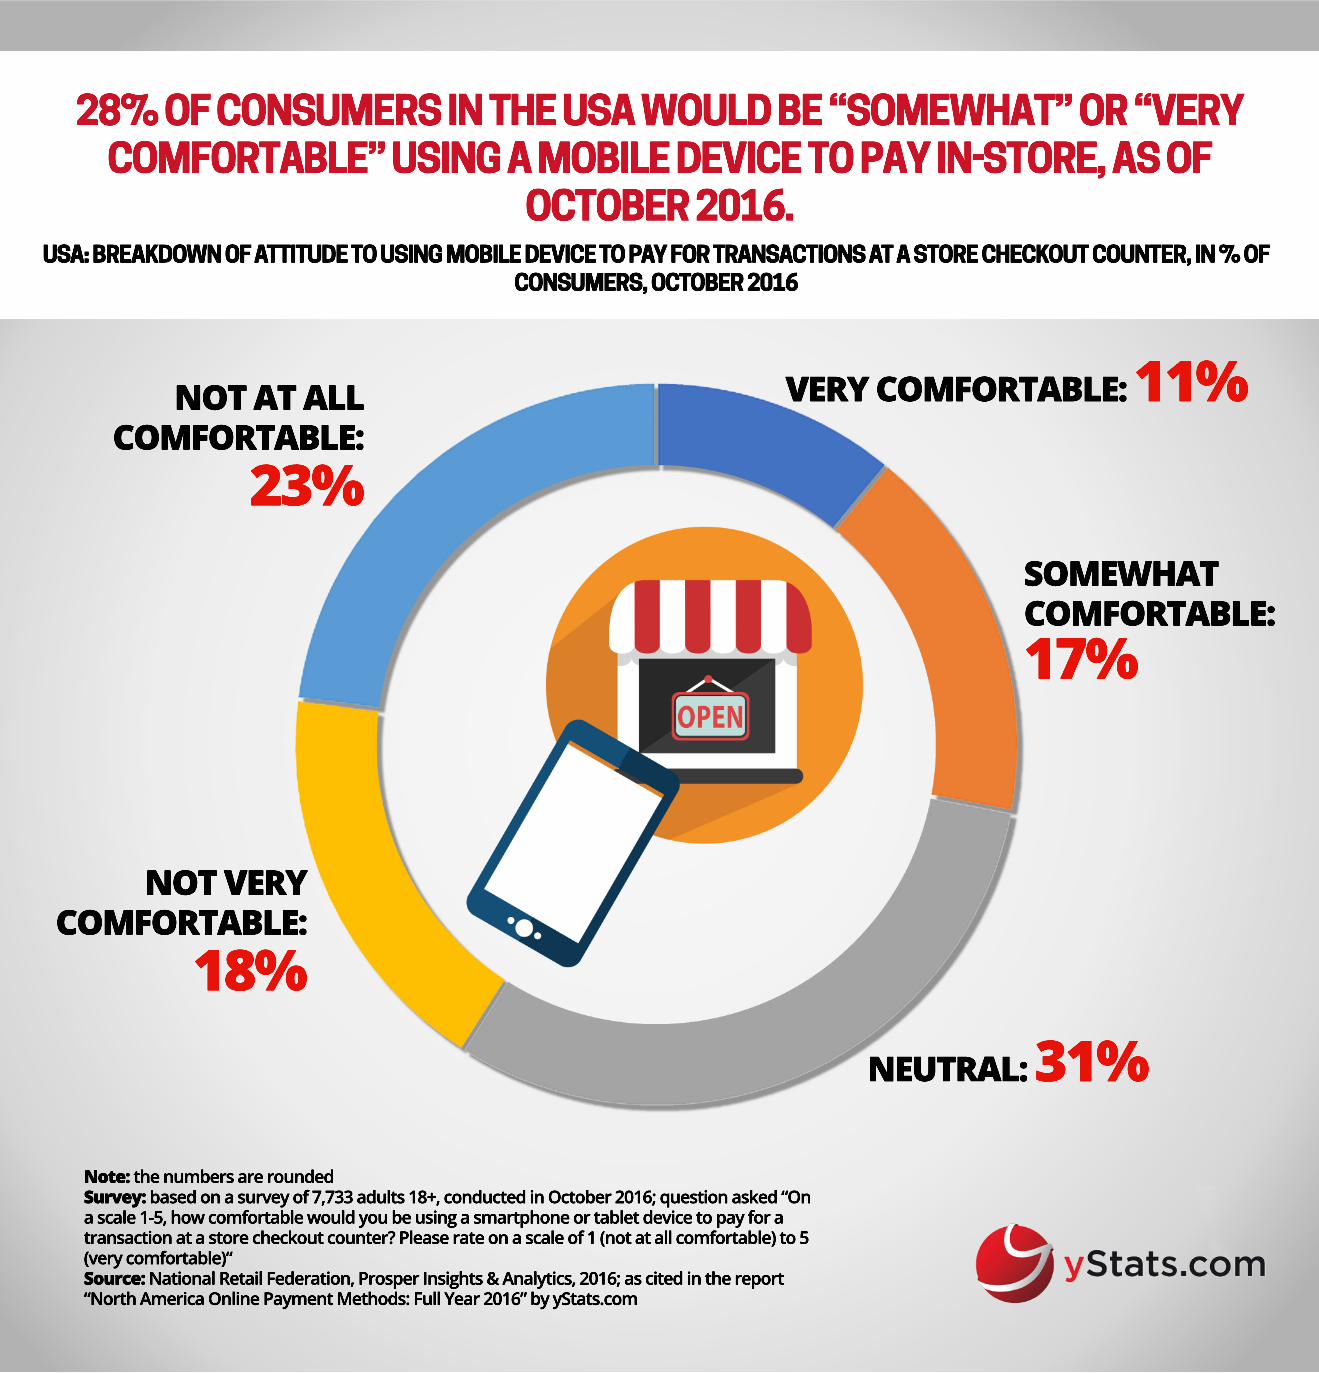
28% OF CONSUMERS IN THE USA WOULD BE “SOMEWHAT” OR “VERY COMFORTABLE” USING A MOBILE DEVICE TO PAY INSTORE, AS OF
OCTOBER 2016.USA: BREAKDOWN OF ATTITUDE TO USING MOBILE DEVICE TO PAY FOR TRANSACTIONS AT A STORE CHECKOUT COUNTER, IN % OF
CONSUMERS, OCTOBER 2016
Note: the numbers are roundedSurvey: based on a survey of 7,733 adults 18+, conducted in October 2016; question asked “On a scale 1-5, how comfortable would you be using a smartphone or tablet device to pay for a transaction at a store checkout counter? Please rate on a scale of 1 (not at all comfortable) to 5 (very comfortable)“ Source:Source: National Retail Federation, Prosper Insights & Analytics, 2016; as cited in the report “North America Online Payment Methods: Full Year 2016” by yStats.com
VERY COMFORTABLE: 11%
NOT VERY COMFORTABLE:
18%
NOT AT ALLCOMFORTABLE:
23%
NEUTRAL: 31%
SOMEWHAT COMFORTABLE: 17%