Embed Size (px)
Citation preview

Improving production and supply chain performanceCase studies from EY/P&G and client partnerships
Richard Goussard - EY

Supply chains are under pressure to reduce costs, but also to increase agility and responsiveness …
Dri
ve
rs
Internal cost structures challenged
Challenging opportunities in emerging
markets
Increasinglycomplex routes to market
External cost pressures growing
Limited volume growth
in mature markets
Digital is shifting control
to the consumer
Higher numbers of promotions and innovations to try and grow or maintain sales volumes –introducing volatility into the SC and increasing cost
Operating in large number of diverse, volatile markets with strong local preferences creates significant SC complexity.
Rapid pace of technology change requires companies to rethink product, packaging design, marketing and fulfilment
Consumers are utilizing multiple channels any time, any place -with limited loyalty.
Retailers are pushing for more service requirements, increasing SC costs
Input costs are volatile, rising and difficult to hedge against across a number of areas - commodities, labour, energy
Excess capacity in mature markets is decreasing SC efficiency.
Margin leakage throughout the value chain counteracts cost saving programmes
Ch
all
en
ge
s
Customerbehaviour is changing
Costs are hard to control
Growth is challenging
… but despite numerous improvement programmes, COGs and DIO performance is still poor
100
60
80
40
20
16012080400
COGS and inventory performance trend (2014*)
Foods Beverages
HPC Tobacco
Sports wear
CO
GS
% o
f N
et
Sale
s (
2014)
DIO (2014)
*
Average: 67.5
* LTM data as on Jan. 2015Source: CapIQ, EY analysis
62
63
64
65
66
67
68
44%
46%
48%
50%
52%
54%
2010 2014
D I
O
CO
GS
% o
f N
et
Sale
s
COGS % of net sales DIO
Average: 47.8%

Manufacturing performance has become even more critical to delivering business results
Current situation
Manufacturing and SC working together
Relatively stable end demand
But signal amplification compounds
erratic production
..leading to volatile
inventory
..aligned to semi fixed rhythm wheel
approach
Forecasting parameters changed \sales ‘trust’ production
Driving stability in operations and 28%
lower inventory
• Current manufacturing performance at many companies is an obstacle to optimising the supply chain, and achieving revenue and margin growth
• Majority still suffer from significant planning and execution issues
• The bull whip effect “noise”, even in vertically integrated companies, adds cost and complexity to operations
• Organisations have embraced various manufacturing excellence programs
• However, they are still struggling to make a sustainable breakthrough in performance
• Unlocking an additional +30% OEE productivity has significant value• $200-300m of cost saving
• Increased manufacturing flexibility and responsiveness to support sales growth
• Ability to re-balance the supply chain and reduce inventory
• Ability to streamline distribution networks
• Synchronization combined with improved manufacturing discipline typically delivers:• 30%-50% inventory reduction
• Up to 10% improvement in agility and OEE

Operational excellence requires an operating model underpinned by Integrated Work Systems, to drive reliable performance
• Asset Reliability Management
• Throughput Optimisation
• Integrated Planning & Execution
• Cost & Margin Optimisation
• Safety & Integrity Management
• Supply Chain Integration
• Contractor & Contract Management
De
sig
n Do you have the right operating
model to deliver your ambition?
Imp
lem
en
t Do you have the operational capabilities required to operate?
Do your people do the right
things, the right way?S
us
tain
Organisation& Roles
Processes &Procedures
People &Capability
Policies &Standards
Leadership & Governance
Technology &Systems
Metrics &Performance
GeographicArchitecture
Market / Commercial
Model
OperatingStrategy
Integrated Work
Systems

Many leading companies have Operational Excellence standards and management systems in place
BP Bosch Toyota Chevron Shell
Operations Management System
Bosch Production System
Toyota Production System
Operational Excellence Management System
Operational Excellence Standard
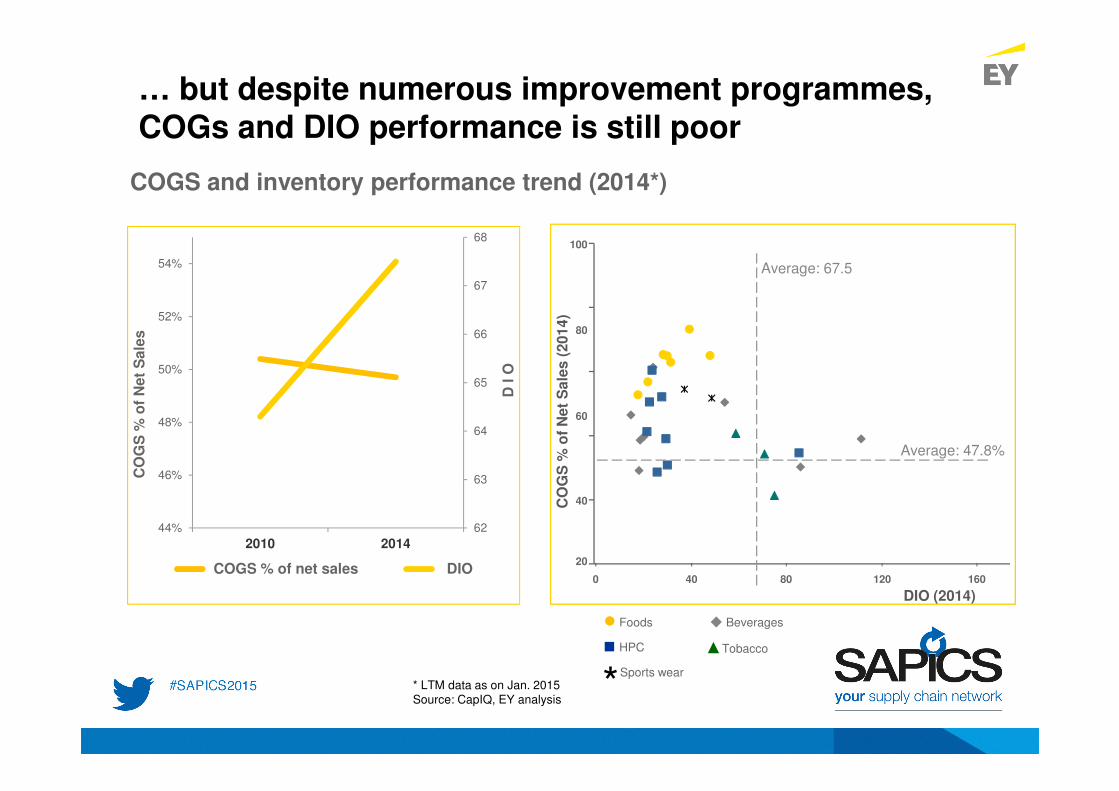
About P&G
Largest CPG Co in World
• Sales: More than $80 billion
• 142 factories globally
• 127,000 employees
• About 4.4 billion consumers
Average plant is 300 - 500 employees
• SKUS 250-5000
• Changeovers are our daily work
Complex chemical making and ingredient processes
• Powder Making & Blending
• Enzymes, Bleaches, Chemistry
• Stamping Extrusion and Molding
• Filling liquids, creams and gels
• Solids / Powers / Tabs
• High speed precision assembly, paper, plastics and metal
• Line Speeds from 100 – 3000 items per minute
The Brands
• Among the most trusted in the world
• 50 leadership brands
• 25 billion-dollar brands
• Market leader in two-thirds of the 21 categories that they compete in
Source: P&G
History and current results from P&G’s Integrated Reliability
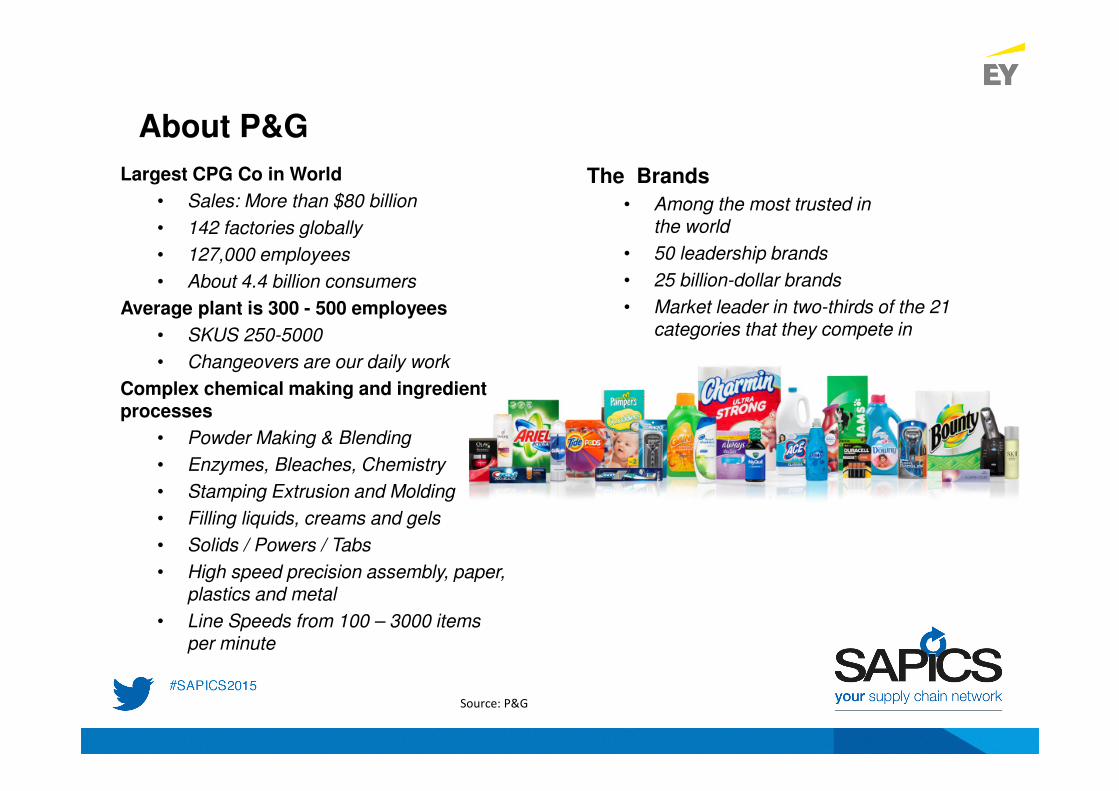
1990 2000 2012
$ 20 B $ 41B $ 83B
Vicks
Norwich
Noxell
Blendax
Sundor
PUR
Max Factor
IAMS
Milestone
Tambrands
Clairol
Wella
Gillette
Ambipur
Striving to be global… Truly Global
167 plants 154 plants 142 plants
IWS is a global competitive advantage for P&G
• +20 yrs. investing in a customised manufacturing system combining Lean, TPM, etc including 3 years with Toyota
• “Cash positive” factories
• Back to original high OEE performance within 14 days of any line change
• Successfully deployed manufacturing system in a high number of acquisitions
Over the past five years...
• Achieved savings of $700 m
• Generated $1bn in cash
• In 3 years moved capital from 7.5% to < 5% of NOS
• Global factories at 85-94% OEE
Source: P&G, EY analysis
OEE = Overall Equipment Efficiency
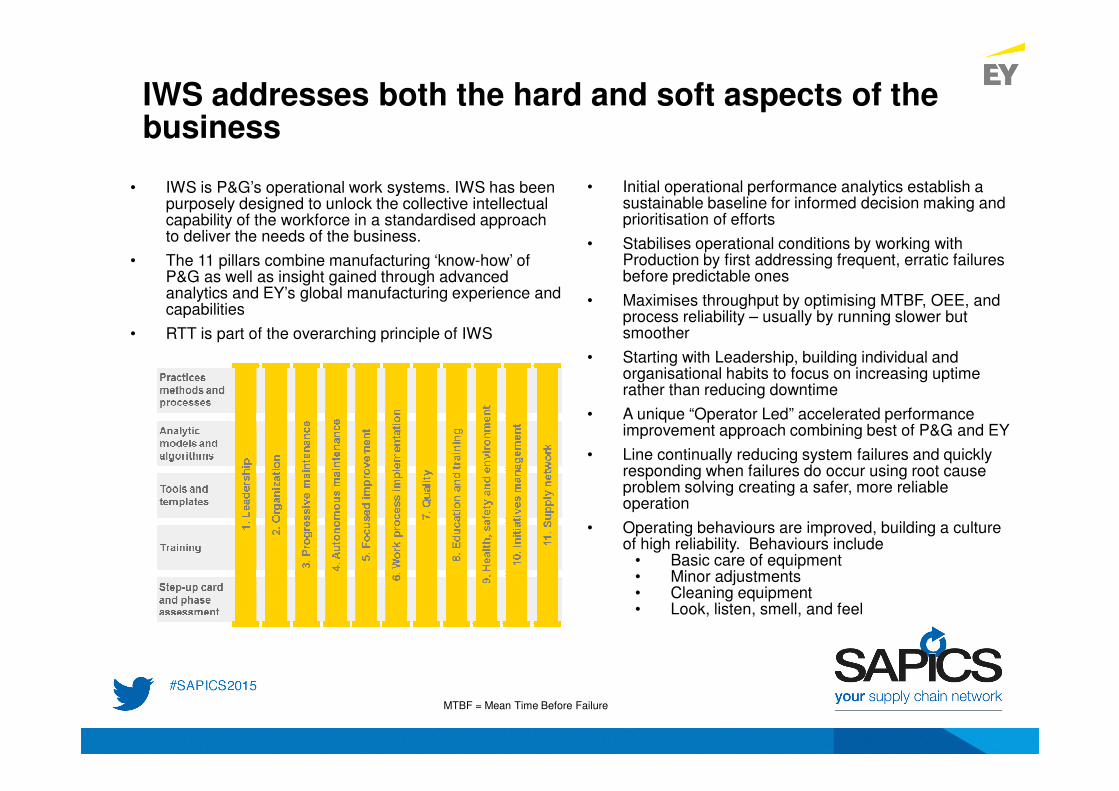
IWS addresses both the hard and soft aspects of the business
• Initial operational performance analytics establish a sustainable baseline for informed decision making and prioritisation of efforts
• Stabilises operational conditions by working with Production by first addressing frequent, erratic failures before predictable ones
• Maximises throughput by optimising MTBF, OEE, and process reliability – usually by running slower but smoother
• Starting with Leadership, building individual and organisational habits to focus on increasing uptime rather than reducing downtime
• A unique “Operator Led” accelerated performance improvement approach combining best of P&G and EY
• Line continually reducing system failures and quickly responding when failures do occur using root cause problem solving creating a safer, more reliable operation
• Operating behaviours are improved, building a culture of high reliability. Behaviours include
• Basic care of equipment• Minor adjustments• Cleaning equipment• Look, listen, smell, and feel
• IWS is P&G’s operational work systems. IWS has been purposely designed to unlock the collective intellectual capability of the workforce in a standardised approach to deliver the needs of the business.
• The 11 pillars combine manufacturing ‘know-how’ of P&G as well as insight gained through advanced analytics and EY’s global manufacturing experience and capabilities
• RTT is part of the overarching principle of IWS
MTBF = Mean Time Before Failure

Realizing the benefits
Quality improvements
Consolidate volume within factory and
across the network
Improve agility and responsiveness across
Supply Chain
Increase capacity of constrained lines
Activation of employees
Benefit Realisation Levers
Impact of benefit realisation lever
• Reduce level of rejects• Reduce waste and spoilage
• Reduce complexity by reviewing sourcing profile within plant and across the network, close lines / plants
• Consolidate volumes of one kind of product at one plant• Bring volume from co-packers to plants
• Avoid CAPEX required on constrained lines• Reduce inventory by reducing the need for stock build• Improve service level by improving order fulfilment
• Operator led involved and self managed teams • Daily management systems• Stable supply and operations• Total employee involvement and ownership
• Lower inventory by reducing safety stock through improved reliability• Ability to have more frequent change overs without increasing cost• Reduced manufacturing lead times and batch sizes• Move to “cash positive” factories
Cost savings• Reduce temporary direct and fixed labour• Reduce utilities costs• Reduce maintenance costs
Achieving operational excellence has several benefits for the organisation

Case Study
Leading cigarette manufacturer

Implementation approach
Implementations so far… Key Success Drivers
• Cultural change from reactive downtime focus to a preventative and stability oriented approach
• Leadership support for the required behavioural and organisational changes
• Empowerment of Line Structure and Operators
• Focus on reduction of (unplanned) stops, not downtime
• Eventual OEE improvement through increased line stability
• Brazil
• Turkey
• Russia
• Switzerland
• Mexico
• Poland
• Singapore
• Germany
• South Africa
• Nigeria
• Korea
• Bangladesh
• Netherlands
• Indonesia
• Romania
• The manufacturers own improvement programme was supplemented with EY/P&G’s Run To Target
(RTT)
• Between October 2013 and April 2014, the manufacturer partnered with EY/P&G in a pilot phase (PoC)
to test RTT effectiveness; RTT was then rolled out to additional plants
• EY teams worked alongside the client teams throughout implementation

RTT Language and Methodology
• RTT is part of the overarching principle of IWS
• Servant Leadership
• Stops focused vs. downtime focused
• Proactive (anticipation) vs. reactive (firefighting); shift losses from unplanned to planned - then control and reduce
• Dedicated Line Structure to coordinate and prioritize efforts
• Daily Direction Setting meetings
• Daily focus on top 3 losses of previous 24h
• Shifts more traditional maintenance tasks to operators
• Builds technical mastery of equipment
• Daily Management Systems serve as permanent countermeasure
• Centerlines (CL)
• Clean, Inspect, Lubricate (CIL)
• Defect Handling (DH)
• Incident Elimination (IE)
• Breakdown Elimination (BDE)
• Rapid Changeover (RCO)
• Maintenance Planning & Scheduling (MP&S)
• Change Management (CM)
Key Objective: Improve line performance using RTT / IWS

Improvement in Unplanned Downtime (UPDT) is a critical enabler of creating a highly reliable culture, generating upstream and downstream SC predictability
• A key driver for MTBF improvement has been rigorous daily focus on elimination of Top Stops • The focus on eliminating Unplanned Downtime improved MTBF, Availability, and Reliability,
resulting in increased Throughput
Ongoing focus on Top Stops
Ongoing focus on Top Stops
Line # Baseline Final OEE Points Improvement % Improvement
5D 29% 19% 10 35%
5E 30% 9% 21 70%
5F 24% 15% 9 38%
Source: EY analysis
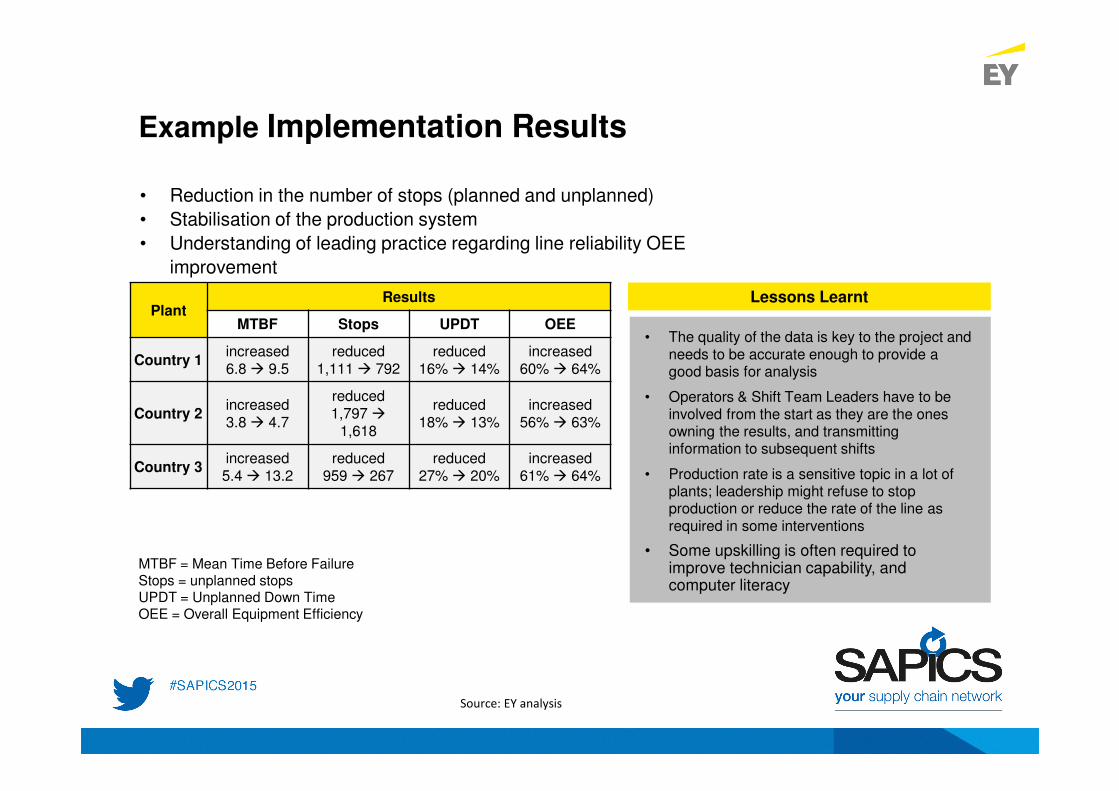
Example Implementation Results
PlantResults
MTBF Stops UPDT OEE
Country 1increased6.8 � 9.5
reduced1,111 � 792
reduced16% � 14%
increased60% � 64%
Country 2increased3.8 � 4.7
reduced1,797 �
1,618
reduced18% � 13%
increased56% � 63%
Country 3increased5.4 � 13.2
reduced959 � 267
reduced27% � 20%
increased61% � 64%
MTBF = Mean Time Before FailureStops = unplanned stopsUPDT = Unplanned Down TimeOEE = Overall Equipment Efficiency
• Reduction in the number of stops (planned and unplanned)
• Stabilisation of the production system
• Understanding of leading practice regarding line reliability OEE
improvement
Lessons Learnt
• The quality of the data is key to the project and needs to be accurate enough to provide a good basis for analysis
• Operators & Shift Team Leaders have to be involved from the start as they are the ones owning the results, and transmitting information to subsequent shifts
• Production rate is a sensitive topic in a lot of plants; leadership might refuse to stop production or reduce the rate of the line as required in some interventions
• Some upskilling is often required to improve technician capability, and computer literacy
Source: EY analysis
Case Study
Leading mining company

Findings ways to increase value chain throughput
• Client operates a full pit-port operation
• Value chain runs from multiple mines through to a port
• Production growth from 187Mtpa to 212Mpta, and then upwards
Supply Chain Process Model – Pit to Port

Reliability Simulation
Based on 30 years of statistical research, designed to effectively model complex processes such as FMCG production, high volume manufacturing, and mining
Pre-mature Competing Cause
Wear Out
Cumulative
Competing Cause

Understanding root causes of losses
100
80
60
40
20
0
Close Coupled, Linear Decoupled, Surge, Parallel
Loss allocation
RE Improvement
One -Click
Competing Cause
Simulation
System Complexity
Downtime Analysis
MTBF
Prioritisation
Perf
orm
an
ce
Loss Tree
Pareto
Losses
Planned Losses• Planned Maintenance• Cleaning and sanitisation
Competing Events
Cumulative Events Some Unplanned Losses
• Breakdowns with or with no forced deterioration
• Material replenishment
Unplanned Losses• Usually all minor stops• Usually all process failures• Breakdowns with forced deterioration
• Using past performance data it is possible to create a model that allows EY to identify the potential performance of the mine and processing plant, based on a set of standard archetypes
• Inputs include:• Production Rate• Availability and Repair Time• Fleet Size• Transportation Parameters
• As the model includes all experienced variables from the operation, the potential performance becomes the ‘benchmark’ and the factors making up the gap become the outputs of the diagnosis
• Outputs include :• Size of the performance gap ($$s,
tonnes, recovery)• Barriers to performance• High level improvement plan

Fines TL
Coarse Ore Stockpile
Mainline Train
ShuttleTrain
Conveyor from ore beneficiation Plant
Lump TL
Ore processing
Source: BHPBIO
Ore processing operations

Ore processing analysis
Complex operation, representing almost 25% of site production
Analysis identified that ore processing accounted for ~80% of the bottlenecks on a daily basis
It set the following improvement targets
• OP: 5.4 Mtpa (11% ↑)
• TL: 29.8 Mtpa (57% ↑)
Mine Control increased throughput and capacity by improving standards and operating practices:
• OP: ~ 2-3%
• TL: ~ 20%
Sophisticated Reliability Technology analytics complemented this by identifying and delivering additional % throughput improvements
Ore processing (OP)Ore processing:
Theoretical limit = 8000hrs / yrAvailability = 75%Utilisation = 80%OEE = 68% (49 Mtpa)
Reclaimer:Theoretical limit = 8000hrs / yrAvailability = 90%Utilisation = 55%OEE = 55% (55 Mtpa)
Train Loading (TL)
Lump:Theoretical limit = 8000hrs / yrAvailability = 90%Utilisation = 20%OEE = 19% (25 Mtpa)
Fines:Theoretical limit = 8000hrs / yrAvailability = 95%Utilisation = 35%OEE = 30% (36 Mtpa)

Analysis of the value chain using Pit to Port simulation
A diagnostic tool was used to model actual and ideal performance of the operation, quantifying the gaps and identifying the key improvement areas

Competing Cause Plots INSIGHTAn estimated $ xx M incremental profit from improved
productivity at bottleneck equipment by embedding advanced reliability technology capabilities
Rate Reliability Optimisation
Analysis of the ore processing plantP
rob
ab
ilit
y o
f e
qu
ipm
en
t ru
nn
ing
(%)
Time (minutes)
MT
BF
Pro
cess
Re
lia
bil
ity
Th
rou
gh
pu
t F
act
or
(%)
Base Target Rate
Throughput
Factor
10%
120
110
100
90
80
70
60
50
40
30
20Pro
cess
Re
lia
bil
ity
Th
rou
gh
pu
t
Fact
or
(%)
tonnes per hour
Legend
Process Reliability
MTBF (min)
MTBF (max)
$ xx M
Incremental
throughput (Mtpa)
Potential
Margin
Uplift
Throughput
(Mtpa)

Value chain scenario analysis highlights opportunities for increasing throughput
200
210
220
230
240
250
260
270
280
Options to increase throughput (Mtpa)
180
170
160
150
140
130
120
110
100

200,000 people | 750 offices | 150 countries
Our Purpose
Building a better working world.
EY is committed to doing its part in building a better working world
The insights and quality services we deliver help build trust and confidence in the capital markets and in economies the world over
We develop outstanding leaders who team to deliver on our promises to all of our stakeholders
In so doing, we play a critical role in building a better working world for our people, for our clients and for our communities
Who we are
People who demonstrate integrity, respect and teaming.
People with energy, enthusiasm, and the courage to lead.
People who build relationships based on doing the right thing.
EY – A global leader
EY is a global leader in assurance, tax, transaction and advisory services. Worldwide, our 200,000 people are united by our shared values and an unwavering commitment to quality.

Thank you