Embed Size (px)
Citation preview


Acknowledgements 2011 Monterey & San Benito Counties Homeless Census and Survey
ii © Applied Survey Research, 2011

2011 Monterey and San Benito Counties Homeless Census and Survey Acknowledgments
© Applied Survey Research, 2011 iii
ACKNOWLEDGEMENTS
The considerable talents and efforts of many individuals helped to assure the success of this endeavor. Monterey County, San Benito County, The United Way and Applied Survey Research (ASR) would like to thank the donors and sponsors of this project and the many service providers who assisted in the administration of surveys, facilitated the process of homeless peer enumeration by recruiting census workers, and opened the doors of their facilities to host training sessions, deploy census workers, or distribute surveys. Monterey County, San Benito County, The United Way and ASR would also like to thank the hundreds of community volunteers who participated in the 2011 Monterey and San Benito Counties Homeless Census and Survey efforts. Finally, all parties would like to thank the homeless census and survey workers, as well as the survey respondents, whose efforts are reflected throughout the findings of this report.
Project Donors and Sponsors
Coalition of Homeless Service Providers
Monterey County Dept of Social and Employment Services and Behavioral Health Department
San Benito County
United Way Monterey County
Project Committee
Members:
Central Coast HIV/AIDS Services (CCHAS)
Community Human Services (CHS)
Franciscan Workers of Junipero Serra/Dorothy's Place
Housing Authority of the County of Monterey (HACM)
Interim, Inc.
Peninsula Corps
Salvation Army, Monterey
Shelter Outreach Plus
Sun Street Centers
Veterans Transition Center of Monterey
YWCA Monterey County
Associate Members:
Food Bank of Monterey County
Housing Resource Center
Community Advisors
City of Marina
City of Salinas
Monterey County, Dept. of Social and Employment Services Community Action Partnership
Monterey County Office of Education
Sand City
U.S. Department of Veterans Affairs
Applied Survey Research
Project Director
Peter Connery, Vice President
Analysts and Researchers
Susan Brutschy, President
Shary Carvalho
James Connery
John Connery
Laura Connery
Natalie Dalton
Samantha Green
Ken Ithiphol
Michelle Luedtke
Javier Salcedo
Joanne Sánchez
Deanna Zachary
Acknowledgements 2011 Monterey & San Benito Counties Homeless Census and Survey
iv © Applied Survey Research, 2011
Training Centers, Deployment Sites, and Survey Distribution Centers
City Hall Rotunda
Salinas
First United Methodist Church
Salinas
Martinez Hall
Marina
Oldemeyer Center
Seaside
Salvation Army
Seaside

2011 Monterey & San Benito Counties Homeless Census and Survey Table of Contents
© Applied Survey Research, 2011 v
TABLE OF CONTENTS Acknowledgements ...................................................................................................................................................................... iii
Training Centers, Deployment Sites, and Survey Distribution Centers ................................................................................... iv
Introduction .................................................................................................................................................................................... 9
Federal Definition of Homelessness ....................................................................................................................................... 10
Project Purpose and Goals ..................................................................................................................................................... 11
Monterey County Executive Summary ...................................................................................................................................... 12
Monterey County Homeless Census Findings .......................................................................................................................... 17
The Point-in-Time Count in Monterey County ........................................................................................................................ 17
Monterey County Jurisdictional Data ........................................................................................................................................ 21
Total Number of Unsheltered and Sheltered Homeless Persons, by Jurisdiction .................................................................. 21
Monterey County Homeless Survey Findings ........................................................................................................................... 25
Demographics ........................................................................................................................................................................ 25 Age .................................................................................................................................................................................. 25 Race/Ethnicity ................................................................................................................................................................. 26
Residency Prior to Experiencing Homelessness .................................................................................................................... 27 County Residency ........................................................................................................................................................... 27 Previous Living Arrangements ........................................................................................................................................ 28
Current Living Situation .......................................................................................................................................................... 28 Usual Nighttime Accommodations................................................................................................................................... 28 Obstacles to Obtaining Permanent Housing ................................................................................................................... 29
Duration and Reoccurrences of Homelessness ..................................................................................................................... 30 Duration of Homelessness .............................................................................................................................................. 30 Occurrence of Homelessness ......................................................................................................................................... 31
Primary Causes of Homelessness ......................................................................................................................................... 32
Employment and Income ........................................................................................................................................................ 33 Employment Status ......................................................................................................................................................... 33 Income from Government Sources.................................................................................................................................. 35 Income from Private Sources .......................................................................................................................................... 36 Other Sources of Income ................................................................................................................................................ 36
Access to Government Assistance and Homeless Programs ................................................................................................ 37 Government Assistance .................................................................................................................................................. 37 Services and Programs ................................................................................................................................................... 38
Medical Care and Health Conditions ...................................................................................................................................... 39 Access to Medical Care ................................................................................................................................................... 39 Need for Medical Services .............................................................................................................................................. 40 Chronic Health Problems ................................................................................................................................................ 41
Disabling Conditions ............................................................................................................................................................... 42 Mental Health .................................................................................................................................................................. 43 Mental Health Services ................................................................................................................................................... 44 HIV/AIDS ......................................................................................................................................................................... 44 Physical and Developmental Disabilities ......................................................................................................................... 45
Substance Abuse ................................................................................................................................................................... 45
Domestic/Partner Violence or Abuse ...................................................................................................................................... 46

Table of Contents 2011 Monterey & San Benito Counties Homeless Census and Survey
vi © Applied Survey Research, 2011
Incarceration ........................................................................................................................................................................... 46 Transition from Jail or Prison ........................................................................................................................................... 46 Nights in Jail or Prison ..................................................................................................................................................... 47 Probation or Parole ......................................................................................................................................................... 47 Tickets ............................................................................................................................................................................. 47
Foster Care ............................................................................................................................................................................ 48 Transition from Foster Care ............................................................................................................................................ 48
Monterey County Homeless Subpopulations ........................................................................................................................... 49
Chronic Homelessness ........................................................................................................................................................... 49
Veterans ................................................................................................................................................................................. 51 Number of Sheltered and Unsheltered Homeless Veterans ............................................................................................ 51 Demographics of Homeless Veterans ............................................................................................................................. 51
Homeless Families ................................................................................................................................................................. 53 Number of Homeless Families ........................................................................................................................................ 54 Demographics of Homeless Families .............................................................................................................................. 54 Primary Cause of Homelessness for Homeless Families with Children .......................................................................... 54 Government Assistance for Homeless Families with Children ........................................................................................ 54 Usual Sleeping Places of Homeless Individuals with Children ........................................................................................ 55 Child Education ............................................................................................................................................................... 55 Children living in Foster Care or with Other Family Members ......................................................................................... 56
Unaccompanied Homeless Children and Youth ..................................................................................................................... 56 Number and Characteristics ............................................................................................................................................ 57 Demographics ................................................................................................................................................................. 57 Education and School Enrollment ................................................................................................................................... 57 County of Residency ....................................................................................................................................................... 58 Usual Sleeping Places .................................................................................................................................................... 58 Primary Cause of Homelessness .................................................................................................................................... 59 Utilization of Government and Social Assistance ............................................................................................................ 59 Social Support Networks ................................................................................................................................................. 59 Physical Health and Wellbeing ........................................................................................................................................ 60 Mental Health and Wellbeing .......................................................................................................................................... 60 Experiences with Violence .............................................................................................................................................. 60 Drug and Alcohol Abuse .................................................................................................................................................. 60
San Benito County Executive Summary ................................................................................................................................... 61
Conclusion ................................................................................................................................................................................... 64
Appendix I: Homeless Census and Survey Methodology ........................................................................................................ 65
Appendix II: Census Instruments ............................................................................................................................................... 73
Appendix III: Survey Instrument ................................................................................................................................................. 76
Appendix IV: Overall survey results (Monterey County) .......................................................................................................... 80
Appendix V: Overall survey results (San Benito County) ........................................................................................................ 95
Appendix VI: Definitions and Abbreviations ........................................................................................................................... 112
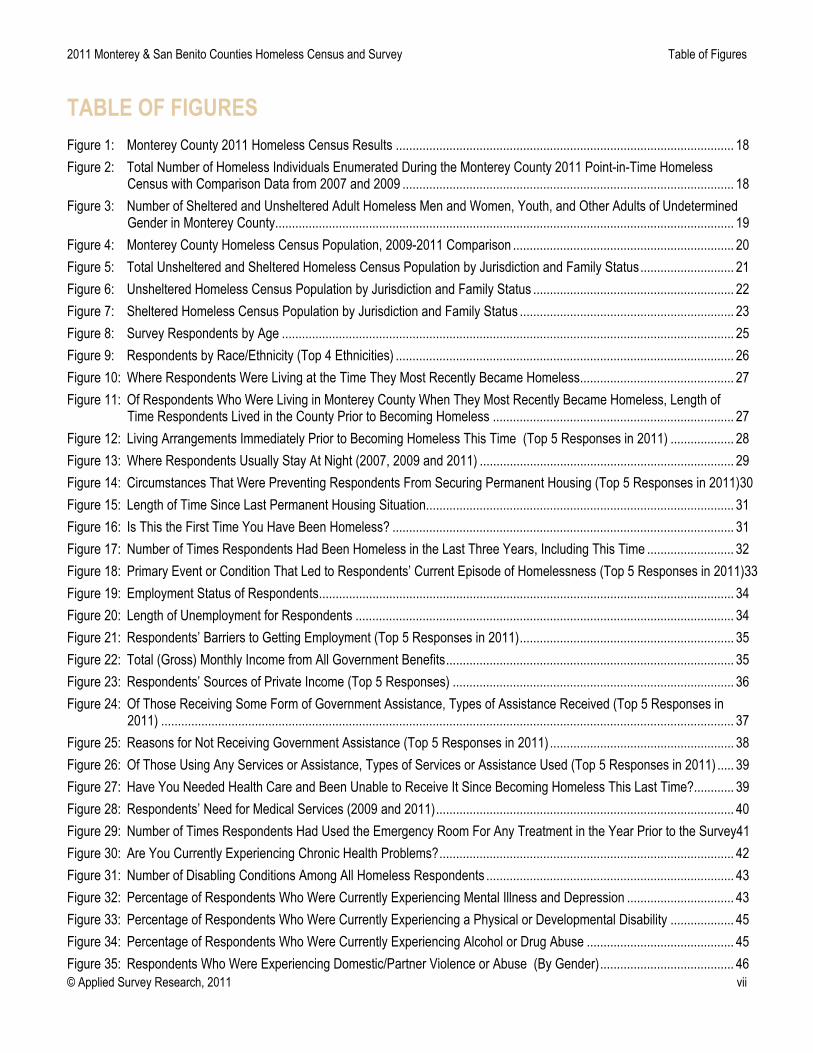
2011 Monterey & San Benito Counties Homeless Census and Survey Table of Figures
© Applied Survey Research, 2011 vii
TABLE OF FIGURES Figure 1: Monterey County 2011 Homeless Census Results ..................................................................................................... 18
Figure 2: Total Number of Homeless Individuals Enumerated During the Monterey County 2011 Point-in-Time Homeless Census with Comparison Data from 2007 and 2009 ................................................................................................... 18
Figure 3: Number of Sheltered and Unsheltered Adult Homeless Men and Women, Youth, and Other Adults of Undetermined Gender in Monterey County ......................................................................................................................................... 19
Figure 4: Monterey County Homeless Census Population, 2009-2011 Comparison .................................................................. 20
Figure 5: Total Unsheltered and Sheltered Homeless Census Population by Jurisdiction and Family Status ............................ 21
Figure 6: Unsheltered Homeless Census Population by Jurisdiction and Family Status ............................................................ 22
Figure 7: Sheltered Homeless Census Population by Jurisdiction and Family Status ................................................................ 23
Figure 8: Survey Respondents by Age ....................................................................................................................................... 25
Figure 9: Respondents by Race/Ethnicity (Top 4 Ethnicities) ..................................................................................................... 26
Figure 10: Where Respondents Were Living at the Time They Most Recently Became Homeless .............................................. 27
Figure 11: Of Respondents Who Were Living in Monterey County When They Most Recently Became Homeless, Length of Time Respondents Lived in the County Prior to Becoming Homeless ........................................................................ 27
Figure 12: Living Arrangements Immediately Prior to Becoming Homeless This Time (Top 5 Responses in 2011) ................... 28
Figure 13: Where Respondents Usually Stay At Night (2007, 2009 and 2011) ............................................................................ 29
Figure 14: Circumstances That Were Preventing Respondents From Securing Permanent Housing (Top 5 Responses in 2011)30
Figure 15: Length of Time Since Last Permanent Housing Situation............................................................................................ 31
Figure 16: Is This the First Time You Have Been Homeless? ...................................................................................................... 31
Figure 17: Number of Times Respondents Had Been Homeless in the Last Three Years, Including This Time .......................... 32
Figure 18: Primary Event or Condition That Led to Respondents’ Current Episode of Homelessness (Top 5 Responses in 2011)33
Figure 19: Employment Status of Respondents ............................................................................................................................ 34
Figure 20: Length of Unemployment for Respondents ................................................................................................................. 34
Figure 21: Respondents’ Barriers to Getting Employment (Top 5 Responses in 2011) ................................................................ 35
Figure 22: Total (Gross) Monthly Income from All Government Benefits ...................................................................................... 35
Figure 23: Respondents’ Sources of Private Income (Top 5 Responses) .................................................................................... 36
Figure 24: Of Those Receiving Some Form of Government Assistance, Types of Assistance Received (Top 5 Responses in 2011) ........................................................................................................................................................................... 37
Figure 25: Reasons for Not Receiving Government Assistance (Top 5 Responses in 2011) ....................................................... 38
Figure 26: Of Those Using Any Services or Assistance, Types of Services or Assistance Used (Top 5 Responses in 2011) ..... 39
Figure 27: Have You Needed Health Care and Been Unable to Receive It Since Becoming Homeless This Last Time? ............ 39
Figure 28: Respondents’ Need for Medical Services (2009 and 2011) ......................................................................................... 40
Figure 29: Number of Times Respondents Had Used the Emergency Room For Any Treatment in the Year Prior to the Survey41
Figure 30: Are You Currently Experiencing Chronic Health Problems? ........................................................................................ 42
Figure 31: Number of Disabling Conditions Among All Homeless Respondents .......................................................................... 43
Figure 32: Percentage of Respondents Who Were Currently Experiencing Mental Illness and Depression ................................ 43
Figure 33: Percentage of Respondents Who Were Currently Experiencing a Physical or Developmental Disability ................... 45
Figure 34: Percentage of Respondents Who Were Currently Experiencing Alcohol or Drug Abuse ............................................ 45
Figure 35: Respondents Who Were Experiencing Domestic/Partner Violence or Abuse (By Gender) ........................................ 46

Table of Figures 2011 Monterey & San Benito Counties Homeless Census and Survey
viii © Applied Survey Research, 2011
Figure 36: Number of Nights Respondents Reported Spending in Jail/Prison in the Year Prior to the Survey ............................. 47
Figure 37: Number of Tickets Received by Respondents (2011) ................................................................................................. 48
Figure 38: Chronically Homeless Population by Gender, 2011 .................................................................................................... 50
Figure 39: Percentage of Homeless Veteran Respondents Who Were Experiencing the Following Disabling Conditions (2011) 52
Figure 40: Primary Causes of Homelessness, Veteran and Non-Veteran Comparison (2011) .................................................... 52
Figure 41: Are Your School-Aged Children (Who Are Living With You) in School? ...................................................................... 55
Figure 42: Where Do You Usually Stay at Night? (Homeless Children and Youth, 2011) ............................................................ 59
2011 Monterey & San Benito Counties Homeless Census and Survey Introduction
© Applied Survey Research, 2011 9
INTRODUCTION
Close to two million Americans experience homelessness each year.1 For most, this is caused by the gap between their income and the cost of housing. Yet for many, health conditions, mental health, substance abuse, trauma, and lack of support prevent them from obtaining permanent housing.
Every two years in January, communities across the country conduct comprehensive counts of their homeless population, in order to gain a better understanding of the current homeless population, and to apply for federal funding for homeless programs. Monterey County and San Benito County have worked in conjunction with Applied Survey Research (ASR) to conduct the 2011 Monterey and San Benito Counties Homeless Census and Survey for adults, families and unaccompanied children. ASR is a non-profit social research firm based in Santa Cruz County, California, with extensive experience in homeless enumeration and research.
The 2011 Monterey County and San Benito County Point-in-Time Counts were a community-wide effort, simultaneously conducted January 26, 2011. The count and subsequent surveys provide information about the homeless population that is critical to program and service planning, helps to inform the allocation of resources for services to help the homeless, and offers a means of measuring the impact of homeless programs and services.
All jurisdictions receiving federal funding to provide housing and services for the homeless through the McKinney-Vento Homeless Assistance Grant are required by the U.S Department of Housing and Urban Development (HUD) to conduct a biennial Point-in-Time count of unsheltered and sheltered homeless persons sometime during the last ten days of January. Currently, Monterey County receives over 1.7 million dollars in Homeless Assistance Grant money. This is a critical source of funding for homeless services. San Benito County is not currently receiving McKinney-Vento funding, this year’s census and survey were part of the County’s efforts to establish themselves as part of the Monterey Continuum of Care.
According to HUD, the Point-in-Time count must include all unsheltered homeless persons and sheltered homeless persons staying in emergency shelters and transitional housing programs on the date of the count. Jurisdictions report the findings of their Point-in-Time count in their annual application to HUD for federal funding to provide housing and services for the homeless. The compilation of data collected through Point-in-Time counts across the United States helps the federal government to better understand the nature and extent of homelessness nationwide.
The Homeless Census had two components: a Point-in-Time enumeration of unsheltered homeless individuals and families (those sleeping outdoors, on the street, in parks, or vehicles, etc.) and a Point-in-Time enumeration of homeless individuals and families who have temporary shelter (those staying in an emergency shelter, transitional housing, or using motel vouchers). The entire region was canvassed over a
1 The United States Interagency Council on Homelessness (2010). Opening doors: federal strategic plan to prevent and end homelessness. Washington, DC.
Introduction 2011 Monterey & San Benito Counties Homeless Census and Survey
10 © Applied Survey Research, 2011
period of 24 hours. There were four deployment locations based in Hollister, Salinas, San Juan Bautista, and Seaside. The count was conducted by teams of trained homeless workers and community volunteers. This unsheltered homeless enumeration methodology, developed by ASR in 2001, has been highlighted by the HUD’s in the 2008 Guide to Counting Unsheltered Homeless People.
The unsheltered street enumeration was divided into two separate counts: a primary count of homeless individuals and families and a secondary count which focused on unaccompanied children and youth (children without a guardian and under the age of 25). The primary count took place during the early morning of January 26. The unaccompanied children and youth count took place in the afternoon of January 26, 2011, from approximately 2:00 pm to 6:00 pm, when children and youth were more likely to be visible in the community.
In order to capture the number of homeless individuals and families staying in shelters and transitional housing programs, shelter providers in the counties completed an online survey of homeless individuals and families who occupied their facility on the night of January 25, 2011.
In addition to the countywide homeless census, an in-depth 34 question survey was administered in the weeks following the street count to 553 sheltered and unsheltered homeless individuals in Monterey County, and 42 sheltered and unsheltered homeless individuals in San Benito County. The survey was designed to yield qualitative data about the adult homeless population in Monterey and San Benito Counties. Unaccompanied homeless children and youth in Monterey County took the adult survey, and also answered an additional survey that asked specifically about their circumstances as unaccompanied children and youth. A total of 51 unaccompanied homeless children and youth (ages 24 and under) answered the survey.
This report provides data on the overall homeless population in each county and brings special attention to specific subpopulations including chronically homeless, veterans, and unaccompanied children and youth. These groups have been identified by the federal government as populations of particular interest in the 2011 Point-in-Time counts.
Federal Definition of Homelessness
In this study, HUD’s definition of homelessness was used:2
An individual who lacks a fixed, regular, and adequate nighttime residence, and
An individual who has a primary nighttime residence that is:
» A supervised publicly or privately operated shelter designed to provide temporary living accommodations (including welfare hotels, congregate shelters, and transitional housing for the mentally ill), or
» An institution that provides a temporary residence for individuals intended to be institutionalized, or
2 Title 42, Chapter 119, Subchapter I, §10302(a) of the U.S. Code of Federal Regulations based on the McKinney-Vento Homeless Assistance Act.

2011 Monterey & San Benito Counties Homeless Census and Survey Introduction
© Applied Survey Research, 2011 11
» A public or private place not designated for, or ordinarily used as, a regular sleeping accommodation for human beings.
Certain homeless individuals are excluded from this definition, including: unsheltered homeless individuals who were “doubled-up” in the homes of family or friends; and sheltered homeless individuals in jails, hospitals, and rehabilitation facilities. However, where these data are available, we have included them in this report.
Project Purpose and Goals
The 2011 Monterey County and San Benito County Homeless Census and Survey Project Committee identified several important project goals:
To preserve current federal funding for homeless services and to enhance the ability to raise new funds.
To improve the ability of policy makers and service providers to plan and implement services that meet the needs of the local homeless population.
To measure changes in the numbers and characteristics of the homeless population since the 2009 Monterey County Homeless Census and Survey, and to track progress toward ending homelessness.
To increase public awareness of overall homeless issues and generate support for constructive solutions.
To assess the status of chronically homeless, homeless veterans, homeless families, and unaccompanied homeless children (without a guardian and under the age of 18).
The data presented in this report provide an updated view of the homeless in Monterey County, comparisons to the Monterey Homeless Survey results from 2009 are presented where possible and applicable. This is the first homeless census conducted in San Benito County, the data is presented alongside an explanation of current homeless services and community challenges.

MONTEREY COUNTY EXECUTIVE SUMMARY


2011 Monterey & San Benito Counties Homeless Census and Survey Monterey County Homeless Census Findings
© Applied Survey Research, 2011 17
MONTEREY COUNTY HOMELESS CENSUS FINDINGS
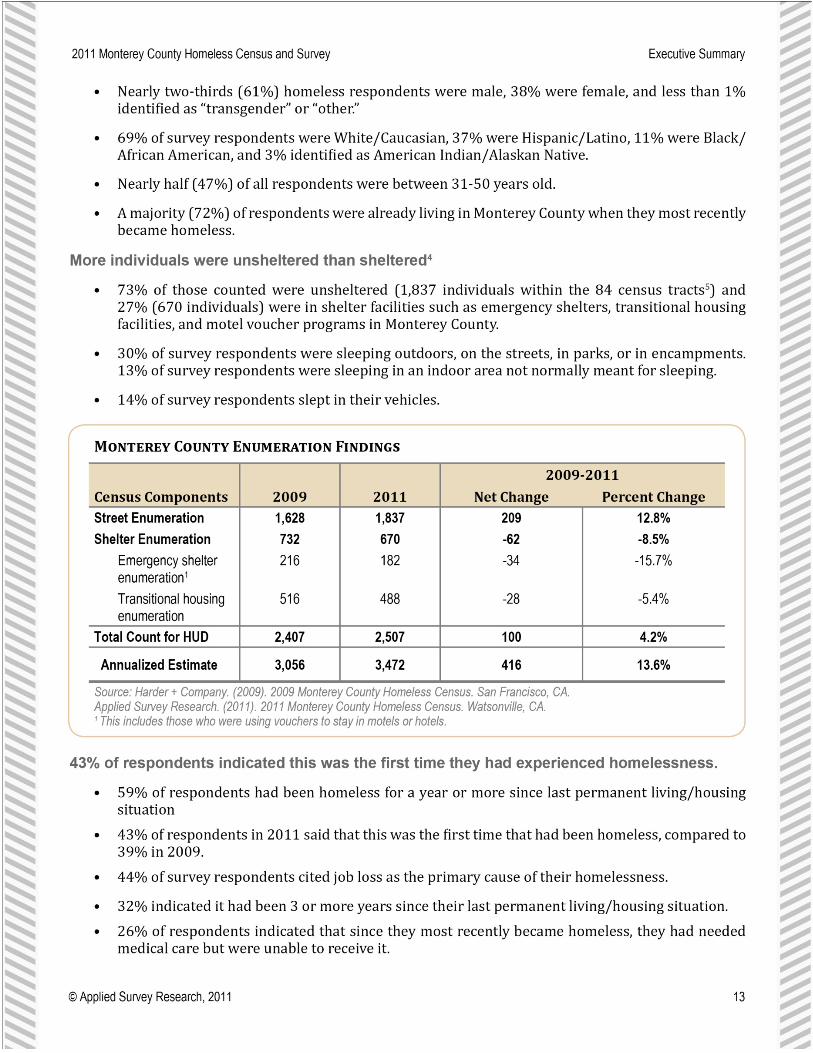
The Point-in-Time street count was conducted on January 26, 2011 from approximately 5:30 a.m. to 11:00 a.m. Census enumerators canvassed all U.S. Census Tracts in Monterey County. Shelters and institutions in the county reported their occupancies for the night of January 25, 2011. The number of homeless persons occupying emergency shelters, transitional housing, domestic violence shelters, and institutional housing were enumerated in conjunction with the street count. Special youth enumeration teams consisting of currently homeless youth, formerly homeless youth, and youth service providers enumerated unaccompanied homeless youth on the afternoon of January 26, from approximately 2:00 p.m. to 6:00 p.m. The number of unaccompanied homeless children and youth were integrated into the overall census findings.3
The Point-in-Time Count in Monterey County
A total of 2,507 homeless people were counted on January 26 in Monterey County.4
» Of those counted, the majority (73%) were unsheltered (1,837 individuals). This included the individuals counted on the streets, as well as those estimated to be living in the occupied cars, vans, RVs, encampments, and abandoned buildings counted by ennumerators.5
» Over one-quarter of the population (27%) was sheltered 670 individuals). This number included persons occupying emergency shelters (including domestic violence shelters) and transitional housing facilities.6
» Between 2009 and 2011, the total number of homeless individuals enumerated during the homeless census increased 4% from 2,407 to 2,507.
3 A detailed explanation of the methodology used for the 2011 Monterey and San Benito Counties Homeless Census, including the project limitations can be found in Appendix I. Copies of the census instruments can be found in Appendix II. For a complete list of definitions of terms used in this report, please see Appendix VI. 4 This total excludes homeless individuals who were housed in jails, hospitals, or rehabilitation facilities as they do not meet HUD’s homeless definition for the Point-in-Time count. 5 The number of individuals enumerated in cars, vans, RVs, encampments, and abandoned buildings are estimates based on empirical data from the 2011 Monterey County Homeless Survey. Survey respondents who indicated that they usually stay in a car, van, RV, encampment, or abandoned building at night were asked to indicate how many people usually stay there, producing a median number of people for each of these sleeping locations. The multipliers used were: 1.51 for cars, 1.86 for vans/RVs, 3.13 for encampment structures, and 3.98 for abandoned buildings. 6 It is important to note that unlike many counties in California, Monterey County does not have an emergency winter shelter.
Monterey County Homeless Census Findings 2011 Monterey & San Benito Counties Homeless Census and Survey
18 © Applied Survey Research, 2011
Figure 1: Monterey County 2011 Homeless Census Results
Single Adults
2011 Persons in
Families 2011 Family Status
Unknown 2011 2011 Totals % of Total Street 849 154 834 1,837 73% Emergency Shelter 141 41 0 182 7% Transitional Housing 200 288 0 488 20% Total 1,190 483 834 2,507 100%
Source: Applied Survey Research. (2011). 2011 Monterey County Homeless Census and Survey. Watsonville, CA.
Persons in families were 19% of the 2011 Point-in-Time homeless population, compared to 21% in 2009.
» Persons in families were 8% of the unsheltered homeless population,7 and 46% of the sheltered population.
The total number of homeless individuals enumerated in emergency shelters and transitional housing facilities decreased by 109 individuals since 2009.
Figure 2: Total Number of Homeless Individuals Enumerated During the Monterey County 2011 Point-in-Time Homeless Census with Comparison Data from 2007 and 2009
Source: Applied Survey Research. (2007). 2007 Monterey County Homeless Census and Survey. Watsonville, CA. Harder and Company Community Research. (2009). 2009 Monterey County Homeless Census and Survey. San Francisco, CA. Applied Survey Research. (2011). 2011 Monterey County Homeless Census and Survey. Watsonville, CA. Note: Totals exclude homeless individuals who were housed in jails, hospitals, or rehabilitation facilities as they do not meet HUD’s homeless definition for the Point-in-Time count. * 2009 Sheltered Count includes and 47 motel/hotel vouchers distributed by Shelter Plus Care II to 29 homeless individuals and 18 homeless families.
7 For the unsheltered count, a group of homeless individuals were determined to be a family if the grouping included at least one child estimated to be under the age of 18 who was accompanied by at least one adult.
893 5091,4021,628
779
2,4071,837670
2,507
0
2,000
4,000
6,000
8,000
Unsheltered Sheltered Total
2007 2009* 2011
2011 Monterey & San Benito Counties Homeless Census and Survey Monterey County Homeless Census Findings
© Applied Survey Research, 2011 19
Of the adult homeless population enumerated, 35% were men, 10% were women, and 39% were of
undetermined gender.
16% of the homeless population in Monterey County were children under the age of 18 years.
» Among the unsheltered adult homeless population, 37% were men, 11% were women, and 52% were of undetermined gender.
» Among the sheltered adult homeless population, 43% were men, 8% were women, 35% were children under the age of 18 and 20% were of undetermined gender.
Figure 3: Number of Sheltered and Unsheltered Adult Homeless Men and Women, Youth, and Other Adults of Undetermined Gender in Monterey County
Source: Harder and Company Community Research. (2009). 2009 Monterey County Homeless Census and Survey. San Francisco, CA. Applied Survey Research. (2011). 2011 Monterey County Homeless Census and Survey. Watsonville, CA.
858 876909
973
309257284
402
0125250375500625750875
1,000
2009 2011
Adult Men
Adults of Undetermined Gender
Adult Women
Children -18 (accompanied and unaccompanied)

Monterey County Homeless Census Findings 2011 Monterey & San Benito Counties Homeless Census and Survey
20 © Applied Survey Research, 2011
Figure 4: Monterey County Homeless Census Population, 2009-2011 Comparison
Setting
Men Women Children Adults of Undetermined
Gender/Age2 Total Individuals
2009 2011 Net 2009 2011 Net 2009 2011 Net 2009 2011 Net 2009 2011 %
Unsheltered 511 610 99 128 181 53 97 192 95 908 854 -54 1,628 1,837 13%
Single Individuals
483 582 99 99 150 51 16 97 81 124 20 -104 722 849 18%
Persons in families
28 28 0 29 31 2 65 95 30 0 0 0 122 154 26%
Individuals in cars, vans, RVs
- - - - - - - - - 410 349 -61 410 349 -15%
Individuals in encampments
- - - - - - - - - 374 326 -48 374 326 -13%
Individuals in abandoned buildings
- - - - - - - - - 0 159 159 0 159 -
Sheltered 347 265 -82 181 26 -155 203 210 7 48 119 71 779 607 -22%
Emergency Shelter1
140 115 -25 54 26 -28 22 25 3 47 16 -31 263 182 -31%
Single Individuals
140 115 16 41 26 -15 2 0 -2 29 0 -29 212 141 -34%
Persons in families
0 0 0 13 0 -13 20 25 5 18 16 -2 51 41 -20%
Transitional Housing
207 150 -57 127 50 -77 181 185 4 1 103 102 516 488 -5%
Single Individuals
142 150 8 48 50 -2 0 0 0 1 0 -1 191 200 5%
Persons in families
65 0 -65 79 0 -79 181 185 4 0 103 103 325 288 -11%
Total Unsheltered & Sheltered
858 875 24 309 257 -10 284 402 118 956 973 17 2,407 2,507 4%
Source: Harder and Company Community Research. (2009). 2009 Monterey County Homeless Census and Survey. San Francisco, CA. Applied Survey Research. (2011). 2011 Monterey County Homeless Census and Survey. Watsonville, CA. 1 2009 Emergency Shelter totals include motel/hotel vouchers distributed to 18 individuals and 29 families by Shelter Plus Care II. 2 In 2011 shelter providers were not required to report the gender of those residing in families.

2011 Monterey & San Benito Counties Homeless Census and Survey Monterey County Jurisdictional Data
© Applied Survey Research, 2011 21
MONTEREY COUNTY JURISDICTIONAL DATA
As in previous years, the 2011 Homeless Census collected data on the geographic distribution of sheltered and unsheltered homeless families and individuals in Monterey County. This data allows for the assessment of needs and programs addressing homelessness at both the city and county level. Data on the total number of sheltered and unsheltered families and individuals are presented in the following charts. It is important to recognize the way jurisdictional data is affected by the location of shelter facilities. Therefore, the overall numbers are followed by separate sheltered and unsheltered counts.
Total Number of Unsheltered and Sheltered Homeless Persons, by Jurisdiction
Figure 5: Total Unsheltered and Sheltered Homeless Census Population by Jurisdiction and Family Status
Jurisdiction Individuals Persons in Families Persons in Vehicles,
Encampments, or Parks1 Total Persons
2009 2011 Net
Change 2009 2011 Net
Change 2009 2011 Net
Change 2009 2011 Net
Change Percent Change
Big Sur 1 4 3 0 0 0 20 0 -20 21 4 17 -81%
Boronda - 0 - - 0 - - 0 - - 0 - -
Carmel 2 6 4 0 0 0 6 3 -0 8 12 4 50%
Castroville 8 0 -8 0 23 23 24 0 -24 32 23 -9 -28%
Del Monte Forest - 0 - - 0 - - 0 - - 0 - -
Del Rey Oaks - 9 - - 0 - - 16 - - 25 - -
Elkhorn - 0 - - 0 - - 0 - - 0 - -
Gonzalez - 35 - - 0 - - 38 - - 73 - -
Greenfield 21 17 -4 14 82 68 21 0 -21 56 99 43 77%
King City 4 14 10 0 0 0 9 19 10 13 33 20 154%
Las Lomas - 0 - - 25 - - 0 - - 25 - -
Marina 137 113 -24 238 276 38 127 54 -73 502 443 -60 -13%
Monterey City 159 266 107 8 4 -4 137 170 33 304 440 136 45%
Unincorporated Monterey County
0 25 25 0 0 0 0 98 98 0 123 - -
Moss Landing - 0 - - 0 - - 0 - - 0 - -
Pacific Grove 5 19 14 0 0 0 4 42 38 9 61 52 58%
Pájaro 86 234 148 94 18 -76 83 28 -55 263 280 17 7%
Prunedale 0 2 2 0 0 0 27 5 -22 27 7 -20 74%
Salinas 544 370 -174 78 6 -72 107 281 174 729 657 -72 -10%
Sand City 0 34 34 0 0 0 0 37 37 0 71 71 -
Seaside 105 40 -65 48 49 1 160 40 -120 313 129 -184 -59%
Soledad 24 2 -22 0 0 0 60 0 -60 84 2 -82 -98%
TOTAL 1,096 1,190 94 480 483 3 785 832 47 2,408 2,507 99 4%
Source :Harder and Company Community Research. (2009). 2009 Monterey County Homeless Census and Survey. San Francisco, CA. Applied Survey Research. (2011). 2011 Monterey County Homeless Census and Survey. Watsonville, CA. 1 “Individuals in Vehicles, Encampments, Abandoned Buildings, and Parks” is reported as a separate category because their family status could not be determined. This category includes unsheltered individuals who were enumerated in these settings during the street census.

Monterey County Jurisdictional Data 2011 Monterey & San Benito Counties Homeless Census and Survey
22 © Applied Survey Research, 2011
Figure 6: Unsheltered Homeless Census Population by Jurisdiction and Family Status
Jurisdiction Individuals Persons in Families Persons in Vehicles,
Encampments, or Parks1 Total Persons
2009 2011 Net
Change 2009 2011 Net
Change 2009 2011 Net
Change 2009 2011 Net
Change Percent Change
Big Sur 1 4 3 0 0 0 20 0 -20 21 4 -17 -81%
Boronda - 0 - - 0 - - 0 - - 0 - -
Carmel Valley Village
2** 5
4 0 0
0 6 3
0 8 8
4 50% Carmel by the Sea 1 0 3 4
Castroville 8 0 -8 0 23 23 24 0 -24 32 23 -9 -28%
Del Monte Forest - 0 - - 0 - - 0 - - 0 - -
Del Rey Oaks - 9 - - 0 - - 16 - - 25 - -
Elkhorn - 0 - - 0 - - 0 - - 0 - -
Gonzalez - 35 - - 0 - - 38 - - 73 -
Greenfield 21 17 -4 14 82 68 21 0 -21 56 99 43 77%
King City 4 14 10 0 0 0 9 19 10 13 33 20 154%
Las Lomas - 0 - - 25 - - 0 - - 25 - -
Marina 53 22 -31 0 0 0 127 54 -73 180 76 -104 -58%
Monterey City 135 257 122 0 0 0 137 170 33 272 427 155 57%
Unincorporated Monterey County
0 25 25 0 0 0 0 98 98 0 123 123 -
Moss Landing - 0 - - 0 - - 0 - - 0 - -
Pacific Grove 5 19 14 0 0 0 4 42 38 9 61 52 58%
Pájaro 61 168 107 94 18 -76 83 28 -55 238 214 -24 -10%
Prunedale 0 2 2 0 0 0 27 5 -22 27 7 -20 -74%
Salinas 348 229 -119 14 6 -8 107 281 174 469 516 47 10%
Sand City 0 34 34 0 0 0 0 37 37 0 71 71 -
Seaside 60 6 -54 0 0 0 160 40 -120 220 46 -174 -79%
Soledad 24 2 -22 0 0 0 60 0 -60 84 2 -82 -98%
TOTAL 722 849 127 122 154 32 785 834 49 1,629* 1,837 208 13%
Source: Harder and Company Community Research. (2009). 2009 Monterey County Homeless Census and Survey. San Francisco, CA. Applied Survey Research. (2011). 2011 Monterey County Homeless Census and Survey. Watsonville, CA. 1 “Individuals in Vehicles, Encampments, Abandoned Buildings, and Parks” is reported as a separate category because these individuals’ family status could not be determined. This category includes unsheltered individuals who were enumerated in these settings during the street census. *unsheltered 2009 total does not equal 1,629 due to rounding. **2009 data combines Carmel Valley Village and Carmel by the Sea to form one Carmel total.

2011 Monterey & San Benito Counties Homeless Census and Survey Monterey County Jurisdictional Data
© Applied Survey Research, 2011 23
Figure 7: Sheltered Homeless Census Population by Jurisdiction and Family Status
Jurisdiction
Individuals Individuals in Families Total Persons
2009 2011 Net
Change 2009 2011 Net
Change 2009 2011 Net
Change Percent Change
Marina 84 91 56 238 276 38 322 367 45 12%
Monterey 24 9 -15 8 4 -4 32 13 -19 -59%
Pájaro 25 66 41 0 0 0 25 66 41 164%
Salinas 196 141 -55 64 0 -64 260 141 -119 -46%
Seaside 45 34 -11 48 49 -1 93 83 -10 -11%
TOTAL 374 341 16 358 329 -29 732 607 -62 -19%
Source:Harder and Company Community Research. (2009). 2009 Monterey County Homeless Census and Survey. San Francisco, CA. Applied Survey Research. (2011). 2011 Monterey County Homeless Census and Survey. Watsonville, CA.

Countywide Annual Estimation 2011 Monterey & San Benito Counties Homeless Census and Survey
24 © Applied Survey Research, 2011
COUNTYWIDE ANNUAL ESTIMATION
A Point-in-Time (PIT) homeless enumeration has an inherent bias of not capturing homeless persons who experience short episodes of homelessness during other times of the year. More people experience homelessness annually than can be counted at any given point in time, as people cycle in and out of homelessness. For example, someone may be homeless between February and May, and another person may become homeless between October and January. Counting only the homeless person found in a January census could under-represent the experience of the homeless person in the February to May timeline.
Therefore, based on the survey responses of the 2011 Monterey County Homeless Census and Survey, ASR used the annualization formula detailed by the Corporation for Supportive Housing to calculate an annual estimate of the number of homeless persons in Monterey County over the course of a year. This approach is the HUD-approved method for calculating the annual estimate of homeless persons based on the Point-in-Time count. The following is an explanation of the annualization calculation.
Three factors were used to determine the annual estimate:8
A = The Point-in-Time count of currently homeless people (found in the street and shelter count)
B = The number of currently homeless people who became homeless within the last 7 days; and
C = The proportion of currently homeless people who have experienced a previous homeless episode within the past 12 months.
The equation for calculating the annual estimate: A + [(B*51)*(1 – C)] = Annual estimate
For Monterey County: 2,507 + [(45.126*51)*(1 – 0.580756)] = 3471.86 ≈ 3,472 persons
The annual estimate for the number of homeless people in Monterey County was 3,472 persons. This was a 14% increase from the 2009 annual estimate of 3,056 persons.
Based on the 2007-2009 American Community Survey 3-Year Estimates population profile, this annual estimate of homelessness represented approximately 1% of Monterey County’s total population of 406,049 people.9
8 Burt, M. and C. Wilkins. (March, 2005). Estimating the Need: projecting from point-in-time to annual estimates of the number of homeless people in a community and using this information to plan for permanent supportive housing. Corporation for Supportive Housing. 9 U.S. Census Bureau. (2011). 2007-2009 American Community Survey 3-Year Estimates.
2011 Monterey & San Benito Counties Homeless Census and Survey Monterey County Homeless Survey Findings
© Applied Survey Research, 2011 25
MONTEREY COUNTY HOMELESS SURVEY FINDINGS
This section provides an overview of the findings generated from the 2011 Monterey County Homeless Survey. Surveys were administered between February 1 and March 21, 2011, providing 520 completed, unique surveys. Missing values have been intentionally omitted from the survey results. Therefore, the total number of respondents for each question will not always equal the total number of surveys.10
Demographics
In order to measure the diversity of homeless residents in Monterey County, respondents were asked several demographic questions pertaining to their age, gender, ethnicity, and family status.
Age
47% of all respondents were between 31 - 50 years old.
Less than 1% of respondents were youth under the age of 18.
Figure 8: Survey Respondents by Age
Source: Applied Survey Research. (2007). 2007 Monterey County Homeless Census and Survey. Watsonville, CA. Applied Survey Research. (2011). 2011 Monterey County Homeless Census and Survey. Watsonville, CA.
10 Additional information regarding the Monterey County Homeless Survey can be found in the appendices, including: methodology (Appendix I), geographic distribution (Appendix I), the survey instrument (Appendix III) and overall results (Appendix IV).
5.1%
18.1%
25.2%
21.7%
20.1%
9.4%
0.4%
3.5%
22.8%
32.3%
24.3%
11.5%
5.0%
0.8%
0% 20% 40% 60% 80% 100%
61+ years old
51-60 years old
41-50 years old
31-40 years old
22-30 years old
18-21 years old
13-17 years old 2007 (N=400)
2011 (N=508)
Monterey County Homeless Survey Findings 2011 Monterey & San Benito Counties Homeless Census and Survey
26 © Applied Survey Research, 2011
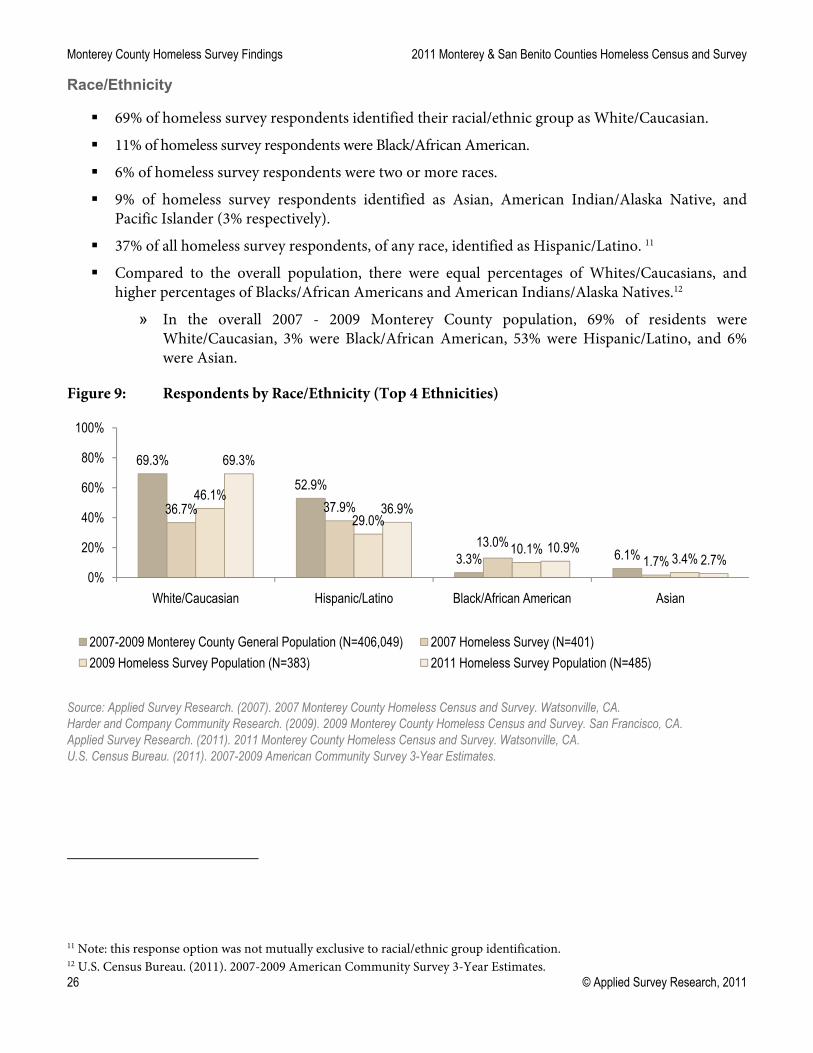
Race/Ethnicity
69% of homeless survey respondents identified their racial/ethnic group as White/Caucasian.
11% of homeless survey respondents were Black/African American.
6% of homeless survey respondents were two or more races.
9% of homeless survey respondents identified as Asian, American Indian/Alaska Native, and Pacific Islander (3% respectively).
37% of all homeless survey respondents, of any race, identified as Hispanic/Latino. 11
Compared to the overall population, there were equal percentages of Whites/Caucasians, and higher percentages of Blacks/African Americans and American Indians/Alaska Natives.12
» In the overall 2007 - 2009 Monterey County population, 69% of residents were White/Caucasian, 3% were Black/African American, 53% were Hispanic/Latino, and 6% were Asian.
Figure 9: Respondents by Race/Ethnicity (Top 4 Ethnicities)
Source: Applied Survey Research. (2007). 2007 Monterey County Homeless Census and Survey. Watsonville, CA. Harder and Company Community Research. (2009). 2009 Monterey County Homeless Census and Survey. San Francisco, CA. Applied Survey Research. (2011). 2011 Monterey County Homeless Census and Survey. Watsonville, CA. U.S. Census Bureau. (2011). 2007-2009 American Community Survey 3-Year Estimates.
11 Note: this response option was not mutually exclusive to racial/ethnic group identification. 12 U.S. Census Bureau. (2011). 2007-2009 American Community Survey 3-Year Estimates.
69.3%
52.9%
3.3% 6.1%
36.7% 37.9%
13.0%1.7%
46.1%
29.0%
10.1%3.4%
69.3%
36.9%
10.9%2.7%
0%
20%
40%
60%
80%
100%
White/Caucasian Hispanic/Latino Black/African American Asian
2007-2009 Monterey County General Population (N=406,049) 2007 Homeless Survey (N=401)
2009 Homeless Survey Population (N=383) 2011 Homeless Survey Population (N=485)

2011 Monterey & San Benito Counties Homeless Census and Survey Monterey County Homeless Survey Findings
© Applied Survey Research, 2011 27
Residency Prior to Experiencing Homelessness
County Residency
The majority of survey respondents indicated they had been living in the County at the time they most recently became homeless.
72% of survey respondents reported living in Monterey County when they most recently became homeless.
Figure 10: Where Respondents Were Living at the Time They Most Recently Became Homeless
Source: Applied Survey Research. (2007). 2007 Monterey County Homeless Census and Survey. Watsonville, CA. Harder and Company Community Research. (2009). 2009 Monterey County Homeless Census and Survey. San Francisco, CA. Applied Survey Research. (2011). 2011 Monterey County Homeless Census and Survey. Watsonville, CA.
Of respondents who had been living in the county at the time they most recently became homeless, 87% had been living in the county for 3 or more years before they became homeless.
Figure 11: Of Respondents Who Were Living in Monterey County When They Most Recently Became Homeless, Length of Time Respondents Lived in the County Prior to Becoming Homeless
Source: Applied Survey Research. (2007). 2007 Monterey County Homeless Census and Survey. Watsonville, CA. Applied Survey Research. (2011). 2011 Monterey County Homeless Census and Survey. Watsonville, CA.
78.1%
14.4%7.5%
77.5%
14.6%7.9%
72.0%
17.6%10.4%
0%
20%
40%
60%
80%
100%
Monterey County Other county in California Out of state
2007 (N=402) 2009 (N=378) 2011 (N=518)
6.6% 7.6% 2.0%12.3% 8.3% 10.3%
52.8%
2.5% 3.4% 2.0% 4.8% 9.3% 12.5%
65.4%
0%
20%
40%
60%
80%
100%
30 days or less 1-6 months 7-11 months 1-2 years 3-5 years 6-10 years More than 10 years
2007 (N=301) 2011 (N=353)
Monterey County Homeless Survey Findings 2011 Monterey & San Benito Counties Homeless Census and Survey
28 © Applied Survey Research, 2011
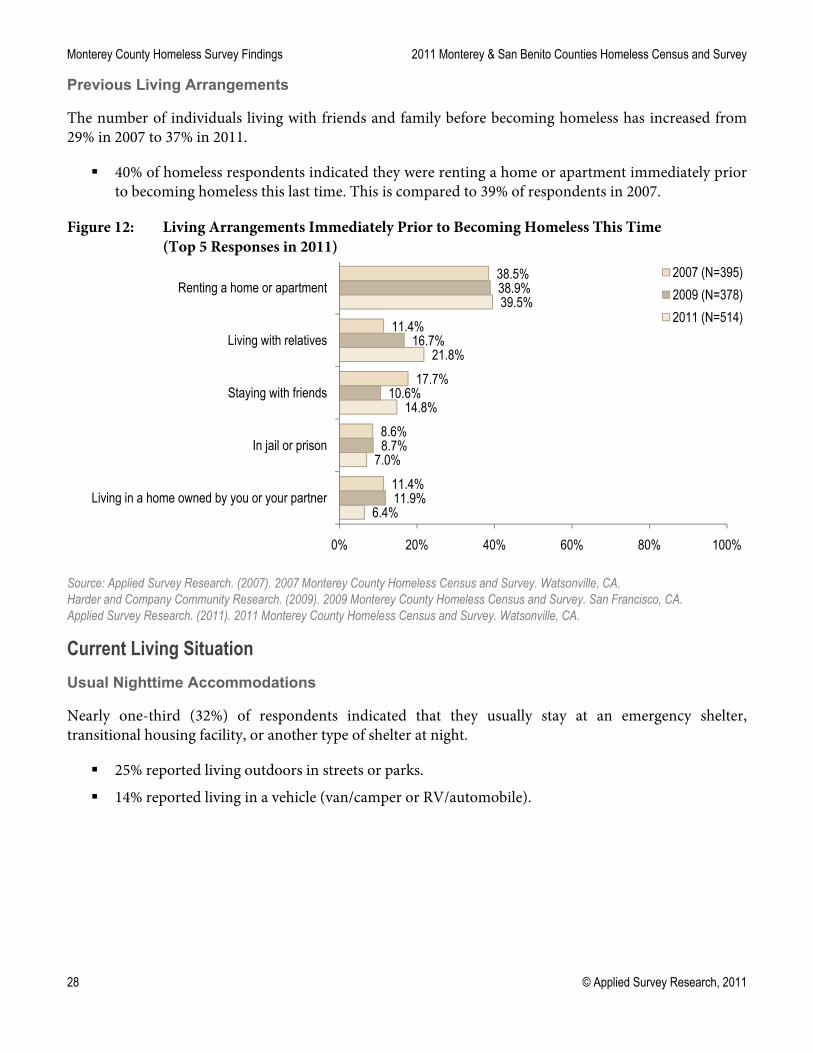
Previous Living Arrangements
The number of individuals living with friends and family before becoming homeless has increased from 29% in 2007 to 37% in 2011.
40% of homeless respondents indicated they were renting a home or apartment immediately prior to becoming homeless this last time. This is compared to 39% of respondents in 2007.
Figure 12: Living Arrangements Immediately Prior to Becoming Homeless This Time (Top 5 Responses in 2011)
Source: Applied Survey Research. (2007). 2007 Monterey County Homeless Census and Survey. Watsonville, CA. Harder and Company Community Research. (2009). 2009 Monterey County Homeless Census and Survey. San Francisco, CA. Applied Survey Research. (2011). 2011 Monterey County Homeless Census and Survey. Watsonville, CA.
Current Living Situation
Usual Nighttime Accommodations
Nearly one-third (32%) of respondents indicated that they usually stay at an emergency shelter, transitional housing facility, or another type of shelter at night.
25% reported living outdoors in streets or parks.
14% reported living in a vehicle (van/camper or RV/automobile).
6.4%
7.0%
14.8%
21.8%
39.5%
11.9%
8.7%
10.6%
16.7%
38.9%
11.4%
8.6%
17.7%
11.4%
38.5%
0% 20% 40% 60% 80% 100%
Living in a home owned by you or your partner
In jail or prison
Staying with friends
Living with relatives
Renting a home or apartment2007 (N=395)
2009 (N=378)
2011 (N=514)

2011 Monterey & San Benito Counties Homeless Census and Survey Monterey County Homeless Survey Findings
© Applied Survey Research, 2011 29
Figure 13: Where Respondents Usually Stay At Night (2007, 2009 and 2011)
Source: Applied Survey Research. (2007). 2007 Monterey County Homeless Census and Survey. Watsonville, CA. Harder and Company Community Research. (2009). 2009 Monterey County Homeless Census and Survey. San Francisco, CA. Applied Survey Research. (2011). 2011 Monterey County Homeless Census and Survey. Watsonville, CA.
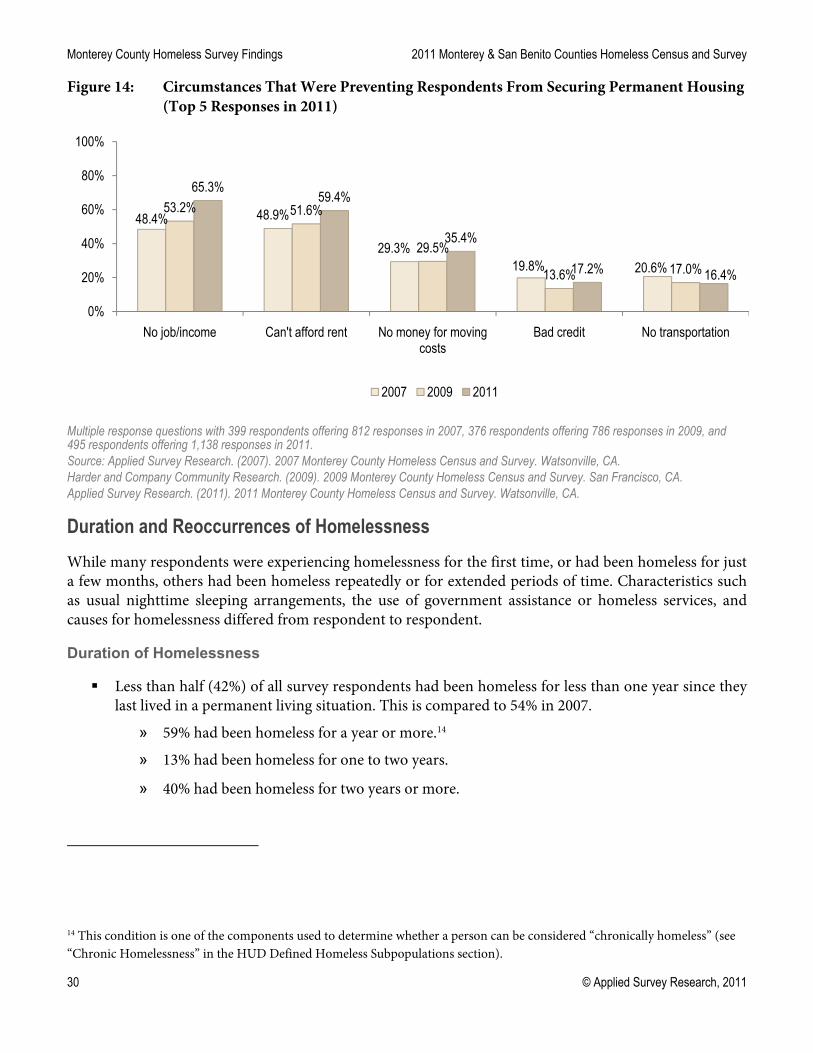
Obstacles to Obtaining Permanent Housing
65% of respondents indicated that having no job/no income was keeping them from securing permanent housing, compared to 48% in 2007.
14% of survey respondents indicated they had a pet; when asked directly, 31% reported their pet prevented them from obtaining housing.
59% cited inability to afford rent as a major obstacle to obtaining housing, and 35% lacked the money for moving costs in 2011.13
13 These responses were not mutually exclusive.
2.5%
5.1%
14.3%
3.5%
7.4%
25.2%
32.4%
1.0%
8.3%
12.0%
1.0%
4.9%
18.5%
28.6%
5.3%
1.3%
7.1%
11.3%
3.0%
19.4%
20.4%
0% 20% 40% 60% 80% 100%
Unconverted garage/attic/basement
Encampment
Van/Camper or RV/automobile
A place in a house not normally used for sleeping
Motel/hotel
Outdoors/streets/parks
Emergency, transitional, or other shelter2007 (N=397)
2009 (N=384)
2011 (N=512)
Monterey County Homeless Survey Findings 2011 Monterey & San Benito Counties Homeless Census and Survey
30 © Applied Survey Research, 2011
Figure 14: Circumstances That Were Preventing Respondents From Securing Permanent Housing (Top 5 Responses in 2011)
Multiple response questions with 399 respondents offering 812 responses in 2007, 376 respondents offering 786 responses in 2009, and 495 respondents offering 1,138 responses in 2011. Source: Applied Survey Research. (2007). 2007 Monterey County Homeless Census and Survey. Watsonville, CA. Harder and Company Community Research. (2009). 2009 Monterey County Homeless Census and Survey. San Francisco, CA. Applied Survey Research. (2011). 2011 Monterey County Homeless Census and Survey. Watsonville, CA.
Duration and Reoccurrences of Homelessness
While many respondents were experiencing homelessness for the first time, or had been homeless for just a few months, others had been homeless repeatedly or for extended periods of time. Characteristics such as usual nighttime sleeping arrangements, the use of government assistance or homeless services, and causes for homelessness differed from respondent to respondent.
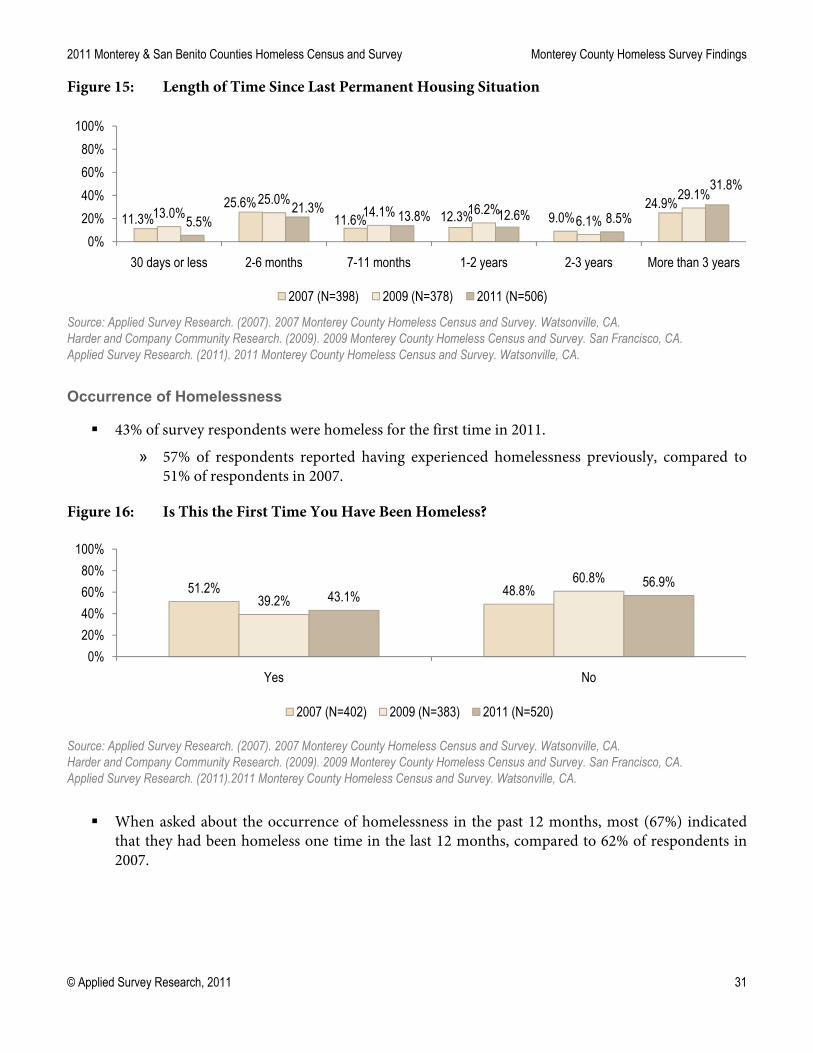
Duration of Homelessness
Less than half (42%) of all survey respondents had been homeless for less than one year since they last lived in a permanent living situation. This is compared to 54% in 2007.
» 59% had been homeless for a year or more.14
» 13% had been homeless for one to two years.
» 40% had been homeless for two years or more.
14 This condition is one of the components used to determine whether a person can be considered “chronically homeless” (see “Chronic Homelessness” in the HUD Defined Homeless Subpopulations section).
48.4% 48.9%
29.3%19.8% 20.6%
53.2% 51.6%
29.5%
13.6% 17.0%
65.3%59.4%
35.4%
17.2% 16.4%
0%
20%
40%
60%
80%
100%
No job/income Can't afford rent No money for moving costs
Bad credit No transportation
2007 2009 2011
2011 Monterey & San Benito Counties Homeless Census and Survey Monterey County Homeless Survey Findings
© Applied Survey Research, 2011 31
Figure 15: Length of Time Since Last Permanent Housing Situation
Source: Applied Survey Research. (2007). 2007 Monterey County Homeless Census and Survey. Watsonville, CA. Harder and Company Community Research. (2009). 2009 Monterey County Homeless Census and Survey. San Francisco, CA. Applied Survey Research. (2011). 2011 Monterey County Homeless Census and Survey. Watsonville, CA. Occurrence of Homelessness
43% of survey respondents were homeless for the first time in 2011.
» 57% of respondents reported having experienced homelessness previously, compared to 51% of respondents in 2007.
Figure 16: Is This the First Time You Have Been Homeless?
Source: Applied Survey Research. (2007). 2007 Monterey County Homeless Census and Survey. Watsonville, CA. Harder and Company Community Research. (2009). 2009 Monterey County Homeless Census and Survey. San Francisco, CA. Applied Survey Research. (2011).2011 Monterey County Homeless Census and Survey. Watsonville, CA.
When asked about the occurrence of homelessness in the past 12 months, most (67%) indicated that they had been homeless one time in the last 12 months, compared to 62% of respondents in 2007.
11.3%25.6%
11.6% 12.3% 9.0%24.9%
13.0%25.0%
14.1% 16.2%6.1%
29.1%
5.5%21.3%
13.8% 12.6% 8.5%
31.8%
0%
20%
40%
60%
80%
100%
30 days or less 2-6 months 7-11 months 1-2 years 2-3 years More than 3 years
2007 (N=398) 2009 (N=378) 2011 (N=506)
51.2% 48.8%39.2%
60.8%43.1%
56.9%
0%
20%
40%
60%
80%
100%
Yes No
2007 (N=402) 2009 (N=383) 2011 (N=520)
Monterey County Homeless Survey Findings 2011 Monterey & San Benito Counties Homeless Census and Survey
32 © Applied Survey Research, 2011
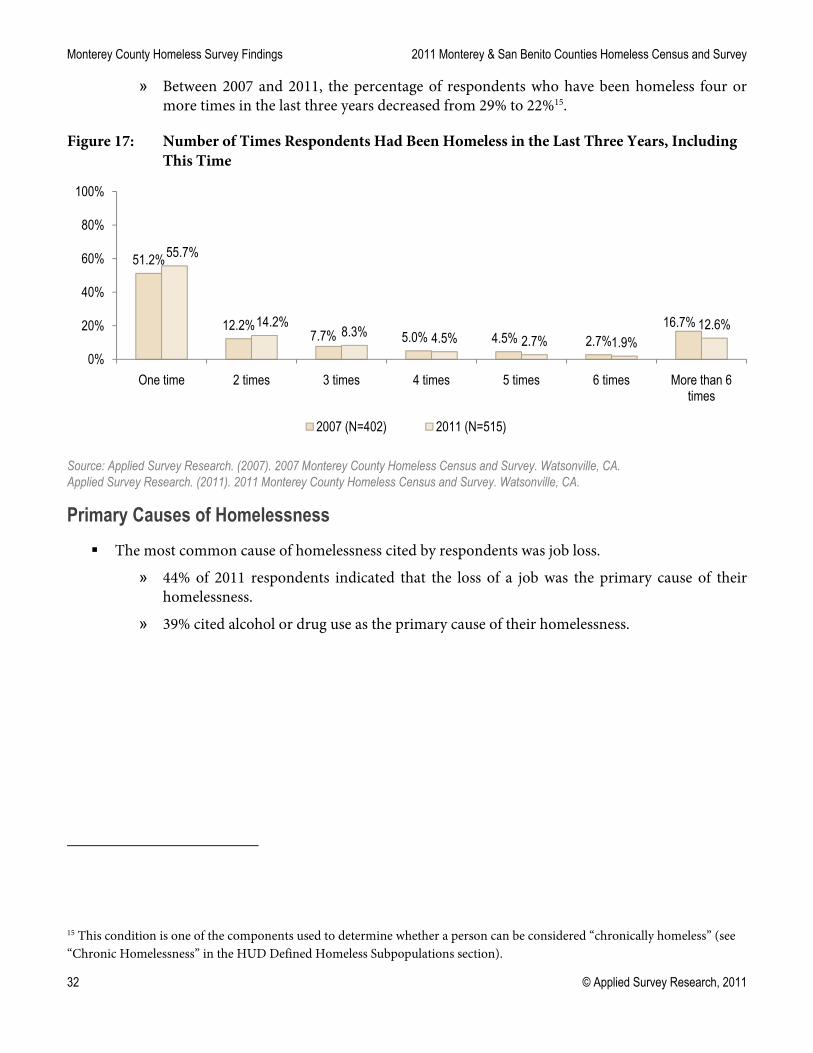
» Between 2007 and 2011, the percentage of respondents who have been homeless four or more times in the last three years decreased from 29% to 22%15.
Figure 17: Number of Times Respondents Had Been Homeless in the Last Three Years, Including This Time
Source: Applied Survey Research. (2007). 2007 Monterey County Homeless Census and Survey. Watsonville, CA. Applied Survey Research. (2011). 2011 Monterey County Homeless Census and Survey. Watsonville, CA.
Primary Causes of Homelessness
The most common cause of homelessness cited by respondents was job loss.
» 44% of 2011 respondents indicated that the loss of a job was the primary cause of their homelessness.
» 39% cited alcohol or drug use as the primary cause of their homelessness.
15 This condition is one of the components used to determine whether a person can be considered “chronically homeless” (see “Chronic Homelessness” in the HUD Defined Homeless Subpopulations section).
51.2%
12.2%7.7% 5.0% 4.5% 2.7%
16.7%
55.7%
14.2%8.3% 4.5% 2.7% 1.9%
12.6%
0%
20%
40%
60%
80%
100%
One time 2 times 3 times 4 times 5 times 6 times More than 6 times
2007 (N=402) 2011 (N=515)

2011 Monterey & San Benito Counties Homeless Census and Survey Monterey County Homeless Survey Findings
© Applied Survey Research, 2011 33
Figure 18: Primary Event or Condition That Led to Respondents’ Current Episode of Homelessness (Top 5 Responses in 2011)
Multiple response questions with 512 respondents offering 977 responses in 2011. Source: Applied Survey Research. (2011). 2011 Monterey County Homeless Census and Survey. Watsonville, CA.
Employment and Income
The 2009 U.S. Department of Health and Human Services (HHS) Federal Poverty Level (FPL) for one person is approximately $903 per month.16 Income from government sources is excluded from this calculation because the HHS Federal Poverty Levels do not consider non-cash government benefits (such as Food Stamps or housing subsidies) as income when determining the poverty levels for each fiscal year.
However, the local self-sufficiency standard is a more realistic measure of the true cost of living. The self-sufficiency standard is a measure of income adequacy that calculates how much income working adults need to meet their family’s basic needs without subsidies. While the FPL for one person is approximately $903 per month, the self-sufficiency standard for a single person in Monterey County is $2,156 per month.17
As shown previously, a lack of income – whether from the loss of a job, being unable to find a job, or due to other reasons – has a great impact on homeless people in Monterey County. While some respondents were able to earn income from employment, others were receiving income from sources such as public assistance or disability benefits. However, many respondents were receiving little or no income from either government or private sources.
Employment Status
88% of respondents indicated that they were not employed at the time of the survey, compared to 79% in 2007.
16 U.S. Department of Health and Human Services. (2009). Federal Register, Vol. 74, No. 14, 2009 HHS Poverty Guidelines January 23, 2009, p. 4200. 17 Wider Opportunities for Women and Californians for Family Economic Self-Sufficiency (CFESS) and Equal Rights Advocates. (2009).
12.1%
15.4%
25.2%
38.9%
44.3%
0% 20% 40% 60% 80% 100%
Family/domestic violence
Conflict with family/housemate
Lost income
Alcohol/drug use
Lost job

Monterey County Homeless Survey Findings 2011 Monterey & San Benito Counties Homeless Census and Survey
34 © Applied Survey Research, 2011
» 10% of respondents were employed part-time and 3% were employed full-time in 2011.
» In comparison, the unemployment rate for the overall population of Monterey County reached 17% during February 2011.18
Figure 19: Employment Status of Respondents
Source: Applied Survey Research. (2007). 2007 Monterey County Homeless Census and Survey. Watsonville, CA. Harder and Company Community Research. (2009). 2009 Monterey County Homeless Census and Survey. San Francisco, CA. Applied Survey Research. (2011). 2011 Monterey County Homeless Census and Survey. Watsonville, CA. The majority (76%) of homeless survey respondents in 2011 reported being unemployed for a year
or longer.
Figure 20: Length of Unemployment for Respondents
Source: Applied Survey Research. (2007). 2007 Monterey County Homeless Census and Survey. Watsonville, CA. Harder and Company Community Research. (2009). 2009 Monterey County Homeless Census and Survey. San Francisco, CA. Applied Survey Research. (2011). 2011 Monterey County Homeless Census and Survey. Watsonville, CA.
18 State of California Employment Development Department, Labor Market Information Division. (2009).
78.6%
16.7%4.7%
91.4%
6.3% 2.4%
87.6%
9.9%2.5%
0%
20%
40%
60%
80%
100%
Unemployed Employed part-time Employed full-time
2007 (N=402) 2009 (N=382) 2011 (N=517)
20.9% 16.8%
62.3%
23.9%17.1%
59.0%
8.3%16.3%
75.5%
0%
20%
40%
60%
80%
100%
6 months or less 6 months - 1 year 1 year or longer
2007 (N=292) 2009 (N=339) 2011 (N=424)
2011 Monterey & San Benito Counties Homeless Census and Survey Monterey County Homeless Survey Findings
© Applied Survey Research, 2011 35
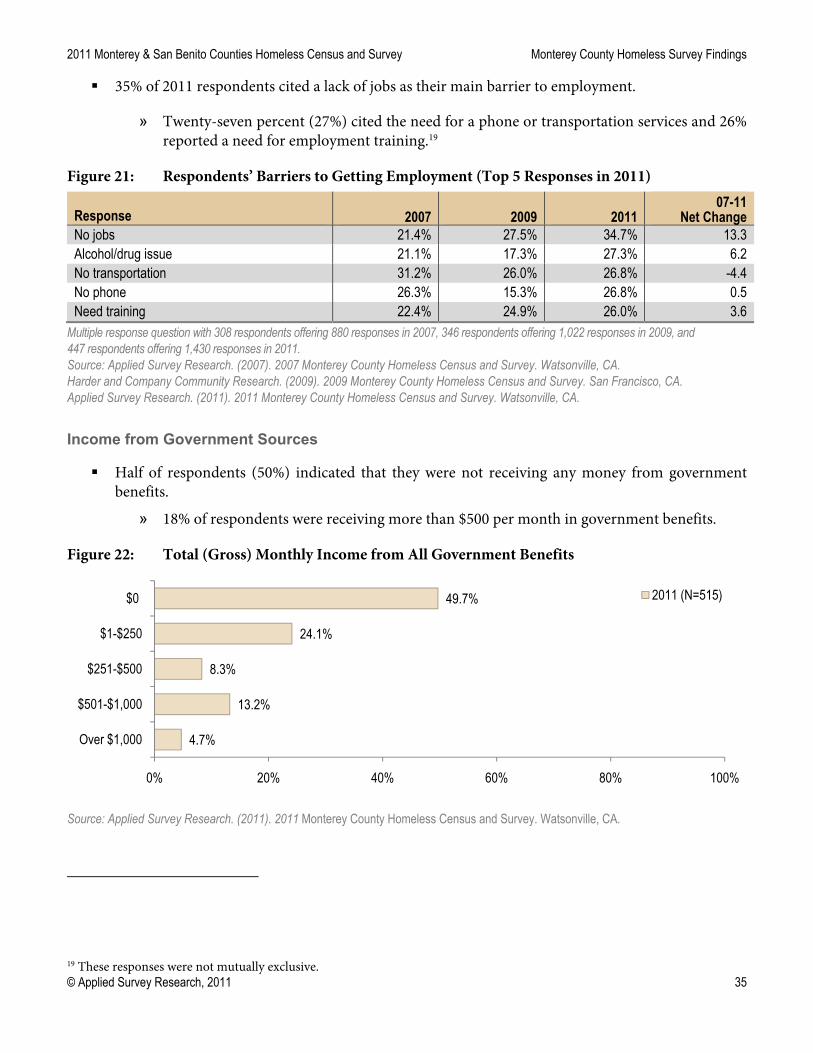
35% of 2011 respondents cited a lack of jobs as their main barrier to employment.
» Twenty-seven percent (27%) cited the need for a phone or transportation services and 26% reported a need for employment training.19
Figure 21: Respondents’ Barriers to Getting Employment (Top 5 Responses in 2011)
Response 2007 2009 2011 07-11
Net Change No jobs 21.4% 27.5% 34.7% 13.3 Alcohol/drug issue 21.1% 17.3% 27.3% 6.2 No transportation 31.2% 26.0% 26.8% -4.4 No phone 26.3% 15.3% 26.8% 0.5 Need training 22.4% 24.9% 26.0% 3.6
Multiple response question with 308 respondents offering 880 responses in 2007, 346 respondents offering 1,022 responses in 2009, and 447 respondents offering 1,430 responses in 2011. Source: Applied Survey Research. (2007). 2007 Monterey County Homeless Census and Survey. Watsonville, CA. Harder and Company Community Research. (2009). 2009 Monterey County Homeless Census and Survey. San Francisco, CA. Applied Survey Research. (2011). 2011 Monterey County Homeless Census and Survey. Watsonville, CA. Income from Government Sources
Half of respondents (50%) indicated that they were not receiving any money from government benefits.
» 18% of respondents were receiving more than $500 per month in government benefits.
Figure 22: Total (Gross) Monthly Income from All Government Benefits
Source: Applied Survey Research. (2011). 2011 Monterey County Homeless Census and Survey. Watsonville, CA.
19 These responses were not mutually exclusive.
4.7%
13.2%
8.3%
24.1%
49.7%
0% 20% 40% 60% 80% 100%
Over $1,000
$501-$1,000
$251-$500
$1-$250
$0 2011 (N=515)

Monterey County Homeless Survey Findings 2011 Monterey & San Benito Counties Homeless Census and Survey
36 © Applied Survey Research, 2011
Income from Private Sources
41% of respondents were receiving no income from private, non-Government sources, compared to 43% in 2007.
» 15% received more than $500 from private sources, compared to 16% in 2007.
Other Sources of Income
From 2007 to 2011, the percentage of respondents who reported earning income from recycling increased from 33% to 40%, as did the number of persons panhandling (20% to 32%).
The percentage of respondents who received income from their family/friends increased, from 24% to 42%, while the number of persons providing sex work (3% to 8%).20
Figure 23: Respondents’ Sources of Private Income (Top 5 Responses)
Multiple response question with 319 respondents offering 458 responses in 2007, 359 respondents offering 482 responses in 2009, and 437 respondents offering 676 responses in 2011. Source: Applied Survey Research. (2007). 2007 Monterey County Homeless Census and Survey. Watsonville, CA. Harder and Company Community Research. (2009). 2009 Monterey County Homeless Census and Survey. San Francisco, CA. Applied Survey Research. (2011). 2011 Monterey County Homeless Census and Survey. Watsonville, CA.
20 These responses were not mutually exclusive.
7.6%
19.2%
32.3%
24.0%
40.3%
3.4%
7.8%
17.3%
29.2%
21.7%
2.8%
9.7%
20.4%
42.3%
32.9%
0% 20% 40% 60% 80% 100%
Sex work
Selling found items
Panhandling
Family/friends
Recycling2007
2009
2011

2011 Monterey & San Benito Counties Homeless Census and Survey Monterey County Homeless Survey Findings
© Applied Survey Research, 2011 37
Access to Government Assistance and Homeless Programs
Government assistance and homeless programs work to enable the homeless community to obtain income and services.21 However, many homeless people do not apply for these programs, or do not feel they qualify for aid.
Government Assistance
60% of respondents reported receiving some form of government assistance, while 40% reported not receiving any assistance.
Between 2007 and 2011, the percentage of respondents who were receiving some form of government assistance decreased from 54% to 40%.
» The percentage of respondents who were receiving Food Stamps increased from 25% to 50%, between 2007 and 2011.
» 13% reported receiving Medi-Cal/Medi-Care health coverage, while 10% were receiving Cash Aid/CalWORKS.22
Figure 24: Of Those Receiving Some Form of Government Assistance, Types of Assistance Received (Top 5 Responses in 2011)
Multiple response question with 400 respondents offering 490 responses in 2007, 379 respondents offering 520 responses in 2009, and 509 respondents offering 713 responses in 2011. Source: Applied Survey Research. (2007). 2007 Monterey County Homeless Census and Survey. Watsonville, CA. Harder and Company Community Research. (2009). 2009 Monterey County Homeless Census and Survey. San Francisco, CA. Applied Survey Research. (2011). 2011 Monterey County Homeless Census and Survey. Watsonville, CA.
21 For the purposes of this study, the following forms of government assistance were included: Food Stamps, Medi-Cal/Medi-Care, Cash Aid/CalWORKS, General Relief, SSI (Supplemental Security Income)/SSDI, WIC, Veterans Benefits, Social Security, VA Disability Compensation, and “other” government assistance. 22 These responses were not mutually exclusive.
24.5%10.0%
3.3% 5.0% 6.5%
23.5%13.5%
1.6%13.2% 11.6%
49.5%
12.8% 10.0% 9.0% 5.5%
0%
20%
40%
60%
80%
100%
Food Stamps Medi-Cal/Medi-Care Cash Aid/CalWORKS General Relief SSI (Supplemental Security Income)/SSDI
2007 2009 2011
Monterey County Homeless Survey Findings 2011 Monterey & San Benito Counties Homeless Census and Survey
38 © Applied Survey Research, 2011
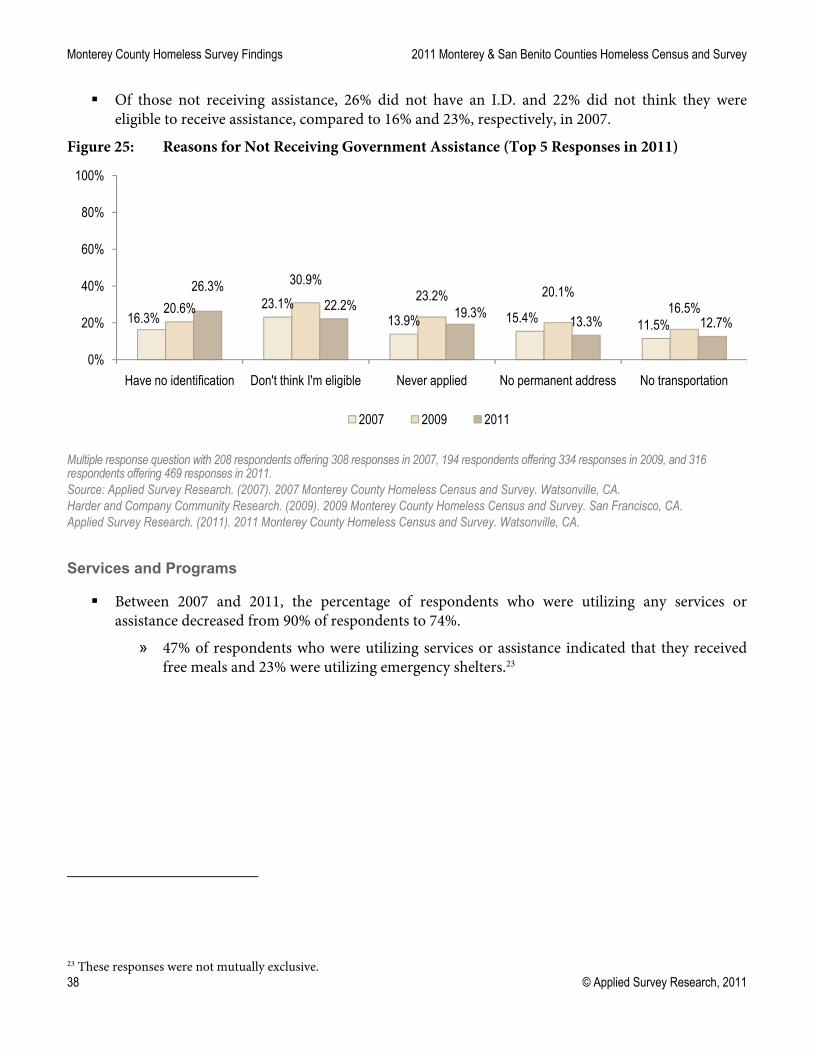
Of those not receiving assistance, 26% did not have an I.D. and 22% did not think they were
eligible to receive assistance, compared to 16% and 23%, respectively, in 2007.
Figure 25: Reasons for Not Receiving Government Assistance (Top 5 Responses in 2011)
Multiple response question with 208 respondents offering 308 responses in 2007, 194 respondents offering 334 responses in 2009, and 316 respondents offering 469 responses in 2011. Source: Applied Survey Research. (2007). 2007 Monterey County Homeless Census and Survey. Watsonville, CA. Harder and Company Community Research. (2009). 2009 Monterey County Homeless Census and Survey. San Francisco, CA. Applied Survey Research. (2011). 2011 Monterey County Homeless Census and Survey. Watsonville, CA.
Services and Programs
Between 2007 and 2011, the percentage of respondents who were utilizing any services or assistance decreased from 90% of respondents to 74%.
» 47% of respondents who were utilizing services or assistance indicated that they received free meals and 23% were utilizing emergency shelters.23
23 These responses were not mutually exclusive.
16.3%23.1%
13.9% 15.4% 11.5%20.6%
30.9%23.2% 20.1%
16.5%
26.3%22.2% 19.3%
13.3% 12.7%
0%
20%
40%
60%
80%
100%
Have no identification Don't think I'm eligible Never applied No permanent address No transportation
2007 2009 2011

2011 Monterey & San Benito Counties Homeless Census and Survey Monterey County Homeless Survey Findings
© Applied Survey Research, 2011 39
Figure 26: Of Those Using Any Services or Assistance, Types of Services or Assistance Used (Top 5 Responses in 2011)
Multiple response question with 400 respondents offering 947 responses in 2007, 365 respondents offering 1,384 responses in 2009, and 513 respondents offering 965 responses in 2011. Source: Applied Survey Research. (2007). 2007 Monterey County Homeless Census and Survey. Watsonville, CA. Harder and Company Community Research. (2009). 2009 Monterey County Homeless Census and Survey. San Francisco, CA. Applied Survey Research. (2011). 2011 Monterey County Homeless Census and Survey. Watsonville, CA.
Medical Care and Health Conditions
Access to health care is vital to general well-being. While many Monterey County residents struggle with the high costs of health care, homeless residents are particularly vulnerable to many unique challenges regarding their health.
Access to Medical Care
Over 26% of homeless respondents reported that since they most recently became homeless, they needed medical care but were unable to receive it. This represented a decrease from 30% in 2007.
Over a third (35%) of homeless survey respondents reported using hospital Emergency Rooms as their primary source of medical care and treatment in 2009.
Figure 27: Have You Needed Health Care and Been Unable to Receive It Since Becoming Homeless This Last Time?
Source: Applied Survey Research. (2007). 2007 Monterey County Homeless Census and Survey. Watsonville, CA. Harder and Company Community Research. (2009). 2009 Monterey County Homeless Census and Survey. San Francisco, CA. Applied Survey Research. (2011). 2011 Monterey County Homeless Census and Survey. Watsonville, CA.
49.3%
25.3% 32.0%19.0% 13.0%
62.5%
35.9% 38.9%
14.5%21.9%
46.6%
25.1% 23.0% 16.4% 13.8%
0%
20%
40%
60%
80%
100%
Free meals Food pantry Emergency shelter Transitional housing Bus passes
2007 2009 2011
30.3%
69.7%56.8%
43.2%26.3%
73.7%
0%20%40%60%80%
100%
Yes No2007 (N=393) 2009 (N=368) 2011 (N=509)
Monterey County Homeless Survey Findings 2011 Monterey & San Benito Counties Homeless Census and Survey
40 © Applied Survey Research, 2011
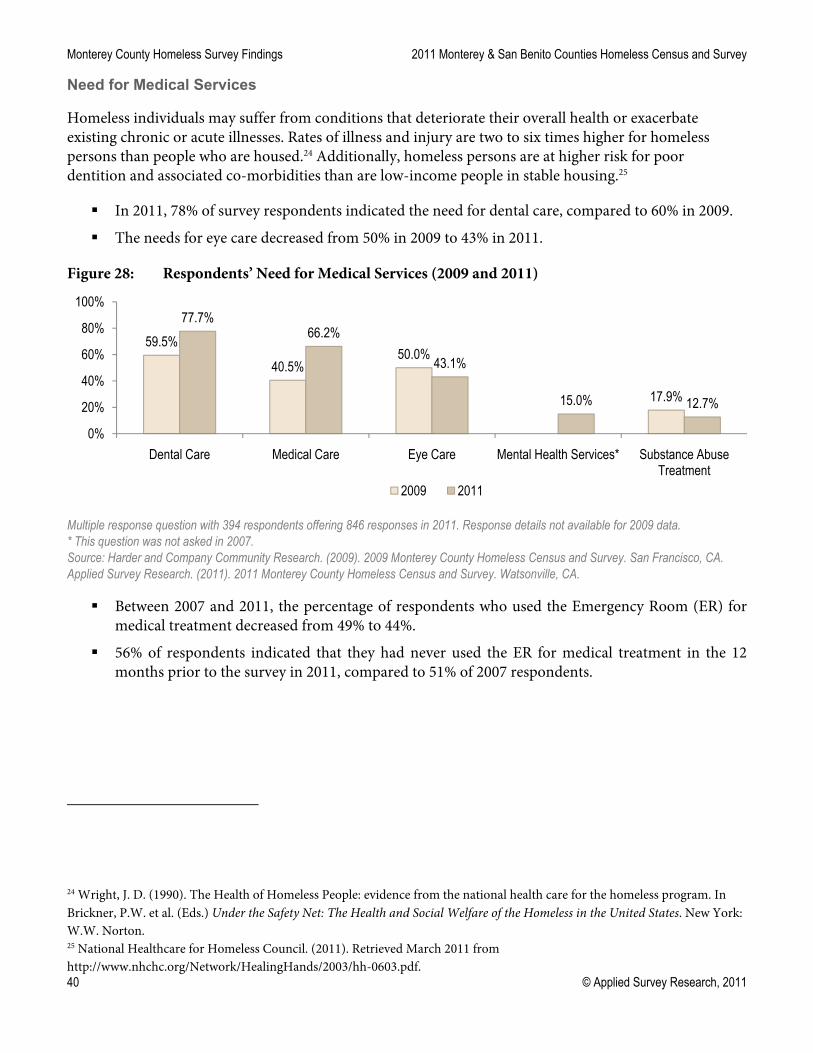
Need for Medical Services
Homeless individuals may suffer from conditions that deteriorate their overall health or exacerbate existing chronic or acute illnesses. Rates of illness and injury are two to six times higher for homeless persons than people who are housed.24 Additionally, homeless persons are at higher risk for poor dentition and associated co-morbidities than are low-income people in stable housing.25
In 2011, 78% of survey respondents indicated the need for dental care, compared to 60% in 2009.
The needs for eye care decreased from 50% in 2009 to 43% in 2011.
Figure 28: Respondents’ Need for Medical Services (2009 and 2011)
Multiple response question with 394 respondents offering 846 responses in 2011. Response details not available for 2009 data. * This question was not asked in 2007. Source: Harder and Company Community Research. (2009). 2009 Monterey County Homeless Census and Survey. San Francisco, CA. Applied Survey Research. (2011). 2011 Monterey County Homeless Census and Survey. Watsonville, CA. Between 2007 and 2011, the percentage of respondents who used the Emergency Room (ER) for
medical treatment decreased from 49% to 44%.
56% of respondents indicated that they had never used the ER for medical treatment in the 12 months prior to the survey in 2011, compared to 51% of 2007 respondents.
24 Wright, J. D. (1990). The Health of Homeless People: evidence from the national health care for the homeless program. In Brickner, P.W. et al. (Eds.) Under the Safety Net: The Health and Social Welfare of the Homeless in the United States. New York: W.W. Norton. 25 National Healthcare for Homeless Council. (2011). Retrieved March 2011 from http://www.nhchc.org/Network/HealingHands/2003/hh-0603.pdf.
59.5%
40.5%50.0%
17.9%
77.7%66.2%
43.1%
15.0% 12.7%
0%
20%
40%
60%
80%
100%
Dental Care Medical Care Eye Care Mental Health Services* Substance Abuse Treatment
2009 2011

2011 Monterey & San Benito Counties Homeless Census and Survey Monterey County Homeless Survey Findings
© Applied Survey Research, 2011 41
Figure 29: Number of Times Respondents Had Used the Emergency Room For Any Treatment in the Year Prior to the Survey
Source: Applied Survey Research. (2007).2007 Monterey County Homeless Census and Survey. Watsonville, CA. Harder and Company Community Research. (2009). 2009 Monterey County Homeless Census and Survey. Watsonville, CA. Applied Survey Research. (2011). 2011 Monterey County Homeless Census and Survey. Watsonville, CA. Chronic Health Problems
According to the Centers for Disease Control and Prevention (CDC), the average life expectancy of the average American is 78 years. A study of homeless mortality rates in seven cities throughout the United States, Canada and Europe, found that the average life expectancy for a person without permanent housing was between 42 and 52 years. The study also indicated that premature death often results from acute and chronic medical conditions aggravated by homeless life.26
Between 2007 and 2011, the percentage of respondents who indicated that they were experiencing chronic health problems decreased from 21% to 13%.
26 O’Connell, J. (2005). Premature Mortality in Homeless Populations: a review of the literature. Retrieved January 13, 2011from http://www.nhchc.org/PrematureMortalityFinal.pdf.
50.8%
19.2%13.8%
5.6% 3.6% 2.1% 4.9%
45.7%
19.5%13.3%
8.6% 5.0% 1.8% 6.1%
56.4%
22.0%
10.2%4.6% 1.6% 3.0% 2.2%
0%
20%
40%
60%
80%
100%
Never 1 time 2 times 3 times 4 times 5 times 6+ times
2007 (N= 390) 2009 (N=342) 2011 (N=500)

Monterey County Homeless Survey Findings 2011 Monterey & San Benito Counties Homeless Census and Survey
42 © Applied Survey Research, 2011
Figure 30: Are You Currently Experiencing Chronic Health Problems?
Note: This question was not asked in 2009 Source: Applied Survey Research. (2007). 2007 Monterey County Homeless Census and Survey. Watsonville, CA. Applied Survey Research. (2011). 2011 Monterey County Homeless Census and Survey. Watsonville, CA. In 2011, 23% of respondents (15 persons) with chronic health problems cited that their
illness/medical problem or hospitalization/treatment was the primary cause of their homelessness. This represents an increase from 13% (24 respondents) in 2007.
Of the respondents with chronic health problems 56% of them said they have needed medical care and were unable to receive it.
The highest reported need for medical services was 75% reporting a need for dental care, followed by 63% of persons in need of general medical care.
Disabling Conditions
For the purposes of this study, a disabling condition was defined as a physical disability, mental illness, depression, alcohol or drug abuse, chronic health problem, AIDS/HIV related illness, Tuberculosis, Hepatitis C, Post-Traumatic Stress Disorder (PTSD), or a developmental disability.
In 2011, the percentage of all survey respondents with one or more disabling condition was 57%.27
27 The existence of a disabling condition is one of the components used to determine whether a person can be considered “chronically homeless” (see HUD Defined Homeless Subpopulations section).
20.5%
76.6%
2.9%13.4%
86.6%
0.0%0%
20%
40%
60%
80%
100%
Yes No Decline to state
2007 (N=376) 2011 (N=494)

2011 Monterey & San Benito Counties Homeless Census and Survey Monterey County Homeless Survey Findings
© Applied Survey Research, 2011 43
Figure 31: Number of Disabling Conditions Among All Homeless Respondents
Source: Applied Survey Research. (2011). 2011 Monterey County Homeless Census and Survey. Watsonville, CA.
Mental Health
National studies have found that a disproportionate number of homeless persons suffer from some form of mental illness.28 Survey respondents were asked about their mental health, including mental illness and depression.
Between 2007 and 2011, the percentage of respondents experiencing depression remained relatively stable, 41% and 40% respectively.
Figure 32: Percentage of Respondents Who Were Currently Experiencing Mental Illness and Depression
2007: Mental Illness N=378, Depression N=377. 2011: Mental Illness N=490, Depression N=491. Source: Applied Survey Research. (2007). 2007 Monterey County Homeless Census and Survey. Watsonville, CA. Applied Survey Research. (2011). 2011 Monterey County Homeless Census and Survey. Watsonville, CA. In 2011, 42% of respondents who were currently experiencing a mental health issue indicated that
their mental health issues led to their homelessness.
28 National Coalition for the Homeless Fact Sheet. (2008). Retrieved on May 20, 2009 at http://www.issuelab.org/research/mental_illness_and_homelessness_2008.
43.5%26.3%
11.5% 7.5% 6.5% 2.5% 2.1%0%
20%40%60%80%
100%
None One Two Three Four Five Six or more
2011 (N=520)
21.7%40.8%
20.0%39.5%
0%
20%
40%
60%
80%
100%
Mental Illness Depression2007 2011

Monterey County Homeless Survey Findings 2011 Monterey & San Benito Counties Homeless Census and Survey
44 © Applied Survey Research, 2011
In 2011, the percentage of respondents who were experiencing a mental illness who had received mental health services or medication in the past 12 months was 63%.
41% of respondents who were currently experiencing mental illness had been hospitalized for emotional problems in the past 12 months.
Mental Health Services
The majority (80%) of homeless respondents reported that they do not, or have not, received mental health services or medication for their mental health in the past 12 months.
Of those respondents who had not received mental health services, 30% reported having trouble accessing mental health services, compared to 14% in 2009.
Despite only 20% of homeless survey respondents reporting that they do not, or have not received mental health services, one third (33%) of respondents in 2011 indicated that they had been hospitalized for emotional problems in the last 12 months, compared to 11% in 2009.
HIV/AIDS
Between 2009 and 2011, the number of respondents who were experiencing HIV/AIDS decreased from 9 respondents to 6.
PROFILE OF MENTAL ILLNESS Cynthia Jones had a successful career in public service and office management but was laid off in 2006 due to the recession and budget cuts. Since she was only functional when she was working, the mental and physical conditions she had managed to conceal for so long began to surface and overwhelm her. She suffered from depression from traumatic abuse, addiction and several chronic, permanent illnesses. She didn’t come out of her bedroom for a year and a half. In 2007 she was classified as permanently disabled and at the same time became homeless.
Feeling hopeless, alone, and with no options, Cynthia had lived in her car for nearly a year when she was referred to MCHOME. Nervously, Cynthia applied to the program and has been grateful ever since. “From the very first introductions, I felt wanted,” she said. MCHOME provided her with subsidized housing, therapy sessions and groups, a support system, resources, and a two-year period in which to recover and mature.
MCHOME’s goal is to move homeless adults living with mental illness off the streets of Monterey and into housing and treatment. MCHOME counselors reach out to approximately 100 homeless adults each year and evaluate them for indications of chronic homelessness and psychiatric disability, and, if they qualify, enroll them in intensive, integrated services that include housing, food, psychiatric care, and financial counseling. Working closely with the Monterey County Health Department Behavioral Health Division MCHOME helps clients get the medical services and medications they need. Counselors also work with the Department of Social Services to help clients file for benefits, such as SSI. Clients are also connected to Interim’s Supported Education & Employment (SEES) and with the Department of Rehabilitation to help them find employment.
For Cynthia, MCHOME made her feel “accepted” and allowed her to trust people for the first time in her life. Cynthia received the tools she needed to get off and stay off the streets. She now has an apartment of her own, friends who care about her and says she loves her life. She credits MCHOME for her “emotional salvation.”
The MCHOME project is funded by the State’s Mental Health Services Act (MHSA), City of Monterey, City of Salinas, United Way of Monterey County, and private donations. There is no fee to the individual. Once they are housed, clients pay for rent and food on a sliding scale.

2011 Monterey & San Benito Counties Homeless Census and Survey Monterey County Homeless Survey Findings
© Applied Survey Research, 2011 45
Physical and Developmental Disabilities
Between 2007 and 2011, the percentage of respondents with a physical and/or developmental disability decreased from 37% to 24%.
Figure 33: Percentage of Respondents Who Were Currently Experiencing a Physical or Developmental Disability
2007: Physical Disability N=387, Developmental Disability N=372. 2011: Physical Disability N=497, Developmental Disability N=492. Source: Applied Survey Research. (2007). 2007 Monterey County Homeless Census and Survey. Watsonville, CA. Applied Survey Research. (2011). 2011 Monterey County Homeless Census and Survey. Watsonville, CA. Note: These responses were not mutually exclusive.
Substance Abuse
Substance use (alcohol or drugs) was the second-most cited cause of homelessness among the homeless survey population in Monterey County. Many survey respondents indicated that they were currently experiencing alcohol or drug abuse at the time of the survey.
38% of respondents experienced alcohol and/or drug abuse problems in 2011.
Figure 34: Percentage of Respondents Who Were Currently Experiencing Alcohol or Drug Abuse
Source: Applied Survey Research. (2011). 2011 Monterey County Homeless Census and Survey. Watsonville, CA.
27.9%
9.1%20.9%
2.8%0%
20%
40%
60%
80%
100%
Physical Disability Developmental Disability
2007 2011
37.5%
62.5%
0%
20%
40%
60%
80%
100%
Yes No
2011 (N=491)
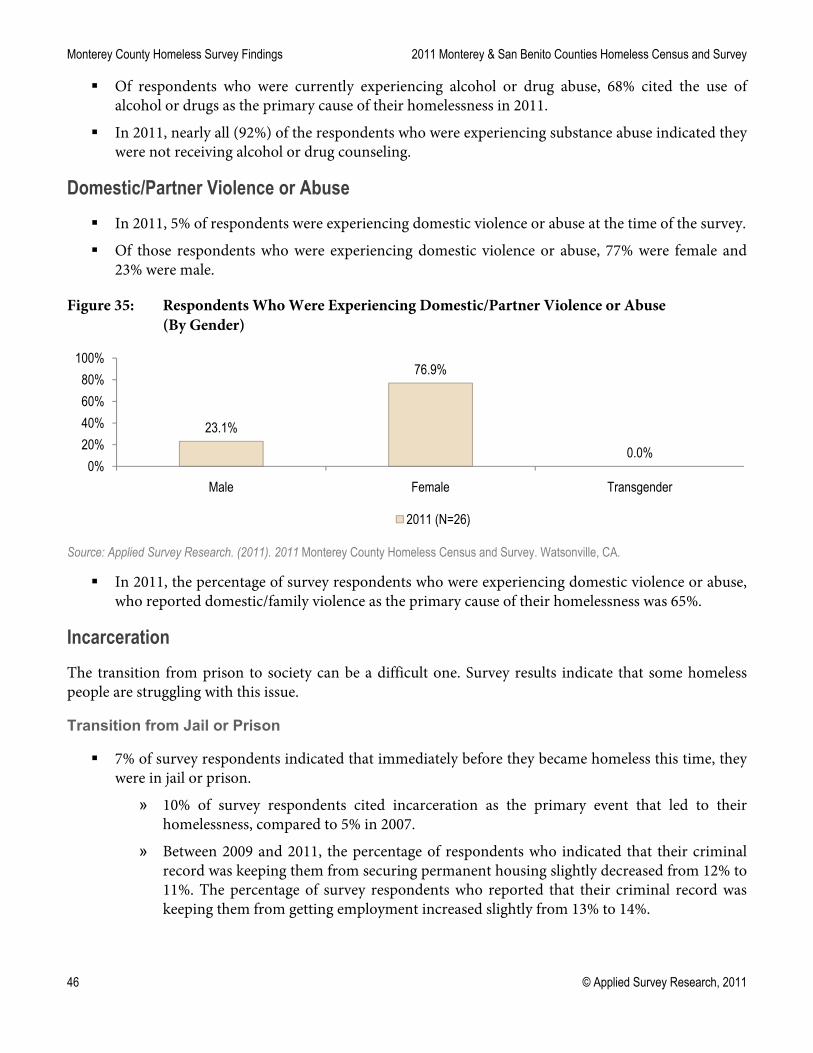
Monterey County Homeless Survey Findings 2011 Monterey & San Benito Counties Homeless Census and Survey
46 © Applied Survey Research, 2011
Of respondents who were currently experiencing alcohol or drug abuse, 68% cited the use of alcohol or drugs as the primary cause of their homelessness in 2011.
In 2011, nearly all (92%) of the respondents who were experiencing substance abuse indicated they were not receiving alcohol or drug counseling.
Domestic/Partner Violence or Abuse
In 2011, 5% of respondents were experiencing domestic violence or abuse at the time of the survey.
Of those respondents who were experiencing domestic violence or abuse, 77% were female and 23% were male.
Figure 35: Respondents Who Were Experiencing Domestic/Partner Violence or Abuse (By Gender)
Source: Applied Survey Research. (2011). 2011 Monterey County Homeless Census and Survey. Watsonville, CA. In 2011, the percentage of survey respondents who were experiencing domestic violence or abuse,
who reported domestic/family violence as the primary cause of their homelessness was 65%.
Incarceration
The transition from prison to society can be a difficult one. Survey results indicate that some homeless people are struggling with this issue.
Transition from Jail or Prison
7% of survey respondents indicated that immediately before they became homeless this time, they were in jail or prison.
» 10% of survey respondents cited incarceration as the primary event that led to their homelessness, compared to 5% in 2007.
» Between 2009 and 2011, the percentage of respondents who indicated that their criminal record was keeping them from securing permanent housing slightly decreased from 12% to 11%. The percentage of survey respondents who reported that their criminal record was keeping them from getting employment increased slightly from 13% to 14%.
23.1%
76.9%
0.0%0%
20%
40%
60%
80%
100%
Male Female Transgender
2011 (N=26)

2011 Monterey & San Benito Counties Homeless Census and Survey Monterey County Homeless Survey Findings
© Applied Survey Research, 2011 47
Nights in Jail or Prison
Though the HUD definition of homelessness for Point-in-Time counts does not include those residing in jails; the Monterey County Jail provided supplemental data for this report. The county jail reported that on any given night about 135 homeless individuals were sheltered in the jail. Of those, 118 were male and 7 were female. The jail reports the number of homeless individuals remains relatively consistent.
35% of homeless survey respondents reported that they had spent at least one night in jail or prison in the year prior to the survey.
Figure 36: Number of Nights Respondents Reported Spending in Jail/Prison in the Year Prior to the Survey
Source: Applied Survey Research. (2007). 2007 Monterey County Homeless Census and Survey. Watsonville, CA. Applied Survey Research. (2011). 2011 Monterey County Homeless Census and Survey. Watsonville, CA.
Probation or Parole
22% of survey respondents reported currently being on probation or parole at the time the survey was administered, a slight decrease from one-quarter (25%) of respondents in 2007.
» 21% of survey respondents reported being on probation or parole when they most recently became homeless, compared to 28% in 2007.
Tickets
More than one-quarter (27%) of homeless respondents in 2011 reported that in the past 12 months they had received one or more tickets for parking violations, loitering, trespassing, or camping.
70.4%
7.9% 2.0% 3.8% 3.3%12.5%
64.8%
18.7%
3.0% 4.3% 5.1% 4.1%0%
20%
40%
60%
80%
100%
0 1-5 nights 6-10 nights 11-20 nights 21-50 nights More than 50 nights
2007 (N=392) 2011 (N=508)

Monterey County Homeless Survey Findings 2011 Monterey & San Benito Counties Homeless Census and Survey
48 © Applied Survey Research, 2011
Figure 37: Number of Tickets Received by Respondents (2011)
Source: Applied Survey Research. (2011). 2011 Monterey County Homeless Census and Survey. Watsonville, CA.
Foster Care
Transition from Foster Care
When respondents were asked if they had ever been in foster care, 10% of respondents indicated that they had, compared to 9% in 2007.
» In 2011, less than 1% of survey respondents said that aging out of foster care was the primary event that led to their homelessness.
73.3%
12.6% 5.9% 2.6% 1.4% 4.2%0%
20%
40%
60%
80%
100%
0 tickets 1 ticket 2 tickets 3 tickets 4 tickets 5 or more tickets
2011 (N=506)
2011 Monterey & San Benito Counties Homeless Census and Survey HUD Defined Homeless Subpopulations
© Applied Survey Research, 2011 49
MONTEREY COUNTY HUD DEFINED HOMELESS SUBPOPULATIONS
Chronic Homelessness
The mortality rate for chronically homeless men and women is four to nine times higher than for the general population and those experiencing long-term homelessness often incur significant public costs – through emergency room visits, run-ins with law enforcement, incarceration, and access to existing poverty and homeless programs.29 In 2011, the federal government announced a 5-year plan to end chronic homelessness. The plan focuses on permanent supportive housing, reducing financial instability, and improving heath and housing stability.30
HUD defines a chronically homeless person as:
An unaccompanied individual with a disabling condition who has been:
Continually homeless for one year or more, or
Has experienced four or more episodes of homelessness within the past 3 years.
For the purposes of this study, a “disabling condition” was defined as a physical disability, mental illness, depression, alcohol or drug abuse, AIDS/HIV related illness, chronic health problems, Tuberculosis, Hepatitis C, or a developmental disability. Those currently living in transitional housing are not considered by HUD to be chronically homeless.
From 2009 to 2011, the percentage of all survey respondents who were chronically homeless increased from 36% (138 respondents) to 38% (194 respondents).
18% of chronically homeless individuals in Monterey County were sheltered in 2011, while the majority, 82% were unsheltered.
» In 2009, 27% of homeless individuals in the United States were considered chronically homeless, 58% of those were unsheltered.31
» The largest percentage of chronically homeless respondents (39%) indicated that they usually sleep outdoors (on the street, in parks, in creek beds, or in encampments).
The chronically homeless survey results were used to project approximately how many people are chronically homeless in Monterey County at a given point in time.
29 National Alliance to End Homelessness. (2011). Fact Sheet: Chronically Homeless. Washington, D.C. Retrieved March 2011 from http://www.endhomelessness.org/content/article/detail/1623 30 United States Interagency Council on Homelessness. (2011). Opening Doors: federal strategic plan to prevent and end homelessness. Washington, D.C. 31 U.S. Department of Housing and Urban Development, Office of Community Planning and Development. (2009). The Annual Assessment Report to Congress.

HUD Defined Homeless Subpopulations 2011 Monterey & San Benito Counties Homeless Census and Survey
50 © Applied Survey Research, 2011
» It is estimated that on any given night, Monterey County has a chronically homeless population of approximately 1,345 persons. This represents a 22% increase from 1,100 chronically homeless individuals in 2009.
» It should be noted that this figure is derived from the population of homeless persons who are eligible to be considered chronically homeless by HUD; therefore the chronically homeless population includes only those homeless persons who are unaccompanied individuals, unsheltered or in emergency shelters, and does not include those in transitional housing, jails, hospitals, and rehabilitation facilities, or anyone in a family.
In 2011, 68% of chronically homeless people were male.
Figure 38: Chronically Homeless Population by Gender, 2011
N=196 Source: Applied Survey Research. (2011). 2011 Monterey County Homeless Census and Survey. Watsonville, CA. In 2011, the largest percentage of chronically homeless people indicated they were
White/Caucasian (44%), followed by Hispanic/Latino (40%) and Black/African American (5%). 52% of chronically homeless people had more than one disabling condition.
39% of chronically homeless persons were living outdoors, on the street, or in encampments.
» 19% had four or more disabling conditions that complicated or prevented them from maintaining work or housing.
50% of chronically homeless respondents indicated that they were not receiving any form of government benefits (income or non-income).
» 56% of chronically homeless survey respondents reported using free meal services.
» 36% were not using any form of community assistance or support.
32.1%
67.9%
0%
20%
40%
60%
80%
100%
Female Male
2011 Monterey & San Benito Counties Homeless Census and Survey HUD Defined Homeless Subpopulations
© Applied Survey Research, 2011 51
Veterans
National data shows that only eight percent of the general U.S. population can claim veteran status, but nearly one-fifth of the homeless population identify as veterans.32
In general, veterans have high rates of Post-Traumatic Stress Disorder (PTSD), traumatic brain injury, and sexual trauma, which can lead to higher risk for homelessness. About half of homeless veterans have serious mental illness and 70 percent have substance abuse problems.33 Half of homeless veterans have histories of involvement with the legal system. Veterans are more likely to live outdoors—unsheltered—and experience long-term, chronic homelessness.34
The United States Interagency Council on Homelessness is facilitating collaborative efforts by the Department of Veteran’s Affairs (VA), HUD, Labor, and Health and Human Services to align resources for greater effectiveness by bringing together programs that would otherwise operate separately. This year was the first year the VA will use the national HUD Point-in-Time counts as the definitive count of homeless veterans. This year, the VA recommended two questions to determine Veterans Status: “Have you ever served in the U.S. Armed Forces?” and “Were you activated into active duty, as a member of the National Guard or as a reservist?”
Number of Sheltered and Unsheltered Homeless Veterans
13% of survey respondents over the age of 18 were veterans.
» The percentage of survey respondents ages 18 and older who had served in the United States Armed Forces increased from 9% in 2009 to 13% in 2011.
» Of sheltered survey respondents ages 18 and older, 9% reported that they were veterans.
Demographics of Homeless Veterans
86% of homeless veterans were male in 2011.
The largest percentage of homeless veterans indicated they were White/Caucasian (55%), Hispanic/Latino (16%) followed by Black/African American (13%).
Two-thirds of homeless veterans (65%) had at least one disabling condition and 58% were experiencing more than two.
The disabling condition reported by the largest percentage of homeless veterans was depression (42%).
32 National Coalition for Homeless Veterans. Retrieved January 13, 2011, from http://www.nchv.org/background.cfm. 33 Interagency Council on Homelessness. (2010). Opening Doors: Federal strategic plan to prevent and end homelessness. Retrieved January 13, 2011, from http://www.usich.gov/PDF/FactSheetVeterans.pdf. 34 Interagency Council on Homelessness. (2010). Opening Doors: Federal Strategic Plan to Prevent and End Homelessness. Retrieved January 13, 2011, from http://www.usich.gov/PDF/FactSheetVeterans.pdf.

HUD Defined Homeless Subpopulations 2011 Monterey & San Benito Counties Homeless Census and Survey
52 © Applied Survey Research, 2011
» 31% of veterans reported having a physical disability, 29% reported experiencing chronic health problems.
» 22% of respondents reported suffering from PTSD and 21% reported having a mental illness.35
Figure 39: Percentage of Homeless Veteran Respondents Who Were Experiencing the Following Disabling Conditions (2011)
Note: These responses were not mutually exclusive. Note: Percentages are unstable due to small sample size (69 individuals) 2011: Depression N=28, Alcohol/Drug abuse N=22, Mental illness N=13, Physical disability N=21, Chronic health problems N=19, PTSD N=14, Developmental disability N=2, HIV/AIDS N=1. Source: Applied Survey Research. (2011). 2011 Monterey County Homeless Census and Survey. Watsonville, CA. 42% of homeless veteran respondents cited loss of a job as the primary cause of their homelessness.
» 34% reported alcohol or drug use as the primary cause of their homelessness.
Figure 40: Primary Causes of Homelessness, Veteran and Non-Veteran Comparison (2011)
Source: Applied Survey Research. (2011). 2011 Monterey County Homeless Census and Survey. Watsonville, CA.
30% of homeless veteran respondents indicated that they usually slept outdoors (on the streets, in parks, or in encampments) at night, followed by 20% who usually stayed in their vehicles.
35 These responses were not mutually exclusive.
1.5%3.0%
33.3%20.6%
21.9%28.8%
31.3%42.4%
0% 20% 40% 60% 80% 100%
HIV/AIDS related illnessDevelopmental disability
Drug/Alcohol abuseMental illness
PTSDChronic health problems
Physical disabilityDepression
42.4% 34.8%10.6% 10.6% 16.7% 9.1%
44.7% 39.6%
9.4%12.4%
26.5%
8.1%
0%
20%
40%
60%
80%
100%
Job Loss Alcohol or Drug Use
Mental Health Issues
Family/Domestic Violence
Lost Income Divorce/Seperation
Veterans (N=66) Non-Veterans (N=445)

2011 Monterey & San Benito Counties Homeless Census and Survey HUD Defined Homeless Subpopulations
© Applied Survey Research, 2011 53
29% of homeless veterans indicated that they were not receiving any government assistance.
» The types of government assistance most commonly received by homeless veterans were Food Stamps (48%), General Assistance (14%), Medi-Cal/Medicare (6.2%), and SSI/SSDI (5%).36
» The most commonly cited services used by the homeless veterans were free meals (43%), health services (15%), emergency shelters (11%), shelter day services (3%), and twenty-nine percent (29%) of veteran respondents indicated that they were not using any services.
Homeless Families
National reports reveal that one of the fastest growing segments of the homeless population is families with children. Families, single mothers, and children make up the largest group of people who are homeless in rural areas.37 Children in families experiencing homelessness have high rates of acute and
36 These responses were not mutually exclusive. 37 Vissing, Y. M. (1996). Out of sight, out of mind: homeless children and families in small-town America. Lexington: University Press of Kentucky.
PROFILE OF VETERAN HOMELESSNESS Mr. John W. Lane, Jr. served in the Army at the end of the Vietnam Conflict and had a 10 year history of homelessness. A local shelter referred Mr. Lane to the HUD-VASH program, a partnership between the U.S. Department of Housing and Urban Development (HUD) and Department of Veterans Affairs (VA) developed to help end homelessness among Veterans.
Mr. Lane got help from the staff of the VA and financial support from a community agency for the deposit to get his own one-bedroom apartment in Monterey. It was the first time he had a place to call his own in many years. Mr. Lane lived on odd jobs and finally began receiving a monthly VA Pension which helped him develop a stable financial foundation. Unfortunately, behaviors related to his ongoing alcohol use caused him to be evicted from his apartment. Mr. Lane was able to enter a shelter in Menlo Park and outpatient substance use treatment groups where he examined how his alcohol use contributed to his homelessness. Finally, Mr. Lane was able to reapply for a VASH housing voucher and secured a one-bedroom apartment which he continues to maintain by staying connected with VA supports and services and working to be a "good neighbor." While the path to permanent housing is not always straight, sometimes the diversions provide the most potential for growth. The philosophy behind HUD-VASH supports chronically homeless Veterans with multiple complicating issues achieve long-term success using their strengths and resiliency to make the changes necessary to be successful.
The VA is working to end homelessness among Veterans. Specifically, in Monterey County, the VA Palo Alto Health Care System's Monterey Community Based Outpatient Clinic provides a range of services to eligible Veterans. The National Call Center for Homeless Veterans (1-877-4AID-VET ) connects callers from all over the country with local VA providers who can link them with local housing resources. Weekly Housing Resource Groups are held at the Monterey Clinic, with plans to expand to community sites, to help connect Veterans with the range of housing resources from short-term emergency shelter beds to permanent housing options like HUD-VASH. In Marina, the Veterans Transition Center is a non-profit agency contracted by the VA to provided transitional housing and linkages to treatment services to eligible Veterans and their families. The HUD-VASH program which serves Mr. Lane promotes permanent housing for chronically homeless Veterans. Low-income Veterans who are eligible for HUD-VASH receive a specialized Housing Choice Voucher (Section 8) to be used at the rental of their choosing. Eligible Veterans also receive intensive, ongoing case management from HUD-VASH case managers as well as other services from the Health Care System. To date, 85 HUD-VASH vouchers have been issued in Monterey County.

HUD Defined Homeless Subpopulations 2011 Monterey & San Benito Counties Homeless Census and Survey
54 © Applied Survey Research, 2011
chronic health problems and many have been exposed to violence. Homeless children are more likely to have emotional and behavioral problems than children with consistent living accommodations.38
Number of Homeless Families
It is estimated that on any given night, Monterey County has a population of approximately 299 homeless families with children.
In the 2011 Point-in-Time count 19% of those counted (483 people) were persons in families.
» In 2011, HUD expanded the definition of chronically homeless to include families. In Monterey County 39 persons in families feel within the definition of chronically homeless.
Demographics of Homeless Families
95% of homeless families had a female head of household.
» The largest percentage of homeless individuals with children indicated they were White/Caucasian (41%), followed by Hispanic/Latino (39%), and Black/African American (13%).
Primary Cause of Homelessness for Homeless Families with Children
31% of homeless survey respondents with children cited job loss as the primary cause of their homelessness, while 28% reported drug or alcohol use as the primary cause of their homelessness.
An additional 28% of homeless survey respondents in families reported family/domestic violence as the primary cause of their homelessness.
Government Assistance for Homeless Families with Children
The types of government assistance most commonly received by homeless individuals with children were Food Stamps (79%), Medi-Cal/Medicare (69%), CALWorks/Cash Aid (59%), and WIC (25%). However, 15% of homeless parents with children indicated that they were not receiving any government assistance. 39
The most commonly cited services used by homeless families was transitional housing (71%), food pantry services (36%), 20% were using mental health services and 12% were using basic health services. Eight percent (8%) of homeless families indicated that they were not using any services. 40
38 U.S. Interagency Council on Ending Homelessness. (2010). Opening Doors: federal strategic plan to prevent and end homelessness. Retrieved March 2011 from www.usich.gov. 39 These responses were not mutually exclusive. 40 These responses were not mutually exclusive.
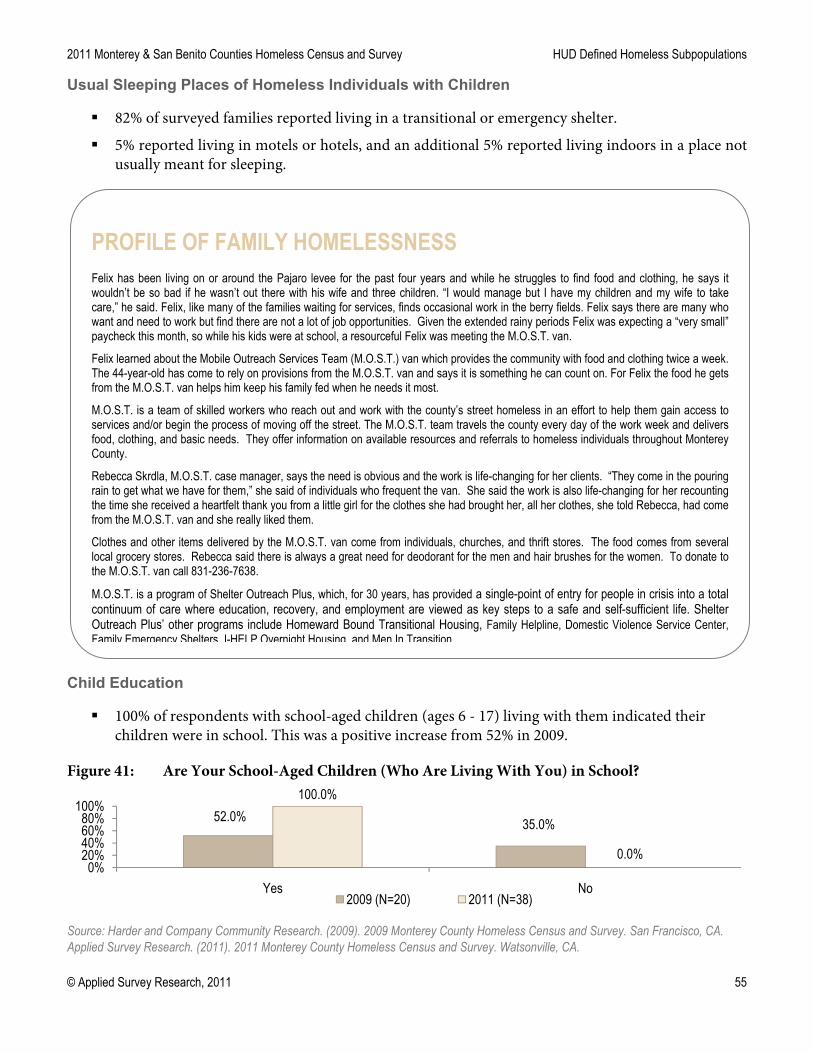
2011 Monterey & San Benito Counties Homeless Census and Survey HUD Defined Homeless Subpopulations
© Applied Survey Research, 2011 55
Usual Sleeping Places of Homeless Individuals with Children
82% of surveyed families reported living in a transitional or emergency shelter.
5% reported living in motels or hotels, and an additional 5% reported living indoors in a place not usually meant for sleeping.
Child Education
100% of respondents with school-aged children (ages 6 - 17) living with them indicated their children were in school. This was a positive increase from 52% in 2009.
Figure 41: Are Your School-Aged Children (Who Are Living With You) in School?
Source: Harder and Company Community Research. (2009). 2009 Monterey County Homeless Census and Survey. San Francisco, CA. Applied Survey Research. (2011). 2011 Monterey County Homeless Census and Survey. Watsonville, CA.
52.0% 35.0%
100.0%
0.0%0%
20%40%60%80%
100%
Yes No2009 (N=20) 2011 (N=38)
PROFILE OF FAMILY HOMELESSNESS Felix has been living on or around the Pajaro levee for the past four years and while he struggles to find food and clothing, he says it wouldn’t be so bad if he wasn’t out there with his wife and three children. “I would manage but I have my children and my wife to take care,” he said. Felix, like many of the families waiting for services, finds occasional work in the berry fields. Felix says there are many who want and need to work but find there are not a lot of job opportunities. Given the extended rainy periods Felix was expecting a “very small” paycheck this month, so while his kids were at school, a resourceful Felix was meeting the M.O.S.T. van.
Felix learned about the Mobile Outreach Services Team (M.O.S.T.) van which provides the community with food and clothing twice a week. The 44-year-old has come to rely on provisions from the M.O.S.T. van and says it is something he can count on. For Felix the food he gets from the M.O.S.T. van helps him keep his family fed when he needs it most.
M.O.S.T. is a team of skilled workers who reach out and work with the county’s street homeless in an effort to help them gain access to services and/or begin the process of moving off the street. The M.O.S.T. team travels the county every day of the work week and delivers food, clothing, and basic needs. They offer information on available resources and referrals to homeless individuals throughout Monterey County.
Rebecca Skrdla, M.O.S.T. case manager, says the need is obvious and the work is life-changing for her clients. “They come in the pouring rain to get what we have for them,” she said of individuals who frequent the van. She said the work is also life-changing for her recounting the time she received a heartfelt thank you from a little girl for the clothes she had brought her, all her clothes, she told Rebecca, had come from the M.O.S.T. van and she really liked them.
Clothes and other items delivered by the M.O.S.T. van come from individuals, churches, and thrift stores. The food comes from several local grocery stores. Rebecca said there is always a great need for deodorant for the men and hair brushes for the women. To donate to the M.O.S.T. van call 831-236-7638.
M.O.S.T. is a program of Shelter Outreach Plus, which, for 30 years, has provided a single-point of entry for people in crisis into a total continuum of care where education, recovery, and employment are viewed as key steps to a safe and self-sufficient life. Shelter Outreach Plus’ other programs include Homeward Bound Transitional Housing, Family Helpline, Domestic Violence Service Center, Family Emergency Shelters, I-HELP Overnight Housing, and Men In Transition.

HUD Defined Homeless Subpopulations 2011 Monterey & San Benito Counties Homeless Census and Survey
56 © Applied Survey Research, 2011
The 2011 Homeless Census collected secondary data on the number of homeless children and youth recorded in Monterey County by the California Department of Education (CDE). The CDE’s definition of homelessness is broader and includes those children who are doubled up, precariously housed or in danger of losing their housing. The following chart indicates the grade and number of homeless children recorded by the CDE.
Homeless Children and Youth Enrollment Numbers (2011)
Pre-K and
Kindergarten 1st through
3rd grade 4th through
6th grade 7th and 8th
grade 9th through 12th grade Total
Carmel Unified 1 1 0 1 8 11 Gonzales Unified 2 7 9 11 6 35 King City elementary 20 79 33 13 0 145 MCOE - Alt. Ed. 0 0 0 0 12 12 MCOE - Sp. Ed. 5 5 10 0 1 21 MPUSD 53 168 110 58 74 463 Pacific Unified 0 0 0 0 1 1 Salinas Union HSD 0 0 0 81 45 126 Salinas City ESD 247 354 308 0 0 909 Santa Rita 7 23 22 4 0 56 Total 335 637 492 168 147 1,924
Source: Monterey County Office of Education. (2011). Elementary and Secondary Education Act, Title 1 reporting. Monterey, CA.
Of the homeless children and youth the CDE reported, 136 were living in shelters and included in our count. An additional 112 were unsheltered and may have been included in the count. However, 1,469 children and youth were precariously housed, living doubled up or staying with friends and family.41
Children living in Foster Care or with Other Family Members
74% of respondents who reported having children were not currently living with their children
» Of the respondents who indicated they had children, 5% reported that they had one or more children in foster care.
» 36% reported they had children living with friends or other family members.
Unaccompanied Homeless Children and Youth
“Unaccompanied Children” are children under the age of 18 who are homeless and living independent of a parent or legal guardian. Homeless Youth are defined as individuals between the ages of 18 and 24 years old. Identifying and including unaccompanied homeless children and youth in the Annual Point-in-Time Count is challenging. Data on the population both locally and national is extremely limited. What little
41 Monterey County Office of Education. (2011). Elementary and Secondary Education Act, Title 1 reporting. Monterey, CA.

2011 Monterey & San Benito Counties Homeless Census and Survey HUD Defined Homeless Subpopulations
© Applied Survey Research, 2011 57
data is available suggest the negative effects of homelessness on children are high and those experiencing homelessness face even greater challenges than their adult counterparts. They have a harder time accessing services, including shelter, medical care and employment.42
Monterey County increased their efforts to include unaccompanied children and youth in the 2011 Homeless Census and Survey. The youth focused street count took place in the afternoon of January 26, 2011, from approximately 2:00 pm to 6:00 pm, when children were more likely to be visible in the community. ASR worked with local youth service providers and hired local homeless youth to participate in the count, with the belief that they had particular knowledge and access to areas where homeless children and youth congregate. Unaccompanied children and youth who were surveyed took the basic two-page survey, as well as 28 additional survey questions that asked specifically about their circumstances as unaccompanied children. Due to the small number of unaccompanied children under the age of 18 and limited access to children by homeless surveyors, no children under the age of 18 participated in the youth survey. However, a total of 51 homeless youth under the age of 25 answered the survey. The following section details results of both the youth specific count and survey.
Number and Characteristics
280 unaccompanied youth under the age of 25 were included in the homeless census.
» 9 youth were sheltered on the night of January 25, 2011.
» Of the 280 unaccompanied youth, 97 were under the age of 18. All unaccompanied children were counted in the unsheltered street count.
Demographics
There was a slightly higher percentage of homeless male youth (53%) than female youth (43%).
» The largest percentage of homeless youth indicated they were White/Caucasian (47%), followed by Hispanic/Latino (31%), and Black/African American (6%).
Education and School Enrollment
7% of homeless youth reported being currently in school; of those respondents, 38% plan on finishing school.
» 37% of youth survey respondents plan on going to college.
42 National Coalition for the Homeless. (2011). Homeless Youth Fact Sheet. Retrieved March 2011 from http://www.nationalhomeless.org/factsheets/index.html.

HUD Defined Homeless Subpopulations 2011 Monterey & San Benito Counties Homeless Census and Survey
58 © Applied Survey Research, 2011
County of Residency
43% of homeless youth reported living in Monterey County when they became homeless this most recent time.
» 49% reported staying in the county year round.
» 31% reported living outside of California when they most recently became homeless.
Usual Sleeping Places
45% of homeless youth respondents indicated that they usually slept outdoors (on the streets, in parks, or in encampments) at night, followed by 14% who usually stayed in their vehicles.
» 5% reported that they did not feel safe in their current living situation.
» 37% reported having moved more than 4 times in the past 3 months.
» 29% reported having traded sex or drugs for a place to stay.
PROFILE OF YOUTH HOMELESSNESS Morgan ran away from the group home she was living in when she was 14-years-old. Now 22, she calls the streets of Monterey her home. Morgan primarily sleeps in homeless camps but sometimes stays with friends. She explained that her friends also go through “various stages” of homelessness so isn’t always guaranteed that one will be able to give her a place to stay at night. Pursuing her education goals has not been easy for Morgan. Morgan met many of her current friends at the age of 13, when she started hanging out in the downtown area. Morgan was drawn to the downtown, explaining that her parents were “not around much” and were “very strict.” She reflects on her early home life when talking about her early education. Morgan was homeschooled when she lived with her parents. Yet, she reports that her parents were frequently absent and she often had to teach herself. She completed her high school course work at Pacific Grove Adult Education. She currently attends Monterey Peninsula College where she is working towards completing her AS degree which she has nearly completed. She hopes to transfer to Georgetown in Washington, D.C. where some of her family members still reside. Morgan says she continues to visit with her mom but says she doesn’t see her father often because he wants her to join the military, which she says, “is not what I’m about.”
Floyd Van De Vere, Youth Service program director at Community Human Services (CHS), a local nonprofit that has provided a wide-range of services to Morgan over the past year. Floyd describes Morgan as. “a sweet girl who just wants someone to love and accept her the way she is.”
For more than 20 years, CHS has been serving at-risk, runaway and homeless youth in Monterey County providing counseling, family reunification, street outreach, transitional supportive housing, and drug and alcohol intervention services. For Morgan CHS has been a place she goes to for food, clothing, and the comfort of caring people. Of the youth served by CHS, Van De Vere says, “They are survivors who have really good hearts, but are very afraid of rejection and failing.” He said seeing smiling faces on homeless youth is what makes his job rewarding but admits the ultimate reward is helping, “a youth who wants off the streets get off the streets.” Other CHS programs include the Family to Family program for foster youth and at-risk families, SuperKids and SuperTeens offering in-school counseling for emotionally troubled youth, and the Off Main Clinic offering methadone maintenance, counseling and detoxification.

2011 Monterey & San Benito Counties Homeless Census and Survey HUD Defined Homeless Subpopulations
© Applied Survey Research, 2011 59
Figure 42: Where Do You Usually Stay at Night? (Homeless Children and Youth, 2011)
N=51 Source: Applied Survey Research. (2011). 2011 Monterey County Homeless Census and Survey. Watsonville, CA. Primary Cause of Homelessness
One third (33%) of homeless youth survey respondents reported job loss as the primary cause of their homelessness.
26% of homeless youth survey respondents cited alcohol/drug issues as contributing to their homelessness.
23% of children and youth have or had homeless parents.
Utilization of Government and Social Assistance
88% of homeless youth reported not receiving any kind of government assistance.
» 8% were receiving Food Stamps.
The most commonly cited services used by homeless youth were free meals (46%), food pantries (14%), bus passes (6%), and alcohol and drug counseling (6%).43 Forty-four percent (44%) of homeless youth indicated that they were not using any non-governmental services.
24% of homeless youth reported not using any youth specific services.
» The most commonly cited current needs of homeless children and youth were food (80%), dental care (51%), showers (49%), and transportation (46%).
» When asked what would help to get them off the streets, 76% of homeless youth responded job training/employment.
Social Support Networks
51% of youth reported living with other individuals.
43 These responses were not mutually exclusive.
3.9%
5.9%
13.7%
21.6%
5.9%
45.1%
0% 20% 40% 60% 80% 100%
Other
Motel/hotel
Vehicle
A structure or indoor area not normally used for sleeping
Emergency or other shelter
Outdoors/streets/parks/encampments

HUD Defined Homeless Subpopulations 2011 Monterey & San Benito Counties Homeless Census and Survey
60 © Applied Survey Research, 2011
» 39% of youth reported living with a significant other and 39% reported living with their street family.
» 37% of youth survey respondents reported having stayed 4 or more nights with friends or family in the two weeks prior to the survey.
56% of homeless youth reported having 4 or more people in the group they regularly hung out with.
» 21% reported not having anyone to hang out with.
54% of homeless youth reported having an adult in the community they could trust.
» The majority of youth reported this person was a friend, an additional 10% knew them from work or a drop-in center.
58% of youth reported having interacted with police or sheriffs “Never” or “Rarely” since becoming homeless.
Physical Health and Wellbeing
68% of youth reported their general health was good or very good.
» 0% of survey respondents indicated they were in poor physical health.
» 23% reported having spent 4 or more days in the emergency room in the past year.
Mental Health and Wellbeing
30% of homeless youth survey respondents reported having a mental illness.
» 41% reported depression and 10% reported suffering from PTSD.
» 10% of youth reported having sought formal counseling services through government, church or youth programs.
Experiences with Violence
30% of youth survey respondents reported their safety had been threatened 1 or more times in the past 30 days.
Drug and Alcohol Abuse
42% of youth reported alcohol or drug abuse.
58% of youth reported their parents abused drugs or alcohol when they were children.
» 58% reported marijuana was their primary drug of choice.
» 50% reported alcohol was their primary drug of choice.
» 25% reported using drug or alcohol to get through the day.
» 81% reported using drug or alcohol because they enjoyed it.

SAN BENITO COUNTY EXECUTIVE SUMMARY


Conclusion 2011 Monterey & San Benito Counties Homeless Census and Survey
64 © Applied Survey Research, 2011
CONCLUSION
The 2011 Monterey and San Benito Counties Homeless Census and Survey were performed using HUD-recommended practices for counting the homeless population. This important effort provided valid and useful data regarding the homeless population in Monterey County. The 2011 enumeration built upon the 2007 and 2009 efforts and continued the compilation of comparable multi-year data on the experience of homelessness in Monterey County. Continued use of this methodology will enable the tracking of key indicators and gauge the changing conditions experienced by homeless individuals and families throughout the County.
Findings from the 2011 Monterey County Homeless Census reveal an increase in the homeless population in the county from 2,407 in 2009 to 2,507 in 2011. Increased efforts to reach unaccompanied homeless children and youth led to an increase in the number homeless individuals under the age of 25 included in the 2011 count, including 97 unaccompanied homeless children. In 2011, as in 2009, the Homeless Census provided a more comprehensive view of homelessness through the inclusion of supplemental data from sources including the county jail and the Monterey County Office of Education.
Homeless Survey results suggest that the characteristics of the homeless population in Monterey County have remained relatively stable since 2009. Slight differences emerged in participants’ employment status, government benefits received, locations where participants stay at night, the age of the homeless population, and the number of individuals who were experiencing homelessness for the first time.
This 2011 report also includes data from San Benito County. The U.S. Department of Housing and Urban Development is encouraging Continuum of Care coverage nationwide in order to achieve improved coordination of services, more efficient resource allocation, and regional planning to address homelessness. San Benito County will be merging with the Salinas/Monterey County Continuum of Care in 2011 and the 2011 Homeless Census and Survey will mark the start of San Benito County’s inclusion in the Biannual Point-in-Time counts.
It is hoped that the data presented in this report will be used by the planning bodies of Monterey County, San Benito County and other organizations to inform additional outreach, service planning, and policy decision-making over the next two years as they continue to address homelessness. It is also hoped that this report will be disseminated to other jurisdictions and educational research institutions in order to gain feedback on the methodologies used and results obtained for the 2011 Monterey and San Benito Counties Homeless Census and Survey. By sharing and evaluating this enumeration effort and its results, the homeless support network in Monterey and San Benito Counties will be better able to produce constructive and innovative solutions to a problem that clearly affects many people in the community.
2011 Monterey & San Benito Counties Homeless Census and Survey Appendix I: Homeless Census and Survey Methodology
© Applied Survey Research, 2011 65
APPENDIX I: HOMELESS CENSUS AND SURVEY METHODOLOGY
Overview
The purpose of the 2011 Monterey and San Benito Counties Homeless Census and Survey was to produce a Point-in-Time estimate of the number of people in Monterey County and San Benito County who experience homelessness. The results of each counties street count were combined with the results from their shelter count to produce the total number of homeless people in each county. A more detailed description of the methodology used for the homeless census and survey follows.
Components of the Homeless Count Method
The census methodology had two components:
The street count – an enumeration of unsheltered homeless individuals.
The shelter and institution count – an enumeration of sheltered homeless individuals.
Street Count Methodology
Definition
For the purposes of this study, the HUD definition of an unsheltered homeless person was used: someone who is either living on the streets, or in a vehicle, encampment, abandoned building, unconverted garage, or any other place not normally used or meant for human habitation.
Research Design
Monterey County covers approximately 3,771 square miles while San Benito County is 1,389 square miles.44 The logistics for conducting a Point-in-Time street count of homeless people in an area this large required significant enumeration efforts. The purpose of the early morning street count was to conduct a complete enumeration of unsheltered homeless people within the 24 hour period required by HUD. The unsheltered and sheltered homeless counts were coordinated to occur within the same time period in order to minimize potential duplicate counting of homeless persons.
Volunteer and Worker Recruitment
An enumeration effort of this magnitude can only be successful with the assistance of those who possess an intimate knowledge of the activities and locations of homeless people. Therefore, the recruitment and training of homeless people to work as enumerators was an essential part of the street count methodology. Previous research has shown that homeless people, teamed with staff members from homeless service agencies, can be part of a productive and reliable work force.
44 U.S. Census Bureau. (2009). State and County Quick Facts.

Appendix I: Homeless Census and Survey Methodology 2011 Monterey & San Benito Counties Homeless Census and Survey
66 © Applied Survey Research, 2011
To work on the street count, prospective enumerators were required to attend a one-hour information and training session. Three training sessions were held at multiple locations throughout the county during the week prior to the street count. These sessions were attended primarily by homeless persons, staff from homeless service agencies, and staff from Monterey and San Benito Counties. The techniques and methods used to identify and enumerate unsheltered homeless persons were reviewed during these training sessions.
Homeless persons who completed the required training session were paid $10.00 on the morning they reported to work for the street count. Homeless workers were also paid $10.00 per hour for their work on the count, and were reimbursed for any expenses (mainly transportation costs) they incurred during the hours they worked.
Street Count Teams
On the mornings of the census, two-person teams were created to enumerate designated areas of the county for the street count. A team was ideally composed of one volunteer and one homeless person who had attended a training and information session. Given the expertise each team member brought to working in the field, the “volunteer/homeless worker” teamwork concept was especially beneficial for the street count.
Street count teams were provided with census tract maps of their assigned areas, census tally sheets, a review of the census training documents and techniques, and other supplies. Prior to deployment, volunteers and workers were provided with a reminder of how to enumerate thoroughly without disturbing homeless people or anyone else encountered during the street census. Over the course of the morning, all census tracts in Monterey County were enumerated. The approach to the pilot census in San Benito County was slightly different, focusing on counts by jurisdiction.
Safety Precautions
Every effort was made to minimize potentially hazardous situations. Precautions were taken to prepare a safe environment in all deployment centers. Law enforcement districts were notified of pending street count activity in their jurisdictions. No official reports were received in regards to unsafe or at-risk situations occurring during the street count in any area of the County.
Street Count Deployment
Since it was necessary to conduct the enumeration within a 24 hour period, Monterey County was divided into four targeted areas: North County, South County, and Mid-County which was divided into east and west. Targeted teams conducted the census counts in North and South County so that they would not have to travel to the centralized deployment centers. For the two counties, Monterey and San Benito, there were four central deployment locations based in Hollister, Salinas, San Juan Bautista, and Seaside.
The enumeration effort was conducted between the hours of 5:30 a.m. and 10:00 a.m. This early morning enumeration strategy was selected in order to avoid duplicate counting of sheltered homeless persons and to increase the visibility of the street homeless.
Volunteers and coalition staff used personal or agency vehicles to transport homeless workers and volunteers to and from assigned census tracts (although some homeless workers did provide their own
2011 Monterey & San Benito Counties Homeless Census and Survey Appendix I: Homeless Census and Survey Methodology
© Applied Survey Research, 2011 67
transportation). All accessible streets, roads, and highways in the enumerated tracts were traveled by foot, bike, or car. Homeless persons were counted and tallied on team tally sheets (see Appendix II).
Homeless enumerators were also instructed to include themselves on their tally sheets for the street count, if they were not going to be counted by a shelter or institutional census.
Upon their return, teams turned in their census tally forms and were debriefed by the deployment captains. Observational comments and the integrity of the enumeration effort were reviewed and assessed. This review was primarily done to check for double-counting (i.e., counting a family as both family members and individuals) and to verify that every accessible road within the assigned area was enumerated.
No direct contact with enumerated homeless people was made during the census enumeration. To avoid potential duplicate counting of unsheltered and sheltered homeless persons, it was imperative to enumerate during the narrow timeframe when sheltered and unsheltered homeless do not co-mingle. Administering the survey in conjunction with the census would have taken up too much of this narrow timeframe, thereby increasing the likelihood of duplication between the street and sheltered homeless counts, and jeopardizing the accuracy of the census. Thus, observation-only enumeration strategies were employed during the census, and the survey component of this project began after the census was completed.
Additionally, because unaccompanied youth do not usually co-mingle with the adult homeless population and tend to be difficult to enumerate, special youth enumeration teams consisting of homeless youth and homeless youth service providers were formed to enumerate unaccompanied homeless youth. These youth enumerators were deployed from the Safe Place Drop-In Center and were given a general geographical area in the county to enumerate rather than specific census tract maps. These teams counted between 2:00 p.m. and 6:00 p.m. when homeless youth are most likely to be visible on the streets. They enumerated unaccompanied homeless youth under age 18 and 18 to 24-year-old homeless adults who associate in the same social circles. The teams kept track of the locations where the homeless youth were sighted by recording the nearest intersection. Compared to the general street census results, the youth teams found considerably more unaccompanied homeless youth and in locations different from where unaccompanied youth were found in the morning effort. Therefore the research team felt there was little worry of duplication. The youth enumerated by these special teams were assigned census tract locations post-facto and were integrated into the overall countywide enumeration results.
Although any homeless enumeration is vulnerable to an undercount, all of the people, vehicles, encampments, and abandoned buildings tallied during the Point-in-Time street count were visually observed by enumerators. By reporting only what was observed, ASR and Monterey County are highly confident that the street count results are as accurate and as valid as possible. There are no means to ensure that those enumerated were actually members of the homeless population. However, when potential enumerators were polled during the training sessions, most trainees, especially homeless workers, indicated they would have no difficulty in telling the difference between an unsheltered homeless person and a member of the general public.
Appendix I: Homeless Census and Survey Methodology 2011 Monterey & San Benito Counties Homeless Census and Survey
68 © Applied Survey Research, 2011
Shelter and Institution Count Methodology
Goal
The goal of the shelter and institution (S&I) count was to gain an accurate count of the number of homeless persons who were being temporarily housed in shelters and other institutions across Monterey County. These data were vital to gaining an accurate overall count of the homeless population and understanding where homeless persons received shelter.
Data Collection
The basic approach was to identify and contact as many agencies as possible that temporarily house homeless people and request that those agencies send ASR a count of the number of homeless persons housed in their programs on the night of January 26, 2011. The support and participation of a broad range of agencies, both public and private, was needed to complete the shelter and institution count. These agencies included:
» Emergency Shelters
» Transitional Housing Programs
» Safe Havens
Supplementary data was collected from secondary sources to include in the report. Although this data does not meet HUD requirements, it provides a greater overall picture of the homeless population in Monterey County.
Homeless Census Challenges and Assumptions
Challenges
There are many challenges in any homeless enumeration, especially when implemented in a region as diverse and large as Monterey and San Benito Counties. While homeless populations are usually concentrated around city emergency shelters and homeless service facilities, homeless individuals and families can also be found in suburbs, commercial districts, and outlying county areas that are not easily accessible by enumerators. Homeless populations include numerous difficult-to-enumerate subsets such as:
Chronically homeless persons who may or may not access social, health, or shelter services,
Persons living in vehicles who relocate every few days,
Persons who have children and therefore stay “under the radar” for fear of having to turn their children over to Child Protective Services,
Homeless youth, who tend to keep themselves less visible than homeless adults,
Homeless people who live in isolated rural areas, and
Homeless people who sleep in unfit structures.

2011 Monterey & San Benito Counties Homeless Census and Survey Appendix I: Homeless Census and Survey Methodology
© Applied Survey Research, 2011 69
Census Undercount
For a variety of reasons, homeless persons generally do not want to be seen, and make concerted efforts to avoid detection. Regardless of how successful the outreach effort is, an undercount of the homeless population will result, especially of hard-to-reach subpopulations such as unaccompanied youth and families.
In a non-intrusive, Point-in-Time, visual homeless enumeration, the methods employed, while academically sound, have inherent biases and shortcomings. Even with the assistance of dedicated homeless service providers and currently or previously homeless census enumerators, the methodology cannot guarantee 100% accuracy. Many factors may contribute to missed opportunities, for example:
Homeless individuals often occupy abandoned buildings and other structures unfit for human habitation.
Homeless youth are suspected to keep a distance from the general homeless population, for their own safety.
Homeless families with children often seek opportunities to stay on private property, rather than sleep on the streets, in vehicles, or makeshift shelters.
It can be difficult to identify homeless persons who may be sleeping in vans, cars, or recreational vehicles.
By counting the minimum number of homeless persons on the streets at a given Point-in-Time, the homeless census methodology is conservative and therefore most likely results in an undercount of homeless persons with immigration issues, some of the working homeless, families, and street youth. This conservative approach is necessary to preserve the integrity of the data collected. Even though the census is most likely to be an undercount of the homeless population, the methodology employed, coupled with the homeless survey, is the most comprehensive approach available.
Assumptions of Annual Estimation
The calculations used to project an annual estimate of homelessness are based on two very important assumptions.
The information gathered by the homeless survey is indicative of responses that would have been given at any other time during the year and is representative of the general diversity of the study area’s homeless population.
The Point-in-Time census count is reasonably indicative of a count that would have been obtained at any other time during the year.
Service providers have supported these assumptions by indicating that the demand for services stayed relatively consistent over time. Additionally, the total number of homeless accessing services does not fluctuate to a great degree, although the proportion of sheltered versus unsheltered homeless does vary with the seasons.
Estimates of the number of people who experience homelessness in a given year are important for planning purposes and HUD reporting requirements. Because many homeless experiences are relatively

Appendix I: Homeless Census and Survey Methodology 2011 Monterey & San Benito Counties Homeless Census and Survey
70 © Applied Survey Research, 2011
short-term (i.e., less than a year), it is important to account for this phenomenon when determining the annual demand for homeless services.
Given the size of the survey sample (520 persons), the statistical reliability of the projections, the undercount inherent in any homeless census, as well as the use of a HUD-approved annualization calculation, the project committee and Applied Survey Research have determined that this methodology was the most complete and accurate of all available approaches.
Survey Methodology
Planning and Implementation
The survey of 520 homeless persons was conducted in Monterey County in order to yield qualitative data about the homeless community in Monterey County. A similar survey was conducted in San Benito County with a survey of 42 homeless persons. These data were used for the McKinney-Vento Continuum of Care Homeless Assistance funding application and are important for future program development and planning. The survey elicited information such as gender, family status, military service, length and recurrence of homelessness, usual nighttime accommodations, causes of homelessness, and access to services through open-ended, closed-ended, and multiple response questions. The survey data bring greater perspective to current issues of homelessness and to the provision and delivery of services. The survey findings also provide a measure of the changes in the composition of the homeless population since 2009.
Surveys were conducted by homeless workers and service provider volunteers who were trained by Applied Survey Research. Training sessions led potential interviewers through a comprehensive orientation that included project background information and detailed instruction on respondent eligibility, interviewing protocol, and confidentiality. Because of confidentiality and privacy issues, service providers typically conducted the surveys administered within shelters. No self-administered surveys were accepted in order to maintain a standardized and consistent protocol. Homeless workers were compensated at a rate of $5.00 per completed survey.
It was determined that survey data would be more easily collected if an incentive gift was offered to respondents in appreciation for their time and participation. A duffle bag was selected as an incentive to participate in the survey. The bags were thought to have wide appeal, and could be provided within the project budget. This approach enabled surveys to be conducted at anytime during the day. The gift proved to be a great incentive and was widely accepted among survey respondents.
Survey Sampling
In order to select a random sample of respondents, survey workers were trained to employ a randomized “every third encounter” survey approach. Survey workers were instructed to approach the third person

2011 Monterey & San Benito Counties Homeless Census and Survey Appendix I: Homeless Census and Survey Methodology
© Applied Survey Research, 2011 71
they encountered whom they considered to be an eligible survey respondent.45 If the person declined to take the survey, the survey worker could approach the next eligible person they encountered. After completing a survey, the randomized approach was resumed.
Strategic attempts were made to reach individuals in various geographic locations and of various subset groups such as homeless youth, minority ethnic groups, military veterans, domestic violence victims, and families, including recruiting survey workers from these subset groups. As part of the youth homeless enumeration effort, a team of fifteen homeless youth were trained to administer surveys to other homeless youth.
Trained homeless interviewers administered surveys to the “street” homeless. These workers were used as interviewers because they were familiar with the conditions, challenges, and likely locations of homeless persons, and they may therefore be more likely to obtain survey question responses from the homeless respondents. This peer-to-peer approach may also encourage more candid responses by lessening the suspicion or apprehension of the respondent and helping to build rapport between the survey worker and respondent. Interviewers were asked to inquire if the homeless person had already taken the survey, and if not, if they were willing to do so, knowing there was a “thank you” gift at the completion of the survey. Workers were also asked to remain unbiased at all times, make no assumptions or prompts, keep all responses anonymous and confidential, and ask all questions, but allow respondents to skip any question they did not feel comfortable answering.
Surveys were also administered in shelters and transitional housing programs. In order to assure the representation of transitional housing residents, who can be underrepresented in a street-based survey, survey quotas were created to reach individuals and heads of family households living in these programs. Eleven transitional housing facilities throughout Monterey and San Benito Counties, including family- and youth-focused programs, participated in the survey effort. Typically, program staff conducted those surveys. The same survey was used in both shelter and street environments.
Data Collection
Care was taken by interviewers to ensure that respondents felt comfortable regardless of the street or shelter location where the survey occurred. During the interviews, respondents were encouraged to be candid in their responses and were informed that these responses would be framed as general findings, would be kept confidential, and would not be traceable to any one individual.
Overall, the interviewers experienced excellent cooperation from respondents. This was likely influenced by the fact that nearly all of the street interviewers were homeless workers who had previously been, or were currently, fellow members of the homeless community. Another reason for interview cooperation may have been the incentive gift, which was given to respondents upon the completion of the interview.
45 The survey method of systematically interviewing every nth person encountered in a location is recommended by HUD in their publication, A Guide to Counting Unsheltered Homeless People, Second Revision, January 2008, p. 37.

Appendix I: Homeless Census and Survey Methodology 2011 Monterey & San Benito Counties Homeless Census and Survey
72 © Applied Survey Research, 2011
Data Analysis
In order to avoid potential duplication of respondents, the survey requested respondents’ initials and date of birth, so that duplication could be avoided without compromising the respondents’ anonymity. Upon completion of the survey effort, an extensive verification process was conducted to eliminate duplicates. This process examined respondents’ date of birth, initials, gender, ethnicity, and length of homelessness, and consistencies in patterns of responses to other questions on the survey.
Survey Administration Details
The 2011 Monterey and San Benito Counties Homeless Surveys were administered by the trained survey team between February 6, 2011 and March 24, 2011.
The sample of valid surveys totaled 520 in Monterey County and 42 in San Benito County.
Survey Challenges and Limitations
The 2011 Monterey County Survey did not include an equal representation of all homeless experiences. However, in Monterey County based on a Point-in-Time estimate of 2,507 homeless persons, the 520 valid surveys represent a confidence interval of +/- 1.67% with a 95% confidence level when generalizing the results of the survey to the estimated homeless population in Monterey County. These confidences can be applied to the survey findings because the survey was randomly administered. In San Benito County the population size and survey sample represent a confidence interval of +/-5.84% with a 95% confidence level, however the data does provide some picture of the county’s homeless population.
In self-reporting survey research, as was conducted by this survey, there is always some room for misrepresentation. Since there is no mechanism to separate truth from fiction in survey responses, it is important to make every effort to elicit the most truthful responses from interviewees. Using a peer interviewing methodology is believed to allow the respondents to be more candid with their answers, and may help reduce the uneasiness of revealing personal information. It should be noted that the responses provided for this survey are consistent based on reviews by service providers who:
Selected reliable interviewers who had completed a comprehensive training, and
Reviewed the surveys and ensured quality responses.
Surveys that were considered incomplete or containing false responses were not accepted, and the interviewer was not compensated.

2011 Monterey & San Benito Counties Homeless Census and Survey Appendix II: Census Instruments
© Applied Survey Research, 2011 73
APPENDIX II: CENSUS INSTRUMENTS

Appendix II: Census Instruments 2011 Monterey and San Benito Counties Homeless Census and Survey
74 © Applied Survey Research, 2011

2011 Monterey & San Benito Counties Homeless Census and Survey Appendix II: Census Instruments
© Applied Survey Research, 2011 75
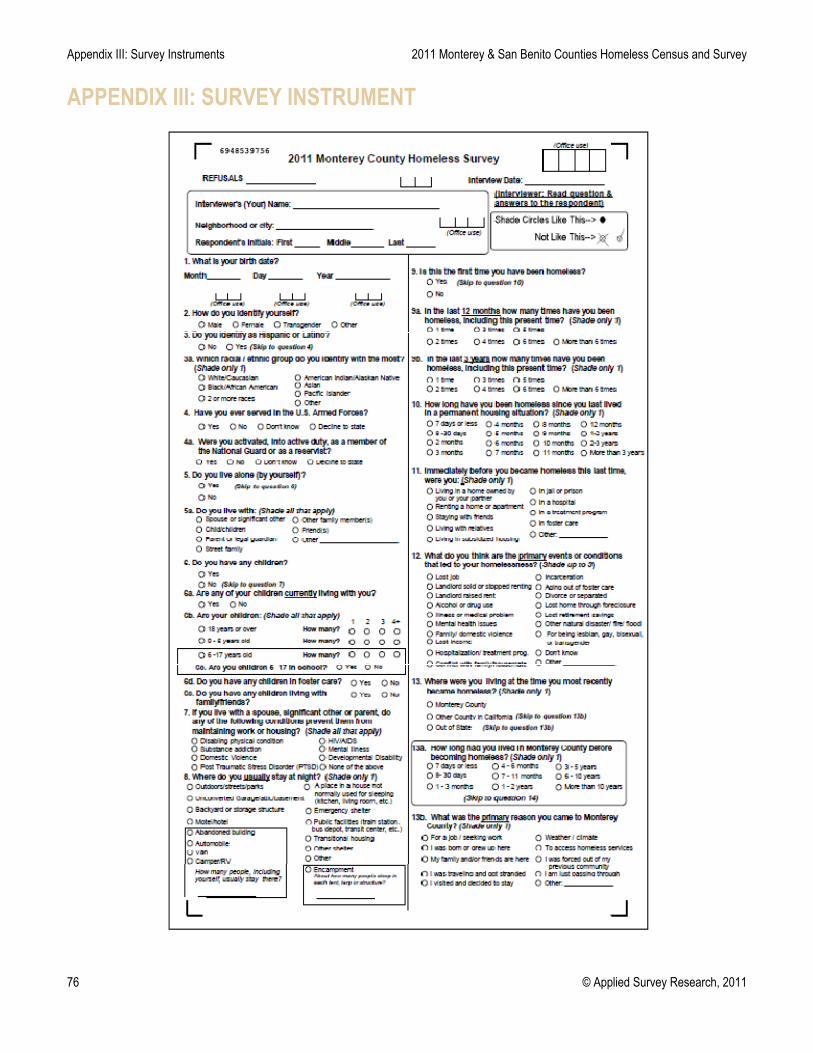
Appendix III: Survey Instruments 2011 Monterey & San Benito Counties Homeless Census and Survey
76 © Applied Survey Research, 2011
APPENDIX III: SURVEY INSTRUMENT

2011 Monterey & San Benito Counties Homeless Census and Survey Appendix III: Survey Instruments
© Applied Survey Research, 2011 77

Appendix III: Survey Instruments 2011 Monterey and San Benito Counties Homeless Census and Survey
78 © Applied Survey Research, 2011

2011 Monterey & San Benito Counties Homeless Census and Survey Appendix III: Survey Instruments
© Applied Survey Research, 2011 79
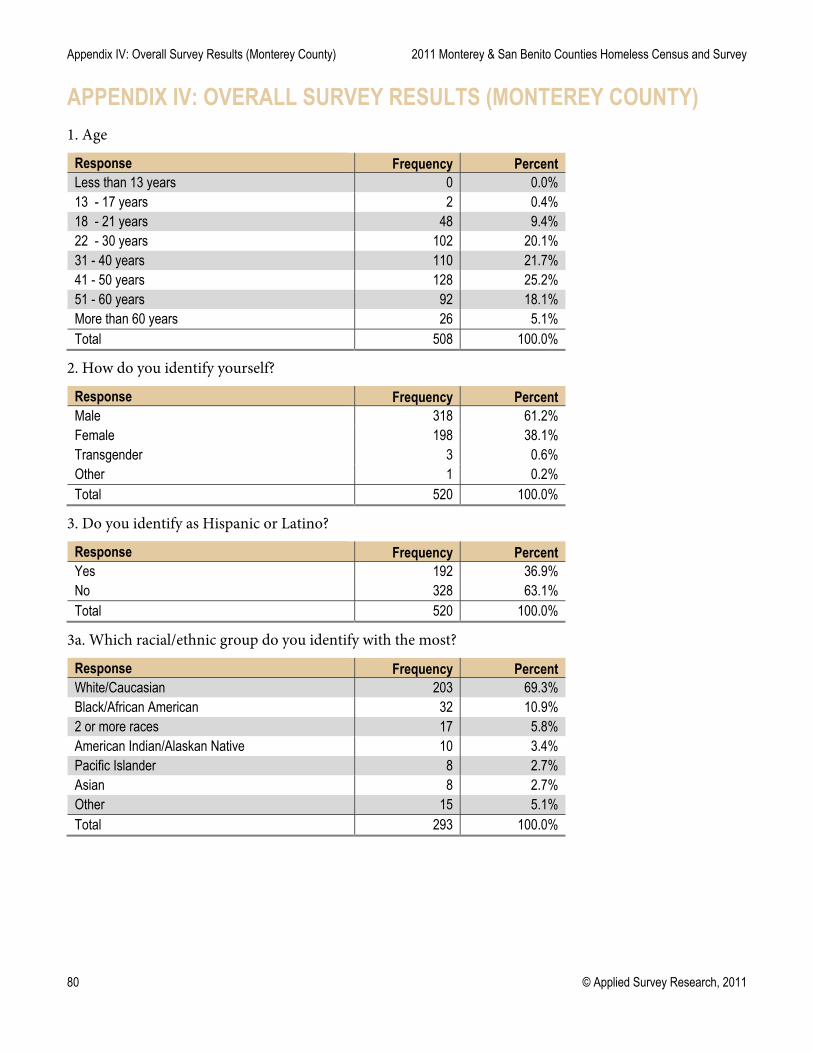
Appendix IV: Overall Survey Results (Monterey County) 2011 Monterey & San Benito Counties Homeless Census and Survey
80 © Applied Survey Research, 2011
APPENDIX IV: OVERALL SURVEY RESULTS (MONTEREY COUNTY)
1. Age
Response Frequency Percent Less than 13 years 0 0.0% 13 - 17 years 2 0.4% 18 - 21 years 48 9.4% 22 - 30 years 102 20.1% 31 - 40 years 110 21.7% 41 - 50 years 128 25.2% 51 - 60 years 92 18.1% More than 60 years 26 5.1% Total 508 100.0%
2. How do you identify yourself?
Response Frequency Percent Male 318 61.2% Female 198 38.1% Transgender 3 0.6% Other 1 0.2% Total 520 100.0%
3. Do you identify as Hispanic or Latino?
Response Frequency Percent Yes 192 36.9% No 328 63.1% Total 520 100.0%
3a. Which racial/ethnic group do you identify with the most?
Response Frequency Percent White/Caucasian 203 69.3% Black/African American 32 10.9% 2 or more races 17 5.8% American Indian/Alaskan Native 10 3.4% Pacific Islander 8 2.7% Asian 8 2.7% Other 15 5.1% Total 293 100.0%

2011 Monterey & San Benito Counties Homeless Census and Survey Appendix IV: Overall Survey Results (Monterey County)
© Applied Survey Research, 2011 81
4. Have you ever served in the U. S. Armed Forces? (Respondents ages 18 and older)
Response Frequency Percent Yes 68 13.2% No 440 85.4% Don’t know 1 0.2% Decline to state 6 1.2% Total 515 100.0%
4a. Were you activated, into active duty, as a member of the National Guard or as a Reservist
Response Frequency Percent Yes 13 2.5%
No 463 89.9%
Don’t know 1 0.2%
Decline to state 38 7.4%
Total 515 100.0% Multiple response question with 50 respondents offering 50 responses.
5. Do you live alone (by yourself)?
Response Frequency Percent Yes 329 63.3% No 191 36.7% Total 520 100.0%
5a. Do you live with:
Response Frequency Percent Spouse or partner 74 40.0% Child/children 63 34.1% Friend(s) 30 16.2% Street family 30 16.2% Parent or legal guardian 6 3.2% Other family members 6 3.2%
Multiple response question with 185 respondents offering 209 responses.
6. Do you have any children
Response Frequency Percent Yes 258 49.6% No 262 50.4% Total 520 100.0%
6a. Are any of your children currently living with you?
Response Frequency Percent Yes 65 25.9% No 186 74.1% Total 251 100.0%
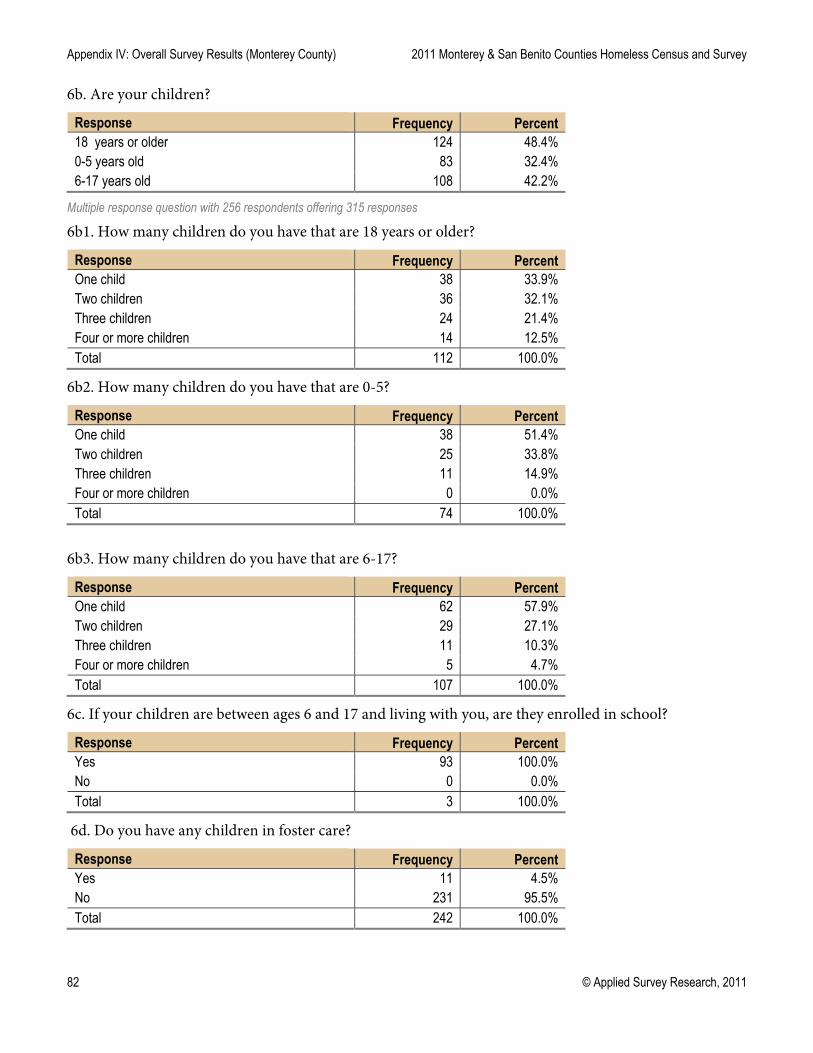
Appendix IV: Overall Survey Results (Monterey County) 2011 Monterey & San Benito Counties Homeless Census and Survey
82 © Applied Survey Research, 2011
6b. Are your children?
Response Frequency Percent 18 years or older 124 48.4% 0-5 years old 83 32.4% 6-17 years old 108 42.2%
Multiple response question with 256 respondents offering 315 responses 6b1. How many children do you have that are 18 years or older?
Response Frequency Percent One child 38 33.9% Two children 36 32.1% Three children 24 21.4% Four or more children 14 12.5% Total 112 100.0%
6b2. How many children do you have that are 0-5?
Response Frequency Percent One child 38 51.4% Two children 25 33.8% Three children 11 14.9% Four or more children 0 0.0% Total 74 100.0%
6b3. How many children do you have that are 6-17?
Response Frequency Percent One child 62 57.9% Two children 29 27.1% Three children 11 10.3% Four or more children 5 4.7% Total 107 100.0%
6c. If your children are between ages 6 and 17 and living with you, are they enrolled in school?
Response Frequency Percent Yes 93 100.0% No 0 0.0% Total 3 100.0%
6d. Do you have any children in foster care?
Response Frequency Percent Yes 11 4.5% No 231 95.5% Total 242 100.0%

2011 Monterey & San Benito Counties Homeless Census and Survey Appendix IV: Overall Survey Results (Monterey County)
© Applied Survey Research, 2011 83
6e. Do you have any children living with family/friends?
Response Frequency Percent Yes 88 36.4% No 154 63.6% Total 242 100.0%
7. If you live with a spouse, significant other or parent, do any of the following conditions prevent them from maintaining work or housing.
Response Frequency Percent
Mental illness 8 11.3%
Disabling physical condition 6 8.5%
Substance addiction 4 5.6%
Developmental disability 2 2.8%
Domestic violence 1 1.4%
HIV/AIDS 1 1.4%
Post-Traumatic Stress Disorder (PTSD) 0 0.0%
None of the above 52 73.2% Multiple response question with 71 respondents offering 74 responses.
8. Where do you usually stay at night?
Response Frequency Percent
Outdoors/streets/parks 129 25.2% Emergency shelter 87 17.0% Automobile 21 4.1% A place in a house not normally used for sleeping (kitchen, living room, etc.) 18 3.5%
Transitional housing 69 13.5% Other shelter 10 2.0% Motel/hotel 38 7.4% Camper/RV 22 4.3% Encampment 26 5.1% Van 30 5.9% Public Facilities (train station, bus depot) 4 0.8% Unconverted garage/attic/basement 13 2.5% Abandoned building 10 2.0% Backyard or storage structure 20 3.9% Other 15 2.9% Total 512 100.0%

Appendix IV: Overall Survey Results (Monterey County) 2011 Monterey & San Benito Counties Homeless Census and Survey
84 © Applied Survey Research, 2011
9. Is this the first time you have been homeless?
Response Frequency Percent Yes 224 43.1% No 296 56.9% Total 520 100.0%
9a. In the last 12 months how many times have you been homeless, including this present time?
Response Frequency Percent One time 346 67.2% 2 times 72 14.0% 3 times 29 5.6% 4 times 13 2.5% 5 times 10 1.9% 6 times 5 1.0% More than 6 times 40 7.8% Total 515 100.0%
9b. In the last 3 years how many times have you been homeless, including this present time?
Response Frequency Percent One time 287 55.7% 2 times 73 14.2% 3 times 43 8.3% 4 times 23 4.5% 5 times 14 2.7% 6 times 10 1.9% More than 6 times 65 12.6% Total 515 100.0%

2011 Monterey & San Benito Counties Homeless Census and Survey Appendix IV: Overall Survey Results (Monterey County)
© Applied Survey Research, 2011 85
10. How long have you been homeless since you last lived in a permanent housing situation?
Response Frequency Percent 7 days or less 13 2.6% 8 -30 days 15 3.0% 2 months 30 5.9% 3 months 17 3.4% 4 months 24 4.7% 5 months 13 2.6% 6 months 24 4.7% 7 months 23 4.5% 8 months 7 1.4% 9 months 5 1.0% 10 months 19 3.8% 11 months 16 3.2% 12 months 32 6.3% 1-2 years 64 12.6% 2-3 years 43 8.5% More than 3 years 161 31.8% Total 506 100.0%
11. Immediately before you became homeless this last time, were you living:
Response Frequency Percent In a rented home/apartment 203 39.5% With relatives 112 21.8% With friends 76 14.8% In a home owned by you/partner 33 6.4% In a treatment facility 13 2.5% In jail or prison 36 7.0% In subsidized housing 12 2.3% In a hospital 2 0.4% Foster care 1 0.2% Other 26 5.1% Total 514 100.0%
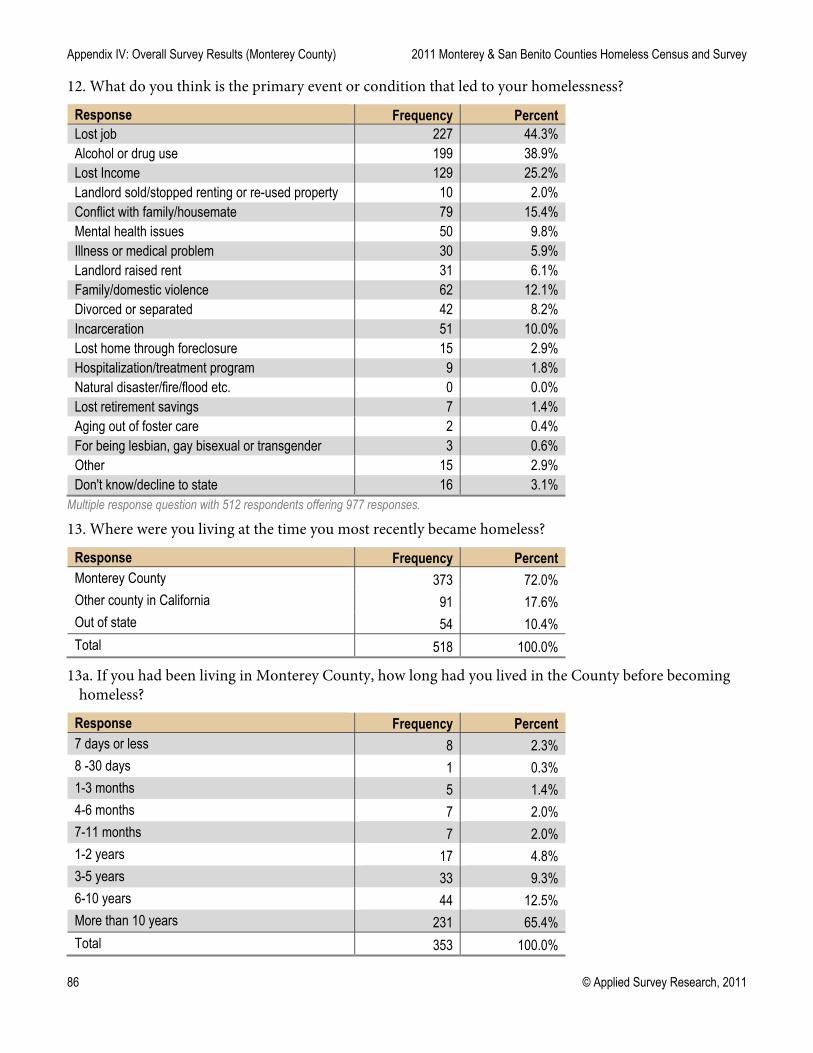
Appendix IV: Overall Survey Results (Monterey County) 2011 Monterey & San Benito Counties Homeless Census and Survey
86 © Applied Survey Research, 2011
12. What do you think is the primary event or condition that led to your homelessness?
Response Frequency Percent Lost job 227 44.3% Alcohol or drug use 199 38.9% Lost Income 129 25.2% Landlord sold/stopped renting or re-used property 10 2.0% Conflict with family/housemate 79 15.4% Mental health issues 50 9.8% Illness or medical problem 30 5.9% Landlord raised rent 31 6.1% Family/domestic violence 62 12.1% Divorced or separated 42 8.2% Incarceration 51 10.0% Lost home through foreclosure 15 2.9% Hospitalization/treatment program 9 1.8% Natural disaster/fire/flood etc. 0 0.0% Lost retirement savings 7 1.4% Aging out of foster care 2 0.4% For being lesbian, gay bisexual or transgender 3 0.6% Other 15 2.9% Don't know/decline to state 16 3.1%
Multiple response question with 512 respondents offering 977 responses.
13. Where were you living at the time you most recently became homeless?
Response Frequency Percent Monterey County 373 72.0% Other county in California 91 17.6% Out of state 54 10.4% Total 518 100.0%
13a. If you had been living in Monterey County, how long had you lived in the County before becoming homeless?
Response Frequency Percent 7 days or less 8 2.3% 8 -30 days 1 0.3% 1-3 months 5 1.4% 4-6 months 7 2.0% 7-11 months 7 2.0% 1-2 years 17 4.8% 3-5 years 33 9.3% 6-10 years 44 12.5% More than 10 years 231 65.4% Total 353 100.0%
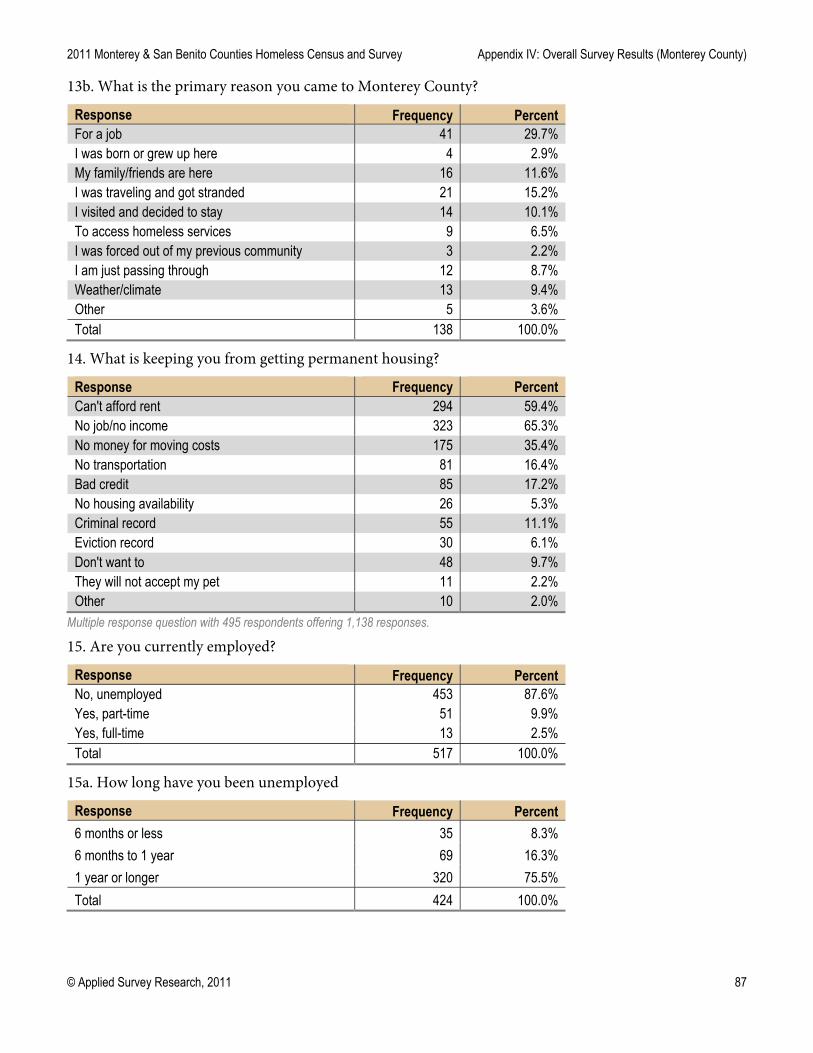
2011 Monterey & San Benito Counties Homeless Census and Survey Appendix IV: Overall Survey Results (Monterey County)
© Applied Survey Research, 2011 87
13b. What is the primary reason you came to Monterey County?
Response Frequency Percent For a job 41 29.7% I was born or grew up here 4 2.9% My family/friends are here 16 11.6% I was traveling and got stranded 21 15.2% I visited and decided to stay 14 10.1% To access homeless services 9 6.5% I was forced out of my previous community 3 2.2% I am just passing through 12 8.7% Weather/climate 13 9.4% Other 5 3.6% Total 138 100.0%
14. What is keeping you from getting permanent housing?
Response Frequency Percent Can't afford rent 294 59.4% No job/no income 323 65.3% No money for moving costs 175 35.4% No transportation 81 16.4% Bad credit 85 17.2% No housing availability 26 5.3% Criminal record 55 11.1% Eviction record 30 6.1% Don't want to 48 9.7% They will not accept my pet 11 2.2% Other 10 2.0%
Multiple response question with 495 respondents offering 1,138 responses.
15. Are you currently employed?
Response Frequency Percent No, unemployed 453 87.6% Yes, part-time 51 9.9% Yes, full-time 13 2.5% Total 517 100.0%
15a. How long have you been unemployed
Response Frequency Percent
6 months or less 35 8.3%
6 months to 1 year 69 16.3%
1 year or longer 320 75.5%
Total 424 100.0%

Appendix IV: Overall Survey Results (Monterey County) 2011 Monterey & San Benito Counties Homeless Census and Survey
88 © Applied Survey Research, 2011
15b. What is keeping you from getting employment?
Response Frequency Percent
No jobs 155 34.7%
Alcohol/drug issue 122 27.3%
No phone 120 26.8%
No transportation 120 26.8%
Need training 116 26.0%
Need clothing 110 24.6%
No permanent address 105 23.5%
Need education 101 22.6%
No shower facilities 90 20.1%
Criminal record 63 14.1%
No tools for trade 57 12.8%
Health problems 51 11.4%
No photo identification 50 11.2%
Don't want to work 44 9.8%
Disabled 40 8.9%
Mental health issues 38 8.5%
No child care 17 3.8%
No work permit (No S.S. #) 7 1.6%
Retired 7 1.6%
Spouse/partner doesn't want me to work 4 0.9%
Other 13 2.9% Multiple response question with 447 respondents offering 1,430 responses.
16. What are your other sources of income
Response Frequency Percent
Recycling 176 40.3%
Panhandling/asking for money on the street 141 32.3%
Family/friends 105 24.0%
Selling other found items 84 19.2%
Sex work 33 7.6%
Child support 16 3.7%
Pension 10 2.3%
Selling blood/plasma 9 2.1%
Other 102 23.3% Multiple response question with 437 respondents offering 676 responses.

2011 Monterey & San Benito Counties Homeless Census and Survey Appendix IV: Overall Survey Results (Monterey County)
© Applied Survey Research, 2011 89
17. Are you currently using any of the following services/assistance?
Response Frequency Percent Free meals 239 46.6% Food pantry 129 25.1% Emergency shelter 118 23.0% Transitional housing 84 16.4% Shelter day services 60 11.7% Health services 36 7.0% Bus passes 71 13.8% Mental health services 44 8.6% Alcohol/drug counseling 31 6.0% Job training 11 2.1% Legal assistance 5 1.0% Other 3 0.6% Not using any services 134 26.1%
Multiple response question with 513 respondents offering 965 responses.
18. Are you currently receiving any of the following forms of government assistance?
Response Frequency Percent Food Stamps 252 49.5% Medi-Cal /Medicare 65 12.8% SSI (Supplemental Security Income)/SSDI (Social Security Disability Insurance) 28 5.5%
General assistance 46 9.0% Cash Aid/CalWORKS 51 10.0% WIC 16 3.1% VA disability compensation 3 0.6% Social Security 9 1.8% Veteran's benefits 15 2.9% Other governmental assistance 24 4.7% I am not currently receiving any of these 204 40.1%
Multiple response question with 509 respondents offering 713 responses.
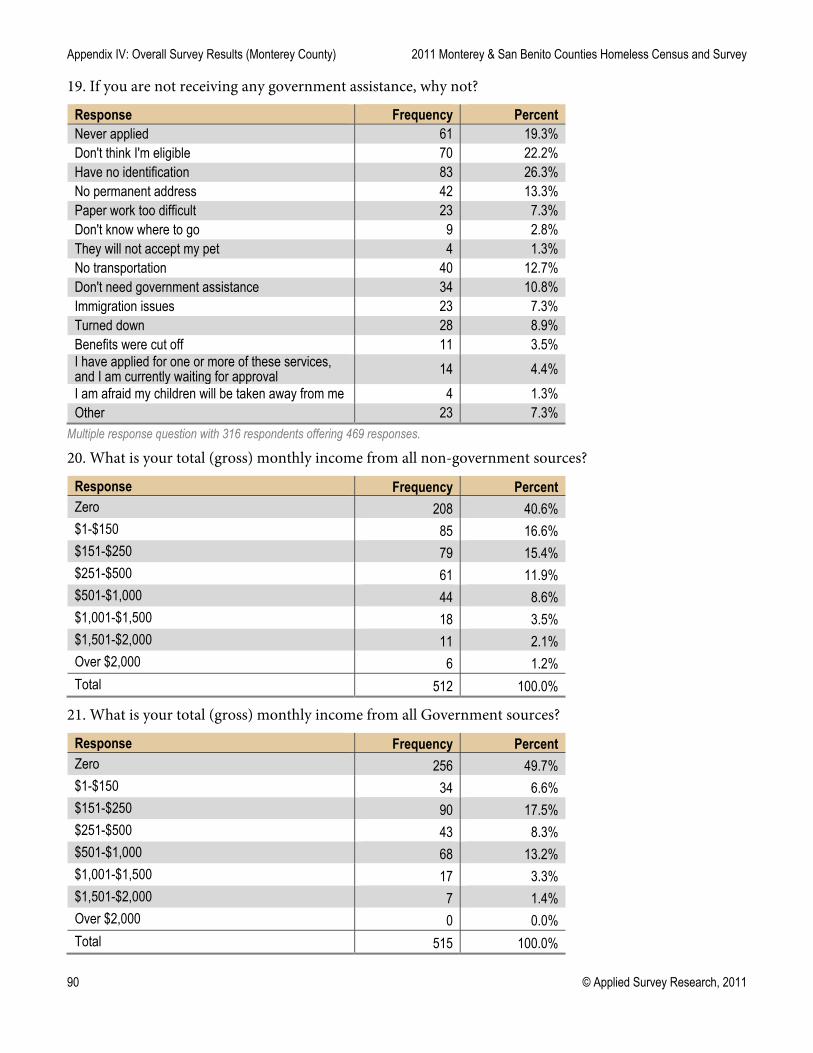
Appendix IV: Overall Survey Results (Monterey County) 2011 Monterey & San Benito Counties Homeless Census and Survey
90 © Applied Survey Research, 2011
19. If you are not receiving any government assistance, why not?
Response Frequency Percent Never applied 61 19.3% Don't think I'm eligible 70 22.2% Have no identification 83 26.3% No permanent address 42 13.3% Paper work too difficult 23 7.3% Don't know where to go 9 2.8% They will not accept my pet 4 1.3% No transportation 40 12.7% Don't need government assistance 34 10.8% Immigration issues 23 7.3% Turned down 28 8.9% Benefits were cut off 11 3.5% I have applied for one or more of these services, and I am currently waiting for approval 14 4.4%
I am afraid my children will be taken away from me 4 1.3% Other 23 7.3%
Multiple response question with 316 respondents offering 469 responses. 20. What is your total (gross) monthly income from all non-government sources?
Response Frequency Percent Zero 208 40.6% $1-$150 85 16.6% $151-$250 79 15.4% $251-$500 61 11.9% $501-$1,000 44 8.6% $1,001-$1,500 18 3.5% $1,501-$2,000 11 2.1% Over $2,000 6 1.2% Total 512 100.0%
21. What is your total (gross) monthly income from all Government sources?
Response Frequency Percent Zero 256 49.7% $1-$150 34 6.6% $151-$250 90 17.5% $251-$500 43 8.3% $501-$1,000 68 13.2% $1,001-$1,500 17 3.3% $1,501-$2,000 7 1.4% Over $2,000 0 0.0% Total 515 100.0%

2011 Monterey & San Benito Counties Homeless Census and Survey Appendix IV: Overall Survey Results (Monterey County)
© Applied Survey Research, 2011 91
22. Do you have a pet?
Response Frequency Percent Yes 72 13.8% No 448 86.2% Total 520 100.0%
22a. Do they prevent you from receiving housing?
Response Frequency Percent Yes 22 31.4% No 48 68.6% Total 70 100.0%
23. Do you have a working cell phone?
Response Frequency Percent Yes 241 49.1% No 250 50.9% Total 491 100.0%
24. How often do you use the internet?
Response Frequency Percent
At least once a week 159 31.4%
At least once a month 47 9.3%
Sometimes 134 26.4%
Never 167 32.9%
Total 507 100.0%
25. Since becoming homeless have you needed medical care and been unable to receive it?
Response Frequency Percent Yes 134 26.3% No 375 73.7% Total 509 100.0%
26. Do you currently need any of these services?
Response Frequency Percent
Dental Care 306 77.7%
Medical Care 261 66.2%
Eye Care 170 43.1%
Mental Health Services 59 15.0%
Substance Abuse Treatment 50 12.7% Multiple response question with 394 respondents offering 846 responses.

Appendix IV: Overall Survey Results (Monterey County) 2011 Monterey & San Benito Counties Homeless Census and Survey
92 © Applied Survey Research, 2011
27. How many times in the last 12 months have you used the emergency room for any treatment?
Response Frequency Percent Never 282 56.4% 1 time 110 22.0% 2 times 51 10.2% 3 times 23 4.6% 4 times 8 1.6% 5 times 15 3.0% More than 5 times 11 2.2% Total 500 100.0%
28. Do you or have you received mental health services or medication for your mental health in the past 12 months?
Response Frequency Percent
Yes 104 20.0%
No 416 80.0%
Total 520 100.0%
28a. Do you have trouble accessing those services
Response Frequency Percent
Yes 30 30.3%
No 69 69.7%
Total 99 100.0%
28b. Have you been hospitalized for emotional problems in the past 12 months?
Response Frequency Percent Yes 33 33.0% No 67 67.0% Total 100 100.0%
29. Were you ever in foster care?
Response Frequency Percent Yes 49 10.0% No 442 90.0% Total 491 100.0%

2011 Monterey & San Benito Counties Homeless Census and Survey Appendix IV: Overall Survey Results (Monterey County)
© Applied Survey Research, 2011 93
30. Are you currently experiencing any of the following?
Response Frequency Percent 30a. Physical Disability 104 20.9% 30b. Mental Illness 98 20.0% 30c. Depression 194 39.5% 30d. Alcohol/Drug Abuse 184 37.5% 30e. Domestic/Partner Violence 26 5.3% 30f. Chronic Health Problems 66 13.4% 30g. AIDS/HIV related illness 6 1.2% 30h. Tuberculosis 12 2.4% 30i. Hepatitis C 32 6.5% 30j. PTSD 40 8.2% 30k. Developmental Disability 14 2.8%
31. How many nights, if any, have you spent in jail or prison during the last 12 months?
Response Frequency Percent 0 nights 329 64.8% 1-5 nights 95 18.7% 6-10 nights 15 3.0% 11-20 nights 22 4.3% 21-50 nights 26 5.1% More than 50 21 4.1% Total 508 100.0%
32. Are you currently on probation or parole?
Response Frequency Percent Yes 114 22.3% No 397 77.7% Total 511 100.0%
33. Were you on probation or parole at the time you most recently became homeless?
Response Frequency Percent Yes 106 20.7% No 405 79.3% Total 511 100.0%

Appendix IV: Overall Survey Results (Monterey County) 2011 Monterey & San Benito Counties Homeless Census and Survey
94 © Applied Survey Research, 2011
34. How many tickets have you received for parking violations, loitering, trespassing or camping in the past 12 months?
Response Frequency Percent Never 371 73.3% 1 Ticket 64 12.6% 2 Tickets 30 5.9% 3 Tickets 13 2.6% 4 Tickets 7 1.4% 5 Tickets 6 1.2% More than 5 Tickets 15 3.0% Total 506 100.0%

2011 Monterey & San Benito Counties Homeless Census and Survey Appendix V: Overall Survey Results (San Benito County)
© Applied Survey Research, 2011 95
APPENDIX V: OVERALL SURVEY RESULTS (SAN BENITO COUNTY)
1. Age
Response Frequency Percent
Less than 13 years 0 0.0%
13-17 years 0 0.0%
18-21 years 6 15.4%
22-30 years 10 25.6%
31-40 years 12 30.8%
41-50 years 7 17.9%
51-60 years 4 10.3%
More than 60 years 0 0.0%
Total 39 100.0%
2. How do you identify yourself?
Response Frequency Percent
Male 24 57.1%
Female 18 42.9%
Transgender 0 0.0%
Other 0 0.0%
Total 42 100.0%
3. Do you identify as Hispanic or Latino?
Response Frequency Percent
Yes 23 59.0%
No 16 41.0%
Total 39 100.0%
3a. Which racial/ethnic group do you identify with the most?
Response Frequency Percent
White/Caucasian 10 66.7%
Black/African American 1 6.7%
2 or more races 3 20.0%
American Indian/Alaskan Native 0 0.0%
Asian 0 0.0%
Pacific Islander 0 0.0%
Other 1 6.7%
Total 15 100.0%

Appendix V: Overall Survey Results (San Benito County) 2011 Monterey & San Benito Counties Homeless Census and Survey
96 © Applied Survey Research, 2011
4. Have you ever served in the U.S. Armed Forces?
Response Frequency Percent
Yes 2 4.9%
No 38 92.7%
Don't know 1 2.4%
Decline to state 0 0.0%
Total 41 100.0%
4a. Were you activated, into active duty, as a member of the National Guard or as a reservist?
Response Frequency Percent
Yes 0 0.0%
No 37 94.9%
Don't know 2 5.1%
Decline to state 0 0.0%
Total 39 100.0%
5. Do you live alone (by yourself)?
Response Frequency Percent
Yes 16 38.1%
No 26 61.9%
Total 42 100.0%
5a. Do you live with:
Response Frequency Percent
Spouse or significant other 16 64.0%
Child/children 14 56.0%
Street family 4 16.0%
Parent or legal guardian 3 12.0%
Other family member(s) 2 8.0%
Friend(s) 1 4.0%
Other 0 0.0% Multiple response question with 25 respondents offering 40 responses.
6. Do you have any children?
Response Frequency Percent
Yes 31 73.8%
No 11 26.2%
Total 42 100.0%

2011 Monterey & San Benito Counties Homeless Census and Survey Appendix V: Overall Survey Results (San Benito County)
© Applied Survey Research, 2011 97
6a. Are any of your children currently living with you?
Response Frequency Percent
Yes 15 51.7%
No 14 48.3%
Total 29 100.0%
6b. Are your children:
Response Frequency Percent
18 years or older 10 32.3%
0-5 years old 20 64.5%
6-17 years old 13 41.9% Multiple response question with 31 respondents offering 43 responses.
6b1. How many children do you have that are 18 years or older?
Response Frequency Percent
One child 4 57.1%
Two children 3 42.9%
Three children 0 0.0%
Four or more children 0 0.0%
Total 7 100.0%
6b2. How many children do you have that are 0-5 years old?
Response Frequency Percent
One child 3 17.6%
Two children 10 58.8%
Three children 3 17.6%
Four or more children 1 5.9%
Total 17 100.0%
6b3. How many children do you have that are 6-17 years old?
Response Frequency Percent
One child 7 58.3%
Two children 4 33.3%
Three children 0 0.0%
Four or more children 1 8.3%
Total 12 100.0%

Appendix V: Overall Survey Results (San Benito County) 2011 Monterey & San Benito Counties Homeless Census and Survey
98 © Applied Survey Research, 2011
6c. Are you children aged 6 -17 years old in school?
Response Frequency Percent
Yes 12 100.0%
No 0 0.0%
Total 12 100.0%
6d. Do you have any children in foster care?
Response Frequency Percent
Yes 0 0.0%
No 31 100.0%
Total 31 100.0%
6e. Do you have any children living with family/friends?
Response Frequency Percent
Yes 8 25.8%
No 23 74.2%
Total 31 100.0%
7. If you live with a spouse, significant other or parent, do any of the following conditions prevent them from maintaining work or housing?
Response Frequency Percent
Disabling physical condition 1 5.6%
Substance addiction 1 5.6%
Post Traumatic Stress Disorder (PTSD) 1 5.6%
Mental illness 1 5.6%
Developmental disability 1 5.6%
Domestic violence 0 0.0%
HIV/AIDS 0 0.0%
None of the above 15 83.3% Multiple response question with 18 respondents offering 20 responses.

2011 Monterey & San Benito Counties Homeless Census and Survey Appendix V: Overall Survey Results (San Benito County)
© Applied Survey Research, 2011 99
8. Where do you usually stay at night?
Response Frequency Percent
Emergency shelter 23 57.5%
Other shelter 6 15.0%
Transitional housing 3 7.5%
Automobile 2 5.0%
A place in a house not normally used for sleeping 2 5.0%
Outdoors/streets/parks 1 2.5%
Encampment 1 2.5%
Unconverted garage/attic/basement 0 0.0%
Backyard or storage structure 0 0.0%
Abandoned building 0 0.0%
Motel/hotel 0 0.0%
Public facilities 0 0.0%
Van 0 0.0%
Camper/RV 0 0.0%
Other 2 5.0%
Total 40 100.0%
9. Is this the first time you have been homeless?
Response Frequency Percent
Yes 24 57.1%
No 18 42.9%
Total 42 100.0%
9a. In the last 12 months how many times have you been homeless, including this present time?
Response Frequency Percent
1 time 28 66.7%
2 times 10 23.8%
3 times 2 4.8%
4 times 0 0.0%
5 times 0 0.0%
6 times 0 0.0%
More than 6 times 2 4.8%
Total 42 100.0%

Appendix V: Overall Survey Results (San Benito County) 2011 Monterey & San Benito Counties Homeless Census and Survey
100 © Applied Survey Research, 2011
9b. In the last 3 years how many times have you been homeless, including this present time?
Response Frequency Percent
1 time 25 59.5%
2 times 8 19.0%
3 times 3 7.1%
4 times 2 4.8%
5 times 0 0.0%
6 times 1 2.4%
More than 6 times 3 7.1%
Total 42 100.0%
10. How long have you been homeless since you last lived in a permanent housing situation?
Response Frequency Percent
7 days or less 4 9.5%
8 -30 days 4 9.5%
2 months 4 9.5%
3 months 6 14.3%
4 months 6 14.3%
5 months 2 4.8%
6 months 0 0.0%
7 months 3 7.1%
8 months 0 0.0%
9 months 0 0.0%
10 months 2 4.8%
11 months 0 0.0%
12 months 1 2.4%
1-2 years 5 11.9%
2-3 years 2 4.8%
More than 3 years 3 7.1%
Total 42 100.0%
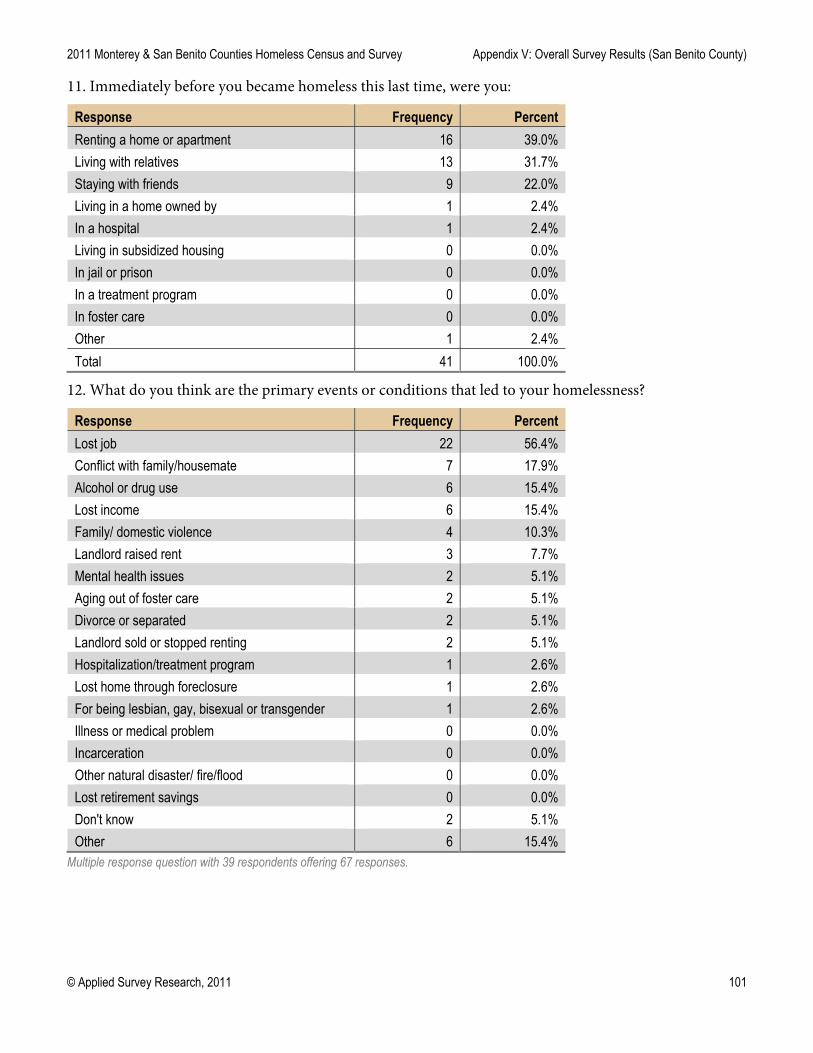
2011 Monterey & San Benito Counties Homeless Census and Survey Appendix V: Overall Survey Results (San Benito County)
© Applied Survey Research, 2011 101
11. Immediately before you became homeless this last time, were you:
Response Frequency Percent
Renting a home or apartment 16 39.0%
Living with relatives 13 31.7%
Staying with friends 9 22.0%
Living in a home owned by 1 2.4%
In a hospital 1 2.4%
Living in subsidized housing 0 0.0%
In jail or prison 0 0.0%
In a treatment program 0 0.0%
In foster care 0 0.0%
Other 1 2.4%
Total 41 100.0%
12. What do you think are the primary events or conditions that led to your homelessness?
Response Frequency Percent
Lost job 22 56.4%
Conflict with family/housemate 7 17.9%
Alcohol or drug use 6 15.4%
Lost income 6 15.4%
Family/ domestic violence 4 10.3%
Landlord raised rent 3 7.7%
Mental health issues 2 5.1%
Aging out of foster care 2 5.1%
Divorce or separated 2 5.1%
Landlord sold or stopped renting 2 5.1%
Hospitalization/treatment program 1 2.6%
Lost home through foreclosure 1 2.6%
For being lesbian, gay, bisexual or transgender 1 2.6%
Illness or medical problem 0 0.0%
Incarceration 0 0.0%
Other natural disaster/ fire/flood 0 0.0%
Lost retirement savings 0 0.0%
Don't know 2 5.1%
Other 6 15.4% Multiple response question with 39 respondents offering 67 responses.

Appendix V: Overall Survey Results (San Benito County) 2011 Monterey & San Benito Counties Homeless Census and Survey
102 © Applied Survey Research, 2011
13. Where were you living at the time you most recently became homeless?
Response Frequency Percent
San Benito County 33 78.6%
Other county in California 7 16.7%
Out of State 2 4.8%
Total 42 100.0%
13a. How long had you lived in San Benito County before becoming homeless?
Response Frequency Percent
7 days or less 1 3.0%
8- 30 days 0 0.0%
1 - 3 months 2 6.1%
4 - 6 months 2 6.1%
7 - 11 months 0 0.0%
1 - 2 years 9 27.3%
3 - 5 years 7 21.2%
6 - 10 years 1 3.0%
More than 10 years 11 33.3%
Total 33 100.0%
13b. What was the primary reason you came to San Benito County?
Response Frequency Percent
For a job/seeking work 3 42.9%
My family and/or friends are here 2 28.6%
I was born or grew up here 1 14.3%
To access homeless services 1 14.3%
I was traveling and got stranded 0 0.0%
I visited and decided to stay 0 0.0%
I was forced out of my previous community 0 0.0%
I am just passing through 0 0.0%
Weather/climate 0 0.0%
Other 0 0.0%
Total 7 100.0%

2011 Monterey & San Benito Counties Homeless Census and Survey Appendix V: Overall Survey Results (San Benito County)
© Applied Survey Research, 2011 103
14. What is keeping you from getting permanent housing?
Response Frequency Percent
No job/no income 29 72.5%
Can't afford rent 21 52.5%
No money for moving costs 18 45.0%
No housing availability 8 20.0%
Bad credit 6 15.0%
No transportation 3 7.5%
Criminal record 2 5.0%
They will not accept my pet 1 2.5%
Eviction record 0 0.0%
Don't want to 0 0.0%
Other 2 5.0% Multiple response question with 40 respondents offering 90 responses.
15. Are you currently employed?
Response Frequency Percent
No, unemployed 33 82.5%
Yes, part time 5 12.5%
Yes, full time 2 5.0%
Total 40 100.0%
15a. How long have you been unemployed?
Response Frequency Percent
6 months or less 13 44.8%
6 months to 1 year 3 10.3%
1 year or longer 13 44.8%
Total 29 100.0%

Appendix V: Overall Survey Results (San Benito County) 2011 Monterey & San Benito Counties Homeless Census and Survey
104 © Applied Survey Research, 2011
15b. What is keeping you from getting employment?
Response Frequency Percent
No jobs 17 54.8%
No transportation 10 32.3%
No permanent address 8 25.8%
Need education 6 19.4%
Criminal record 4 12.9%
Need training 3 9.7%
Alcohol/drug issue 3 9.7%
No child care 3 9.7%
Need clothing 2 6.5%
No phone 2 6.5%
Health problems 2 6.5%
No tools for trade 2 6.5%
Spouse/partner doesn't want me to work 2 6.5%
Mental health issues 2 6.5%
No shower facilities 1 3.2%
Disabled 1 3.2%
No work permit (No S.S. #) 1 3.2%
Don't want to work 0 0.0%
No photo identification 0 0.0%
Retired 0 0.0%
Other 3 9.7% Multiple response question with 31 respondents offering 72 responses.
16. What are your other sources of income?
Response Frequency Percent
Recycling 12 44.4%
Family/friends 3 11.1%
Panhandling/asking for money on the street 3 11.1%
Child support 1 3.7%
Selling other found items 1 3.7%
Pension 0 0.0%
Selling blood/plasma 0 0.0%
Sex work 0 0.0%
Other 14 51.9% Multiple response question with 27 respondents offering 34 responses.
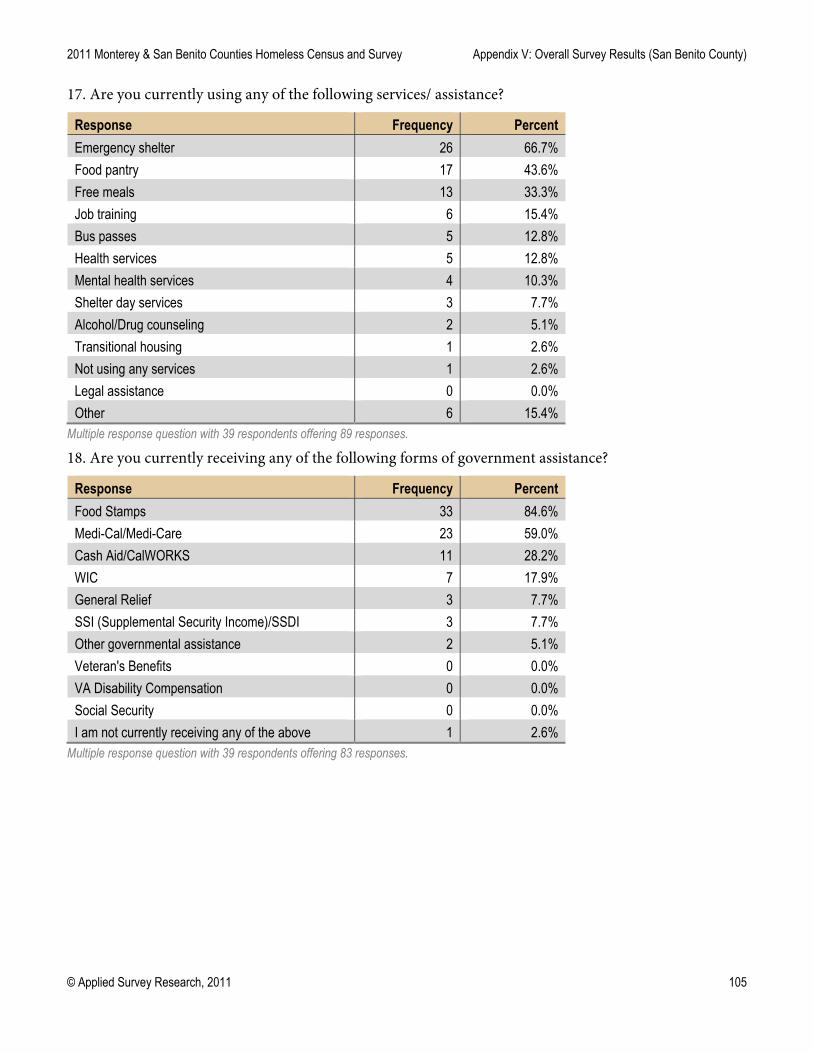
2011 Monterey & San Benito Counties Homeless Census and Survey Appendix V: Overall Survey Results (San Benito County)
© Applied Survey Research, 2011 105
17. Are you currently using any of the following services/ assistance?
Response Frequency Percent
Emergency shelter 26 66.7%
Food pantry 17 43.6%
Free meals 13 33.3%
Job training 6 15.4%
Bus passes 5 12.8%
Health services 5 12.8%
Mental health services 4 10.3%
Shelter day services 3 7.7%
Alcohol/Drug counseling 2 5.1%
Transitional housing 1 2.6%
Not using any services 1 2.6%
Legal assistance 0 0.0%
Other 6 15.4% Multiple response question with 39 respondents offering 89 responses.
18. Are you currently receiving any of the following forms of government assistance?
Response Frequency Percent
Food Stamps 33 84.6%
Medi-Cal/Medi-Care 23 59.0%
Cash Aid/CalWORKS 11 28.2%
WIC 7 17.9%
General Relief 3 7.7%
SSI (Supplemental Security Income)/SSDI 3 7.7%
Other governmental assistance 2 5.1%
Veteran's Benefits 0 0.0%
VA Disability Compensation 0 0.0%
Social Security 0 0.0%
I am not currently receiving any of the above 1 2.6% Multiple response question with 39 respondents offering 83 responses.

Appendix V: Overall Survey Results (San Benito County) 2011 Monterey & San Benito Counties Homeless Census and Survey
106 © Applied Survey Research, 2011
19. If you are not receiving any government assistance, why not?
Response Frequency Percent
Don't think I'm eligible 4 26.7%
Never applied 3 20.0%
Benefits were cut off 2 13.3%
I have applied for one or more of these services, and I am currently waiting for approval
2 13.3%
Turned down 2 13.3%
Have no ID 1 6.7%
No permanent address 1 6.7%
Don't know where to go 1 6.7%
Paper work too difficult 1 6.7%
No transportation 0 0.0%
They will not accept my pet 0 0.0%
Don't need government assistance 0 0.0%
Immigration issues 0 0.0%
I am afraid my children will be taken away from me 0 0.0%
Other 3 20.0% Multiple response question with 15 respondents offering 20 responses.
20. What is your total monthly income from all Government benefits? (County, State, Federal monies)
Response Frequency Percent
Zero 9 26.5%
$1 - $150 4 11.8%
$151 - $250 6 17.6%
$251 - $500 4 11.8%
$501 - $1000 11 32.4%
$1001 - $1500 0 0.0%
$1501 - $2000 0 0.0%
Over $2000 0 0.0%
Total 34 100.0%

2011 Monterey & San Benito Counties Homeless Census and Survey Appendix V: Overall Survey Results (San Benito County)
© Applied Survey Research, 2011 107
21. What is your total monthly income from all non-Government sources? (Job, panhandling, recycling, etc.)
Response Frequency Percent
Zero 17 45.9%
$1 - $150 13 35.1%
$151 - $250 1 2.7%
$251 - $500 3 8.1%
$501 - $1,000 1 2.7%
$1,001 - $1,500 0 0.0%
$1,501 - $2,000 2 5.4%
Over $2,000 0 0.0%
Total 37 100.0%
22. Do you have a pet?
Response Frequency Percent
Yes 4 9.5%
No 38 90.5%
Total 42 100.0%
22a. Do they prevent you from receiving housing?
Response Frequency Percent
Yes 0 0.0%
No 4 100.0%
Total 4 100.0%
23. Do you have a working cell phone?
Response Frequency Percent
Yes 24 64.9%
No 13 35.1%
Total 37 100.0%
24. How often do you use the internet?
Response Frequency Percent
At least once a week 19 50.0%
At least once a month 6 15.8%
Sometimes 5 13.2%
Never 8 21.1%
Total 38 100.0%

Appendix V: Overall Survey Results (San Benito County) 2011 Monterey & San Benito Counties Homeless Census and Survey
108 © Applied Survey Research, 2011
25. Since becoming homeless have you needed medical care and been unable to receive it?
Response Frequency Percent
Yes 18 48.6%
No 19 51.4%
Total 37 100.0%
26. Do you currently need any of these services?
Response Frequency Percent
Medical Care 12 44.4%
Dental Care 21 77.8%
Eye Care 14 51.9%
Substance Abuse Treatment 3 11.1%
Mental Health Services 8 29.6% Multiple response question with 27 respondents offering 58 responses.
27. How many times in the last 12 months have you used the emergency room for any treatment?
Response Frequency Percent
Never 25 59.5%
1 time 8 19.0%
2 times 4 9.5%
3 times 2 4.8%
4 times 2 4.8%
5 times 0 0.0%
More than 5 times 1 2.4%
Total 42 100.0%
28. Do you or have you received mental health services or medication for your mental health in the past 12 months?
Response Frequency Percent
Yes 8 20.0%
No 32 80.0%
Total 40 100.0%
28a. Do you have trouble accessing those services?
Response Frequency Percent
Yes 2 25.0%
No 6 75.0%
Total 8 100.0%

2011 Monterey & San Benito Counties Homeless Census and Survey Appendix V: Overall Survey Results (San Benito County)
© Applied Survey Research, 2011 109
28b. Have you been hospitalized for emotional problems in the past 12 months?
Response Frequency Percent
Yes 1 12.5%
No 7 87.5%
Total 8 100.0%
29. Were you ever in foster care?
Response Frequency Percent
Yes 9 22.5%
No 31 77.5%
Total 40 100.0%
30. Are you currently experiencing any of the following:
Yes No
30a. Physical disability 12.5% 87.5%
5 35
30b. Mental illness 5.3% 94.7%
2 36
30c. Depression 27.5% 72.5%
11 29
30d. Alcohol/drug abuse 12.8% 87.2%
5 34
30e. Domestic/partner violence or abuse 0.0% 100.0%
0 40
30f. Chronic health problems 7.5% 92.5%
3 37
30g. AIDS/HIV related illness 0.0% 100.0%
0 40
30h. Tuberculosis 0.0% 100.0%
0 40
30i. Hepatitis C 0.0% 100.0%
0 40
30j. PTSD (Post Traumatic Stress Disorder) 10.3% 89.7%
4 35
30k. Developmental disability 7.5% 92.5%
3 37

Appendix V: Overall Survey Results (San Benito County) 2011 Monterey & San Benito Counties Homeless Census and Survey
110 © Applied Survey Research, 2011
30a. Does it prevent you from getting work or housing?
Yes No
a. Physical disability 40.0% 60.0%
2 3
b. Mental illness 100.0% 0.0%
2 0
c. Depression 50.0% 50.0%
5 5
d. Alcohol/drug abuse 60.0% 40.0%
3 2
e. Domestic/partner violence or abuse 0.0% 0.0%
0 0
f. Chronic health problems 0.0% 100.0%
0 3
g. AIDS/HIV related illness 0.0% 0.0%
0 0
h. Tuberculosis 0.0% 0.0%
0 0
i. Hepatitis C 0.0% 0.0%
0 0
j. PTSD (Post Traumatic Stress Disorder) 50.0% 50.0%
2 2
k. Developmental disability 66.7% 33.3%
2 1
31. How many nights, if any, have you spent in jail or prison during the last 12 months?
Response Frequency Percent
0 nights 33 82.5%
1 - 5 nights 5 12.5%
6 - 10 nights 0 0.0%
11 - 20 nights 1 2.5%
21 - 50 nights 1 2.5%
More than 50 nights 0 0.0%
Total 40 100.0%

2011 Monterey & San Benito Counties Homeless Census and Survey Appendix V: Overall Survey Results (San Benito County)
© Applied Survey Research, 2011 111
32. Are you currently on probation or parole?
Response Frequency Percent
Yes 5 12.8%
No 34 87.2%
Total 39 100.0%
33. Were you on probation or parole at the time you most recently became homeless?
Response Frequency Percent
Yes 5 12.8%
No 34 87.2%
Total 39 100.0%
34. How many tickets have your received for parking violations, loitering, trespassing or camping in the past 12 months?
Response Frequency Percent
Never 41 97.6%
1 ticket 1 2.4%
2 tickets 0 0.0%
3 tickets 0 0.0%
4 tickets 0 0.0%
5 tickets 0 0.0%
More than 5 tickets 0 0.0%
Total 42 100.0%
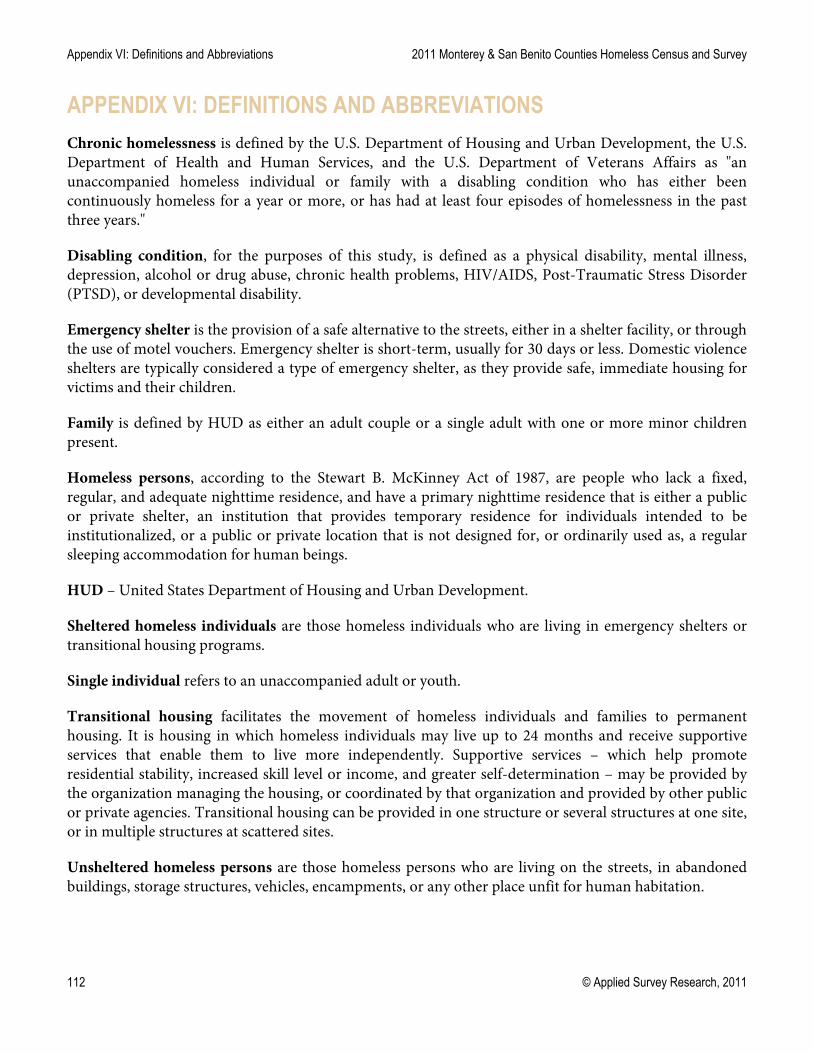
Appendix VI: Definitions and Abbreviations 2011 Monterey & San Benito Counties Homeless Census and Survey
112 © Applied Survey Research, 2011
APPENDIX VI: DEFINITIONS AND ABBREVIATIONS
Chronic homelessness is defined by the U.S. Department of Housing and Urban Development, the U.S. Department of Health and Human Services, and the U.S. Department of Veterans Affairs as "an unaccompanied homeless individual or family with a disabling condition who has either been continuously homeless for a year or more, or has had at least four episodes of homelessness in the past three years."
Disabling condition, for the purposes of this study, is defined as a physical disability, mental illness, depression, alcohol or drug abuse, chronic health problems, HIV/AIDS, Post-Traumatic Stress Disorder (PTSD), or developmental disability.
Emergency shelter is the provision of a safe alternative to the streets, either in a shelter facility, or through the use of motel vouchers. Emergency shelter is short-term, usually for 30 days or less. Domestic violence shelters are typically considered a type of emergency shelter, as they provide safe, immediate housing for victims and their children.
Family is defined by HUD as either an adult couple or a single adult with one or more minor children present.
Homeless persons, according to the Stewart B. McKinney Act of 1987, are people who lack a fixed, regular, and adequate nighttime residence, and have a primary nighttime residence that is either a public or private shelter, an institution that provides temporary residence for individuals intended to be institutionalized, or a public or private location that is not designed for, or ordinarily used as, a regular sleeping accommodation for human beings.
HUD – United States Department of Housing and Urban Development.
Sheltered homeless individuals are those homeless individuals who are living in emergency shelters or transitional housing programs.
Single individual refers to an unaccompanied adult or youth.
Transitional housing facilitates the movement of homeless individuals and families to permanent housing. It is housing in which homeless individuals may live up to 24 months and receive supportive services that enable them to live more independently. Supportive services – which help promote residential stability, increased skill level or income, and greater self-determination – may be provided by the organization managing the housing, or coordinated by that organization and provided by other public or private agencies. Transitional housing can be provided in one structure or several structures at one site, or in multiple structures at scattered sites.
Unsheltered homeless persons are those homeless persons who are living on the streets, in abandoned buildings, storage structures, vehicles, encampments, or any other place unfit for human habitation.


55 Brennan St. Watsonville, CA 95076
(831) 728-1356
991 West Hedding St., Ste. 102San Jose, CA 95126
(408) 247-8319
WWW . A P P L I E D S U R V E Y R E S E A R C H . O R G
2011 Monterey & San Benito Counties
HOMELESS CENSUS & SURVEY