Embed Size (px)
Citation preview
The global economy in 2015 1
$$ $
Going beyond borders:Where to grow your businessGrant Thornton Global Dynamism Index 2015
The global economy in 2015 2
5
CANADA SWEDEN NETHERLANDS AUSTRALIA FINLAND
ISRAEL
ALGERIA
SOUTH KOREA FINLAND SWEDEN JAPAN
CHINA(MAINLAND)
AUSTRALIA INDONESIA TAIWAN
SINGAPORE SLOVENIA FINLAND CHILE POLAND
CHINA(MAINLAND)
INDIA MALAYSIA NIGERIA VIETNAM
AUSTRALIASINGAPORE
1
ISRAEL
2
SWEDEN
5
FINLAND
1st4th 5th3rd2nd
1st4th 5th
3rd2nd
ISRAEL1st
4th 5th3rd2nd
1st4th 5th
3rd2nd
1st4th 5th
3rd2nd
5
CANADA SWEDEN NETHERLANDS AUSTRALIA FINLAND
ISRAEL
ALGERIA
SOUTH KOREA FINLAND SWEDEN JAPAN
CHINA(MAINLAND)
AUSTRALIA INDONESIA TAIWAN
SINGAPORE SLOVENIA FINLAND CHILE POLAND
CHINA(MAINLAND)
INDIA MALAYSIA NIGERIA VIETNAM
AUSTRALIASINGAPORE
1
ISRAEL
2
SWEDEN
5
FINLAND
1st4th 5th3rd2nd
1st4th 5th
3rd2nd
ISRAEL1st
4th 5th3rd2nd
1st4th 5th
3rd2nd
1st4th 5th
3rd2nd
=3 =3
SINGAPORE ISRAEL AUSTRALIA FINLAND SWEDEN
Executive summary
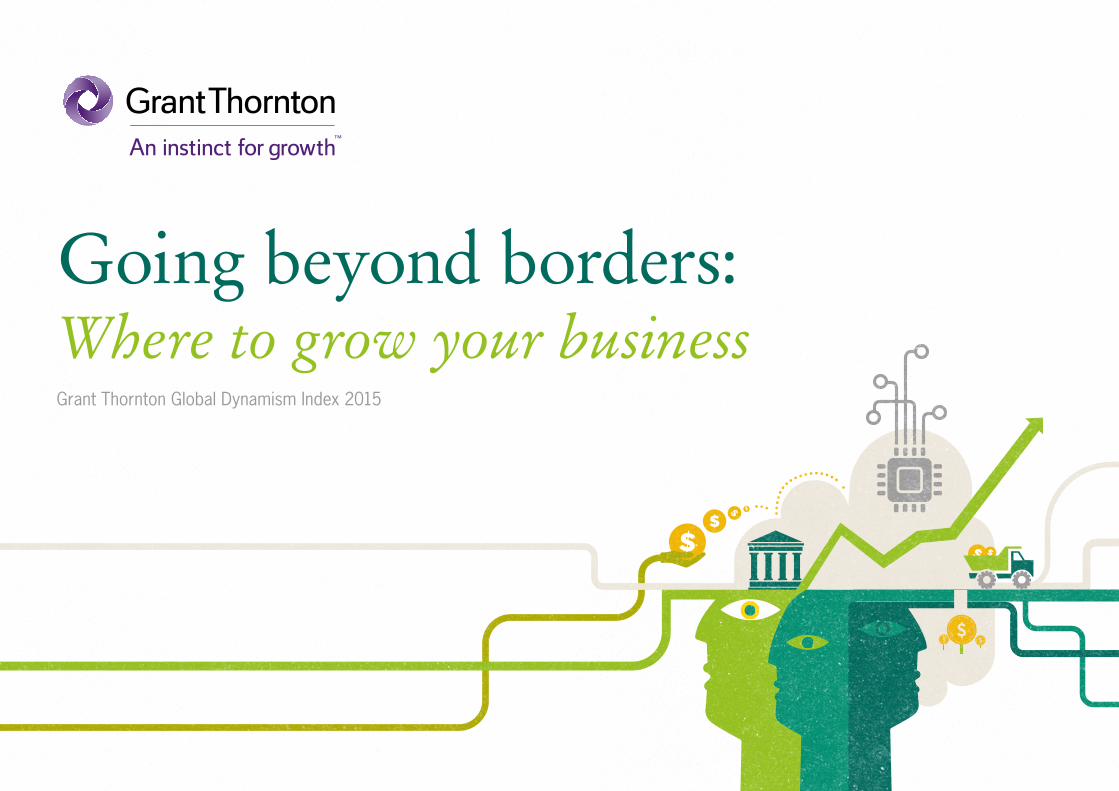
The risk associated with operating in a particular economy including political stability, trade and legal policy.
The digital and technological capacity of the local economy, including broadband penetration, IT and R&D spending.
The availability, skills and productivity of the local labour force.
The ability of firms to fund the growth of their operations with reference to quality of local systems, access to capital and M&A activity.
The local market opportunity in terms of GDP, consumer spending and stock market growth.
The Global Dynamism Index (GDI) combines 22 indicators across five growth areas to rank the business growth environments of the 60 largest economies in the world. Each economy is ranked for overall dynamism – or growth potential – and within each growth area.
Going beyond borders: Where to grow your business
Business operating environmentGDI 2015: Overall rankings
TechnologyLabour market
Financing environment
Market growth
The global economy in 2015 3
ForewordGlobalisation is accelerating. While businesses are looking to unlock new revenue streams and governments are encouraging economic diversification, the increased connectivity of the digital age is lowering barriers to entry, opening up more international growth opportunities for dynamic businesses.
Going beyond borders: Where to grow your business
Going beyond bordersAs a growing global organisation, we understand the challenges of expanding to new markets, but our advisers in more than 130 countries can help you make the most of the opportunities. You can find more information about our international expansion campaign ‘Going Beyond Borders’, including links to the ‘Doing business’ guides we developed for HSBC, on our global website. Expanding overseas is a complex challenge. You should consider on all the advice you can lay your hands on.
Paul RaleighGlobal leader - growth and advisory servicesGrant Thornton
Using the GDI Business Before opening the GDI, think about what aspects of a market are most valuable to you: Stability? Good technology? Productive workers? Access to capital? Tapping into a growing market? All of these factors are included within the tool but some might be more important to the success of your business than others. Therefore consider
However, market entry decisions are some of the toughest a business leader ever has to face. There are so many factors – both known and unknown – to consider. Uncertainty about what lies ahead can hamper efforts to make the case for action to colleagues and funding partners, and to manage risk effectively. Lack of familiarity with the territory or little experience of doing business overseas means it can be difficult to bring the vision of expanding into new markets to life. Some of the largest corporations in the world, which are relatively data rich and have the resources to send people to scope out opportunities on the ground, have embarrassingly and expensively flopped in new markets.
Our Global Dynamism Index (GDI) cannot solve the market entry dilemma; it should not replace engaging with an adviser with a deep understanding of international expansion. But it can be used as a tool to help identify countries of interest by drawing on 22 indicators which have each been assigned an importance through a survey of business leaders, adding that vital human perspective.
Some of the results may surprise you: certainly I was interested to see Algeria at the top of the labour market growth area. But it is important to remember what the GDI measures. It does not suggest that Algeria has the best labour market in the world, rather that, over the past 12 months, the Algerian labour market has supported the highest business growth potential in the world.
This report highlights the big ‘movers and fallers’ in the GDI 2015 but I would encourage you to access the interactive model via our website which allows for a much richer comparison of economies’ strengths and weaknesses.
adjusting the weighting to provide a more accurate picture of the markets most likely to help unlock the growth potential of your business.
GovernmentsGovernments around the world know that it takes more than a low corporate tax rate to encourage businesses to invest in an economy. Business leaders need to know that they can get their cash out, that local technology is up to standard and that an investment in one economy will help unlock an entire region. The GDI allows governments in 60 of the world’s largest economies to assess their offer for inbound investment against their competitors, highlighting areas of strength to market and areas of weaknesses to mitigate.
The global economy in 2015 4
Going beyond borders: Where to grow your business
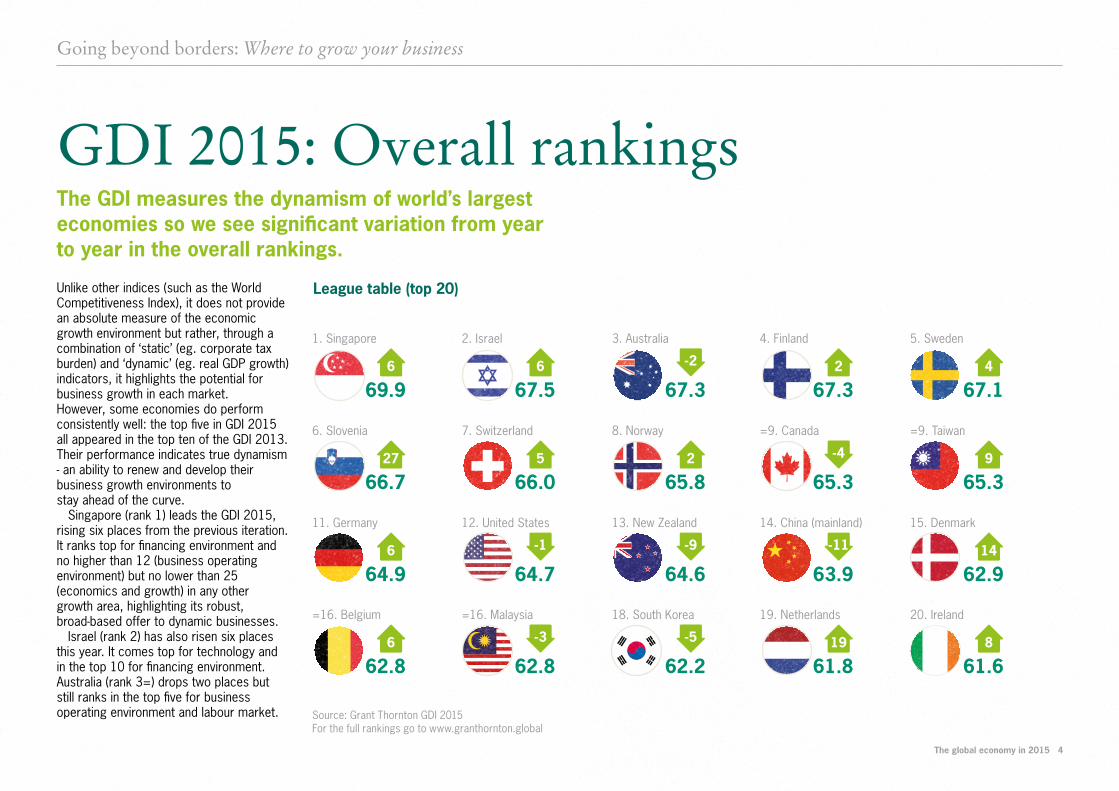
GDI 2015: Overall rankingsThe GDI measures the dynamism of world’s largest economies so we see significant variation from year to year in the overall rankings.
Unlike other indices (such as the World Competitiveness Index), it does not provide an absolute measure of the economic growth environment but rather, through a combination of ‘static’ (eg. corporate tax burden) and ‘dynamic’ (eg. real GDP growth) indicators, it highlights the potential for business growth in each market. However, some economies do perform consistently well: the top five in GDI 2015 all appeared in the top ten of the GDI 2013. Their performance indicates true dynamism - an ability to renew and develop their business growth environments to stay ahead of the curve.
Singapore (rank 1) leads the GDI 2015, rising six places from the previous iteration. It ranks top for financing environment and no higher than 12 (business operating environment) but no lower than 25 (economics and growth) in any other growth area, highlighting its robust, broad-based offer to dynamic businesses.
Israel (rank 2) has also risen six places this year. It comes top for technology and in the top 10 for financing environment. Australia (rank 3=) drops two places but still ranks in the top five for business operating environment and labour market.
League table (top 20)
1. Singapore 2. Israel 3. Australia 4. Finland 5. Sweden
69.9 67.5 67.3 67.3 67.16 6 -2 2 4
6. Slovenia 7. Switzerland 8. Norway =9. Canada =9. Taiwan
66.7 66.0 65.8 65.3 65.327 5 2 -4 9
11. Germany 12. United States 13. New Zealand 14. China (mainland) 15. Denmark
64.9 64.7 64.6 63.9 62.96 -1 -9 -11 14
=16. Belgium =16. Malaysia 18. South Korea 19. Netherlands 20. Ireland
62.8 62.8 62.2 61.8 61.66 -3 -5 19 8
Source: Grant Thornton GDI 2015For the full rankings go to www.granthornton.global
The global economy in 2015 5
GROWTH AREAS
Going beyond borders: Where to grow your business
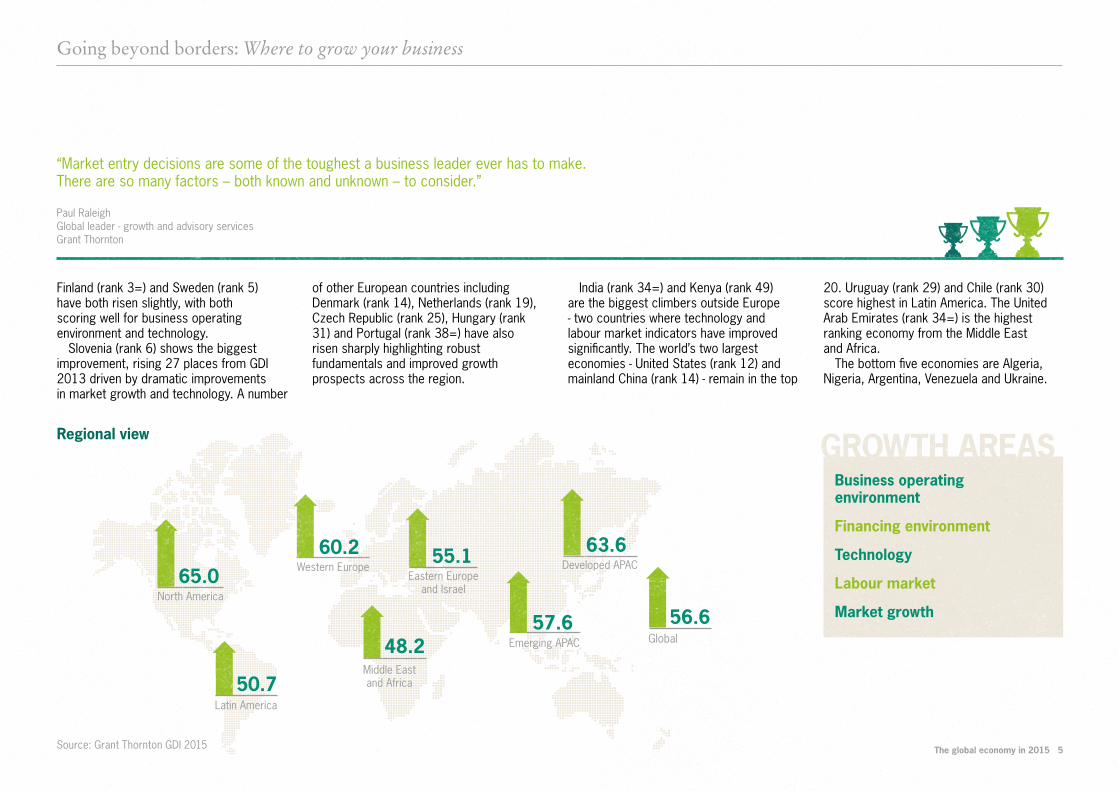
Finland (rank 3=) and Sweden (rank 5) have both risen slightly, with both scoring well for business operating environment and technology.
Slovenia (rank 6) shows the biggest improvement, rising 27 places from GDI 2013 driven by dramatic improvements in market growth and technology. A number
Regional view
65.0
50.7
48.2
60.2 55.1 63.6
North America
Latin America
Global
Western Europe
Middle East and Africa
Emerging APAC
Developed APACEastern Europe
and Israel
of other European countries including Denmark (rank 14), Netherlands (rank 19), Czech Republic (rank 25), Hungary (rank 31) and Portugal (rank 38=) have also risen sharply highlighting robust fundamentals and improved growth prospects across the region.
India (rank 34=) and Kenya (rank 49) are the biggest climbers outside Europe - two countries where technology and labour market indicators have improved significantly. The world’s two largest economies - United States (rank 12) and mainland China (rank 14) - remain in the top
20. Uruguay (rank 29) and Chile (rank 30) score highest in Latin America. The United Arab Emirates (rank 34=) is the highest ranking economy from the Middle East and Africa.
The bottom five economies are Algeria, Nigeria, Argentina, Venezuela and Ukraine.
Source: Grant Thornton GDI 2015
“Market entry decisions are some of the toughest a business leader ever has to make. There are so many factors – both known and unknown – to consider.”
Paul RaleighGlobal leader - growth and advisory services Grant Thornton
57.6 56.6
Business operating environment
Financing environment
Technology
Labour market
Market growth
The global economy in 2015 6
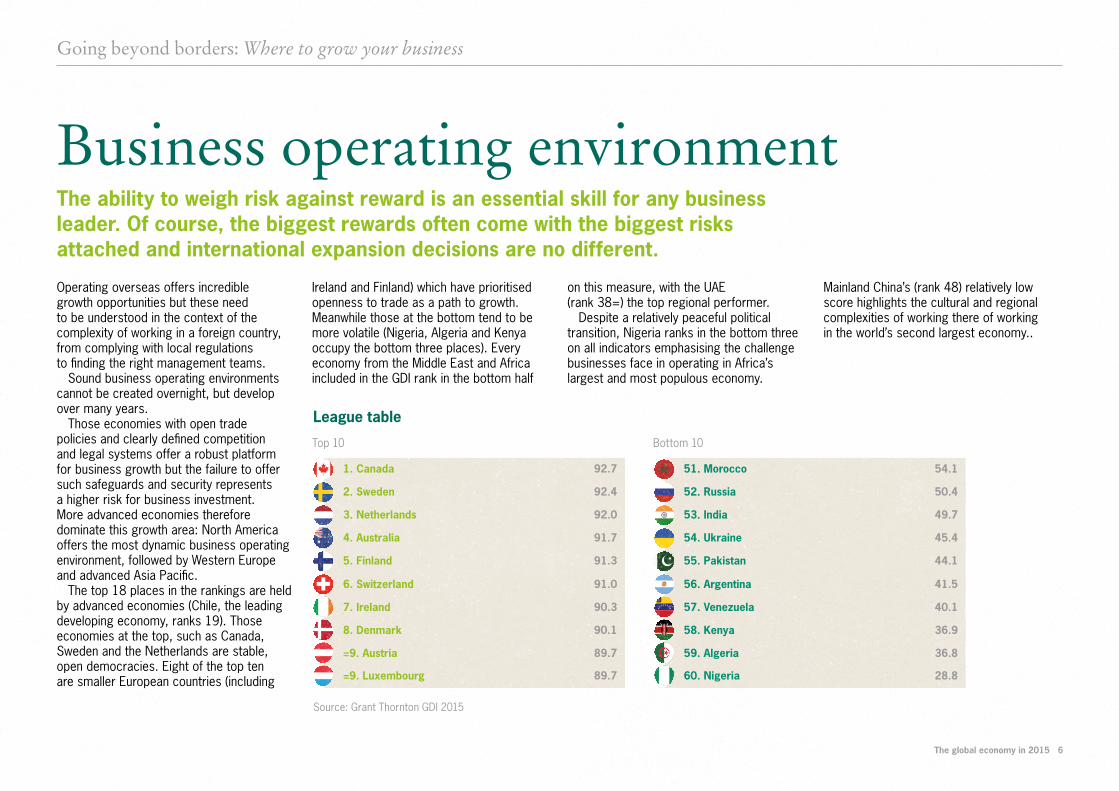
Business operating environment
Operating overseas offers incredible growth opportunities but these need to be understood in the context of the complexity of working in a foreign country, from complying with local regulations to finding the right management teams.
Sound business operating environments cannot be created overnight, but develop over many years.
Those economies with open trade policies and clearly defined competition and legal systems offer a robust platform for business growth but the failure to offer such safeguards and security represents a higher risk for business investment. More advanced economies therefore dominate this growth area: North America offers the most dynamic business operating environment, followed by Western Europe and advanced Asia Pacific.
The top 18 places in the rankings are held by advanced economies (Chile, the leading developing economy, ranks 19). Those economies at the top, such as Canada, Sweden and the Netherlands are stable, open democracies. Eight of the top ten are smaller European countries (including
Ireland and Finland) which have prioritised openness to trade as a path to growth. Meanwhile those at the bottom tend to be more volatile (Nigeria, Algeria and Kenya occupy the bottom three places). Every economy from the Middle East and Africa included in the GDI rank in the bottom half
on this measure, with the UAE (rank 38=) the top regional performer.
Despite a relatively peaceful political transition, Nigeria ranks in the bottom three on all indicators emphasising the challenge businesses face in operating in Africa’s largest and most populous economy.
The ability to weigh risk against reward is an essential skill for any business leader. Of course, the biggest rewards often come with the biggest risks attached and international expansion decisions are no different.
Mainland China’s (rank 48) relatively low score highlights the cultural and regional complexities of working there of working in the world’s second largest economy..
Source: Grant Thornton GDI 2015
Top 10 Bottom 10
League table
1. Canada 51. Morocco 54.1
2. Sweden 52. Russia 50.4
3. Netherlands 53. India 49.7
4. Australia 54. Ukraine 45.4
5. Finland 55. Pakistan 44.1
6. Switzerland 56. Argentina 41.5
7. Ireland 57. Venezuela 40.1
8. Denmark 58. Kenya 36.9
=9. Austria 59. Algeria 36.8
=9. Luxembourg 60. Nigeria 28.8
92.7
92.4
92.0
91.7
91.3
91.0
90.3
90.1
89.7
89.7
Going beyond borders: Where to grow your business
The global economy in 2015 7
INDICATORS
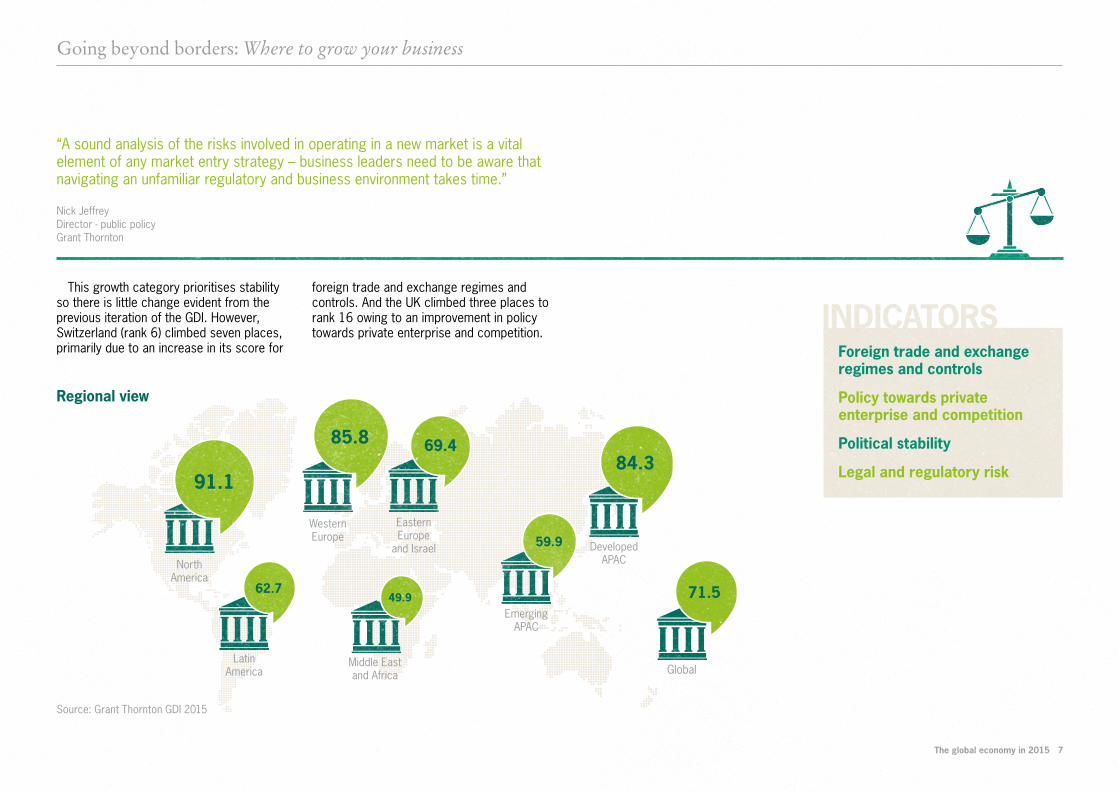
“A sound analysis of the risks involved in operating in a new market is a vital element of any market entry strategy – business leaders need to be aware that navigating an unfamiliar regulatory and business environment takes time.”
Nick Jeffrey Director - public policy Grant Thornton
This growth category prioritises stability so there is little change evident from the previous iteration of the GDI. However, Switzerland (rank 6) climbed seven places, primarily due to an increase in its score for
foreign trade and exchange regimes and controls. And the UK climbed three places to rank 16 owing to an improvement in policy towards private enterprise and competition.
Regional view
Source: Grant Thornton GDI 2015
Foreign trade and exchange regimes and controls
Policy towards private enterprise and competition
Political stability
Legal and regulatory risk91.1
85.884.3
71.5
69.4
62.7
59.9
49.9
North America
Latin America Global
Western Europe
Middle East and Africa
Emerging APAC
Developed APAC
Eastern Europe
and Israel
Going beyond borders: Where to grow your business
The global economy in 2015 8
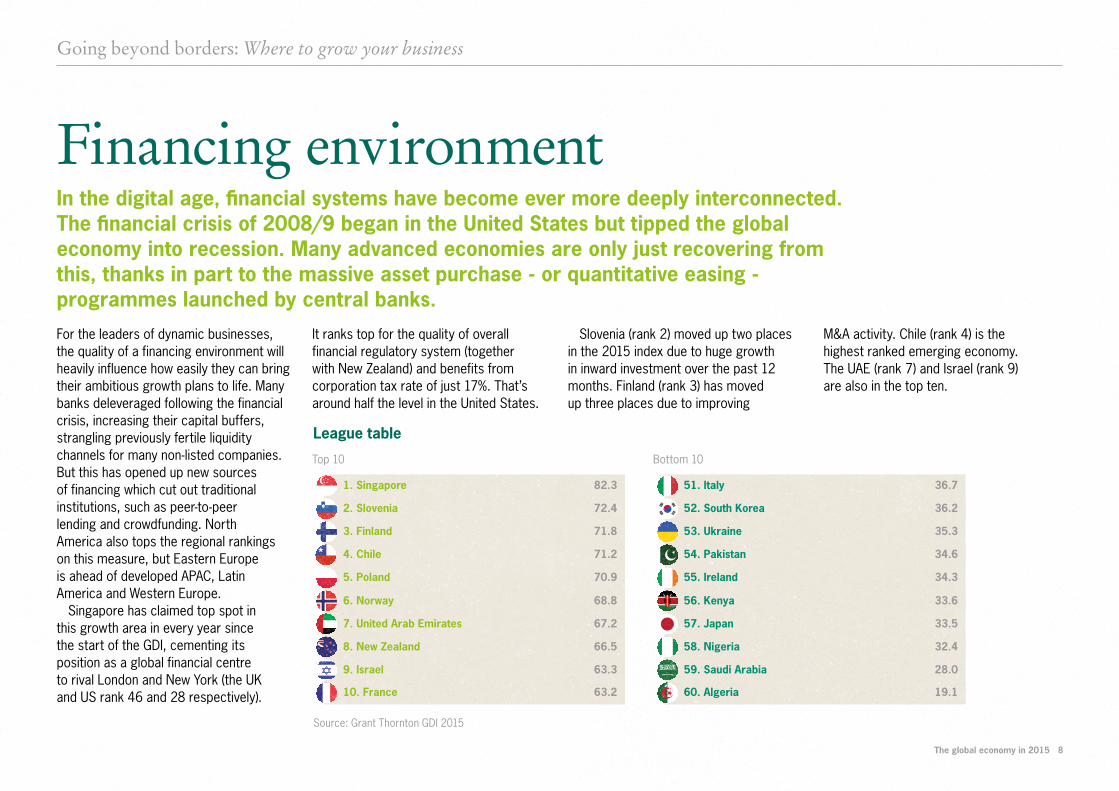
In the digital age, financial systems have become ever more deeply interconnected. The financial crisis of 2008/9 began in the United States but tipped the global economy into recession. Many advanced economies are only just recovering from this, thanks in part to the massive asset purchase - or quantitative easing - programmes launched by central banks.
Financing environment
For the leaders of dynamic businesses, the quality of a financing environment will heavily influence how easily they can bring their ambitious growth plans to life. Many banks deleveraged following the financial crisis, increasing their capital buffers, strangling previously fertile liquidity channels for many non-listed companies. But this has opened up new sources of financing which cut out traditional institutions, such as peer-to-peer lending and crowdfunding. North America also tops the regional rankings on this measure, but Eastern Europe is ahead of developed APAC, Latin America and Western Europe.
Singapore has claimed top spot in this growth area in every year since the start of the GDI, cementing its position as a global financial centre to rival London and New York (the UK and US rank 46 and 28 respectively).
It ranks top for the quality of overall financial regulatory system (together with New Zealand) and benefits from corporation tax rate of just 17%. That’s around half the level in the United States.
Slovenia (rank 2) moved up two places in the 2015 index due to huge growth in inward investment over the past 12 months. Finland (rank 3) has moved up three places due to improving
M&A activity. Chile (rank 4) is the highest ranked emerging economy. The UAE (rank 7) and Israel (rank 9) are also in the top ten.
Source: Grant Thornton GDI 2015
Top 10 Bottom 10
League table
1. Singapore 51. Italy82.3 36.7
2. Slovenia 52. South Korea72.4 36.2
3. Finland 53. Ukraine71.8 35.3
4. Chile 54. Pakistan71.2 34.6
5. Poland 55. Ireland70.9 34.3
6. Norway 56. Kenya68.8 33.6
7. United Arab Emirates 57. Japan67.2 33.5
8. New Zealand 58. Nigeria66.5 32.4
9. Israel 59. Saudi Arabia63.3 28.0
10. France 60. Algeria63.2 19.1
Going beyond borders: Where to grow your business
The global economy in 2015 9
INDICATORS
Latin America
WesternEurope
Developed APAC
Emerging APAC
GlobalMiddle Eastand Africa
Eastern Europe and Israel
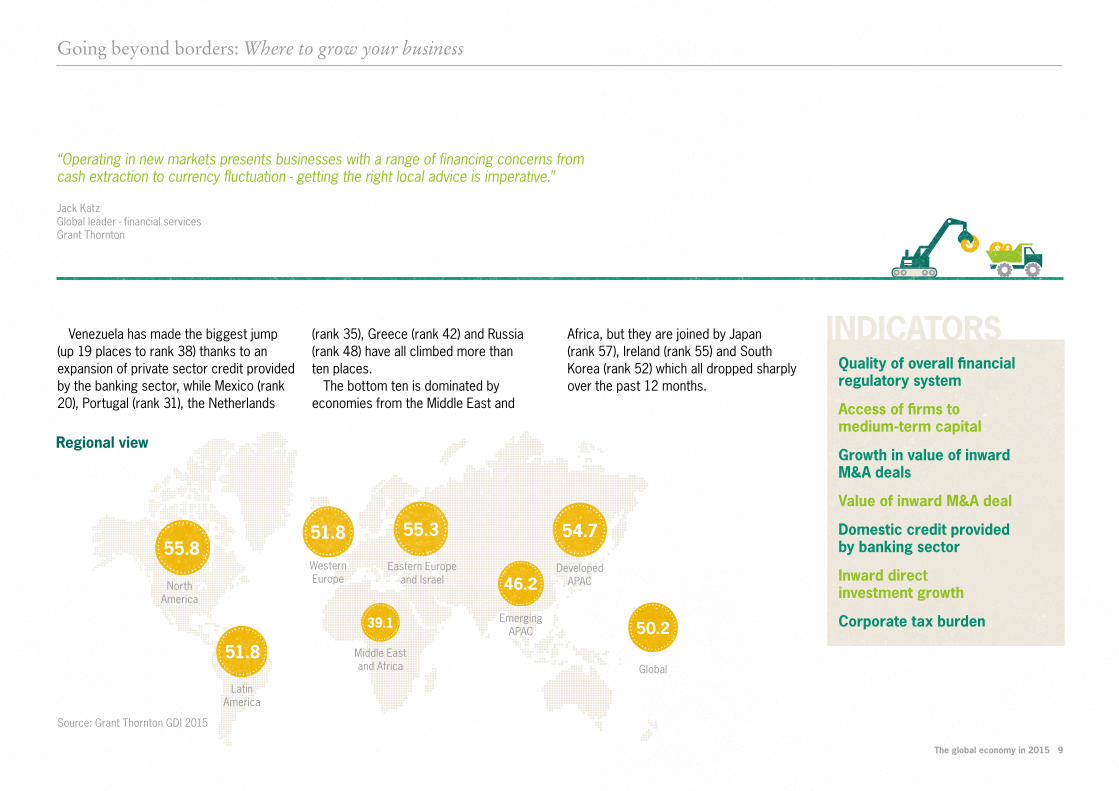
“Operating in new markets presents businesses with a range of financing concerns from cash extraction to currency fluctuation - getting the right local advice is imperative.”
Jack KatzGlobal leader - financial servicesGrant Thornton
Venezuela has made the biggest jump (up 19 places to rank 38) thanks to an expansion of private sector credit provided by the banking sector, while Mexico (rank 20), Portugal (rank 31), the Netherlands
Quality of overall financial regulatory system
Access of firms to medium-term capital
Growth in value of inward M&A deals
Value of inward M&A deal
Domestic credit provided by banking sector
Inward direct investment growth
Corporate tax burden
Regional view
Source: Grant Thornton GDI 2015
North America
55.855.3 54.751.8
39.1
46.2
50.251.8
(rank 35), Greece (rank 42) and Russia (rank 48) have all climbed more than ten places.
The bottom ten is dominated by economies from the Middle East and
Africa, but they are joined by Japan (rank 57), Ireland (rank 55) and South Korea (rank 52) which all dropped sharply over the past 12 months.
Going beyond borders: Where to grow your business
The global economy in 2015 10
Going beyond borders: Where to grow your business
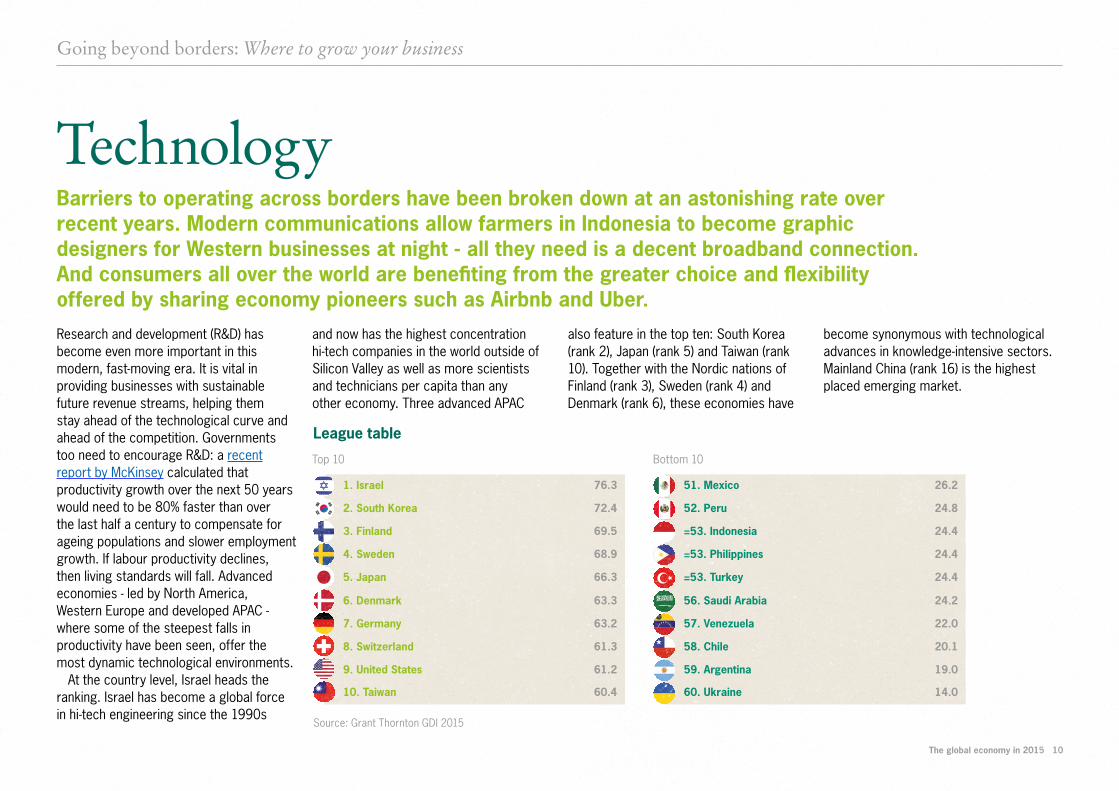
Barriers to operating across borders have been broken down at an astonishing rate over recent years. Modern communications allow farmers in Indonesia to become graphic designers for Western businesses at night - all they need is a decent broadband connection. And consumers all over the world are benefiting from the greater choice and flexibility offered by sharing economy pioneers such as Airbnb and Uber.
Technology
Research and development (R&D) has become even more important in this modern, fast-moving era. It is vital in providing businesses with sustainable future revenue streams, helping them stay ahead of the technological curve and ahead of the competition. Governments too need to encourage R&D: a recent report by McKinsey calculated that productivity growth over the next 50 years would need to be 80% faster than over the last half a century to compensate for ageing populations and slower employment growth. If labour productivity declines, then living standards will fall. Advanced economies - led by North America, Western Europe and developed APAC - where some of the steepest falls in productivity have been seen, offer the most dynamic technological environments.
At the country level, Israel heads the ranking. Israel has become a global force in hi-tech engineering since the 1990s
and now has the highest concentration hi-tech companies in the world outside of Silicon Valley as well as more scientists and technicians per capita than any other economy. Three advanced APAC
also feature in the top ten: South Korea (rank 2), Japan (rank 5) and Taiwan (rank 10). Together with the Nordic nations of Finland (rank 3), Sweden (rank 4) and Denmark (rank 6), these economies have
become synonymous with technological advances in knowledge-intensive sectors. Mainland China (rank 16) is the highest placed emerging market.
Top 10 Bottom 10
League table
1. Israel 51. Mexico76.3 26.2
2. South Korea 52. Peru72.4 24.8
3. Finland =53. Indonesia69.5 24.4
4. Sweden =53. Philippines68.9 24.4
5. Japan =53. Turkey66.3 24.4
6. Denmark 56. Saudi Arabia63.3 24.2
7. Germany 57. Venezuela63.2 22.0
8. Switzerland 58. Chile61.3 20.1
9. United States 59. Argentina61.2 19.0
10. Taiwan 60. Ukraine60.4 14.0
Source: Grant Thornton GDI 2015
The global economy in 2015 11
INDICATORS
Going beyond borders: Where to grow your business
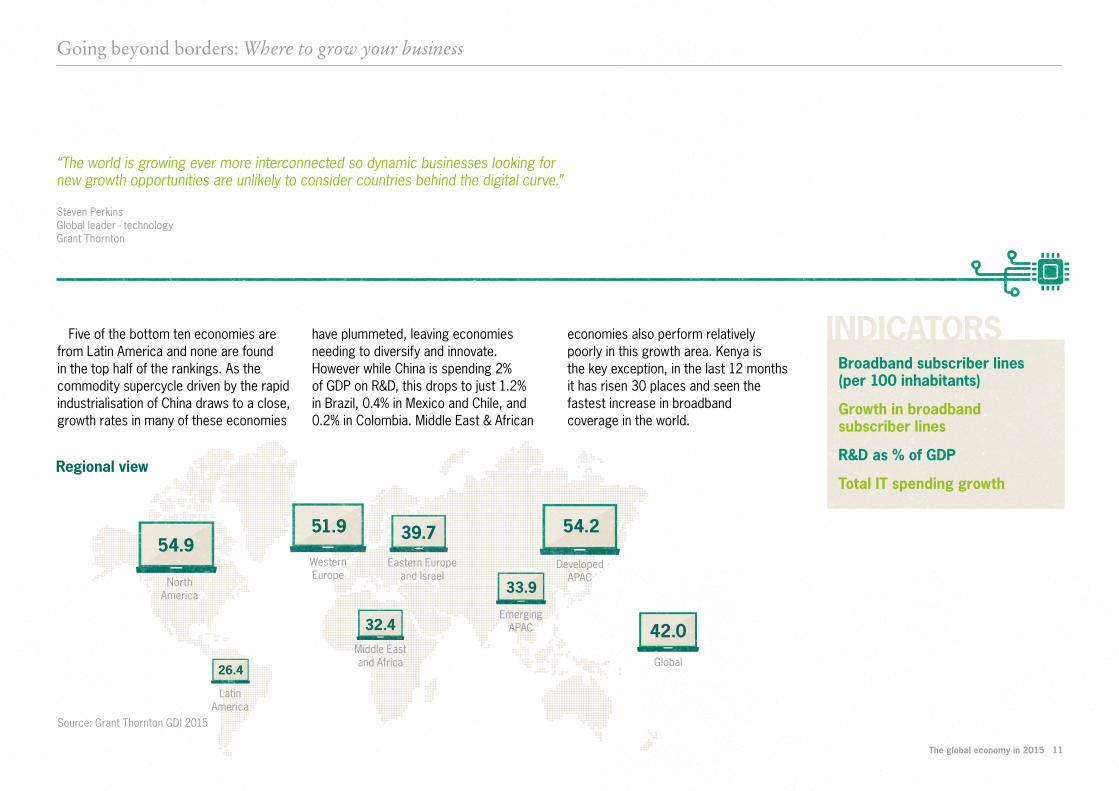
“The world is growing ever more interconnected so dynamic businesses looking for new growth opportunities are unlikely to consider countries behind the digital curve.”
Steven Perkins Global leader - technology Grant Thornton
Five of the bottom ten economies are from Latin America and none are found in the top half of the rankings. As the commodity supercycle driven by the rapid industrialisation of China draws to a close, growth rates in many of these economies
have plummeted, leaving economies needing to diversify and innovate. However while China is spending 2% of GDP on R&D, this drops to just 1.2% in Brazil, 0.4% in Mexico and Chile, and 0.2% in Colombia. Middle East & African
economies also perform relatively poorly in this growth area. Kenya is the key exception, in the last 12 months it has risen 30 places and seen the fastest increase in broadband coverage in the world.
Regional view
Broadband subscriber lines (per 100 inhabitants)
Growth in broadband subscriber lines
R&D as % of GDP
Total IT spending growth
Source: Grant Thornton GDI 2015
54.951.9 39.7
42.0
54.2
33.9
32.4
26.4
Latin America
WesternEurope
Developed APAC
Emerging APAC
GlobalMiddle Eastand Africa
Eastern Europe and IsraelNorth
America
The global economy in 2015 12
Labour market
The last decade has certainly seen some rapid advances in technology: 3D printing is now a reality and driverless cars will soon be on our roads, threatening many job categories, from factory workers to lorry drivers. However, skilled people remain at the heart of the global economy and while some new digital businesses operate with very low headcounts, the majority still need workers to turn ideas into profit. Tellingly, 55% of automating businesses plan to redeploy workers or train them to use the new machines, according to the IBR.
Algeria leads this growth area, rising 35 places from the previous iteration of the index. A relatively large proportion of its workforce is also under 30 (55%) while labour productivity growth of 8.4% over the past 12 months is impressive, especially given the performance of neighbouring Egypt (0.5%) and Morocco (1.2%). Indeed, the Middle East and Africa ranks last regionally on this measure.
Emerging APAC ranks top regionally with its three giant economies all in the top 15. The strong performance of mainland China (rank 2) is driven by labour productivity
growth of 7.0% and a slight improvement in the average number of years children spend at school. Indonesia (rank 3=) has also seen fast growth in output per worker (5.9%) and has a low unemployment rate (5.9%). India (rank 15) also has a large proportion of people under 30 (55.8%) but its climb
of 31 places up the rankings is driven by a dramatic improvement in labour productivity (5.4%) as well as slight improvements in average school years and a decline in the unemployment rate. Vietnam (rank 7) and the Philippines (rank 8) also make the top ten.
Advanced APAC also scores well on this
League table
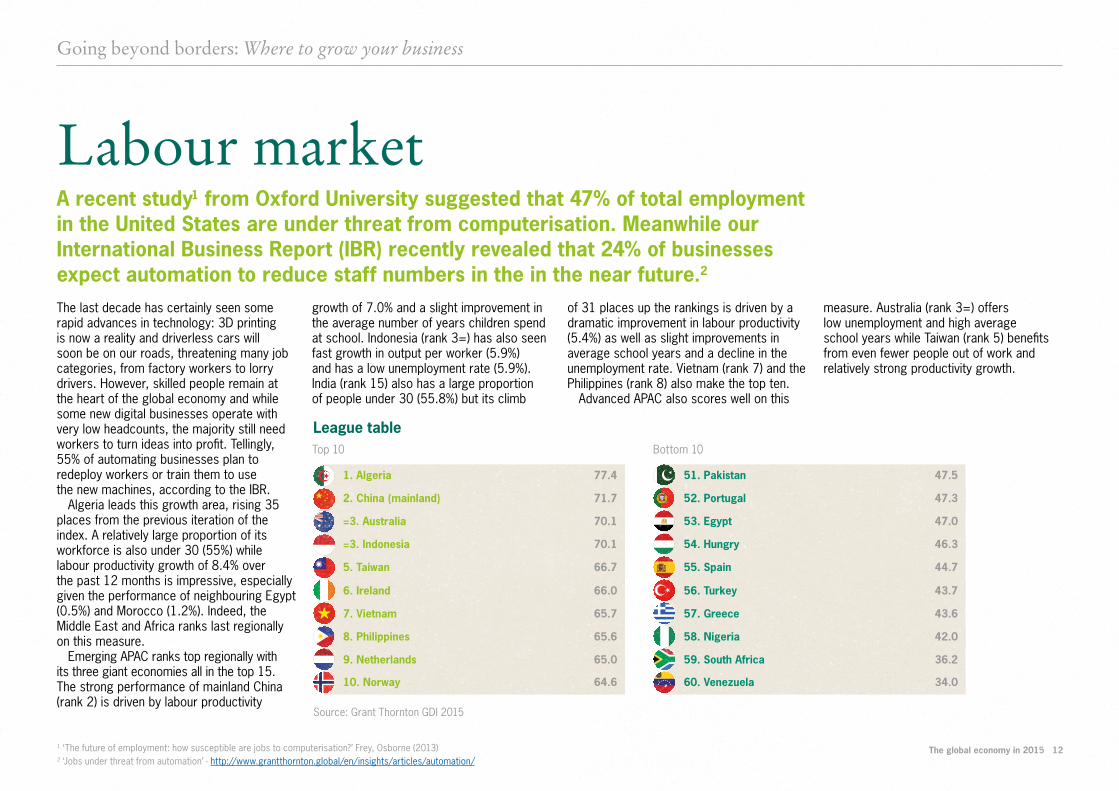
A recent study1 from Oxford University suggested that 47% of total employment in the United States are under threat from computerisation. Meanwhile our International Business Report (IBR) recently revealed that 24% of businesses expect automation to reduce staff numbers in the in the near future.2
measure. Australia (rank 3=) offers low unemployment and high average school years while Taiwan (rank 5) benefits from even fewer people out of work and relatively strong productivity growth.
1. Algeria 51. Pakistan77.4 47.5
2. China (mainland) 52. Portugal71.7 47.3
=3. Australia 53. Egypt70.1 47.0
=3. Indonesia 54. Hungry70.1 46.3
5. Taiwan 55. Spain66.7 44.7
6. Ireland 56. Turkey66.0 43.7
7. Vietnam 57. Greece65.7 43.6
8. Philippines 58. Nigeria65.6 42.0
9. Netherlands 59. South Africa65.0 36.2
10. Norway 60. Venezuela64.6 34.0
Going beyond borders: Where to grow your business
Top 10 Bottom 10
Source: Grant Thornton GDI 2015
1 ‘The future of employment: how susceptible are jobs to computerisation?’ Frey, Osborne (2013)2 ‘Jobs under threat from automation’ - http://www.grantthornton.global/en/insights/articles/automation/
The global economy in 2015 13
INDICATORSIreland (rank 6), the Netherlands (rank 9) and Norway (rank 10) are all in the top ten, but Western Europe is below the global average in this growth area. The southern European economies hit hardest by the eurozone crisis - Italy, Portugal, Spain and Greece - all rank in the bottom 11 due to
high unemployment and low productivity. The leading Eastern European economies are the Czech Republic, Romania and Slovenia (all 23=).
Latin American economies are very spread out, from Uruguay (rank 13) to Venezuela (rank 60). Those in the middle,
such as Brazil and Mexico, are struggling to find productivity gains despite low unemployment, while the average time children spend in education remains relatively low.
Going beyond borders: Where to grow your business
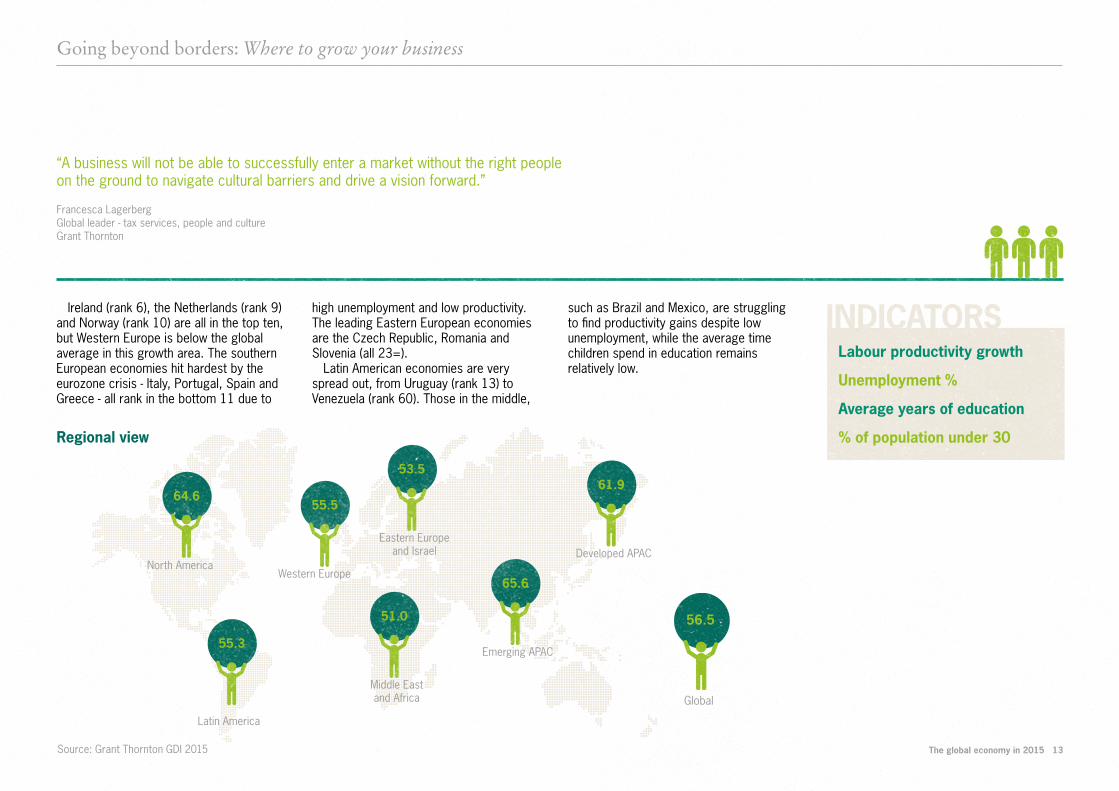
“A business will not be able to successfully enter a market without the right people on the ground to navigate cultural barriers and drive a vision forward.”
Francesca Lagerberg Global leader - tax services, people and culture Grant Thornton
North America
Latin America
Global
Western Europe
Middle East and Africa
Emerging APAC
Developed APACEastern Europe
and Israel
Regional view
Labour productivity growth
Unemployment %
Average years of education
% of population under 30
56.551.0
65.6
61.964.6
55.3
55.5
53.5
Source: Grant Thornton GDI 2015
The global economy in 2015 14
Market growth
While emerging economies largely powered the global recovery as governments, businesses and consumers deleveraged in the developed world, many have now started to slow.
For the leaders of dynamic businesses searching for international growth opportunities, this presents a challenge. The rebalancing of China’s economy away from heavy investment towards consumption signalled the end of the commodity supercycle dampening growth prospects of major exporters from South America to Australia via Africa and Eastern Europe. Meanwhile, the eurozone and Japan are struggling for any sort of growth, leaving consumers in the United States - where the economy is growing robustly despite the strong dollar - increasingly important to driving global demand.
Despite tepid global growth, some markets have expanded rapidly over the past 12 months, particularly in emerging APAC. Mainland China (rank 1) leads the way, driven by GDP and consumption growth rates in excess
of 7% and a booming stock market (although this has cooled dramatically recently). India (rank 2) has risen 19 places from the previous iteration of the index, benefitting from a slump in the global oil price and a renewed focus on business-friendly reforms. Malaysia (rank 3), Vietnam
(rank 5), the Philippines (rank 6), Pakistan (rank 7) and Indonesia (rank 8) all make the top ten.
The Middle East and Africa ranks second regionally with two of Africa’s fastest growing large economies - Nigeria (rank 4) and Kenya (rank 9) - in the top ten, well ahead
League table
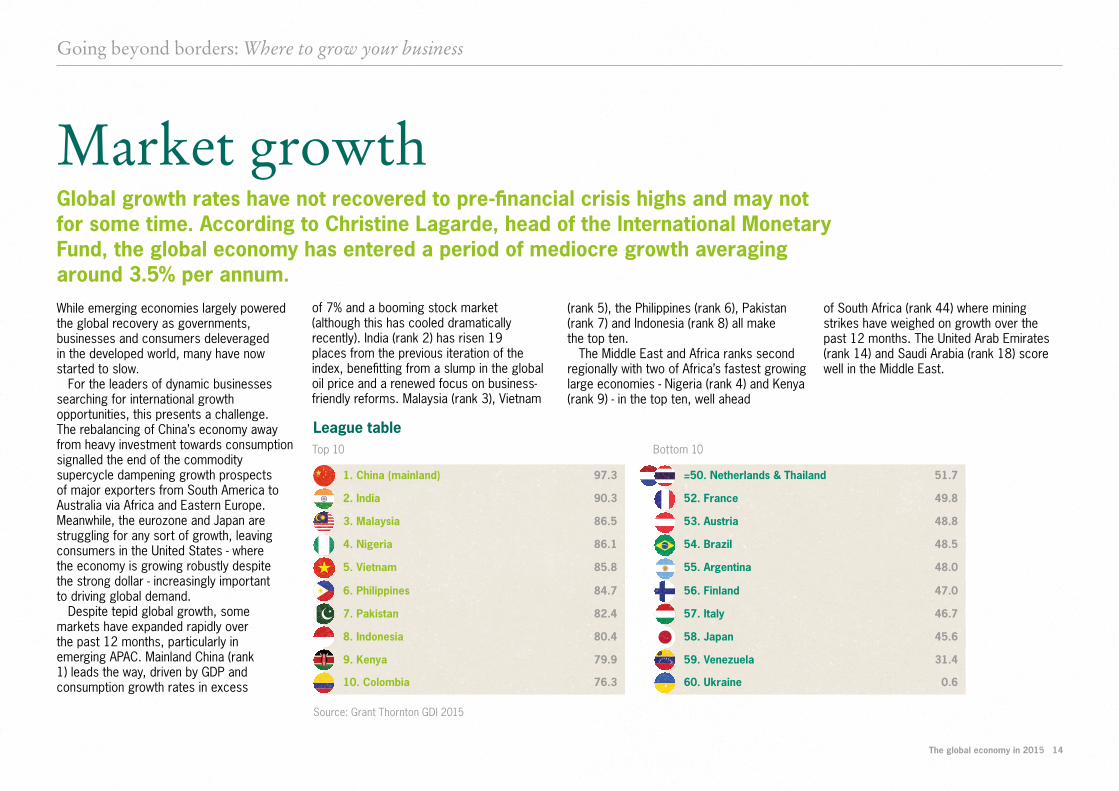
Global growth rates have not recovered to pre-financial crisis highs and may not for some time. According to Christine Lagarde, head of the International Monetary Fund, the global economy has entered a period of mediocre growth averaging around 3.5% per annum.
of South Africa (rank 44) where mining strikes have weighed on growth over the past 12 months. The United Arab Emirates (rank 14) and Saudi Arabia (rank 18) score well in the Middle East.
1. China (mainland) =50. Netherlands & Thailand97.3 51.7
2. India 52. France90.3 49.8
3. Malaysia 53. Austria86.5 48.8
4. Nigeria 54. Brazil86.1 48.5
5. Vietnam 55. Argentina85.8 48.0
6. Philippines 56. Finland84.7 47.0
7. Pakistan 57. Italy82.4 46.7
8. Indonesia 58. Japan80.4 45.6
9. Kenya 59. Venezuela79.9 31.4
10. Colombia 60. Ukraine76.3 0.6
Going beyond borders: Where to grow your business
Top 10 Bottom 10
Source: Grant Thornton GDI 2015
The global economy in 2015 15
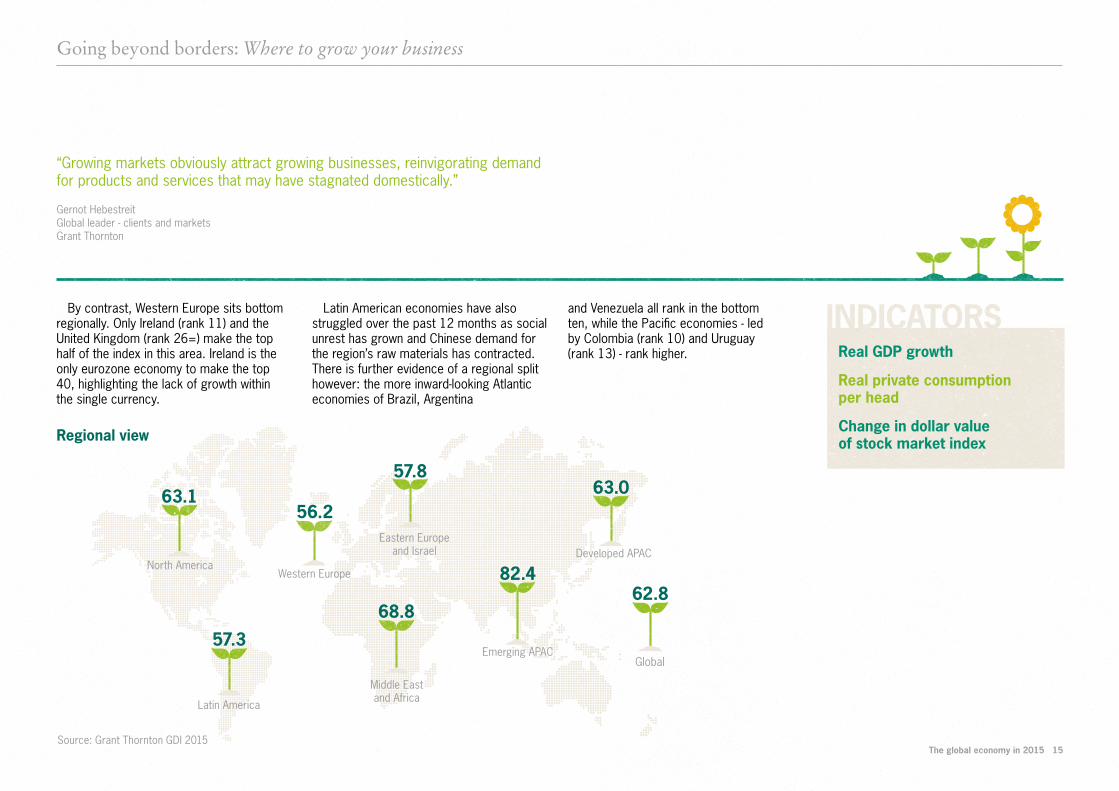
INDICATORSBy contrast, Western Europe sits bottom regionally. Only Ireland (rank 11) and the United Kingdom (rank 26=) make the top half of the index in this area. Ireland is the only eurozone economy to make the top 40, highlighting the lack of growth within the single currency.
Latin American economies have also struggled over the past 12 months as social unrest has grown and Chinese demand for the region’s raw materials has contracted. There is further evidence of a regional split however: the more inward-looking Atlantic economies of Brazil, Argentina
and Venezuela all rank in the bottom ten, while the Pacific economies - led by Colombia (rank 10) and Uruguay (rank 13) - rank higher.
Going beyond borders: Where to grow your business
“Growing markets obviously attract growing businesses, reinvigorating demand for products and services that may have stagnated domestically.”
Gernot Hebestreit Global leader - clients and markets Grant Thornton
North America
Latin America
Global
Western Europe
Middle East and Africa
Emerging APAC
Developed APACEastern Europe
and Israel
Regional view
Real GDP growth
Real private consumption per head
Change in dollar value of stock market index
Source: Grant Thornton GDI 2015
63.1
57.3
56.2
57.8
82.4
68.8
63.0
62.8
© 2015 Grant Thornton International Ltd.
‘Grant Thornton’ refers to the brand under which the Grant Thornton member firms provide assurance, tax and advisory services to theirclients and/or refers to one or more member firms, as the context requires.
Grant Thornton International Ltd (GTIL) and the member firms are not a worldwide partnership. GTIL and each member firm is a separate legal entity. Services are delivered by the member firms. GTIL does not provideservices to clients. GTIL and its member firms are not agents of, and do not obligate, one another and are not liable for one another’s acts or omissions.
www.grantthornton.global
Curious Agency 1507-07
MethodologyAbout us
Carol BriggsSenior manager - global thought leadershipGrant Thornton International LtdT +44 (0)20 7391 9511 E [email protected]
IndicatorsGrowth categories and indicators were selected on the basis of expert analysis by the Economist Intelligence Unit (EIU). Indicators are drawn from a variety of sources, including: the EIU, the World Bank, Thomson Financial and UNESCO. A full list of indicators and sources are available via www.grantthornton.global.
Data modellingModelling the indicators and categories results in scores of 0-100 for each country, where 100 represents the most dynamic environment and 0 the lowest. The overall score, as well as the category scores, are averages of the normalised scores for each of the indicators. Each economy is then ranked according to these scores. Indicator scores are normalised and then aggregated across categories to enable a comparison of broader concepts across countries. Normalisation rebases the raw indicator to a common unit so that it can be aggregated. The indicators for which a higher value means a more favourable environment eg. real GDP growth have been normalised on the basis of: x = (x-Min(x)) / (Max(x) – Min(x)), where Min(x) and Max(x) are respectively the lowest and highest values in the 60 economies for any given indicator. The normalised value is then transformed to 0-1 to a 0-100 score to make it directly comparable with other indicators. This in effect means that the country with the highest raw data value will score 100, and the lowest scores 0. The indicators for which a lower value means a more favourable environment eg. unemployment, have been normalised on the basis of: x = ((Max(x) – x) / (Max(x) – Min(x)).
Weighting indicatorsA survey of 406 senior executives was conducted by the EIU. Respondents were asked to assign an importance to each of the indicators for their company which was used to calculate a weigh for each indicator. Each growth category was weighted evenly.
More information:International expansion hub: www.grantthornton.globalData visualisation tool: www.globaldynamismindex.com
As a $4.7bn global organisation of member firms with 40,000 people in over 130 countries, Grant Thornton has the scale to meet your changing needs, but with the insight and agility that helps you to stay one step ahead. In our International expansion hub you will find thought leadership, doing business guides and country contact details to help inform your next business location decision.