Embed Size (px)
Citation preview


Flying off Course
Flying off Course
The Economics of InternationalAirlines(2nd Edition)
RIGAS DOGANIS
London and New York

First published 1985 by HarperCollins AcademicSecond edition 1991
This edition published in the Taylor & Francis e-Library, 2005.
“To purchase your own copy of this or any of Taylor & Francis or Routledge’s collection ofthousands of eBooks please go to www.eBookstore.tandf.co.uk.”
Simultaneously published in the USA and Canadaby Routledge
29 West 35th Street, New York, NY 10001
© 1985, 1991 Rigas Doganis
All rights reserved. No part of this book may be reprinted orreproduced or utilised in any form or by any electronic, mechanical, orother means, now known or hereafter invented, including photocopyingand recording, or in any information storage or retrieval system, without
permission in writing from the publishers.
British Library Cataloguing in Publication DataA catalogue record for this book is available from the British Library
Library of Congress Cataloging in Publication DataA catalog record for this book is available from the Library of Congress
ISBN 0-203-97619-3 Master e-book ISBN
ISBN 0-415-08439-3 (Print Edition)

Contents
Acknowledgements viii
Introduction ix
1 Characteristics and Trends in Airline Operations 1
1.1 Rapid technological change 1
1.2 The impact of technological change 3
1.3 High-growth industry 7
1.4 Rapid growth of non-scheduled operations 10
1.5 Marginal profitability 16
1.6 The nature of the airline product 19
1.7 Passengers, freight or mail 20
2 The Regulation of International Air Transport 22
2.1 Non-economic regulations 22
2.2 The growth of economic regulation 24
2.3 Bilateral air services agreements 25
2.4 Inter-airline pooling agreements 28
2.5 Inter-airline royalty agreements 31
2.6 The role of IATA 33
2.7 Limited regulation of non-scheduled air services 37
2.8 The economic consequences of international regulation 39
3 Deregulation and its Impact on the Industry 43
3.1 The case for and against regulation 43
3.2 The regulatory system under pressure after 1972 45
3.3 Moves towards deregulation 48

3.4 Reversal of US aviation policy 49
3.5 New concepts in international regulation 51
3.6 Bermuda 2: the United States-United Kingdom bilateral 53
3.7 Deregulation through bilateral renegotiation 54
3.8 The Show Cause Order and the declining influence of IATA 57
3.9 Deregulation spreading 58
3.10 The impact of international deregulation on the North Atlantic andtranspacific
61
3.11 Competition in international air transport in theory and practice 70
4 1992 and All That—Liberalization in Europe 74
4.1 The focus switches to Europe 74
4.2 Bilateral liberalization 74
4.3 Multilateral liberalization 77
4.4 The impact of deregulation on European air transport 88
5 The Structure of Airline Costs 100
5.1 The need for costing 100
5.2 The traditional approach to airline costs 101
5.3 Trends in airline costs 110
5.4 The concept of ‘escapability’ 112
5.5 Allocation of costs 117
6 Determinants of Airline Costs 120
6.1 Management control of costs 120
6.2 Externally determined input costs 123
6.3 The influence of demand on costs 134
6.4 Aircraft type and characteristics 135
6.5 Pattern of operations 144
6.6 Marketing policy 152
6.7 Financial policies 158
6.8 The quality of management 162
7 The Economics of Passenger Charters 164
v

7.1 The nature of non-scheduled passenger services 164
7.2 The charter airlines 167
7.3 Non-scheduled cost advantages 170
7.4 The Cascade and Reverse Cascade studies 178
7.5 Planning and financial advantages 181
7.6 Charter versus scheduled competition 184
8 Airline Marketing—The Role of Passenger Demand 188
8.1 The interaction of supply and demand 188
8.2 The role of airline marketing 190
8.3 The pattern of air travel 192
8.4 Socioeconomic characteristics 194
8.5 Market segmentation 195
8.6 The peak problem 198
8.7 Factors affecting passenger demand 203
8.8 Income and price elasticities of demand 207
9 Forecasting Demand 216
9.1 The need for forecasts 216
9.2 Qualitative methods 218
9.3 Time-series projections 220
9.4 Causal models 230
9.5 Choice of forecasting technique 240
10 Product Planning 244
10.1 Key product features 244
10.2 Schedule-based features 245
10.3 The hub-and-spoke concept 248
10.4 Comfort-based product features 252
10.5 Convenience features and the role of CRS 256
10.6 Airline image 262
11 Pricing Policies and Fare Structures 263
vi

11.1 Objectives of airline pricing policy 263
11.2 The inherent instability of airline tariffs 265
11.3 Alternative pricing strategies 267
11.4 Setting passenger tariffs 270
11.5 Choice of price and product strategies 276
11.6 Passenger fare structures 277
11.7 The role of yield management 283
11.8 Geographical differences in fare levels 288
11.9 Determinants of airline passenger yields 290
12 The Economics of Air Freight 296
12.1 Air freight trends 296
12.2 The challenge of the integrated carriers 300
12.3 The demand for air freight services 302
12.4 The role of freight forwarders 306
12.5 The economics of supply 309
12.6 Pricing of air freight 314
12.7 Future prospects 319
13 Future Problems and Prospects 320
Appendix A: Freedoms of the Air 324
Appendix B: Definition of Airline Terms 325
Bibliography 327
Index 333
vii

Acknowledgements
The international airline industry is complex, dynamic and subject to rapidchange and innovation. To understand its economic and operational features onemust be close to its pulse-beat. In this I have been fortunate: for over 15 years Ihave been lecturing at the Royal Aeronautical Society’s Air Transport Courseheld annually at Oxford and at the similar course in Manila organized for theOrient Airlines Association by the Asian Institute of Management. These coursesbring together each year a group of managers with wide international experiencefrom various fields of air transport. They provide an open forum for frankdiscussion of airline trends and problems, where established truths are constantlyquestioned. I am indebted to the numerous participants at Oxford and Manilawho, through their comments and questions, have helped me gain a deeperinsight into the workings of the airline business. For the same reasons I wouldlike to thank my former students at the Polytechnic of Central London and theparticipants of the various in-house air transport courses I have taught for airlinessuch as SIA, Malaysia Airlines, Thai International and others.
In the years of my involvement with air transport there have been so manywho have influenced my thoughts that it is difficult to mention them all. But Iwould like to single out Stephen Wheatcroft, Peter Smith, Professor Bobby Limand Tom Bass. Over many years they have given me the benefit of their wideaviation experience and have always been willing to discuss new ideas andconcepts. In addition I would like to thank Anne Graham and Dr Nigel Dennis,of the Air Transport Unit at the Polytechnic of Central London, who havegenerated much original research. This book has benefited significantly fromtheir work and valued comments. Thanks are also due to the staff of the CivilAviation Authority’s Library in London. They have always been most helpfuland willing to search for obscure articles and statistics that no one else has everasked for. The library undoubtedly provides an invaluable service to the airtransport industry and to researchers. I am also indebted to Airbus Industrie fortheir help with some of the diagrams in Chapter 6.
Lastly, I am grateful to my wife Sally, who, with her television journalist’sflair and abandon—‘don’t let the facts get in the way of a good story’—hasalways encouraged me in writing this book. I am also thankful to Dimitri andChloe for their understanding and for not taking me too seriously.

Introduction
In the five years since the first edition of this book appeared the internationalairline industry has changed dramatically. The trend towards deregulation hasbecome widespread and has brought with it new operating practices andmanagement concepts. This second edition sets out to reflect these changes.
A great deal in the book is entirely new. The title, however, remains the same!The first edition appeared in 1985 at the end of a period of unprecedented lossesin the international airline industry. The title ‘Flying off Course’ pinpointed theapparent inability of airline managers effectively to match supply of and demandfor air transport so as to generate profits. After 1986 the profitability of theindustry world wide improved dramatically. The managers seemed to have got itright. Is the title of the book still justified and relevant? The answer must be yes,because as the 1990s progress more and more airlines will see their profitsreduced or disappear altogether. Yet as the 1980s ended the industry was buzzingwith success and looking forward to continued, if less rapid, growth.
During the last 35 years the airline industry has undergone an expansionunrivalled by any other form of public transport. Its rate of technological changehas been exceptional. This has resulted in falling costs and fares, which havestimulated a very rapid growth in demand for its services—a seeminglyinsatiable demand. In addition, for much of the period scheduled airlines haveenjoyed considerable protection from both internal and external competition.Any other industry faced with such high growth of demand for its products whilecushioned from competition would be heady with the thought of present and futureprofits. But not the airline industry. It is an exception to the rule. High growthhas for the most part spelt low profits. Increased demand has not resulted infinancial success. While some airlines have consistently managed to stay well inthe black, the industry as a whole has been only marginally profitable.
The conundrum of high growth and poor financial performance, whichcharacterizes the airline industry, is the background to this book. It is partlyexplained by some of the problems facing the industry recently. The mostdramatic have been the increase in fuel prices in 1974 and 1978/9 and the worldeconomic recession which followed. That recession coincided with the easing ofmany of the economic regulations and controls on air services. Thishappened most dramatically and rapidly in the United States from 1978 onwards

and in Europe somewhat more gradually after 1983. But many other states alsocaught the bug. Liberalization has affected most of the major international airmarkets. Its effects even spilled over into countries that viewed deregulation withdisfavour. While coping with these external difficulties the international airlineindustry was itself undergoing structural changes. The late 1960s onwards saw adramatic growth in the charter services, particularly within Europe and on theNorth Atlantic, and the emergence of large but low-cost charter airlines. Whilethe growth of charters on transatlantic routes was stemmed and reversed as aresult of liberalization of scheduled services, this has not happened with intra-European charter services. Equally worrying for the established scheduledcarriers was the emergence during the latter part of this period of new dynamicand low-cost airlines in some Third World countries, notably in South East Asia.The East Asian carriers rapidly captured a growing share of the long-haulmarkets to and from the Pacific rim.
After 1986 the economic fortunes of the international airline industryimproved significantly and for two or three years profits shot up. This marketturn-round was due essentially to two external factors—a fall in the real price ofaviation fuel and a sudden acceleration in the demand for air services. The surgein demand caught most airlines unawares and short of capacity. Load factorswent up and this pushed profits up too. However, by 1990 some of the majorairlines were beginning to look less healthy again. Moreover in the period 1990–94 a huge number of aircraft (about 1,900 in all) ordered when growth rates hadpicked up after 1987 were due to be delivered. Would the airlines be able togenerate sufficient demand to fill these aircraft? Or, as in previous decades,would a surge in new capacity lead to a collapse of profit margins? Furtheruncertainty was created by the Gulf War which broke out in January 1991.
There is no simple explanation of the apparent contradiction between theindustry’s rapid growth and its marginal profitability during the last 30 years.But, for the individual airline, financial success depends on matching supply anddemand in a way which is both efficient and profitable. This is the underlyingtheme and focus of the book. While airline managements have considerablecontrol over the supply of air services, they have relatively little control over thedemand. Hence the matching process is not an easy one. To help inunderstanding the process the present book provides a practical insight into keyaspects of airline operations and planning within the conceptional framework ofeconomics.
The book works through the issues logically. Any understanding of theeconomics of the industry must start with the regulatory framework whichcircumscribes and constrains airlines’ freedom of action (Chapter 2). Thoseconstraints have been loosened on international routes to and from the UnitedStates following deregulation and are in the process of being eroded in Europe(Chapters 3 and 4). To match the supply of air services with the demandsuccessfully it is essential to understand both airline costs and the factors thataffect them (Chapters 5 and 6) and the nature of the demand. Understanding
x

demand is the first step in the marketing process (Chapter 8). A thoroughappreciation of demand must also be used to develop traffic and other forecasts,since every activity within an airline ultimately stems from a forecast(Chapter 9). Supply and demand are brought together in a number of ways butmost crucially through effective product planning (Chapter 10). Price is a keyelement of the airline product or service. Alternative airline pricing policies andstrategies need careful consideration (Chapter 11). While the emphasisthroughout is on scheduled operations, a large part of international air transportis now provided by charter or non-scheduled services. The particularcharacteristics and advantages of such services require special attention(Chapter 7), as do certain aspects of air freight (Chapter 12). The book beginswith the theme of this introduction. It examines the underlying trends in theairline industry, including its rapid technological change, the high growth ratesand the marginal profitability.
The book is concerned primarily with international air transport, whichaccounts world wide for about half the industry’s output. Only for the airlines ofa few large countries such as the USA, the Soviet Union, Brazil and China aredomestic operations of greater significance than international. United States’airlines and Aeroflot alone account for three-quarters of the world’s domesticoperations. The airlines of most other countries mainly run international airservices, while several of them operate only internationally.
The US domestic airline industry has clearly undergone rapid and far-reachingchanges since it was deregulated in 1978. Numerous articles, papers and bookshave analysed and considered the implications of those changes (for example,Button, 1989). It is for this reason that the present book does not deal directlywith US domestic deregulation except where it impinges on international airlineoperations.
There is no magic wand to ensure success within the international airlineindustry. This book attempts to flesh out the economic and operational issueswhich must be understood in order to match supply and demand. Only when thishas been done can there be some measure of success in this most dynamic ofindustries. So come, fly with me.
xi

Flying off Course

1Characteristics and Trends in Airline
Operations
1.1Rapid technological change
In the last 50 years technological innovation in air transport has far outstrippedthat in any other transport mode. The only comparable innovations elsewherehave been the emergence of the supertankers in shipping and the development ofhigh-speed trains, though the impact of the latter is still only marginal.Innovation in aviation has centred on the development of the jet engine for civiluse, first in a turbo propeller form and later as a pure jet. Successivedevelopments in the jet engine have consistently improved its efficiency andpropulsive power. The emergence of larger and more powerful engines inassociation with improvements in airframe design and in control systems hasresulted in successive improvements in aircraft speed and size. Higher speedsand larger aircraft have in turn produced significant jumps in aircraftproductivity. This is evident in Table 1.1. Even in the era of the piston engine,dramatic improvements were made, so that the hourly productivity of the SuperConstellation was seven times greater than that of the Douglas DC-3. The earlyturbo-prop aircraft also significantly improved productivity. Though theViscount’s productivity was less than that of the Super Constellation, as a DC-3replacement the Viscount’s productivity was four times as great. Likewise, theBritannias were a significant improvement on the Super Constellations they weremeant to replace.
The arrival of the turbo-jet engine had a twofold impact. In the early 1960s theturbo-jets led to a dramatic increase in speeds, while the size of the aircraft didnot increase appreciably. In the later 1960s and early 1970s there was noappreciable increase in speeds, because existing speeds were approaching thesound barrier, but there was a significant increase in the size of aircraft. Theseearlier increases in aircraft speed and the later increases in size together producedmajor improvements in aircraft productivity so that while the Boeing 720B in1960 was producing 11,000 tonne-kilometres per flying hour, only 10 years laterthe hourly productivity of the Boeing 747 was three times as great.
The next major breakthrough was the production of civil aircraft

Table 1.1 Impact of technological advance on aircraft productivity
Aircrafttype
Year ofentryintoservice
Meancruisespeed(km/h)
Maximumpayloada
Passenger payload
Hourlyproductivity (t-km/h)
Annualproductionb (000t-km)
Piston DC-3 1936 282 2.7 21 527 1,581Lockheed 1049SuperConstellation
1952 499 11.0 47–94 3,790 11,370
Turbo-prop
Viscount700
1953 523 5.9 40–53 2,100 6,300
Britannia 310
1956 571 15.6 52–133 6,048 18,144
Turbo-jet
Caravelle VI R
1959 816 8.3 52–94 4,600 13,800
Boeing720 B
1960 883 18.7 115–149
11,256 33,770
DouglasDC-8–63
1968 935 30.6 259 19,500 58,470
Boeing747
1969 948 49.5 340–493
31,935 95,805
DouglasDC-10
1971 915 38.8 400 24,130 72,400
AirbusA300
1974 891 31.8 245 19,270 57,811
Boeing747–300
1983 948 67.8 660 44,350 133,050
AirbusA320
1988 903 20.7 179 12,900 38,700
Concorde
1976 2,236 12.7 110 19,346 58,040
Notes:a Later versions or developments of these aircraft may have had different maximum or
passenger payloads.b Calculated on the basis of an average block speed assumed to be about 68–69 per cent
of the cruise speed. This is likely to be an under. estimate for aircraft onmedium- or long-haul sectors. Assume 3,000 flying hours.
Source: Compiled by author.
flying faster than the speed of sound. The Anglo-French Concorde, whichentered service in 1976, flies more than twice as fast as its predecessors. Yet it isable to do this only through a very significant reduction in size. Because of thispenalty, supersonic aircraft have a lower hourly productivity than their
2 CHARACTERISTICS AND TRENDS IN AIRLINE OPERATIONS

competitors on long-haul routes. It is this factor which makes their commercialviability so problematical.
From the mid-1970s onwards the rate of technological innovation slackened.Attention switched from the long-haul end of the aircraft market to thedevelopment of more efficient short- to medium-haul aircraft such as the Boeing767 and the Airbus A310. Developments here were based essentially on existingengine and airframe technology, though there were major developments inavionics, the use of lighter composite materials in airframe construction andother areas. At the same time, the trend towards larger aircraft flying at the samespeed continues. An example is the Airbus A320 introduced in 1988, which, withup to 180 seats, is significantly larger than the 100–130 seater aircraft it isintended to replace. Thus important gains in hourly productivity continue to bemade as airlines switch to larger newer aircraft types.
The other important development since the mid-1980s has been theintroduction of extended range versions of the newer twin-engined jets such asthe Boeing 767. These allow more direct non-stop flights on thinner long-haulroutes that could not support the large traditional long-haul aircraft such as theBoeing 747.
1.2The impact of technological change
These developments described so briefly above, which were matched by equallyrapid innovations in other areas of aviation technology in the air and on theground, were due primarily to the increasing efficiency of the jet engine. For agiven level of propulsive thrust successive engines were able to carry a largerpayload and to carry it faster as well. This, combined with other economiesarising from the greater size of aircraft, resulted in ever-decreasing costs percapacity tonne-kilometre. Herein lies the significance of the technologicalimprovements in aviation and of the increase in aircraft productivity which theymade possible. They enabled airlines to cut their costs of production steadilythroughout the 1950s and 1960s both in current values and in real terms(Figure 1.1). During the 1970s, airline unit costs expressed in current valuesbegan to rise rapidly as a result of world inflation. They rose particularly sharplyfollowing the fuel crises of 1973 and 1978. The airlines tried to counteract theupward pressure on costs by the accelerated introduction of more modern andusually larger jet aircraft and by more effective cost control. As a result, airlinecosts did not rise as rapidly as world prices, so that in real or constant valueterms airline costs during the 1970s remained stable or moved slowlydownwards (Figure 1.1). In the 1980s the price of fuel began to decline in realterms, falling particularly sharply in 1986. It then fluctuated around this low1986 level. Helped by both the switch to larger aircraft and the fall in the realprice of fuel, airline costs again declined in constant value terms during the early1980s but stabilized in the second half of the decade.
FLYING OFF COURSE 3

The technological developments in aviation, while they were beneficial intheir impact on operating costs and in improving safety, also created problems. Theincreasing size and capacity of aircraft and the speed with which new, largeraircraft were introduced, often in reaction to competition from other airlines,
Figure 1.1 Trends in unit operating costs on services of ICAO scheduled airlines, 1960–88
Note: Current values adjusted to constant 1985 values using OECD Consumer Price Index(excluding Turkey).
Source: Compiled using ICAO data.
4 CHARACTERISTICS AND TRENDS IN AIRLINE OPERATIONS

created a strong downward pressure on load factors. Average load factors ofICAO (International Civil Aviation Organization) scheduled airlines droppedfrom a level of around 60 per cent in the early 1950s to levels below 48 per centby 1969 (Figure 1.2). There was a significant fall in load factors between 1960and 1963 with the widespread introduction of the first general jets, and thenagain between 1968 and 1971 with the introduction of the early wide-bodied jets.Both these periods of overcapacity were marked by sharply falling profitmargins. The airlines did not learn their lesson until 1973 or 1974. It was onlythen that, in a major effort to counteract the effects of cost inflation, airlines cuttheir frequencies, often dramatically as more Boeing 747s, DC-10s or LockheedTristars were introduced into service. By the late 1970s load factors began toapproach the 60 per cent level again. But deregulation of air services, particularlyon the North Atlantic and transPacific routes, with the resultant increase in thenumber of carriers in many markets combined with a general world recession,pushed overall load factors down in the early 1980s. They then rose slowly in thesecond half of the 1980s and steadied at around 60–61 per cent. This means thatmore than a third of airline capacity each year is wasted.
The technical innovations also posed the problem of financing the new capitalinvestments which they made necessary. While the operating costs per capacitytonne-kilometre were falling there was a very rapid escalation in the capital costof new aircraft. Whereas up to the mid 1950s, with aircraft costing up to $2million, airlines had been able to finance their purchases either by borrowingfrom the banks or from their governments or through the world’s stock markets,this became increasingly difficult as aircraft prices escalated. By 1974, a 189-seater Boeing 727–200 cost the airlines $8–9 million. (Note: throughout thisbook all references to dollars are US dollars unless otherwise specified.) Tenyears later, in 1984, the same airlines were having to pay around $45 million fora 265-seater Airbus A310 with spares to replace their 727s. By 1990 the price forthe same aircraft was up to $60 million. In the early 1970s a fleet of five smallshort-haul aircraft would have cost about $45 million. A similar fleet 10 yearslater cost over $200 million. In 1981 Singapore Airlines ordered eight Boeing747-SUDs and six Airbus A300s at a total cost of $1.8 billion. In 1990 the sameairline ordered 50 aircraft costing $8.6 billion for delivery between 1994 and1999. These figures are indicative of the scale of investment necessary from theend of the 1970s onwards for a large international airline. Not only did aircraftprices escalate but interest rates also escalated from 4 to 6 per cent per annum inthe early 1970s to a peak of over 16 per cent, though they decreasedsubsequently and were around 9–12 per cent for most of the 1980s.
Two developments eased the problem of raising capital on this scale. First, theaircraft manufacturers became increasingly involved with raising capital fortheir customers, either through the commercial banks in their own country orthrough special export trade banks, such as the United States Export-ImportBank. Manufacturers vied with each other to get better financing arrangementsfor their clients, and the terms of such purchase loans became an increasingly
FLYING OFF COURSE 5

important factor for airlines in making a choice between aircraft. Secondly, thereemerged consortia of banks which purchased aircraft and then leased them to theairlines. The consortia enjoyed tax concessions and also retained ownership ofthe aircraft, which was a valuable security at a time when the resale value ofaircraft was high. During the 1980s these bank consortia were overtaken by therapid growth of aircraft leasing companies, the largest of which were GuinnessPeat Aviation (GPA) based in Ireland and the International Lease FinanceCorporation in California (ILFC). It was estimated that by 1991 about 20 percent of the world’s commercial airliners were being used under various operatingleases.
Figure 1.2 Overall load factors on services of ICAO scheduled airlines, 1960–88
Source: Compiled using ICAO data.
6 CHARACTERISTICS AND TRENDS IN AIRLINE OPERATIONS
Even when the industry as a whole was doing badly or a particular airline’sresults were poor, the manufacturers’ need to sell inevitably ensured that financewould be forthcoming. But for the airlines this was a mixed blessing. It pushedthem to invest when they should have been holding back. The result was that bythe early 1980s many major airlines were heavily over-indebted. In other words,the ratio of their debts to their equity capital became much too high. When trafficfailed to reach the forecast levels, airlines were no longer able to service thesehuge debts. Several carriers, such as Braniff and Laker in 1982, collapsedsuddenly as their creditors ran out of patience and refused to reschedule debtrepayments.
The low traffic growth rates achieved by many international airlines during theearly 1980s resulted in a slackening off of new aircraft orders. Then the highgrowth rates of 1986–9 generated a boom in orders led by the bigger airlines andthe aircraft leasing companies, which placed particularly large orders on behalfof existing and prospective customers. Many of these customers were the smallairlines which were unable to self-finance new purchases or to get such good dealselsewhere as they could through the leasing companies. By the beginning of1990 there were outstanding orders for close on 7,000 jet airliners for delivery inthe 10 years between 1990 and 2001. The projected annual delivery rate of about700 a year was almost double that achieved during the 1980s (AM, 1989). Thishuge extra capacity coming into the world market every year was likely to havean adverse impact on load factors during the 1990s unless traffic grew morerapidly than expected or older aircraft were retired at a faster rate. Trying tomatch rapidly increasing capacity with a slower growth in demand was to be oneof the major headaches of airline managers during the 1990s.
1.3High-growth industry
Compared with most industries, the annual growth rate achieved by civil aviationhas been staggering. In the 15 years between 1955 and 1969 the annual growth intonne-kilometres performed by the world’s scheduled airlines averaged about 14per cent and only twice during that period, in 1958 and 1961, did the annualincrease drop to less than 10 per cent. This consistently high growth rate wasunmatched by any other transport mode during this period, with the possibleexception of international shipping, and that for a short time only. Since 1970 airtransport growth has slackened. In the 10-year period from 1970 to 1979 theaverage annual growth rate fell to just below 10 per cent, and in the following 10years average growth was only a little above 8 per cent per annum. But this wasstill high compared with most other industries.
The high though declining growth rates mask quite diverse growth patterns onparticular routes or in particular countries or geographical areas. Long-termregional variations in growth trends are illustrated in Table 1.2. This shows that,in terms of both international and domestic tonne-kilometres performed, the
FLYING OFF COURSE 7

European and African airlines have experienced the lowest growth rates in the 10years 1978–88. In terms of both international and domestic traffic, the Asian andPacific airlines have achieved annual growth rates well above the world average,as they had done throughout the 1970s. Some airlines within this region achievedexceptionally high average growth rates on their international traffic: for CathayPacific growth was 18 per cent per annum; and for Malaysia Airlines 15 percent.
The very rapid growth of Asian airlines completely changed the structure ofthe international airline industry. In 1973, European and North American airlinestogether generated almost three-quarters of
Table 1.2 Average annual growth rates in scheduled tonne-kilometres, 1978–88, byregion
Average annual percentage increase in:
Region of airline registration International t-km Domestic t-km
Asia and Pacific 10.4 7.6North America 8.4 5.6Middle East 5.8 5.2Latin America and Caribbean 5.8 5.1Europe 4.8 4.6Africa 4.6 3.5World 7.0 5.5Source: ICAO (1990).
scheduled international air traffic. This dominant position has been significantlyeroded. By 1988 their joint share was down to little more than 55 per cent whileduring the same 15-year period Asian and Pacific airlines increased their share ofthe world’s international traffic from 14 per cent to 29 per cent (Table 1.3).
North American airlines have ceded second place to the Asian carriers.However, the American share has actually increased slightly after reaching a lowpoint in the early 1980s as US airlines became more aggressive followingderegulation in the United States. For instance, Northwest’s international trafficgrew at an average annual rate of 21 per cent in the 10 years to 1988, faster thanany of the other top 30 international airlines.
The reasons for the relatively rapid overall growth rate of air transport are notdifficult to find. The falling level of operating costs, previously described,enabled airlines to offer tariffs that were lower in real terms. The yield oraverage fare charged per passenger-kilometre declined rapidly up to 1970 in realterms, that is in relation to the cost of other goods and services (Figure 1.3). Thisdecline occurred at a time when per capita incomes in the developed countries ofthe world were increasing at a rate of 8 per cent per annum, while discretionaryincomes were growing at an even faster rate. As a consequence, the demand for
8 CHARACTERISTICS AND TRENDS IN AIRLINE OPERATIONS

non-business air travel rose rapidly. At the same time, the 20 years to 1970 saw aboom in world trade which generated an increase both in business travel and inthe demand for air freight facilities. The fall in the real cost of freight chargeswas even more marked than the decline in the real value of passenger fares.During the 1970s the real cost of air transport in many markets continued todecline but more slowly and with some up and downs. Disposable incomes alsorose, though less rapidly than before. It was not until 1980 and the two or threeyears that followed that economic recession affecting many developed countriesbegan seriously to undermine demand and annual growth rates declinedappreciably, even though real air fares fell rapidly as a result of over-capacityand deregulation in some markets (Figure 1.3). Towards the end of the decade,however, growth of scheduled traffic began to accelerate, especially oninternational routes. International scheduled traffic grew 14 per cent in 1987 and10 per cent in 1988 and was expected to be about 9 per cent higher in 1989. Butwas this merely a short-term reaction following the poor years at the beginningof the decade, or was it an improvement in the underlying trend which wouldcontinue well into the 1990s?
Table 1.3 Regional distribution of international scheduled traffic, 1973 and 1988
Region of airline registration Percentage of total tonne-km carrieda
1973 1988
Europe 44.3 35.5b
Asia and Pacific 14.1 29.0North America 27.5 21.5Latin America/Caribbean 6.3 5.7Middle East 4.0 4.9Africa 3.8 3.4Total world 100.0 100.0Notes:a Excludes domestic traffic, where US airlines are dominant.b Inclusion of international charter traffic would push European share to around 40%.Source: ICAO (1990).
The rapid growth in air transport was characterized by two features. In thefirst place, the rate of growth of non-scheduled air transport was higher than thatof scheduled, and as a consequence non-scheduled services now account for asignificant share of the international airline industry’s total output, particularlywithin Europe. Secondly, the profitability of airlines during the last 30 years hasbeen fairly marginal despite the rapid growth of demand for their services.
FLYING OFF COURSE 9

1.4Rapid growth of non-scheduled operations
In the early postwar years non-scheduled operations were relatively unimportant.
Figure 1.3 Trends in unit revenues on services of ICAO scheduled airlines, 1960–88
Note: Constant 1985 value based on OECD Consumer Price Index (excluding Turkey).
Source: Compiled using ICAO data.
10 CHARACTERISTICS AND TRENDS IN AIRLINE OPERATIONS

Reliable figures are not available, but it is estimated that in the 1950s only about3–5 per cent of the total tonne-kilometres produced each year by the world’sairlines was generated on non-scheduled operations. These early non-scheduledoperations were largely associated with military and government charters andwith single-entity charters, that is where single persons or organizations werechartering aircraft for their own exclusive use.
In the early 1950s, developments were taking place which would dramaticallyaccelerate the development of non-scheduled traffic after 1960. Americanscheduled and supplemental (that is, charter) carriers inaugurated what came tobe known as ‘affinity charters’ across the North Atlantic. These subsequentlyspread to other long-haul markets. Such affinity charters arose when societies orclubs, whose total membership was normally limited to 20,000 members andwhose prime purpose was other than travel, chartered aircraft for their memberswho shared the cost equally. In the United States, the 1938 Civil Aeronautics Acthad allowed non-scheduled operations under a general exemption fromregulations which affected scheduled carriers. But in 1962 Public Law 87–528confined the role of supplemental carriers exclusively to non-scheduledoperations and authorized the Civil Aeronautics Board (CAB) to certifysupplemental carriers to operate in designated geographical areas. In time, 13supplemental carriers were certified. The final breakthrough came in 1968 withthe Inclusive Tour Charter Bill, which empowered the CAB to authorize theoperation of inclusive tour charters (ITCs), though the CAB had already beendoing this for two years. An inclusive tour is a holiday package where a singlecharge includes travel, hotel accommodation and possibly local ground transport,visits, etc. Rapidly developing new holiday markets with affinity group chartersand ITCs and, at the same time, bolstered by the operation of substantial militarycharters in support of the Vietnam war, United States non-scheduled operationsgrew at a phenomenal rate. Between 1964 and 1967 total passenger milesoperated by the US supplementals quadrupled. High growth continued until about1971 when military charters began to decline.
The European airlines, meanwhile, has based their own non-scheduledoperations on inclusive tour charters, and were less dependent than theirAmerican counterparts on affinity group or military charters. The developmentof ITCs by the British private airlines in the early 1950s was followed by theformation of charter companies in Scandinavia and later in Germany andelsewhere. These and other companies concentrated on the carriage of high-density ITC traffics between northern and western Europe and the resorts of theMediterranean, especially those of Spain and Italy, and, to a much lesser extent,those of Greece, Yugoslavia and Tunisia. Growth was rapid, especially after1965 when the charter companies began to introduce the most modern jetequipment. Between 1965 and 1973 ITC traffic in Europe grew at an averageannual rate of 25 per cent, which was more than double the growth rate ofscheduled intra-European traffic (Cambau and Lefevre, 1981). The Europeanairlines, both scheduled and non-scheduled, began to develop long-haul charters
FLYING OFF COURSE 11

across the Atlantic and, to a limited extent, to Africa and the Far East. Thesewere to a large extent affinity group charters, though ITCs also played a part.
The expansion of non-scheduled services was facilitated in the early 1970s bythe trend in the United States and some countries in Europe towards theliberalization of often arbitrary regulations limiting passenger access to charterflights. Growing much more rapidly than scheduled services, non-scheduledoperations captured an increasing share of the total international air traffic. By1972 it was estimated that 31 per cent of international passenger traffic wascarried on non-scheduled services (ICAO, 1974). That was the peakpenetration achieved by non-scheduled carriers. From then on the charter shareof the total passenger market gradually declined to a level of about 16–20 percent. In 1988 it was 18.5 per cent (ICAO, 1990).
This relative decline of non-scheduled traffic in the 1970s can be explained bytwo parallel developments. First, in the years after the fuel crisis of 1973–4 thehighest growth rates were experienced in markets where non-scheduled serviceswere basically not permitted by the regulatory authorities, namely in the MiddleEast and in the Asia-Pacific region. High growth in these regions was therebyinevitably concentrated on scheduled services. Secondly, the furtherdevelopment of non-scheduled traffic in its two major markets either sloweddown, which was the case in Europe, or actually went into decline, whichhappened on the North Atlantic route.
Liberalization of charter regulations had resulted in a rapid growth of non-scheduled traffic on the North Atlantic route (Table 1.4). Despite a hiccup in1974, charter traffic grew faster than scheduled traffic until 1977, when itrepresented 29.2 per cent of the total passenger traffic on the route. Then in 1978the charter market collapsed. This was a direct result of deregulation of fares andentry on many North Atlantic scheduled routes. Several new low-cost airlines,such as Laker Airways, began operating scheduled services. Competitivepressure pushed both new and existing scheduled carriers to offer fares whichwere charter competitive. With little price advantage to offer, charter airlinesfound their traffic shrinking rapidly. It was not until 1982 that they managed toslow the decline, but only for a time. The Chernobyl nuclear disaster and fears ofterrorism in 1986 affected the volatile charter market more than the scheduledservices and charters’ decline continued. By 1988 only 2 million passengerstravelled across the Atlantic on charter flights, half the number that had usedcharter flights at their peak in 1977.
In Europe, the much higher rate of growth of non-scheduled traffic, mentionedearlier, had gradually pushed up the charter airlines’ share of internationalpassenger traffic. By 1973 for the first time non-scheduled passenger-kilometreson international charters in Europe exceeded passenger-kilometres generated byinternational scheduled services (Cambau and Lefevre, 1981). But in 1973–4 thefirst oil crisis hit the non-scheduled sector of the market much harder than thescheduled sector. The ITC passengers were more price sensitive and moresensitive to the economic situation than the up-market tourists and the
12 CHARACTERISTICS AND TRENDS IN AIRLINE OPERATIONS

businessmen who travelled on scheduled services. The high charter growth ratesof earlier years disappeared. Between 1974 and the end of the decade charter andscheduled international traffic grew at fairly similar rates and it was not until theend of the decade that charter traffic growth began to accelerate again. In the 10years to 1988 charter passengers in Europe grew at an average annual rate of 7.2per cent, while scheduled passenger numbers grew by 4.4 per cent each year(ICAO, 1990). But these were significantly lower overall growth rates than hasbeen achieved in earlier decades.
Table 1.4 Scheduled and non-scheduled growth rates on the North Atlantic route, 1973–88
Year Annual percentage change in passengerson:
Non-scheduled as apercentage of totalpassengers
scheduled services non-scheduled services
1973 +5.7 +11.6 26.31974 −6.4 −14.3 24.61975 −5.5 +3.1 26.21976 +10.9 +12.8 26.61977 +5.3 +20.2 29.21978 +23.4 −17.9 21.61979 +15.5 −24.8 14.81980 +5.2 −30.2 10.41981 +3.5 −7.6 9.41982 −5.2 +22.4 11.81983 +6.4 +5.7 11.71984 +12.6 +13.8 12.11985 +7.5 −13.1 9.81986 −5.9 −30.2 6.41987 +21.8 +19.6 7.01988 +9.1 +12.3 7.2Source: International Air Transport Association, Geneva.
On a number of European air routes, charter carriers have captured over 80 percent and sometimes over 90 per cent of the total air market, to the virtualexclusion of scheduled operations. This is the case on air routes from Spain toScandinavia, the UK, Germany or the Netherlands to Spain and between Greeceand the UK or Scandinavia. By far the largest single air market in Europe is thatbetween the UK and Spain, which in 1989 generated 11.1 million passengers.Nearly 9 million of these, or about 80 per cent of the total, travelled on charterflights. Here as on many other Mediterranean routes, charters are dominant. It isdifficult to obtain precise figures for the overall market split within Europe
FLYING OFF COURSE 13

between charters and scheduled services. One estimate suggests that in 1988 45per cent of air passengers within western Europe travelled on charter flights(ICAO, 1990). The charter share would decline if one considered the whole ofEurope. But, in terms of passenger-kilometres, the charter share rises to wellover half because charter services are generally operated on the longer sectorsbetween northern and Mediterranean Europe. An optimistic estimate hassuggested that in 1988 charters generated close to 70 per cent of internationalpassenger-kilometres within Europe (Burnell, 1990). Whatever the precisefigures, charters clearly represent about half the intra-European air transportmarket. Yet their importance is frequently underestimated.
Overall, non-scheduled operations have been characterized by particularfeatures. First, in the period up to the mid-1970s, non-scheduled traffic grewmuch more rapidly than scheduled. Secondly, non-scheduled operations areprimarily international. Of the total passenger-kilometres generated on non-scheduled services, 94 per cent are on international flights (ICAO, 1990). Theirshare drops to 81 per cent in terms of tonne-kilometres when freight is included.Finally, scheduled airlines play a major role in non-scheduled operations. In theearly postwar years, the bulk of the world’s non-scheduled traffic was carried bythe scheduled airlines. Then the rapid expansion of the supplemental carriers inthe United States and of the large charter airlines in Europe and elsewherepushed the scheduled carriers out of the non-scheduled markets. Scheduledcarriers were for a time constrained from entering such markets because ofregulations imposed by the International Air Transport Association (IATA) or bytheir own governments. Some scheduled airlines, especially those in Europe, setup charter subsidiaries to circumvent such regulations. Lufthansa set up Condor,Air France and Air Inter jointly owned Air Charter International, BritishEuropean Airways set up British Airtours, which later became a subsidiarycompany of British Airways, and the SAS member airlines established Scanair.
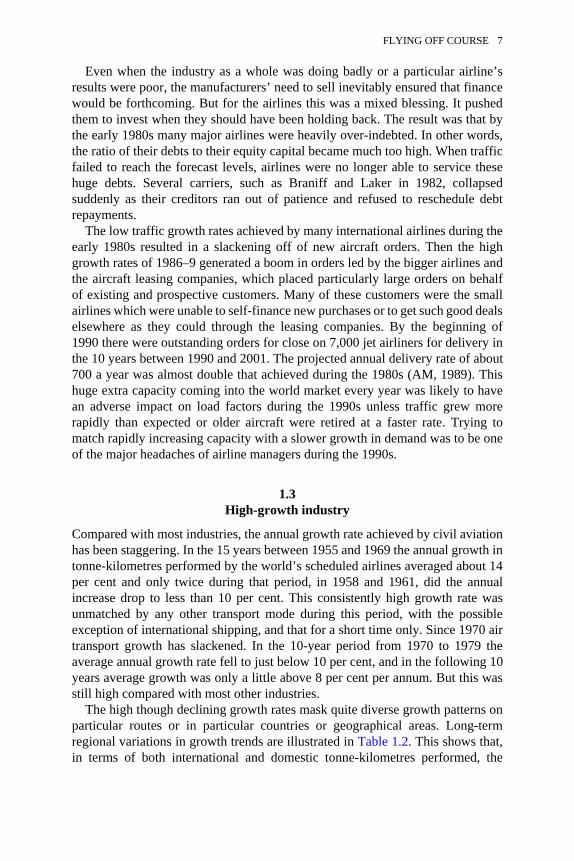
Most of these charter companies are now owned 100 per cent by theirscheduled parent airlines. But in some cases the parent company is not the soleowner. Thus Swissair owns 48.9 per cent of Balair, and KLM has a 25 per centstake in Martinair and another 40 per cent in Transavia, the two major Dutchcharter airlines. In the United States where, prior to deregulation, scheduledairlines could not by law establish charter subsidiaries, airlines such as PanAmerican Airways (Pan Am) entered charter markets in their own right, andcompeted directly with US supplemental (charter) carriers in those marketswhere the Civil Aeronautics Board (CAB) allowed them to. Outside Europe andNorth America few countries enjoyed the luxury of separate charter andscheduled carriers. The national scheduled airlines carried charter traffic asnecessary. While several very large independent non-scheduled airlines haveemerged, such as Britannia (UK), about 55 per cent of the total non-scheduledtraffic is carried either by charter subsidiaries of scheduled airlines or by airlinesthat operate both scheduled and non-scheduled services (Table 1.5).
14 CHARACTERISTICS AND TRENDS IN AIRLINE OPERATIONS
The rapid growth of non-scheduled traffic after 1965 dramatically changed thestructure of the airline industry and its pattern of operations, especially in Europe.A major problem facing airlines and
Table 1.5 Major carriers of non-scheduled passenger traffic, 1987 (millions of passenger-kilometres)
Mixed scheduled & charterairlines
Chartersubsidiaries ofscheduledairlines
Charterairlines
1 Britannia 11,4862 Condor
(Lufthansa)7,813
3 Dan Air 7,6394 LTU 7,6235 Scanair
(SAS)6,681
6 BritishAirtours(BritishAirways)
5,530
7 Sterling 5,1308 Monarch 4,8909 Hapag Lloyd 4,62210 Wardair 4,03111 Martinair 3,42612 Am. Transair 3,30213 Air Charter
(Air France)3,202
14 Finnair 3,19215 Air Europe 3,02516 Orion 2,94717 Cal Air
(BritishCaledonian)
2,413
18 Balair(Swissair)
2,130
19 Conair 2,12420 Transavia 2,092
Total top 20 non-scheduled carriers 93,298World total non-scheduled 172,340
Top 5 as % of world total 23.9%Top 20 as % of world total 54.2%
FLYING OFF COURSE 15

governments during the 1990s will be how to adapt to the changes and pressurescreated by the growth of non-scheduled operations on routes where they havebeen allowed to develop. In two major international air markets, the NorthAtlantic and more especially the Europe-Mediterranean area, charter competitionhas been and remains a worrying fact of life for the scheduled airlines. As aresult of such competition, the operational and other distinctions betweenscheduled and non-scheduled have become increasingly blurred and difficult tomaintain. But the charter airlines, mostly European, also face a major problemduring the 1990s and that is how to cope with European liberalization as itgathers pace. In the United States, deregulation in 1978 led to the virtual eclipseof the supplemental airlines (section 4.4.2 below). Will the same happen inEurope?
1.5Marginal profitability
In an industry characterized by falling unit costs and an unusually high rate ofgrowth in the demand for its products one would expect firms to obtainsubstantial profits. While this has been the case for many individual airlines, theprofitability of the airline industry world wide during the last 25 years has beenmarginal. Only in the period 1963–8 were significant profits achieved and againin 1987–9.
The traditional measure of profitability, namely the rate of return on assetsemployed, cannot be applied to the airline industry as a whole. This is because ofthe difficulty of estimating real asset values for airlines with varied depreciationpolicies, using varying proportions of leased equipment and often receiving director indirect government subsidy in a variety of forms. The measures ofprofitability normally used among airlines are either the annual operating profitor loss expressed as a percentage of the total annual operating revenue, or thetotal operating revenue expressed as a percentage of the total operatingexpenditure (known as the ‘revex ratio’). The operating profit as a percentage ofoperating revenue is calculated annually for the world’s airlines by ICAO and isshown diagrammatically in Figure 1.4. The operating profit is before interestcharges and other non-operating items. Net profit is after payment of interest andinclusion of these other items.
Between 1960 and 1989 the world airline industry experienced five distinctphases in its financial fortunes:
(1) During most of the 1960s as unit costs declined there was a dramaticimprovement in profit margins despite the falling load factors (Figure 1.2). Faresand, more important, revenue yields were also falling during this period but lessrapidly than the fall in costs.(2) By 1968 load factors on scheduled services had fallen to less than 50 per centand continued to decline. This, together with rising unit costs from 1970
16 CHARACTERISTICS AND TRENDS IN AIRLINE OPERATIONS

onwards, began to bite into the profit margins. The period 1968–75 ischaracterized by poor financial results, particularly in 1970 and 1971. As areaction to these poor results the airlines made determined efforts to improveload factors and were partially successful in this (Figure 1.2).
Attempts to improve financial results were completely upset by the fuel pricecrisis which followed the Arab-Israeli war of October 1973. The years 1974 and1975 were traumatic for the world’s airlines. In the first place, the price of fuelescalated at an alarming rate. The average fuel price paid by IATA airlinesdoubled in the four months between September 1973 and January 1974 andcontinued to increase thereafter, but at a slower rate (Figure 5.1 shows changes inthe real price of fuel since 1970). By mid-1975 airlines were paying three timesas much for fuel as they had been paying two years earlier. Second, thewidespread inflation in most of the world’s economies pushed up other areas ofoperating costs, especially those that were labour intensive. Lastly, the downturnin economic growth, particularly in Europe and the United States, resulted indeclining or very low rates of increase in real disposable income, whichadversely affected the demand for both passenger and freight transport.
Figure 1.4 Profit margins of ICAO scheduled airlines, 1960–88
Note: Net profit/loss is after inclusion of interest and other non-operating items.
Source: Compiled using ICAO data.
FLYING OFF COURSE 17

The effect of these trends was a large increase in unit costs in 1974 and 1975(Figure 1.1). Cost escalation, combined with a worldwide recession in trafficdevelopment, pushed many airlines into a struggle for financial survival. Airlinesoperating on the North Atlantic route and in Europe were particularly badly hit.In Britain, the Civil Aviation Authority concluded in its annual report that ‘thefinancial year 1974–5 was the worst in living memory—both for the civilaviation and air travel industries’. But worse was to come!
(3) In the three years 1975–8 the world’s airlines did reasonably well. Theprice of fuel and other costs declined in real terms, while demand was buoyantand load factors remained at around 55 per cent. This period of well-being wasshort lived.
(4) From 1979 to 1983 the international airlines entered a period of deep crisis.They were in the anomalous position of enjoying the highest load factors formore than 20 years, while facing increasing losses. Dramatic increases in fuelprices in 1978, combined with stagnating demand and falling yields, all helped tobring this about. The high load factors were themselves symptomatic of thecrisis, for they resulted from the industry’s attempt to compensate for thedownward pressure on fares and freight tariffs. They did not compensate enough.In 1980 the world’s airlines as a whole made an operating loss before payinginterest for the first time since 1961. Further operating losses occurred in 1981and 1982. Several airlines went bankrupt in this period, including Braniff andLaker Airways, while many others accumulated large debts or were financiallysupported by their national governments. It was not till 1984 that results began toimprove.
The curves in Figure 1.4 mask the real size of the losses incurred. After payinginterest, IATA member airlines collectively lost $1,850 million in 1980; thefollowing year the loss was $1,900 million and in 1982 it was marginally lower,at $1,800 million. While all airlines were under pressure during this period, manycontinued to operate profitably, either by achieving higher than average loadfactors or by reducing their costs in real terms, or both. This was the case withseveral of the new Third World airlines that were able to benefit from their lowlabour costs and from the high growth rates in the markets in which theyoperated. Singapore Airlines (SIA), for example, was very profitable throughoutthis period.
The declining fortunes of the international airlines from 1979 onwardscoincided with the period of liberalization of international regulations,particularly on routes to and from the United States. A major issue ofcontroversy within the airline industry was the degree to which, if any,deregulation could be blamed for the industry’s financial plight.
(5) The second half of the 1980s saw a dramatic turn-around in the airlineindustry’s fortunes, though overall profitability remained marginal. While airlinedirectors around the world gladly took credit for this turn-around, in reality itwas due primarily to two external factors, a significant fall in the real price ofaviation fuel and a surge in demand as the world’s economies improved. Airlines
18 CHARACTERISTICS AND TRENDS IN AIRLINE OPERATIONS

that had been making losses for years suddenly found themselves in profit,especially in 1987 and 1988. The underlying financial position, however, wasstill very weak because the industry as a whole and many individual airlines nowfound themselves with huge debt burdens. These arose from the need to covertheir accumulated losses during the lean years of the early 1980s and to financethe new aircraft orders they were placing as traffic growth accelerated. Hugeinterest payments were needed to finance these debt burdens. In 1987 the interestcharges of the world’s airlines totalled around $4–4.5 billion. Many governmentswhich owned their national airlines turned to privatization as a way of injectingmuch-needed equity capital into undercapitalized airlines.
The late 1980s did have one bad year in 1986 when the Chernobyl nucleardisaster, the American bombing of Libya and increased terrorism in Europe andthe Middle East let to a sharp fall in United States travel to Europe (Table 1.4). Thisadversely affected the financial results of many US and European carriers,especially those with substantial North Atlantic operations.
In short, the airline industry, which has benefited from uniquely rapid growthover the last 35 years, has actually enjoyed only two brief periods of reasonableprofitability. A large part of its current revenues are needed to finance theinterest payments on the industry’s accumulated debts. The industry’sindebtedness will worsen during the 1990s because of the large number ofaircraft orders that were placed in the late 1980s. Between 1990 and the year2000 the world’s airlines will spend close to $400 billion on aircraft. To financethese orders they would need to achieve an operating profit before interest of 6per cent each year. They have not done this since 1969, though they came closeto it in 1988 (Figure 1.4). The continuing marginal profitability of the industry,while needing to finance major capital investments, is the major problem facingthe airlines during the 1990s.
1.6The nature of the airline product
As far as passenger services are concerned, there are several contrasting aspectsto the airline product. On the one hand, the air journey is seen not as an end initself, but as part of a business trip or of a two-week summer holiday or of aweekend visit to watch a sports fixture. The air journey is a part of a variety ofother products or services. A number of important considerations flow from this.The demand for passenger air services is a derived demand in that it is dependenton the demand for these other activities (business trips, two-week holidays, tripsto sports fixtures, and so on). This means that to forecast the demand for airservices one must forecast the demand for all these other types of expenditure. Italso means that there has been strong pressure on the airlines to expand verticallyinto other areas of the travel industry—such as hotels, travel agencies, car hire ortour organizers—in order to gain greater control over the total travel product.There is also a direct effect on airline marketing techniques in the sense that
FLYING OFF COURSE 19

these are frequently oriented towards selling and promoting the total product,whether it be a business or holiday trip or a weekend excursion, rather thanselling a particular airline. In newspaper and television advertisements manyairlines try to interest the reader or viewer in a particular destination or aparticular type of trip, and only as an afterthought almost do they suggest theairline which might be used.
On the other hand, airlines have to face the realization that one airline seat isvery much like another and that there is, from the passenger’s viewpoint, littledifference between one jet aircraft and another, if they achieve similar journeytimes. Equally, for the freight forwarder the major decision will be whether toship by air or surface and, having taken the decision to use air, they may havedifficulty in perceiving any difference between the airlines serving a particularroute. Thus, while air journeys may be only one part of a variety ofheterogeneous products or services with different market structures, the airservice part of these various products is itself fairly homogeneous. Even whenairlines wish to differentiate their products, competitive and economic forces andthe fact that they are flying similar or identical aircraft have meant that they oftenend up offering very similar products.
The consequences of the homogeneous nature of the airline product aretwofold. First, in competitive markets, it pushes airlines into making costlyefforts to try to differentiate their product from that of their competitors. They dothis by being first to introduce new aircraft types, by increasing their frequency ofservice, by spending more on in-flight catering and by advertising. Moreover,much of the advertising is aimed at trying to convince passenger or freightagents that the product they offer can be differentiated from that of theircompetitors because of the friendliness of the hostesses or the culinary expertiseof their chefs, or because of other claims which are dubious and difficult toassess.
Second, the homogeneous nature of the airline product makes the emergenceof entirely new airlines or the incursion of new airlines on existing routesrelatively easy. In other words, in the absence of regulations or other economicbarriers to entry, airline markets would tend to be characterized by considerablecompetition between existing carriers and new entrants.
This dichotomy between the heterogeneity of the various products of whichthe air service is only a part and the homogeneity of the air services themselvesis a constant constraint in airline planning, a constraint which often results inapparently contradictory decisions and action by airline managements.
1.7Passengers, freight or mail
It is generally assumed that airlines are primarily concerned with carryingpassengers and that freight and mail traffic are relatively unimportant in terms bothof output and of revenue. This is far from being the truth. In 1989 over a quarter
20 CHARACTERISTICS AND TRENDS IN AIRLINE OPERATIONS

of the world’s scheduled airline output was concerned with the carriage offreight and mail (Table 1.6). Passenger traffic accounted for the rest. Oninternational routes, where distances are greater and air transport becomes morecompetitive, freight and mail’s share rises to over one-third of output.Conversely, their share is much less on domestic air services.
These global figures hide considerable variations between airlines. A fewlarge international airlines, such as Flying Tigers in the USA
Table 1.6 Distribution of traffic and revenue on scheduled services of ICAO airlines,1989
Tonne-km performed Revenue (estimated)
International%
Domestic%
All services%
All services (1988)%
Passenger 61.7 84.7 72.0 85.0Freight 36.6 12.4 25.7 13.5Mail 1.7 2.9 2.3 1.5Total 100 100 100 100.0Source: IATA (1989 and 1990).
or Cargolux, are exclusively or almost exclusively concerned with the carriage offreight. They are the exceptions. Most international airlines carry both freightand passengers. At one end of the scale are airlines such as Korean Airlines, AirFrance, Lufthansa or El Al, for which air freight represents 50–55 per cent oftheir total production in terms of tonne-kilometres. At the other end are manyairlines, such as Eastern in the USA or the Polish airline LOT, where freight andmail together account for only 5–10 per cent of total tonne-kilometres generated.
It is significant that, while freight accounts for about a quarter of total airlineproduction, it generates only about one-eighth of total operating revenue(Table 1.6). This means that the average revenue per tonne-kilometre of freightand, incidentally, of mail must be very much lower than the average revenue oryield generated by passenger tonne-kilometres. Despite this, freight revenuesmake an important contribution to many airlines’ overall profitability.
Over the airline industry as a whole, the carriage of freight is a significantfactor, both in terms of the amount of productive resources absorbed by it and interms of its contribution to overall revenues. For an individual airline the split ofits activities between passengers and freight clearly affects both its marketingpolicy and the structure of its revenues. The importance of mail revenue, however,is very limited and declining. In the early 1960s mail revenue was about 5 percent of total revenue, whereas now it is below 2 per cent. Inevitably, much of thediscussion which follows concentrates on the passenger aspects of both supplyand demand. But this should not mask the significance of air freight for theinternational airline industry as a whole.
FLYING OFF COURSE 21

2The Regulation of International Air
Transport
Airline managers are not free agents. Their actions are circumscribed by a hostof national and international regulations. These are both economic and non-economic in character and may well place severe limitations on airlines’ freedomof action. An examination of the scope and impact of such regulations is crucialto an understanding of the economics of international air transport. For more thanthree decades the regulatory framework remained largely unchanged. It wasthree sided, based on bilateral air services agreements, inter-airline agreementsand the tariff agreements of the International Air Transport Association (IATA).This chapter examines this traditional framework of economic regulation, whichin many respects still stands. Chapter 3 then considers the arguments for andagainst economic regulation and evaluates the impact of internationalderegulation which began in the United States in the late 1970s, while Chapter 4traces the development of liberalization in Europe.
2.1Non-economic regulations
The advanced level of aviation technology, the need to ensure passenger safetydespite the rapidity of technological innovation and the international nature ofmuch of the airline industry have all tended towards the introduction of morecomplex and more wide-ranging external controls and regulations than are foundin most industries. These regulations are broadly of two kinds.
First, there is a whole host of technical standards and regulations whose primeobjective is to achieve very high levels of safety in airline operations. Suchregulations cover every aspect of airline activity and, broadly speaking, they fallinto one of the following categories:
(1) Regulations which deal with the airworthiness of the aircraft not only interms of its design and production standards but also in terms of itsperformance under different operating conditions such as when there is anengine failure during take-off.

(2) Regulations covering the timing, nature and supervision of maintenance andoverhaul work and the training and qualifications of the engineers who carryout such work.
(3) Regulations governing the numbers and type of flight and cabin crew, theirduties, training and licensing and their work-loads and schedules.
(4) Detailed regulations covering both the way in which aircraft are operated (thatis, aspects such as flight preparation and in-flight procedures), and also theoperation of the airlines themselves. In all countries, air transport operatorsmust be licensed by the relevant civil aviation authority and must satisfycertain criteria and operating standards.
(5) Lastly, there is a complex profusion of regulations and recommendedstandards dealing with aviation infrastructure, such as airports,meteorological services, en route navigational facilities, and so on.
Many of the technical and safety requirements are general, that is not specific toa particular aircraft type, and are promulgated as regulations of the civil aviationdirectorates or the relevant ministries of each country. In the United States they areknown as Federal Aviation Regulations, while in the United Kingdom suchregulations appear in the Air Navigation Order (CAA, 1981). While regulationsmay vary in particular detail from one country to another, they are generallybased on a whole series of ‘lnternational Standards and Recommended Practices’produced by the International Civil Aviation Organization (ICAO) as 16 annexesto the Convention on International Civil Aviation. For instance, Annex 8 dealswith the ‘Airworthiness of Aircraft’ and Annex 1 with ‘Personnel Licensing’.These are constantly revised. As a result there tends to be considerableuniformity in the technical regulations of most member states of ICAO.
Operational and safety requirements specific to an aircraft type are containedin its flight manual. However, the operational constraints and practicesrecommended in the flight manuals conform to the more general regulationsmentioned above and are approved by the relevant national airworthinessauthorities. Among other things, the flight manual will impose payloadlimitations on an aircraft at airports with high temperatures or inadequate runwaylength. In this and numerous other ways airworthiness and other technicalregulations have direct economic repercussions.
These various technical standards and safety procedures undoubtedly constrainairline managers and, at the same time, impose cost penalties on airlineoperations. But such external controls are inevitable if high safety standards areto be maintained, and significantly all airlines are equally affected by them. Nomajor international airline can enjoy a competitive advantage by operating tolower tech-nical standards since there are no ‘flags of convenience’ in airtransport to enable airlines to circumvent national or international safety ormanning regulations.
In addition to the various technical regulations and rules, international airtransport is circumscribed by a multitude of national, bilateral and multilateral
FLYING OFF COURSE 23

regulations and agreements whose objective is the economic and, sometimes,political regulation and control of the industry. Such economic controls, unlikethe technical standards outlined above, do not affect all airlines equally and thereinlies their importance.
2.2The growth of economic regulation
When the Paris Convention, signed in 1919, accepted that states have sovereignrights in the air space above their territory, direct government intervention in airtransport became inevitable. A country’s air space became one of its valuablenatural resources. As a result, the free-trade laissez-faire approach towards airtransport of the early years of aviation was gradually replaced by an incompletepattern of bilateral agreements between countries having airlines and thecountries to or through which those airlines wished to fly. But the restrictivecharacter of ‘bilateralism’ was soon apparent. Even before the Second WorldWar was over, 52 member states met in Chicago in 1944 to consider some formof multinational agreement in three critical aspects of international transport:
(1) the exchange of air traffic rights, or ‘freedoms of the air’ (see Appendix A);(2) the control of fares and freight tariffs;(3) the control of frequencies and capacity.
From an economist’s viewpoint these three aspects together effectivelydetermine the nature of any industry, for they regulate the entry of firms intoeach market (through traffic rights), the degree of pricing freedom and the natureof controls on production, if any.
At Chicago there were two conflicting approaches. The United States, whosecivil aviation industry was going to emerge from the Second World War largelyunscathed and much larger and better equipped than anyone else’s, wanted nocontrol of tariffs or capacity and the maximum exchange of traffic rights,including fifth freedom rights. This ‘open skies’ policy was supported by statessuch as the Netherlands or Sweden whose airlines would have to depend oncarrying traffic between other countries because their home base was so small. Onthe other hand, the United Kingdom and most European countries were moreprotectionist, understandably so since their civil airlines had been decimated inthe war. They supported tight controls on tariffs and capacity and the limitationof fifth freedom rights. These two conflicting views could not be reconciled. Nomultilateral agreement was reached on the three key issues of traffic rights, tariffcontrol and capacity.
The participants at Chicago did manage to agree on the mutual exchange ofthe first two freedoms—the right to overfly while on an agreed service and theright to land in each other’s country. This was done through the International AirServices Transit Agreement signed in December 1944 and to which many more
24 REGULATION OF INTERNATIONAL AIR TRANSPORT

states have subsequently adhered. But no agreement was reached on the mutualexchange of the commercial traffic rights. These are the third and fourth freedoms,which allow for the mutual exchange of traffic rights between two countries,enabling their respective airlines to carry passengers and freight between them.There is also the fifth freedom, which is the right granted by country A to anairline(s) from country B to carry traffic between A and countries other than B(see Appendix A).
The most significant result of the Chicago Conference was the signing of theConvention on International Civil Aviation, known subsequently as the ChicagoConvention. This provided the framework for the orderly and safe developmentof international air transport. It did this through its various articles and theannexes (mentioned earlier), which deal with every aspect of the operation ofaircraft and air services both in the air and on the ground. The Convention alsoset up the International Civil Aviation Organization (ICAO), an inter-governmental agency which provided the forum for further discussion of keyaviation issues and the basis for the worldwide coordination of technical andoperational standards and practices. ICAO also provided crucial technicalassistance to many countries, helping them to establish airport and air navigationfacilities and to organize other aspects of civil aviation infrastructure.
A further attempt at a multilateral agreement on traffic rights, pricing andcapacity was made at the Geneva Conference of 1947, but this also failed. Intime, governments and airlines together found a way of circumventing thefailures of Chicago and Geneva. The exchange of traffic rights became a matterfor bilateral agreement between states; the control of capacities and frequenciesbecame a matter for inter-airline agreements, and sometimes for bilateral stateagreements; and tariffs came to be regulated by the International Air TransportAssociation. The international regulation of air transport has since been based onthese three separate but interlinked elements.
2.3Bilateral air services agreements
Over the years, each country has signed a series of bilateral air servicesagreements (known as ‘bilaterals’) with other states aimed at regularizing theoperation of air transport services between them. There are three distinct parts tosuch agreements.
First, there is the bilateral itself. This consists of a number of articles dealingwith a variety of questions such as exemption from customs duties on imports ofaircraft parts, airport charges, transfer abroad of airline funds, and so on. The twokey articles are those dealing with the regulation of tariffs and capacity. Mostbilaterals specify that passenger fares and cargo tariffs should be agreed by thedesignated airlines, ‘due regard being paid to all relevant factors, including costof operation, reasonable profit, and the tariffs of other airlines’ (Martin et al.,1984), but both governments must approve such fares and tariffs. In other words,
FLYING OFF COURSE 25

ultimate control of tariffs rests with governments. On capacity, some bilateralsrequire very strict control and sharing of capacity by the airlines of the twocountries while others have minimal control.
Underlying bilateral agreements is the concept of reciprocity, of an equal andfair exchange of rights between countries very different in size and with airlinesof varied strengths. This is usually enshrined in an article containing the words‘There shall be fair and equal opportunity for the airlines of both ContractingParties to operate the agreed service on the specified routes between theirrespective territories’ (Martin et al., 1984).
The second part of the bilateral is the annex containing the ‘Schedule of Routes’.It is here that the traffic rights granted to each of the two states are made explicit.The schedule specifies the routes to be operated by the ‘designated’ airline(s) ofeach state. Airlines are never mentioned by name. It is up to each state todesignate its airline or airlines subsequently. The points (towns) to be served byeach designated airline are listed or, less usually, a general right might begranted, such as from ‘points in the United Kingdom’. The routes or pointsgranted to the designated airline of one state are not necessarily the reverseimage of those granted to the airline of the other state signing the bilateral. If atown or country is not specifically listed in the route schedule, a designatedairline cannot operate services to it unless the bilateral is amended.
The schedule will also indicate whether the designated airlines have beengranted rights to pick up traffic in other countries or points lying between orbeyond the two signatory states. These are the fifth freedom rights. But theycannot be used unless the third countries involved also agree. Thus the UK-Singapore bilateral grants the Singapore designated airline fifth freedom rightsbetween Athens and London on its services between Singapore and London. TheAthens-London rights cannot be exercised unless Greece agrees to this in its ownair services agreement with Singapore.
The final part of the bilateral may consist of one or more ‘memoranda ofunderstanding’ or ‘exchange of notes’. These are agreements, often confidential,that amplify or subsequently modify particular aspects of the basic air servicesagreement.
Many bilateral agreements reflect protectionist attitudes. They insist on prioragreement on the capacity to be provided on the route and also specify that theagreed capacity should be shared equally by the designated carriers of the twostates. Some go further and specify that services must be operated in ‘pool’ bythe airline concerned (see section 2.4). At the same time, few if any fifth freedomrights are granted. Most bilaterals with east European countries tend to be veryprotectionist and also make pooling mandatory.
A more liberal type of bilateral agreement is frequently referred to as theBermuda type, after the agreement signed in 1946 between the United Kingdomand the United States in Bermuda (HMSO, 1946). This was significant becauseit represented a compromise between the extreme positions taken at the 1944Chicago Conference, and because both the United States and the United
26 REGULATION OF INTERNATIONAL AIR TRANSPORT
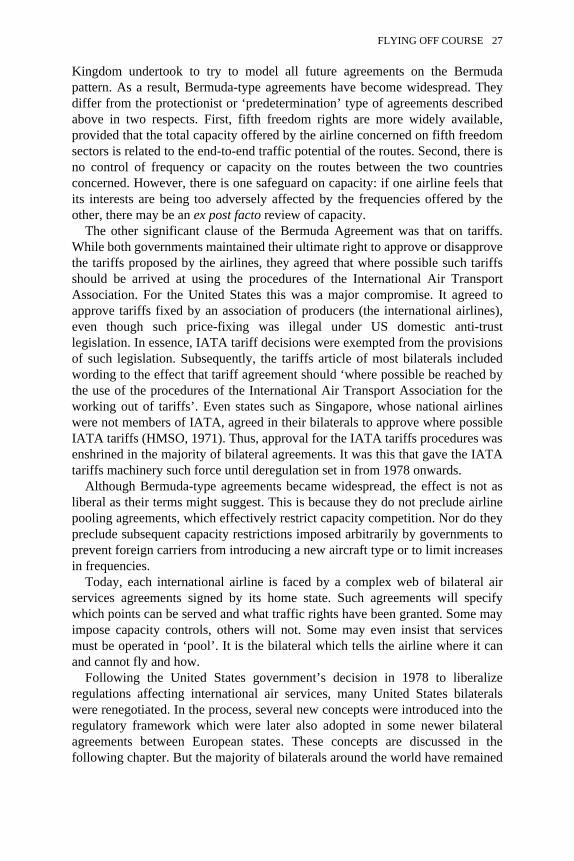
Kingdom undertook to try to model all future agreements on the Bermudapattern. As a result, Bermuda-type agreements have become widespread. Theydiffer from the protectionist or ‘predetermination’ type of agreements describedabove in two respects. First, fifth freedom rights are more widely available,provided that the total capacity offered by the airline concerned on fifth freedomsectors is related to the end-to-end traffic potential of the routes. Second, there isno control of frequency or capacity on the routes between the two countriesconcerned. However, there is one safeguard on capacity: if one airline feels thatits interests are being too adversely affected by the frequencies offered by theother, there may be an ex post facto review of capacity.
The other significant clause of the Bermuda Agreement was that on tariffs.While both governments maintained their ultimate right to approve or disapprovethe tariffs proposed by the airlines, they agreed that where possible such tariffsshould be arrived at using the procedures of the International Air TransportAssociation. For the United States this was a major compromise. It agreed toapprove tariffs fixed by an association of producers (the international airlines),even though such price-fixing was illegal under US domestic anti-trustlegislation. In essence, IATA tariff decisions were exempted from the provisionsof such legislation. Subsequently, the tariffs article of most bilaterals includedwording to the effect that tariff agreement should ‘where possible be reached bythe use of the procedures of the International Air Transport Association for theworking out of tariffs’. Even states such as Singapore, whose national airlineswere not members of IATA, agreed in their bilaterals to approve where possibleIATA tariffs (HMSO, 1971). Thus, approval for the IATA tariffs procedures wasenshrined in the majority of bilateral agreements. It was this that gave the IATAtariffs machinery such force until deregulation set in from 1978 onwards.
Although Bermuda-type agreements became widespread, the effect is not asliberal as their terms might suggest. This is because they do not preclude airlinepooling agreements, which effectively restrict capacity competition. Nor do theypreclude subsequent capacity restrictions imposed arbitrarily by governments toprevent foreign carriers from introducing a new aircraft type or to limit increasesin frequencies.
Today, each international airline is faced by a complex web of bilateral airservices agreements signed by its home state. Such agreements will specifywhich points can be served and what traffic rights have been granted. Some mayimpose capacity controls, others will not. Some may even insist that servicesmust be operated in ‘pool’. It is the bilateral which tells the airline where it canand cannot fly and how.
Following the United States government’s decision in 1978 to liberalizeregulations affecting international air services, many United States bilateralswere renegotiated. In the process, several new concepts were introduced into theregulatory framework which were later also adopted in some newer bilateralagreements between European states. These concepts are discussed in thefollowing chapter. But the majority of bilaterals around the world have remained
FLYING OFF COURSE 27

largely unaffected by the wind of liberalization blowing through the United Statesand a few European and Asian countries.
2.4Inter-airline pooling agreements
On the vast majority of international sectors there are two major carriers: thedesignated airlines of the two countries involved. There may in addition be one ormore fifth freedom carriers, though in most cases the latter supply only arelatively small part of the total capacity available. As in many duopolisticsituations, there is a strong incentive for formal or informal agreements betweenthe duopolists to share out the market. Where one of the two airlines is muchweaker or smaller, then pooling is a way of guaranteeing its share of capacity andrevenue when faced with a much stronger or well-established rival. When thetwo carriers are of similar strength, then pooling is a way of pushing up loadfactors by removing frequency competition. It also helps to reduce costs and torationalize schedules. Without a pooling agreement, competing airline departurestend to bunch at peak periods of demand. If all revenue is shared, then airlines donot mind operating some flights at less attractive times. Pool partners can plantheir schedules so as to offer a good range of departure times throughout the day.This benefits the passengers and stimulates demand.
Pooling agreements have been forbidden to United States airlines by US anti-trust legislation. But they were very widespread in Europe (where until recently75–80 per cent of intra-European tonne-kilometres were operated on pooledservices), in South East Asia and to a lesser extent in other parts of the world.Agreements can cover a single route or sector or, more normally, all the routeson which the two signatory airlines operate between their two countries. Thus the1980 British Airways-SAS pool covered virtually all services betweenScandinavia and the United Kingdom operated by the two airlines even thoughonly one of the two airlines was operating on some sectors. In general, airlinepools cover third and fourth freedom traffics. Fifth freedom traffic may beincluded on long-haul pools, though these are relatively rare. While most poolagreements involve two airlines, three- or four-airline pools are not uncommon,especially in South East Asia. Though it is often known that airlines areoperating in pool, the terms of any pooling agreement are closely guardedcommercial secrets.
In some instances where the traffic is not considered to be adequate for two-airline operation, there may be a ‘revenue-cost’ pool. This means that one airlinealone operates the service on behalf of all the airlines in the pool, but costs andrevenues are shared between them on a prearranged basis. On the Cairns-Tokyoroute launched in 1986 there was an operating agreement between Japan AirLines (JAL) and Qantas under which only the latter airline operated the servicesand revenue and costs were pooled and shared equally. A year later a similararrangement was entered into for a new Perth-Tokyo service. About one in ten
28 REGULATION OF INTERNATIONAL AIR TRANSPORT

pool agreements are of this type. A revenue-cost pool involving three airlineswas launched in 1982 on the Hong Kong-Manila-Port Moresby route. The twice-weekly service is still operated by Air Niugini, but costs and revenues are sharedbetween Air Niugini, Cathay Pacific and the Philippine airline PAL. In revenue-cost pools all partners have an incentive to market and sell the service even ifthey are not operating it themselves since they share in any losses or profits.
Some airlines have extended the concept of the revenue-cost pool, which hasbeen seen essentially as a solution for thin routes, into agreements coveringroutes which can support two carriers. In such wider cost-sharing pools bothairlines operate on one or more routes between their countries and all their costsand revenues are shared on the basis of an agreed formula. The flight numbers oftencarry the code of both airlines. Malaysia Airlines is one airline which haspursued such pools, which it calls ‘joint ventures’, as a matter of policy. Itsagreements include one with Thai International, covering air services betweenThailand and Malaysia.
More commonly, airlines contract ‘revenue-sharing’ pools in which allrevenue on a route or sector is shared by the participating airlines in proportionto the capacity they offer on the route. In a two-airline pool, each airline willnormally want a half share of the revenue and hence will expect to provide halfthe capacity. Imbalances in capacity may be permitted by mutual agreement ifone carrier cannot or does not wish to increase its own capacity. If an airlinedoes provide 50 per cent of the capacity but obtains only 47 per cent of therevenue compared with its pool partner’s 53 per cent, then the pool partner willhand over 3 per cent of the revenue. The principle of sharing revenue inproportion to capacity is simple; its application becomes rather complex.
The first step in negotiating a pool agreement is to establish how muchcapacity each airline will be putting into the pool. On a single sector route,capacity usually means the number of seats offered, but if several sectors areinvolved then seat-kilometres may be used in order to take account of differentsector lengths. On services with one or more intermediate stops en route, itbecomes quite a complex problem to identify each carrier’s capacity input to thepool. On any one flight only a part of the aircraft’s capacity will be on the pooledservice. If there are fifth freedom rights at some of the en route stops, thedifficulties of calculating pooled capacity are compounded.
The second key item is to agree the pool accounting unit. This is the notionalfare or revenue which each airline earns from one passenger on each pool sector.The number of revenue passengers carried on each sector by an airline ismultiplied by the pool accounting unit for that sector to produce the revenuewhich that airline has to put into the pool. It is this notional revenue which ispooled, not the actual revenue collected. Such a system is less open to cheatingbecause each airline need not know its pool partner’s actual revenue, only thenumber of passengers carried, which is easy to verify. However, it also providesan incentive to keep up fares and a strong disincentive to undercut the market. Ifan airline sells a ticket for $220 when the pool accounting unit is $200, it can
FLYING OFF COURSE 29

keep $20 and only $200 is credited to the pool. Conversely, if it has sold a ticketfor $150 then it still has to contribute $200 for that passenger to the pooledrevenue. Though a notional figure used purely for accounting purposes, the poolaccounting unit is normally related to the average revenue per passenger in thepreceding period. There may be a single pool unit irrespective of class or there maybe two or three separate unit values applicable to passengers in different classes.
Some revenue-sharing pools allow for an unlimited transfer of funds from oneairline to the other, provided that the final adjusted revenue of each airline isproportional to its share of capacity offered. About one in five of the poolsbetween European airlines were of this type (ECAC, 1982). Such agreementsremove all competitive incentive. In practice most pools have a limit to therevenue that may be transferred from one airline to the other. This transfer limitmay be expressed as a percentage of the total pooled revenue, or as a percentageof the donor’s or the recipient’s revenue. Alternatively the transfer limit may bean agreed maximum sum of money. Many pool agreements will have fairly lowtransfer limits, often expressed as 1 or 1.5 per cent of the total revenue. Thusmost of Thai International’s revenue pools have a 1 per cent transfer limit, whilethe Cathay Pacific-JAL pool has traditionally had a 1.5 per cent limit.
The aim of the transfer limit is to ensure that an airline which is verysuccessful in marketing and selling its services does not end up transferring largesums of money to its inefficient pool partner. In the pool negotiations, the moresuccessful airline will try to have a very low transfer limit, while the weakeroperator will want a high limit or no limit at all. Once transfer limits are imposed,particularly if they are very low, then competition begins to creep back, for themore passengers a pool carrier can carry the more revenue he can keep. But thereis still no competition in terms of frequencies or capacities.
In some pool agreements, especially those covering complex route structures,pool partners have an ‘entitlement’ to a certain amount of revenue and only thebalance is pooled. This entitlement (or ‘retention’) may be expressed as a fixedsum or usually as a percentage of each airline’s revenue. The entitlement isgenerally between 10 and 30 per cent. Its aim is to cover certain elements ofsales costs such as agents’ commissions, sales office costs, and so on. However,there seems little point in having an entitlement if there is a low transfer limit.
Revenue-sharing pool agreements are mostly for a minimum period of three tofive years, though capacities to be provided and the pool accounting unit arerenegotiated annually or for each season. Pool accounts are settled monthly.
Pool agreements may also cover freight. Freight revenue pools are based onthe same principles and have the same features as the passenger revenue poolsdescribed above. They may relate to all-freighter services or to freight carried onpassenger aircraft or both. British Caledonian and Nigerian Airways had a cargoas well as a passenger pool for many years on their London-Nigeria services.Originally there was no transfer limit and BCal found it was paying so much ofits freight revenue to Nigerian Airways that it withdrew from the agreement.Later a new agreement included a transfer limit of 10 per cent of total revenue,
30 REGULATION OF INTERNATIONAL AIR TRANSPORT

which was still very high and disadvantageous to BCal. Eventually in 1982 BCalpulled out of the pool since it found it was still paying too much to NigerianAirways.
Among some airlines a pool agreement can become a comprehensiveagreement covering much more than rationalizing of schedules and capacitycontrol. One logical step is to develop a common tariffs policy for the pooled routesand for the IATA tariff negotiations. Other aspects of the agreement may involvejoint sales promotion and advertising, use of each other’s reservation systems,sharing of ground handling facilities at airports, and so on.
The effect of all pooling agreements, once entered into, is to reduce thefreedom of action of the airlines involved and to blunt any com-petitivetendencies. This is particularly so if there is no transfer limit on pooled revenueor if the limit is relatively high. Then there is little incentive for pool partners tocompete since they are assured of half or close to half of the total revenuewhatever their relative market performance. Collectively the effect of thebilateral air services agreements and of inter-airline agreements is to delimit theroutes on which airlines can operate and to determine the capacity shares of thetwo (or occasionally three) designated carriers in these markets. This wasparticularly so in Europe, though more recently pooling agreements involvingairlines within the European Community have been phased out (section 4.4.3).Revenue pool agreements are still widespread in Asia, especially South EastAsia, and elsewhere but have never been permitted on routes to or from theUnited States.
2.5Inter-airline royalty agreements
When airlines have wanted to pick up fifth freedom traffic from points wherethey did not have fifth freedom rights under the existing bilaterals, they havesometimes been able to ‘buy’ such rights by making royalty payments to theairline of the country concerned. It was pointed out earlier that Singapore Airlines(SIA) had had fifth freedom rights between Athens and London under the termsof the UK-Singapore bilateral, but could not use these rights unless they werealso granted in Singapore’s bilateral with Greece. This was not the case, so whenin 1977 SIA operated from Singapore to London via Athens it agreed to payOlympic Airways a royalty for any local traffic picked up between Athens andLondon. In other words, SIA bought the Athens-London fifth freedom rightsfrom the Greek government by paying the Greek airline for them. The royalty inthis case was expressed as 20 per cent of the revenue generated from fifthfreedom traffic. Despite the royalty, SIA began to carry so much traffic betweenAthens and London that Olympic cancelled the royalty agreement a year later in1978.
Royalty or ‘revenue compensation’ agreements for fifth freedom traffic arefairly common. But in some cases, airlines have been forced into making royalty
FLYING OFF COURSE 31

agreements to cover the carriage of the ‘sixth’ freedom traffic. The concept ofsixth freedom has rarely appeared in any bilateral agreement, though theexpression has been widely used for many years. It involves the carriage oftraffic between two points, between which an airline does not have fifth freedomrights, by the use of two sets of third and fourth freedom rights. PhilippineAirlines (PAL) can carry traffic between London and Manila using their UKthird and fourth freedom traffic rights. It can then carry those passengers on toAustralia using the third and fourth freedom rights granted under the Australia-Philippines bilateral. Traditionally, attempts have been made to limit suchthrough traffic between London and Australia by the imposition of variouscontrols such as the need to make stop-overs of several days in Manila or otherintermediate points. KLM in Europe and SIA, Thai International and MalaysiaAirlines in South East Asia as well as several Middle East airlines, such asEmirates, have been so successful in generating sixth freedom traffic that thevarious regulatory controls, such as the necessity for stop-overs en route, havebeen slowly eroded.
Sixth freedom traffic carried by Philippine Airlines, Malaysia Airlines or ThaiInternational between London and Australia represents a loss of traffic for thethird and fourth freedom carriers on the route, namely British Airways andQantas. These carriers have therefore stepped in from time to time to exactroyalty payments for sixth freedom traffic. Thai International has had anagreement with British Airways whereby it has been allowed to carry a certainlimited number of sixth freedom passengers between London and Australia but hashad to pay a royalty of almost $60 for each one-way passenger above thispermitted number. However, no royalty is paid if the sixth freedom passengersspend a night or more in Thailand because they then become Thai’s own stop-over traffic and are categorized as third and fourth freedom passengers. A morecomplex form of revenue compensation for sixth freedom traffic is the 1988agreement between PAL and British Airways. Under this agreement PAL waspermitted to carry sixth freedom passengers from London on condition that itgenerated $750,000 worth of interline or transfer traffic onto British Airways’own services and also paid an annual royalty of $250,000. This type of revenuecompensation or royalty agreement whereby one airline guarantees an agreedvalue of interline sales onto the other airline’s services is becoming morewidespread. If the airline fails to generate the guaranteed level of sales it has tomake up the difference in cash.
While royalty agreements covering sixth and more especially fifth freedomtraffic have been fairly common for many years, a more recent phenomenon isthe payment of royalties for third and fourth freedom traffic. This may occurwhen one of the two designated carriers on a route decides not to operate. It thenargues that the other country’s designated carrier will carry all the trafficincluding that which would have been carried by the airline which is notoperating. The non-operating airline wants to be compensated for giving up itstraffic share and may be able to push the other carrier into a royalty agreement.
32 REGULATION OF INTERNATIONAL AIR TRANSPORT

For many years, SIA was forced to pay royalties to Korean Airlines (KAL) fortraffic carried between Singapore and Seoul because KAL was not operating onthe route. This was done even though SIA was enjoying rights granted under theterms of a bilateral air services agreement. When KAL began flying the Seoul-Singapore route, the royalties were discontinued. More recently, under a 1988agreement between Thai International and Olympic, the former paid the latter aroyalty for operating twice-weekly services between Athens and Bangkok of $1million per annum, which was to continue until Olympic started its own Bangkokservice.
Royalty payments, sometimes referred to as revenue compensation, arebecoming more widespread. The royalty may be expressed as a percentage of therevenue generated, as in the case of the SIA-Olympic agreement previouslymentioned; it may be a fixed amount per passenger uplifted, as in the BritishAirways-Thai International agreement; or it may be a more complex agreementinvolving guarantees of interline sales. Occasionally it may be a fixed annual sumnot related to the amount of traffic carried. In some cases royalty payments mayenable airlines to buy traffic rights that they do not have under the terms ofexisting bilateral agreements. In this way, they may improve the viability ofcertain routes. But if the airlines are forced to pay royalties for third and fourthfreedom traffic, whose rights they already have under the bilaterals, then the resultis merely to push up costs.
2.6The role of IATA
The International Air Transport Association was founded in Havana in 1945, as asuccessor to the pre-war association, which had been largely European. Itsprimary purpose was to represent the interests of airlines and to act as acounterweight to ICAO, which was an intergovernmental agency primarilyconcerned with government interests in aviation. Through its various committeesand subcommittees, which bring together airline experts for a few days eachyear, IATA has been able to coordinate and standardize many aspects of airlineoperations. Thus the Financial Committee has harmonized methods of rendering,verifying and settling accounts between airlines, while the Traffic Committee hasstandardized aircraft containers and other unit load devices as well as many otheraspects of passenger or cargo handling. IATA also represents the airlines innegotiations with airport authorities, governmemts or ICAO on matters asdiverse as airport charges or anti-hijacking measures.
One of IATA’s most important functions is to operate the Clearing House forinter-airline debts arising from interline traffic, that is, the carriage by one airlineof passengers (or freight) holding tickets issued by other airlines. The sumsinvolved are enormous. In 1988, the 146 IATA and 27 non-IATA airlines usingthe Clearing House, together with nearly 170 airlines of an American-basedclearing house, submitted for clearance claims amounting to $17.2 billion. The
FLYING OFF COURSE 33

Clearing House settles inter-airline accounts in both dollars and sterling byoffsetting members’ counter claims against each other. In 1988, 88 per cent of allclaims could be offset without the need for any cash transaction. The ClearingHouse speeds up and simplifies the process of clearing inter-airline debts.Airlines that do not use the Clearing House must negotiate individually with eachairline whose ticket stubs they might hold. This is slow and laborious and mayinvolve long delays before debts are cleared.
Undoubtedly IATA’s most important function has been to set airline fares andcargo rates. Up to 1979 the process for establishing fares was rather rigid (IATA,1974). It involved the so-called traffic conferences—one covering North andSouth America, the second covering Europe, the Middle East and Africa, and thethird the Pacific region and Australasia. Airlines operating in or through theseareas belonged to the relevant conference. The conferences, meeting in secretand usually about four to six months in advance, established the tariff structurewhich would be operative for a specified period, usually of one year. Theconferences also agreed on fares between the conference regions. About 200,000separate passenger fares and over 100,000 cargo rates were negotiated togetherwith complex conditions of service associated with each fare. The conditionswould cover such aspects as seat pitch, number of meals to be served, chargesfor headphones, and so on. Once each conference had agreed on its own tariffs,then the three conferences came together in joint session for the tariffs proposedto be voted on. They had to be agreed unanimously. In other words, any airline,no matter how small, could veto the proposed tariffs and force furtherrenegotiation. The tariffs process was lengthy and time-consuming. While in theearly years unanimity was usually reached fairly quickly, by the early 1970sunanimity became increasingly difficult to achieve.
From the airlines’ point of view, the traffic conference system had clearadvantages: it produced a coherent and worldwide structure of interrelatedpassenger fares and cargo rates, together with tariff-related rules and regulations.The traffic conferences were also instrumental in developing standard documentsand contracts of air carriage—tickets, waybills, baggage checks, etc.
IATA tariffs were accepted world wide because in so many bilateral airservices agreements governments had explicitly agreed that they would approvefares negotiated through the IATA process. This was the case even with somegovernments whose airlines were not IATA members. Non-IATA airlinesneeded to adopt IATA fares in order to get their tickets accepted by IATAcarriers. This is still largely the case. To give added force to its tariff agreements,IATA had compliance inspectors checking that member airlines were notillegally discounting on the IATA tariffs. If caught selling tickets or cargo spaceat discounted rates, IATA airlines faced heavy financial penalties. Since no IATAairlines were allowed to deviate from the IATA tariffs, no price competition waspossible.
There can be little doubt that IATA was effectively a suppliers’ cartel, whoseobject was to maximize its members’ profits by mutually fixing the prices at
34 REGULATION OF INTERNATIONAL AIR TRANSPORT

which they sold their services. However, it was often argued that three featuresof the IATA traffic conference system safeguarded the interests of the public andthe consumers and prevented the airlines’ cartel from abusing its power. Thesewere: first, a de facto ban on any kind of capacity regulation; second, the‘unanimity rule’ mentioned above; and third, the fact that IATA fare agreementshad to be approved by the respective governments.
In theory, since IATA was not in a position to restrict capacity or control entry,it would be difficult for the airlines to extract monopoly profits by fixing bothfares and output at the appropriate levels. In practice, as has been noted above,government and airline agreements outside IATA effectively upset thecompetitive element in the ratemaking machinery. The entry of a new airline intoa route is impossible unless its national government is willing and able tonegotiate the necessary traffic rights. On many routes capacity is controlledeither through the bilaterals or through airline agreements such as revenue pools.Often on routes such as London to Paris the fares were so disproportionately highthat one had to suspect that monopoly profits were being extracted.
It was also argued that the unanimity rule favoured those airlines which werepressing for lower fares, since airlines wishing to maintain a higher fare structurewould prefer some agreement to none, fearing that in the absence of anyagreement free competition would push fares to even lower levels. At the sametime it was clear that the unanimity rule did not work simply as a strong downwardpressure on fares: first, because airlines knew that if no agreement was reachedthe respective governments would step in and fix the fares themselves; secondly,because the unanimity rule also resulted in higher fares in certain areas as a quidpro quo to the airlines in those areas for their agreement to lower fares elsewhere;thirdly, because several low-fare proposals (such as the advance purchase fareson the North Atlantic) were held up for a number of years before unanimousagreement could be reached. The unanimity rule was most effective inpreventing an upward movement of fares. It was less effective in ensuring thatfares fell to levels proposed by the more efficient airlines.
Under the terms of the bilateral air services agreements all governmentsconcerned must approve any tariff agreements made through IATA. Manygovernments did in fact intervene, notably the US government through the CivilAeronautics Board, which consistently tried to reduce the pace of fare increases.Other governments also intervened from time to time, but usually on relativelyminor points affecting particular tariffs to their own countries. On the whole.the majority of governments have insufficient information on which to base validarguments to influence their own airlines and the IATA machinery.Consequently, there has been a strong tendency among governments to approveIATA fares more or less automatically. This is certainly what IATA preferredthem to do, and it consistently pressed for a minimum of governmentinterference.
Overall the apparent safeguards against IATA working as a producers’ cartelwere not very effective. But if IATA was a cartel it was failing to achieve the
FLYING OFF COURSE 35

prime objective of any cartel, namely high profits for its members. Our earlieranalysis has shown an industry characterized by poor financial results(section 1.5 above). Nevertheless, the travelling public and consumer groupsremained unconvinced of the benefits of the IATA tariff machinery. During the1970s pressure began to build up on governments in Europe and North Americato allow greater pricing freedom.
At the same time, IATA tariffs procedures began to prove too rigid andinflexible to deal with two new developments. The first of these, which hadstarted more than a decade earlier, was the growth of non-scheduled or charterair services. Attempts by IATA and many governments to stem their growth hadfailed. As a result, charter airlines were making serious inroads into scheduledmarkets in Europe and on the North Atlantic. The second development was theemergence of new dynamic airlines belonging to newly independent states,especially in South East Asia. Airlines such as Thai International, SIA andKorean Airlines began to make an impact on regional and long-haul markets. Asnon-IATA carriers they captured market share either by offering much higherlevels of in-flight service than was permitted under IATA’s ‘conditions ofservice’ or, less frequently, through greater flexibility in their tariffs. To countercompetition both from charters and from new non-IATA carriers, the IATAairlines needed much greater pricing freedom than could be obtained within thecumbersome traffic conferences.
Faced with these external competitive pressures, IATA airlines found itincreasingly difficult to achieve unanimity on the tariffs policies to be adopted atthe traffic conferences. Several conferences broke up without agreement ontariffs in particular markets. Governments stepped in to fix the fares where theairlines could not agree. At the same time, more and more IATA airlines beganto offer illegally discounted fares in very competitive markets or to flout the strictcontrols on in-flight service standards. Several governments, particularly that ofthe United States, began to push for a system which allowed consumers tobenefit from greater pricing freedom (section 3.8 examines US moves againstIATA). Openly disregarded by some of its own members and under pressurefrom a number of governments, IATA’s tariff machinery began to disintegrate.
In 1975 IATA began a review of its traffic conference system and otheraspects of its activities. At the 1978 Annual General Meeting, airlines approved anumber of key changes in the conditions of membership and in tariffcoordination, which was the new name for tariff setting. The changes wereimplemented in 1979. The most significant are:
(1) Airlines can now join IATA as a trade association without participating inthe passenger or cargo tariff coordinating conferences. By 1988 as many as69 of IATA’s 152 active member airlines did not take part in tariffcoordination. Trade association members are not obliged to implement IATAtariffs.
36 REGULATION OF INTERNATIONAL AIR TRANSPORT

(2) The primary interests of third and fourth freedom carriers in setting tariffs isnow recognized by the fact that it has become possible within the trafficcoordinating conference to reach limited agreements (covering travelbetween two countries) or sub-area agreements (covering a smallgeographical area) without the involvement of the full conference area. (Aspreviously, the world is divided into three main conference areas.) In otherwords, the unanimity rule has been abandoned.
(3) Third and fourth freedom carriers may introduce innovative fares betweentheir two countries, without prior conference approval but subject to theagreement of the governments concerned.
(4) Airlines participating in tariff coordinating have been encouraged todispense with regulations on conditions of service relating to meals, barservice, free gifts, entertainment, and so on. This has been done in many sub-areas by the airlines concerned and with government approval. As a result,competition in the quality of in-flight service has become widespread.
(5) The secretive and confidential traffic conferences of earlier days have beenreplaced by the much more open and public coordinating conferences.Observers from governments and international organizations may attend andthird parties may make written or oral presentations to the conferences.
Under external pressure to reduce tariff controls, IATA has also had to adoptmore flexible tariff structures (see Chapter 11 on pricing). The restructuring ofIATA and the introduction of more flexible and open tariff-setting procedureshave enabled IATA to survive despite the considerable pressures towardsderegulation. IATA tariffs remain the government-approved tariffs for themajority of international air routes. Even on routes with non-IATA airlines orwhere discounting is prevalent, the IATA-agreed tariffs are widely accepted asproviding the basic tariff structure and level of fares.
IATA’s more open structure and its role in pursuing airline interests oninfrastructural issues made it increasingly attractive to airlines that hadpreviously stayed aloof. A major breakthrough occurred in July 1990 when fourAsian airlines—SIA, Cathay Pacific, Malaysia Airlines and Royal Brunei—joined as trade association members for the first time. The last real objection totheir joining was removed when IATA had earlier agreed to modify its strictrules on IATA-accredited travel agents so as to allow carriers to deal withvirtually any agent. Previously only IATA-accredited agents could be used. Thisrepresented a further relaxation in IATA’s hitherto rigid membership rules.
2.7Limited regulation of non-scheduled air services
Unlike scheduled rights, non-scheduled traffic rights have not been regulated bybilateral air services agreements. At the time of the 1944 Chicago Convention,non-scheduled air services were not expected to be of any significance, and a
FLYING OFF COURSE 37

more liberal attitude was therefore adopted. Whereas under Article 6 of theConvention scheduled air services specifically required ‘special permission orother authorisation’ from the destination countries, Article 5 left authorizationfor non-scheduled services at the discretion of individual states (ICAO, 1980).
In practice, most countries have insisted on giving prior authorization toincoming non-scheduled flights, but attitudes towards authorization varysignificantly. Some countries, such as India, have been restrictionist in theirapproach and have refused to authorize charter flights unless they are operatedby their own national carrier or unless it can be shown that no scheduled trafficwill be diverted. Others may insist, before authorizing an incoming charter, thatone of their own airlines should be allowed to tender for the charter contract. Incontrast, many other countries, particularly tourist destinations such as Spain,Morocco or Tunisia, have followed a more liberal ‘open skies’ policy and havereadily authorized non-scheduled services.
In 1956, the member states of the European Civil Aviation Conference agreedto waive the requirement for any prior authorization from the destination countryfor a wide range of non-scheduled flights (HMSO, 1956). This agreement hasgreatly facilitated the development of charter services, particularly inclusive tourcharters, within Europe.
Some countries, such as the United Kingdom through the Air TransportLicensing Board and later the Civil Aviation Authority, brought non-scheduledoperations within some form of national regulatory control. Such regulation wasaimed at clearly delineating the area and scope of non-scheduled operations so asto protect scheduled operations, while giving non-scheduled operatorsconsiderable freedom of action within their defined area. British airlines havehad to obtain an ‘air transport licence’ from the Civil Aviation Authority for allcommercial operations. An airline wishing to operate a charter inclusive tour fora particular tour operator applies for a Class 3 licence. The application may be fora large number of frequent flights to one or more destinations over a statedperiod of time. Today, Class 3 licence applications are granted more or lessautomatically by the Civil Aviation Authority.
Initially IATA tried to regulate the non-scheduled activities of its ownmembers by trying to fix minimum charter rates as a function of the scheduled fareand by other rules governing who could have access to charter flights. In the1960s, many governments, under pressure from IATA and to protect their ownscheduled airlines, imposed arbitrary and often restrictive regulations on charterservices. But, as the tide of public opinion in many western countries swungstrongly in favour of cheap charter flights, governments were forced gradually todismantle the various controls on charters. This process was given added impetusby the moves in the United States to deregulate both domestic and international airtransport. In particular, the United States has tried to remove all price and othercontrols on charters while at the same time making non-scheduled traffic rightsexplicit within bilateral air services agreements.
38 REGULATION OF INTERNATIONAL AIR TRANSPORT

The non-scheduled airlines have been relatively free of international regulationbut subject to national controls on licensing, tariffs to be charged, and so on. Inmany countries these national controls have also withered away. In the twolargest markets for passenger charters—in the Europe-Mediterranean area and onthe North Atlantic—charter operators have been free for some time of bothinternational and national controls on route access, capacity or fares. Butuncertainty remains. Since charter rights are only explicitly included in a veryfew United States bilaterals, charter services are at the mercy of the destinationcountries, which may give or refuse landing authorization. Many countries,particularly in the Middle East and other parts of the Third World, still refuse toauthorize incoming charters.
2.8The economic consequences of international regulation
2.8.1OPERATIONAL CONSTRAINTS IMPOSED ON
SCHEDULED AIRLINES
The three-pronged structure of international regulation based on the bilaterals,the inter-airline agreements and IATA had constrained the freedom of action ofindividual scheduled airlines in a number of ways.
First, their markets are often restricted. Airlines cannot enter any market atwill, but are dependent on government action and support first in making bilateralagreements to open up air routes and obtain the necessary traffic rights; and,secondly, in negotiating the points which should be served on these routes. Thisis not always straightforward, particularly if an existing bilateral has to berenegotiated. The other country may refuse to negotiate or may want to exact ahigh price for accepting changes to routes or traffic rights granted under theexisting bilateral. SIA had long wanted to operate from Singapore to KotaKinabalu and Kuching in eastern Malaysia (Sabah) but the Malaysia-Singaporebilateral granted traffic rights only to the Malaysian-designated carrier. TheMalaysians were not prepared to renegotiate on this so SIA was for many yearsexcluded from a potentially lucrative route. It was not until June 1990 thatMalaysia gave way. To obtain fifth freedom rights some airlines have had to payroyalties to other carriers. Some have even had to pay royalties to exercise thirdand fourth freedom rights granted to them under air services agreements.
Secondly, the level of output or product of each airline is not entirely at itsown discretion. Its production may be limited through bilateral agreements oncapacity control on an equal sharing of capacity, or through inter-airlineagreements on revenue sharing and capacity. An airline wishing to increase itscapacity and output on routes where there is some form of bilateral or inter-airlinecapacity control may well find that the other airline in the duopoly may be
FLYING OFF COURSE 39
unable or unwilling to increase its own capacity, and therefore may veto theexpansion plans. SIA had long wanted to increase its flights from Singapore toHong Kong from 14 to 21 weekly, as permitted under the air services agreementwith the UK. But they could not do so unless Cathay Pacific matched anyfrequency increase, which they were not prepared to do. SIA waited severalyears before getting Cathay’s agreement to an increase of frequencies in 1989.Capacity limitations are widespread, but have not existed in all markets. Onmany routes to or from the United States there was little effective capacitycontrol even before deregulation.
Lastly, airlines’ pricing freedom is also limited. This is partly because mosttariffs have traditionally been set by the IATA tariff conferences, in which theinfluence of any individual airline was limited, and partly because governmentsmust ultimately approve all tariffs. Thus even on routes where IATA tariffs donot apply or where IATA now allows innovatory tariffs by the third and fourthfreedom carriers concerned, the government at either end of the route mayprevent a new fare being introduced. Even non-IATA airlines may be required bygovernments to apply IATA tariffs on most of their international routes. Pricingfreedom has existed only in markets where at times there has been widespreaddiscounting of IATA tariffs, in markets where with the connivance ofgovernments the IATA tariffs process has been abandoned or on routes wherefare zones have been introduced. Some pricing freedom has existed on most ofthe North Atlantic and transpacific routes to and from the United States sinceabout 1978 and more recently on certain European routes. With these majorexceptions, airline managers have not been free to choose and set their owntariffs at will. Tariffs have had to be approved by IATA or by the twogovernments concerned. In practice such approvals have depended on theagreement of the other airline(s) on the route in question. Pricing freedom wasfurther restricted if airlines were in revenue pools with the other carriers.
The cumulative effect of all these constraints has been that scheduled airlinemanagers have been restricted in their ability to compete with other carriers,especially if their own airlines were IATA members. With some exceptions therehas been little scope for pricing competition. Until 1979 IATA airlines could noteven compete in terms of in-flight services, for their nature and quality werestrictly controlled on a route-by-route basis. On many routes there was little scopefor competition in terms of frequencies either because of capacity limitationclauses in the bilateral or because of inter-airline revenue pools. The latter alsoprecluded competition through aggressive scheduling of departures.
2.8.2TARIFFS NOT RELATED TO LOWEST COSTS
In markets where there is price competition, tariffs are more likely to be pusheddown to the levels at which the more efficient carriers can operate profitably.Tariffs arrived at through inter-airline negotiations must inevitably be a
40 REGULATION OF INTERNATIONAL AIR TRANSPORT

compromise between the pricing policies of the high-cost airlines and those ofthe low-cost airlines. This is what has happened within IATA. As a result, IATAtariffs appear to have been based less on the costs of the more efficient carriersand more on the concept of charging what the traffic will bear and on theprojected costs of the higher-cost operators.
Prior to 1979, the unanimity rule at IATA Traffic Conferences generated horsetrading between participants in order to achieve unanimity among airlines withvery diverse cost levels. This resulted in very different fares and cargo rates perkilometre for routes with similar cost characteristics. This was so even after 1979when the unanimity rule was effectively abandoned. On many routes factors suchas surface competition, or competition from charters, may have a more profoundeffect on tariffs than traffic density, sector length or other cost factors. (Therelationship of tariffs to costs is examined in Chapter 11.)
The very high variation in IATA fare rates on routes which are outwardlysimilar suggests that there is considerable cross-subsidization between routes,and even between different classes of passengers on the same route. Cross-subsidization raises questions of welfare distri-bution which are too complex togo into here. However, one significant effect on consumer interests in general isthat it holds back the development of air services in profitable markets becausethey may be burdened with unusually high fares to compensate for losseselsewhere.
The absence of effective price competition in most airline markets has had twoadverse effects. It has meant higher tariffs for passengers and freight shippersthan would otherwise have been the case. But, for many airlines, it has alsomeant higher costs than would have been the case in a more competitiveenvironment because it has reduced the incentive to cut costs. This has beenparticularly the case among higher-cost operators. Higher tariffs have alsoencouraged the growth of low-fare charters.
2.8.3MONOPOLY PROFITS EARNED?
On routes where an effective duopoly exists and where the duopolists areoperating in a revenue-sharing pool, or where capacity is controlled and equallyshared on the basis of the air services agreement, the carriers involved have beenin a position to extract monopoly profits. They have done this by effectivelycontrolling the provision of capacity and by controlling fare levels through theIATA traffic conference or inter-airline agreements. In practice, this has meantunusually high fare levels and high load factors. A particularly good examplewas the London-Paris route before new entrants were allowed in 1988. Thisroute had been operated in a revenue pool by British Airways and Air France formany years, though British Caledonian also carried about 15 per cent of the totaltraffic. The route has a cost disadvantage because it is relatively short, only 215statute miles. The traffic, however, has been the busiest in Europe with 3 million
FLYING OFF COURSE 41

passengers in 1987 when both Air France and British Airways operated highfrequencies with large aircraft. Therefore costs per passenger should have beenrelatively low, particularly when compared with other European routes of similarstage length. At the same time, the route generated a high proportion of businesstraffic and most of this travelled at the full economy or club (business) class fare.So there was relatively less fare dilution than on more tourist-oriented routes.Load factors on the route have also tended to be well above average. Lowercosts, high yields and above-average load factors should have resulted in farelevels 10–20 per cent below the European average. Yet the London-Paris fare,when expressed as a fare per kilometre, had always been one of the highest inEurope. This suggests that high profits were being earned. On some Europeanroutes such as London-Paris, on several routes in the Middle East and one or tworoutes in South East Asia, the regulatory system failed to protect the public frommonopoly pricing.
42 REGULATION OF INTERNATIONAL AIR TRANSPORT

3Deregulation and its Impact on the Industry
3.1The case for and against regulation
Traditionally, economists have justified the regulation of both international anddomestic air services on one or more of three grounds. In the United States theCivil Aeronautics Act of 1938 was introduced to regulate and controlcompetition between US domestic carriers because the unregulated competitionwhich had prevailed up to then had led to chaotic economic conditions, littlesecurity for investors and low safety margins. For many years the American viewwas that, while air transport is not a natural monopoly, regulation is requiredbecause ‘unregulated competitive market forces may have adverse consequencesfor the public at large’ (Richmond, 1971). The same philosophy has been widelyadopted to justify the regulation of international air transport as well. It has beenargued that, whereas there are strong oligopolistic tendencies in air transport,absence of any regulation would inevitably lead to wasteful competition. This isbecause the industry has a non-differentiated product and a relative ease of entry.At the same time, economies of scale are not very marked. New entrants into aparticular market would try to establish themselves by undercutting existingfares, and a price war would result with adverse consequences for all participants(Wheatcroft, 1964).
The second economic argument favouring regulation has been based on theconcept that air transport is a public utility, or at least a quasi-public utility. It hasbeen argued that the external benefits arising from civil aviation are such that theindustry needs to be regulated in order to ensure that any benefits are notjeopardized. These benefits are assumed to be not only economic but alsostrategic, social and political. The public utility nature of air transport has, rightlyor wrongly, been considered so important that most countries have concentratedon developing one major scheduled operator, usually with direct governmentparticipation. The same carrier often operates domestic services and acts as thedesignated foreign carrier. These countries have tried to avoid a conflict betweenprivate commercial needs and ‘national interests’ by having a monopolisticstructure in air transport with a strong direct or indirect government influence on

the national airline. It was and still is a natural extension of this point of view tobelieve that free and unregulated competition on international air routes wouldendanger national interests because it might adversely affect that national airline.
The third argument in support of the regulation of international air transport islinked to the rapid development of non-scheduled air traffic. The Committee ofInquiry which examined British air transport and reported in May 1969 came outstrongly in favour of protecting scheduled services on most routes because theyhad ‘public service’ features which imposed certain costly obligations upon themand which made them particularly vulnerable to price competition (HMSO, 1969,Chapters 5 and 13). Once an airline is committed to operate a series of scheduledservices, the marginal cost of any empty seats is virtually nil, since servicescannot be withdrawn at short notice. A fare war would thus result in disastrouslylow fares and a marked financial instability among scheduled airlines. TheCommittee also argued that in the long run scheduled operations cannot competewith charter operations because the former satisfy a ‘collective’ demand whichnecessitates the ready availability of spare seats on particular routes at shortnotice. In order to satisfy that demand, scheduled operators must inevitablyoperate at lower load factors than charter airlines. Ready availability is after allone aspect of ‘public service’. Lower load factors in turn mean higher passenger-kilometre costs than those achieved by non-scheduled operations. Where stateswish to have scheduled services providing regular and readily available capacitywith the minimum of special conditions for the public at large, some form ofprotection against the encroachment of charter operators is required. This isparticularly so where the scheduled traffic is relatively thin, for even a small lossof traffic might jeopardize the continuation of scheduled operations. Thisargument was broadened by the International Air Transport Association (IATA)and others. They claimed that even greater price competition between scheduledcarriers themselves would lead to a collapse of profit margins. This in turn wouldlead to the abandonment of thin routes and reduction of frequencies on others asairlines tried to compensate for lower fares by pushing up load factors. As aresult the travelling public would be worse off.
During the 1960s economists in the United States and elsewhere began toquestion the benefits of regulation and argued the advantages of freercompetition in air transport (e.g. Straszheim, 1969). Existing internationalregulations limited pricing freedom and product differentiation, restrictedcapacity growth and excluded new entrants. If these regulations were relaxed, amore competitive environment would provide considerable benefits to theconsumer in lower fares, innovatory pricing and greater product differentiation.Lower tariffs would push airlines to re-examine their costs and would force themto improve their efficiency and productivity. Lower costs would facilitate furtherreductions in tariffs. Some inefficient airlines might be forced out of particularmarkets. But it was argued that the economics of the airline industry did notjustify the fear that freer competition would lead to economic instability. Thecapacity of most large international airlines to fight tariff wars on a limited
44 DEREGULATION AND ITS IMPACT ON THE INDUSTRY

number of routes at a time, combined with a strong sense of self-preservation,would prevent the established carriers from going too far in a price war becauseof the dangers of getting ‘locked in’. In other words, they would avoidsuccessive fare reductions which would ultimately leave each airline with muchthe same share of the market but with very low and possibly unprofitable farelevels. Fear of new entrants would almost certainly push down fares to a levelwhere only normal profits were being secured. Excess profits would attract newentrants. By the same token, cross-subsidization, which was prevalent, would belargely eliminated, since it implied excess profits on particular routes. Whereairlines did enter new markets or routes, they were likely to be innovative intheir pricing and in their products. Existing carriers, hitherto protected by theregulatory environment, would be shaken out of their complacency. This couldonly be good for consumers.
Similar arguments were put forward regarding the benefits which would arisefrom the deregulation of domestic air services in the United States (Eads, 1975).The Civil Aeronautics Board (CAB) had imposed rigid regulatory controls onmarket entry, on pricing and on other aspects of airline operations. No new trunkairline had been authorized since the Board was set up in 1938. The number ofairlines on any single route was strictly controlled. Airlines were not even free towithdraw from certain routes as a matter of commercial judgement if they werethe only carrier. The CAB also approved all tariffs. It generally rejected discountfares, which were considered discriminatory. Since it was difficult for airlines toobtain new route authorizations, they tried to expand through take-overs ormergers, but even these were subject to CAB approval. Airlines were in astraitjacket. Only those operating entirely within one state, such as California,were free of CAB controls. The arguments for deregulation could readily beapplied to US domestic air transport and they found favour with the Americanpublic.
3.2The regulatory system under pressure after 1972
During the early 1970s the European scheduled flag carriers, many of themwholly or partly owned by their respective governments, began to complain of theinroads which cheap and unregulated charter services were making into theirpotential traffic and into their profits and campaigned for stricter controls. Butthe public, various consumer groups and the tourist industry were pressing forsome deregulation of the scheduled sector and for greater freedom for non-scheduled operators, so that all travellers could readily enjoy the cheaper fareswhich the latter made possible. As the economic fortunes of both scheduled andnon-scheduled carriers worsened, especially after the fuel crisis of 1973–4, thepressures on the regulatory system increased. One manifestation of thesepressures was the growing difficulty, previously mentioned, of reachingunanimity at IATA Traffic Conferences. Another was the spread of the illegal
FLYING OFF COURSE 45

discounting of scheduled tariffs in many markets. To mitigate the effects of thedeteriorating economic fortunes of the industry, governments and airlines took aseries of unconnected decisions which collectively and often imperceptiblybegan to change the regulatory framework. These various decisions were oftencontradictory, but one can discern certain trends in the various regulatorydevelopments between 1973 and 1977.
First, the distinction between scheduled and non-scheduled services becameincreasingly blurred as controls on the latter were relaxed and new conceptsintroduced. In the United Kingdom, the Civil Aviation Authority (CAA) finallyabolished minimum price control of summer charter inclusive tours in November1972. In April 1973, advanced booking charters (ABCs) were introduced on theNorth Atlantic. The aim was to do away with the previous concept of ‘affinity’,which had limited access to transatlantic charters to members of a club whosepurpose was not solely to provide cheap travel. To prevent or reduce diversionfrom scheduled services, the use of ABCs was limited to passengers booking atleast three months in advance. ABCs gradually replaced affinity and other formsof group charters on the North Atlantic. The advanced booking period wasprogressively reduced. The ABC concept was also introduced on a few otherlong-haul routes. In the meantime, the European scheduled airlines had alsodeveloped the concept of part-charters. Under part-charter rules, scheduledcarriers could sell off blocks of seats to travel agents or tour operators, who thenpackaged the seats into inclusive tour holidays. Part-charters were firstintroduced between Britain and Spain in 1971, but within a few years they wereavailable on many of the major tourist routes in western Europe. Part-charters onscheduled services were introduced not merely as a competitive reaction tocharters but also because they offered a number of economic advantages to thescheduled carriers. By mixing normal traffic and charter traffic, the scheduledcarriers are able to improve load factors by filling up seats which wouldotherwise be empty. In this way, airlines can sustain scheduled services on routeswhere the scheduled traffic would otherwise be insufficient to maintain adequatefrequencies and load factors.
The relaxation of controls on charter services, and the emergence of ABCs onmany long-haul routes and of part-charters in Europe were clearly blurring theoperational distinctions between scheduled and charter services.
The second development during this period was a trend towards introducinggreater international regulation of non-scheduled services both by bringing themwithin bilateral agreements and by controlling charter fares. It was becomingincreasingly clear that one could not continue to regulate the scheduled sector ofthe industry while leaving the fastest-growing sector, that of the charters, outsidethe framework of regulations. The fact that scheduled and non-scheduledservices were becoming increasingly difficult to differentiate reinforced theargument for regulation on an industry-wide basis. Attention was focused on abilateral approach to non-scheduled regulation. As early as March 1972, SecorBrowne, then chairman of the Civil Aeronautics Board, stated that a multilateral
46 DEREGULATION AND ITS IMPACT ON THE INDUSTRY

approach to charter regulation was ‘simply not feasible’ and that bilateral treatieswere the only way to control charters. Subsequently, a number of bilateral airservice agreements which were renegotiated also included separate treatiescovering non-scheduled services; for example, the ‘Nonscheduled Services’Agreement between Canada and the United States in May 1974 (Canada TreatySeries 1974, No. 16). Meanwhile, the introduction of new charter concepts, suchas advanced booking charters, had necessitated bilateral negotiations betweengovernments. These resulted in a large number of bilateral agreements, mainlybetween the United States and Canada and several West European countries,which were effected by exchange of notes or memoranda of understanding (USGovernment, 1973). Such agreements, while covering only one type of charterservice, did involve the acceptance by the signatory governments of the principleof bilateral negotiation as a means of regulating charter operations. Certaingovernments also became involved in regulating minimum prices for ABCs andother types of charters.
As scheduled airline losses mounted following the 1973–4 fuel crisis, manygovernments set out to protect their own scheduled carriers. This growingprotectionism was another tendency in the period after 1972. There were manymanifestations of this. A number of governments attempted to obtain a moreequal share of the total traffic, in particular markets for their own carriers. In1974 the Civil Aeronautics Board, later to be the champion of deregulation,began to pressurize a number of European and other governments on the groundsthat the latter’s airlines were capturing significantly more than 50 per cent of thetraffic on routes to the United States, even though American citizens generatedover half the traffic. The CAB’s aim was to help restore Pan Am and TWA toprofitability. But in some markets the CAB found itself on the defensive. In June1976, the British government gave 12 months’ notice of the termination of theBermuda Agreement with the United States with the express purpose ofobtaining a larger share of the traffic on the North Atlantic for British Airwaysand of limiting American airlines’ traffic rights and earnings on other majorroutes passing through British territories. The British felt that they were doingbadly under the existing Bermuda bilateral and produced figures to prove it(Doganis, 1977).
At about the same time the Japanese were arguing that, on the routes betweenJapan and the United States, two-thirds of the passengers were Japanese butJapan Air Lines (JAL) carried only one-third of the traffic (Flight International,21 August 1976). They too wanted a more restrictive bilateral with the UnitedStates. Following its own review of international civil aviation policy, theAustralian government in 1979 tried to restrict the Asian scheduled airlinesoffering sixth freedom services between Australia and Europe in order to protectQantas.
FLYING OFF COURSE 47

3.3Moves towards deregulation
Collectively, the various and often disconnected developments described abovemarked a tendency towards an extension of international regulation rather thanits diminution. But the pressures were not all in one direction. There were, duringthe 1970s, countervailing tendencies towards deregulation.
In the United States, pressures for domestic deregulation became very vocal inlate 1974 during the hearings of the Senate Judiciary Subcommittee onAdministrative Practice and Procedures. These so-called Kennedy hearingsfocused attention on the need for reform of CAB procedures and controls. A fewmonths later, the Report of the CAB Special Staff on Regulatory Reform cameout strongly in favour of the deregulation of United States’ domestic air services.It argued that the undesirable effects of the existing system included: (1) de factoexclusion of new airlines from long-haul trunkline markets; (2) protection of therelatively inefficient carriers; (3) unduly high labour costs and unduly high-costtype of service; and (4) lack of emphasis on price competition and on variationsin the price/quality mix in response to consumer preference (CAB, 1975). As aresult of this report and the discussions which it generated, the United Statesgovernment introduced a deregulation bill in the spring of 1976, though this didnot become law. In February 1977 President Carter announced that he would beintroducing a new bill to Congress to allow greater competition among USdomestic carriers. In view of the forthcoming legislation, the CAB began to relaxits controls. Early in 1977 it began to encourage price competition through itsapproval of Texas International’s ‘Peanuts’ fares and American Airlines’ ‘SuperSaver’ fares. At the same time, controls on the entry of new carriers into existingmarkets were relaxed in a series of individual route hearings. On 24 October1978 the Airline Deregulation Act was signed into law.
The Act provided for the complete elimination of the Civil Aeronautics Boardby 1985, bringing an end to all controls over routes and fares. Other aspects of theBoard’s responsibilities would be taken over by other branches of the federalgovernment. The law instituted a gradual decontrol between 1978 and 1985,primarily by making new routes easier to obtain and unprofitable routes easier togive up. The Board retained authority over maximum and minimum fares until1982 when tariffs were to become completely deregulated. Charter rules wererelaxed, as were limitations on the right of scheduled carriers to operate charters.In practice, the Board reduced its own regulatory controls even more quicklythan envisaged by the Act. The significance of US domestic deregulation wasthat the pressures for change which were generated inevitably spilled over tointernational air transport.
In Europe there were similar winds of change. The UK Civil AviationAuthority became increasingly liberal in its licensing decisions from 1975onwards. One example of this was the virtual deregulation of internationalfreight charters in 1976. The European Parliament in Strasbourg and the
48 DEREGULATION AND ITS IMPACT ON THE INDUSTRY

European Commission in Brussels all began to discuss various aspects ofderegulation within Europe. The European Commission went one step furtherand actually produced a draft proposal in October 1975 aimed at creating a singleand rather liberal regulatory authority to control all air services between the ninemember states (CEC, 1975). This was to be the first in a series of proposals ordraft directives on the liberalization of air transport that were sent by theCommission to the Council of Ministers, though none was actually approved. Itwas not until 1983 that the first Directive, for the deregulation of inter-regionalair services between member states of the European Community, was approved(CEC, 1983). This Directive, a watered-down version of earlier proposals, hadlittle impact, though it marked the first step towards liberalization on aCommunity-wide basis.
3.4Reversal of US aviation policy
In the international arena, the three-pronged structure of economic regulationwhich emerged following the 1944 Chicago Conference had resulted in anindustry characterized by a high degree of regulation and a very limited scopefor competition. Most markets were duopolies or oligopolies. The only realcompetition was in certain non-scheduled markets. The United States hadacquiesced in this pattern of regulation for more than 30 years. Then late in 1977US international aviation policy began to change dramatically. Far fromaccepting the existing regulatory framework, the United States suddenlyappeared to be hell bent on deregulation, on reducing existing regulatory controlsto a minimum. It was supported in this by several other governments, especiallythose of the Netherlands and Singapore, but it was the United States that was theprime generator of change.
The change in US policy was linked with the Carter administration, whichtook over at the White House in January 1977. Three key factors explain themoves towards a new policy. First, ‘consumerism’ had been a key element inCarter’s election campaign. In international air transport this meant reducingfares, facilitating access to air services, and opening new direct links from UScities not previously served by international services. There was considerablepublic and congressional pressure for international deregulation and the Carteradministration was eager to harness such pressure in its own support. Secondly,the Carter administration had a fundamental belief in the benefits of greatercompetition. The early stages of domestic deregulation in the United Statesappeared to be producing lower fares for consumers and higher airline profitswithout any marked instability for the industry. The protected position of PanAmerican, TWA and other US international airlines could not be justified. Ifgreater competition was proving beneficial domestically, it would also do sointernationally. Thirdly, there was a need to increase US airlines’ share ofinternational air transport. The once-dominant US position had been eroded. The
FLYING OFF COURSE 49
regulatory system, together with the lack of drive of the established Americanairlines, had resulted in a declining market share for these airlines. By 1977 USairlines had only about 40 per cent of the market between the United States andEurope, and on some routes, such as those to the Netherlands or Scandinavia, theirmarket share was below 20 per cent. More liberal bilateral air servicesagreements and the entry of new US carriers would enable the US industry toincrease its market share. Here one can discern an element of self-interest behindthe pressures for deregulation.
In October 1977 the White House produced guidelines on internationalaviation policy. These were further developed by the Department ofTransportation and published in May 1978. Following public hearings in thesummer of 1978 a statement on International Air Transport Negotiations wassigned by President Carter on 21 August 1978 (Presidential Documents, 1978,pp. 1462–5). This stated that the United States’ aim was ‘to provide greatestpossible benefit to travellers and shippers’ and that ‘maximum consumer benefitscan best be achieved through the preservation and extension of competitionbetween airlines in a fair market place’. This broad aim was to be achievedthrough the negotiation or renegotiation of bilateral agreements. In suchnegotiations, the US would henceforth have the following objectives:
(a) ‘creation of new and greater opportunities for innovative and competitivepricing that will encourage and permit the use of new price and serviceoptions to meet the needs of different travellers and shippers.’ This would beachieved by ensuring that tariffs were determined by airlines on the basis ofcompetitive considerations. Government involvement should be theminimum necessary to prevent predatory or discriminatory pricing, toprevent monopolistic practices and to protect competitors from prices thatare artificially low as a result of government subsidies;
(b) ‘liberalization of charter rules and the elimination of restrictions on charteroperations’;
(c) ‘expansion of scheduled services through the elimination of restrictions oncapacity, frequency and route operating rights’;
(d) ‘elimination of discrimination and unfair competitive practices faced by USairlines in international transportation.’ In particular, charges for providingen route and airport facilities should be related to the costs created by airlineoperations and should not discriminate against US airlines;
(e) ‘flexibility to designate multiple US airlines in international air markets’;(f) encouragement of maximum traveller and shipper access to international
markets by authorizing more US cities for nonstop direct service, and byimproving the integration of domestic and international airline services; and
(g) ‘flexibility to permit the development and facilitation of competitive aircargo services.’
50 DEREGULATION AND ITS IMPACT ON THE INDUSTRY

The United States set out to achieve these objectives in a series of crucialbilateral negotiations in the period 1977–80. The major objective of US policywas generalized deregulation. This made sense given the free enterprise andcompetitive aviation environment in the United States. But in most of thecountries with which the United States was negotiating there was only one airlineor only one large scheduled airline, which was usually state owned and was the‘chosen instrument’ of each country’s aviation policy. As a result, most countriesnegotiating with the United States had quite different objectives from thoseoutlined above:
(a) They generally wanted some capacity control and, in several cases, theywanted a reduction in US scheduled capacity rather than any increase. Italyand Japan were among countries that wanted some capacity controls.
(b) Several countries, including the United Kingdom and France, wanted tolimit existing US fifth freedom rights, which had been liberally grantedunder the early Bermuda-type bilaterals.
(c) Most countries did not favour ‘multiple designation’. Since many of themhad only one major international airline, the concept was of little value. Itwas seen as little more than an American attempt to swamp the market withUS airlines and capacity.
On the decontrol of tariffs, the liberalization of charters and air cargo, theposition of several countries was more flexible and closer to that of the UnitedStates. The one common objective of most countries was to obtain rights to servemore gateway cities in the United States. This coincided with one of the President’sown policies: increased access to the US market was the carrot used by Americannegotiators in order to obtain their own objectives.
3.5New concepts in international regulation
In the process of renegotiating many of its key bilaterals between 1977 and 1980the United States introduced some new concepts into international regulation andgave greater importance to others that hitherto had been of limited significance.
On traffic rights the most significant development is that of unlimited ormultiple designation, that is, the right of each party to a bilateral to designate asmany airlines as it wishes to operate its own agreed routes. Some bilaterals, suchas the UK-USA Bermuda 1 agreement, had previously accepted multipledesignation but they were the minority. In addition, many of the new USbilaterals include break of gauge rights. This is the right to change from a largerto a smaller aircraft in the other country’s territory on a through service that is goingbeyond the other country, usually, but not necessarily, with fifth freedom rights.In order to use its break of gauge rights, an airline would need to station smalleraircraft at the airport where the change of gauge takes place. A few of the
FLYING OFF COURSE 51

bilaterals also grant combination rights. These allow an airline to carry two setsof third and fourth freedom traffics on a single stopping service. In other words,an American carrier may combine a service from New York to London with onebetween New York and Copenhagen by stopping in London but without trafficrights between London and Copenhagen. None of the above are entirely newconcepts but they have now become much more widespread in US bilaterals.
During the 1970s there had been a number of bilateral memoranda orexchange of letters covering aspects of non-scheduled services. But charter rightshad not generally been covered by the bilateral air services agreements. In thenew US bilaterals, charter rights are explicitly covered by the bilaterals and thegeneral articles of each bilateral are deemed to refer to both charter andscheduled services and airlines. Hitherto it had been usual to try and ensure thatrules regarding passenger access and other aspects of charter services (such asinclusive tour conditions, if any) were more or less similar for traffic originatingin each of the two countries involved. In order to be able to liberalize such charterconditions, the United States introduced the concept of country of origin rules.This gives each country the right to establish whatever conditions it requires forcharter services originating on its own territory while leaving the other country inthe bilateral free to do the same for its own originating charter traffic.
In a few bilaterals the country of origin concept was also introduced forscheduled tariffs. The idea here is that each country can approve or disapprovetariff levels or conditions only for traffic originating in its own territory. Itcannot prevent the implementation of fares approved by the other country fortraffic originating in that country. Clearly the country of origin rule for tariffsdoes not exclude the possibility that the two aeronautical authorities mightdecide to implement similar fares at both ends of the route, as has sometimeshappened. But the country of origin concept allows an individual country to bemore liberal in its tariffs policy than its partners might wish. The second newconcept on tariffs is that of double disapproval. Under traditional air servicesagreements, tariffs could not become operative unless approved by bothgovernments. In other words, either government on its own could block aparticular tariff proposal. If double disapproval is introduced into a bilateralagreement, a tariff can be refused only if both governments reject it. Onegovernment might not like a particular tariff but it cannot on its own prevent anairline from implementing it if the other government is prepared to approve it. Inother words, in agreeing to double disapproval, a government gives up its vetopower on tariffs.
It can be argued that the above concepts effectively change the previousbilateral philosophy of fair and equal opportunity for the airlines of bothsignatory states and of an equal balance of rights to a philosophy which stronglyfavours the larger aviation power. Multiple designation, break of gauge, countryof origin rules for charters, or double disapproval for tariffs all favour thecountries which have several large airlines and which are major trafficgenerators. They are concepts of limited value to countries which have only one
52 DEREGULATION AND ITS IMPACT ON THE INDUSTRY

airline, especially if it is not a large international carrier, and which are notthemselves generators of substantial volumes of scheduled or charter traffic. Inthe case of the US bilaterals, this imbalance was heightened by the unequalexchange of traffic rights. Whereas the US-designated airlines are given rightsfrom ‘any point in the United States’ to the major city or cities of the othercountry, the foreign designated carriers are given only a very few gateway pointsin the United States. Thus a single foreign airline flying to two or three USpoints may have to face the challenge of several US carriers able to operate fromanywhere in the United States and with any tariff structure so long as it is notpredatory.
3.6Bermuda 2: the United States-United Kingdom bilateral
Picking off a country at a time, the United States gave away one or two newgateway points to the foreign carrier in exchange for minimum fare controls,multiple designation, elimination of capacity controls and the liberalization ofcharter rules. The British were fortunate in having opened negotiations in 1976before the various objectives of the new US aviation policy had been clarified.As a result, in the new United States-United Kingdom bilateral signed in July1977 (known as the ‘Bermuda 2’ agreement), the British got more and gaveaway less than their European counterparts did a year or so later (HMSO, 1977).
On traffic rights the United Kingdom achieved important gains. It increased itsnamed gateway points in the United States from 9 to 14 with the addition of SanFrancisco, Seattle, Houston, Atlanta and Dallas-Fort Worth. United States fifthfreedom rights through London and Hong Kong were reduced. At the same timea new right was granted to both sides for the combination of services. The rightof ‘break of gauge’ was clarified and extended. Lastly there was a wide exchangeof rights for all-cargo services.
Capacity control was one of the most difficult issues, though a compromisewas eventually agreed for the North Atlantic. Airlines were to be required tosubmit their forecasts and advance schedules to the two governments, whichwould consult with each other if they disagreed. If no agreement was reached,airlines could operate the amount of capacity equivalent to the average of theirforecasts. This limited but important safeguard on capacity did not appear in someof the bilaterals signed later.
The UK accepted the principle of multiple designation between the twocountries but tried to secure single destination on each point-to-point routesegment. In the middle of the negotiations, however, the Court of Appeal ruledthat the UK government had no right to de-designate Laker Airways, which hadpreviously been designated to operate a London-New York ‘Skytrain’ service.The Court of Appeal decision undermined the British negotiating position but acompromise was reached. Double designation (that is, two airlines from eachcountry) was agreed for two routes only, New York-London and Los Angeles-
FLYING OFF COURSE 53

London. Elsewhere, single designation would prevail until the traffic on a routeexceeded 600,000 one-way passengers a year.
It was agreed that tariffs would be subject to approval by both governments. Ifagreement could not be reached, the existing tariffs would continue to beoperative. To prevent last-minute tariff changes and uncertainty, the bilateral laiddown a detailed timetable for the submission and approval of fare filings. Thiswas a new departure.
Lastly, charter rights were expressly included within the bilateral, and thegeneral articles pertaining to scheduled services were deemed to be applicable tocharter services as well.
On several issues the Bermuda 2 agreement was much less liberal than thebilaterals that followed. Within a year it was being attacked in the United Statesas being too protectionist compared with subsequent US bilaterals. In March1980 amendments were negotiated. They allowed for double designation on twomore routes (Boston and Miami) and for up to 12 new gateway points to beopened in stages up to 1984. New US carriers were also required to fly toGatwick rather than Heathrow. But the United States failed to achieve anysignificant concessions on tariff liberalization or an increase in its fifth freedomrights. There have been further amendments, notably in 1986 when frequencycontrols were further relaxed. But a major point of conflict has continued to bethe extensive fifth freedom rights enjoyed by US airlines between the UK andEuropean points. This, together with the huge domestic feed into theirtransatlantic gateways, has given US carriers a major competitive advantage. TheUK government has wanted traffic rights for British airlines beyond existing USgateways to other US cities. It refused to give US airlines rights to Manchesterunless such cabotage rights were granted (see Appendix A), though it did giveAmerican Airlines an interim permit in 1987 to serve Manchester. Early in 1990it was agreed by the two governments to set up a joint working party to deal withthe fundamental problems arising out of Bermuda 2.
3.7Deregulation through bilateral renegotiation
The Bermuda 2 agreement was the first major breach in the tradi-tional patternof bilateral agreements, but it was the United States-Netherlands agreement,signed in March 1978, which was to become the trendsetter for subsequent USbilaterals. During the negotiations the Dutch set out to ensure that Bermuda 2 didnot become the basis for the international regulation of air transport(Wassenbergh, 1978). It was too restrictive, whereas the Dutch wanted tomaximize competitive opportunities for their own airline, KLM, and they alsoviewed with alarm the diversion of transatlantic traffic via London as a result ofLaker’s cheap Skytrain services and the low scheduled fares, both of which hadfollowed quickly on the conclusion of Bermuda 2. Since the Dutch were startingfrom a viewpoint very similar to that of the United States, it was inevitable that
54 DEREGULATION AND ITS IMPACT ON THE INDUSTRY

the US-Netherlands bilateral agreement would be a particularly liberal one. Bothsides set out to reduce the role of the government in matters of capacity,frequency, tariffs and the setting of market conditions. The key terms of theagreement can be summarized as follows:
• agreement covers both scheduled and charter services;• multiple designation accepted (within two years the US government had
designated 8 scheduled and 13 charter airlines, though most did not operate;the corresponding Dutch figures were one and two;
• US airlines given unlimited authority from any points in USA viaintermediate points to Amsterdam and points beyond with full traffic rights(i.e. fifth freedom rights);
• Dutch airlines given points in the Netherlands to New York, Chicago,Houston, Los Angeles and one additional US point, as well as a Netherlands-Montreal-Houston route (i.e. Dutch given only limited number of USgateways and some doubt whether they have fifth freedom rights beyondUSA);
• no capacity or frequency restrictions;• no restrictions on ‘sixth’ freedom traffic;• unlimited charter rights between any points in either territory with country of
origin rules;• country of origin rules for scheduled tariffs; but government intervention
should be limited to prevention of predatory or discriminatory pricing. Tariffsshould be set by each airline on the basis of commercial considerations.
The protocol for the US-Netherlands agreement was signed in March 1978 at atime when negotiations had already been opened between the United States andBelgium and Germany for a revision of their bilaterals. Because of thegeographical proximity of these two countries to the Netherlands, they could notafford to be less liberal on either scheduled or charter rights than the Dutch hadbeen, otherwise considerable transatlantic air traffic would be divertedto Amsterdam and then move by road the short distances to Belgium or Germany.As a result, the US-Germany and the US-Belgium bilaterals concluded at the endof 1978 were very similar to the earlier US-Netherlands agreement. There werevariations, but the pattern was set. Other countries in the European area wereunder pressure to follow suit in their own negotiations with the United States.The US-Israel agreement went one step further because it included a doubledisapproval article on tariffs. One or two of the larger European aviation powers,notably France and Italy, held out against the trend towards deregulation, thoughthey too had to compromise on some issues.
Deregulation through bilateral renegotiation was also being pursued by theUnited States in other international markets. The most important after the NorthAtlantic for American airlines was perhaps the north and mid Pacific market.Here the United States negotiated several key bilaterals between 1978 and 1980
FLYING OFF COURSE 55
with Singapore, Thailand, Korea and the Philippines. These bilaterals followedthe same pattern as those in Europe. The United States offered these countries ahandful of gateway points in the United States, usually fewer than five, inexchange for most if not all of the US objectives previously outlined. One of thefirst renegotiated bilaterals was that between the United States and Singapore.The main features of the US-Singapore air services agreement of March 1978, asamended by a memorandum of understanding agreed in June 1979, are asfollows:
• multiple designation;• no unilateral control of frequency, capacity, scheduling or type of aircraft
used, though capacity should be related to traffic requirements;• no control of tariffs (except if predatory or discriminatory) unless both
governments disapprove a particular tariff proposal (i.e. double disapproval);• US airlines granted traffic rights ‘from the United States via intermediate points
to Singapore and beyond’;• Singapore’s designated airline granted rights from Singapore via intermediate
points to Guam, Honolulu, San Francisco and three additional points to beselected by Singapore;
• break of gauge permitted;• unlimited charter rights for airlines of both countries with country of origin
rules.
The other bilaterals between South East Asian countries and the United Statesgenerally incorporated the above features. Even the Philippines, one of thestrongest opponents of deregulation, eventually succumbed and in October 1980signed a new bilateral agreement with the United States, though this was not asliberal as the Singapore bilateral described above. Five years later the US-Malaysia air services agreement followed the same pattern. The only countries ofsignificance to try and slow down the rush to total deregulation were Japan andAustralia.
The Japanese wanted to maintain some control over capacity and preferred theIATA tariffs system to any general deregulation of tariffs. They were notprepared to give US airlines rights from any US point as the other new bilateralsdid. They also wanted fifth freedom rights between the United States and SouthAmerica, which the Americans were loath to grant. The Japanese stand againstderegulation meant that, instead of an entirely new bilateral, a series of interimagreements were signed with the United States, in 1982, 1985 and 1989. Eachsuccessive agreement opened up two or three United States or Japanese points toair services from the other country, increased the opportunities for air cargoservices and allowed an increase in the annual quota of charter flights. Thesechanges allowed a gradual expansion in passenger and cargo services betweenthe two countries while the Japanese gained some fifth freedom rights, notablyfrom Los Angeles to Brazil. But the Japanese continued to feel that air services
56 DEREGULATION AND ITS IMPACT ON THE INDUSTRY

between the two countries were biased in favour of the US airlines. So theycontinued to insist on a ceiling on the frequencies to be flown by both scheduledand charter carriers and would not allow US airlines to fly from any point in theUnited States to Japan.
The Australians were the most successful in the Pacific region in negotiating amore balanced bilateral with the United States. They took a tougher negotiatingstance and in May 1988 gave notice of termination of the 1980 memorandum ofunderstanding which governed capacity and services between the two countries.Just over a year later, in 1989, a new bilateral was signed. It gave each country’sdesignated airlines access to three new gateways in the other country in additionto the four existing ones. They could also serve eight further points via thesegateways. The US could designate one additional carrier, making five in all,while Australia obtained rights from the US west coast to European points,including Britain. Capacity could be increased, but only in response to growth ofUS-Australia traffic.
3.8The Show Cause Order and the declining influence of
IATA
The US policy objectives, outlined in the Presidential Statement of August 1978,were pursued not only through the renegotiation of bilaterals but also through adirect attack on the tariff-setting activities of IATA. In June 1978 the US CivilAeronautics Board issued an order requiring IATA and other interested parties toshow cause why the Board should not withdraw its approval of, andconsequently the anti-trust exemption for, IATA’s Traffic Conferences and otherrelated agreements. If exemption from anti-trust legislation was withdrawn, thenno airlines flying to the United States would be able to be parties to IATA tariffagreements without risk of being taken to court in the United States. Over 40 percent of IATA member airlines’ international traffic was and still is to and fromthe United States, so the potential threat to IATA was considerable. The ShowCause Order stirred up a hornets’ nest of protests from IATA, from manygovernments around the world, from regional organizations such as the Arab CivilAviation Council, and so on. Even the US Department of State, citing foreigngovernment protests, urged caution.
Following a hearing on the Show Cause Order, the CAB concluded, in a neworder in April 1980, that IATA tariff agreements substantially reducedcompetition. Nevertheless, they should be approved by the United States for aperiod of two years for reasons of diplomacy and to allow for someexperimentation in pricing. But the order excluded US airlines from participatingin IATA pricing agreements on the North Atlantic. In May 1981 a new CABdecision largely reconfirmed the decisions reached in its 1980 Order.Subsequently the whole process of the Show Cause Order was wound up byPresident Reagan.
FLYING OFF COURSE 57

The Show Cause Order and the controversy which surrounded it undoubtedlyundermined IATA’s influence. Its immediate short-term effect was thewithdrawal of all US airlines from IATA membership. When in 1979 IATAchanged its constitution to allow airlines to participate in trade associationactivities without participating in tariff agreements, some of these carriers creptback as trade association members only. Following the abandonment of the ShowCause Order, some US airlines began to participate again in the tariffs process. Butby June 1990 only Flying Tiger, American, Pan American, TWA and Unitedwere again full members of IATA, while another six US airlines were membersof only the trade association. Other US international airlines remain outsideIATA altogether.
A CAB order of April 1980 had required a non-IATA tariff experiment to bepursued on the North Atlantic. In practice this meant either bilateral agreementson tariffs on some routes or an open rate situation on others. A majorbreakthrough came in May 1982 when discussions between the United States andthe 10 key members of the European Civil Aviation Conference led to anagreement to set up fare zones—the so-called ‘zones of reasonableness’—onmost North Atlantic air routes (see section 11.6). The fare zonesagreement between the United States and ECAC was doubly significant. Itintroduced a new concept into international airline pricing but also it was amultilateral government agreement on tariffs completely outside the auspices ofIATA. As such it undermined the tariff-fixing role of IATA. Subsequent IATAtariffs on the North Atlantic have been fixed within the agreed fare zones orbands. Further evidence of IATA’s declining influence can be found in the tariffsclauses of some recent bilaterals. Whereas traditionally most tariffs clauses hadmentioned the use of IATA procedures where possible (see section 2.3 above),reference to IATA has become less frequent. Even ICAO, in a 1978 documentproposing standard bilateral tariff clauses, no longer mentioned IATA. Insteadthere is an ambiguous article which suggests that tariffs agreements ‘shall,wherever possible, be reached by the use of the appropriate international ratefixing mechanism’ (ICAO, 1978).
It is symptomatic of IATA’s diminished role in setting tariffs that only 83 ofits 157 trade association members in 1990 were full participants in its tariffcoordination activities. Nevertheless, on most international air services, IATAprovides the basic framework of air fares which governments appear happy toapprove, though many of them may be discounted or reduced by individualairlines.
3.9Deregulation spreading
Through the process of renegotiating its bilateral agreements, mainly in theperiod 1978–85, the United States managed to introduce a measure ofderegulation on routes to and from the United States. International or bilateral
58 DEREGULATION AND ITS IMPACT ON THE INDUSTRY

controls on new airline entrants, on capacity or frequency, on tariffs and oncharter services were reduced or eliminated. This was particularly so on theNorth Atlantic and the Pacific routes, and to an extent on the routes betweenNorth and South America. US pressures for deregulation had an impact on othercountries, such as Canada and the United Kingdom, and induced them to bemore liberal in their own aviation policies. For example, a new bilateral betweenCanada and the Federal Republic of Germany signed early in 1982 removedfrequency and capacity limitations on the airlines operating between the twocountries. Even more liberal was the 1987 UK-Canada air services agreement.Under this bilateral there is no control of capacity and route access is open. Thismeans that there is no limit on the number of airlines designated per route or onthe routes or points that can be served. Increased fifth freedom rights were alsogranted to both countries’ airlines. Instead of the more radical doubledisapproval regime, a zonal fare scheme was introduced which allowed airlinessome flexibility in pricing.
Such agreements were, however, relatively few, since there was little attemptby other countries to follow the United States example and systematicallyrenegotiate all their key bilaterals. Even countries with a liberal aviation policywere often schizophrenic in its implementation. Thus the British, whileprotagonists of liberalization in Europe, repeatedly refused to allow South EastAsian carriers to increase their frequencies on the London route. It was not till July1989, when a new bilateral was signed, that the British allowed SingaporeAirlines progressively to increase its London services from daily to twice dailyeven though the Singaporeans had been pressing for this for several years. Intheir turn, South East Asian airlines, while complaining of British protectionism,tightly controlled the third and fourth freedom capacities and frequencies ontheir own regional services.
In the second half of the 1980s the focus of deregulation switched to Europe.The first major breakthrough came in June 1984 with a new bilateral agreementbetween the UK and the Netherlands which effectively deregulated air servicesbetween them. This was the beginning of a series of steps towards Europeanderegulation which are analysed in the next chapter.
Outside Europe and North America a number of other countries also began tomove cautiously towards reducing controls on their air transport industries. InJapan, JAL’s effective monopoly of international air services was broken whenfrom 1986 onwards domestic carriers All Nippon Airways or Japan Air Systemswere designated as the second Japanese carriers on a number of key internationalroutes. In several South East Asian countries, new airlines were allowed toemerge to operate both domestic and international air services, often in directcompetition with the established national carrier. In South Korea, for instance,Asiana Airlines was formed in February 1988 and launched domestic services atthe end of that year. Regional services to Tokyo, Bangkok and Hong Kong wereexpected to start in 1990. Aerolift in the Philippines and Evergreen Airways ofTaiwan were other examples. In Australia in 1987, a new government aviation
FLYING OFF COURSE 59

policy reaffirmed Qantas’ continued role as the country’s sole designatedinternational carrier but announced a complete deregulation of domestic airservices from October 1990. This meant that the government would withdrawfrom regulating domestic fares or capacity. The previous policy of limitingdomestic trunk operations to only two carriers—Ansett and Australian—was alsoabandoned, though Qantas would still be precluded from operating purelydomestic services.
Such attempts at liberalization were often localized, haphazard anduncoordinated as between neighbouring countries. Their impact was fairlylimited. In all areas outside Europe and North America single designationprevails (except Japan), third and fourth freedom capacities and frequencies areregulated and many services are covered by revenue-pooling agreements. Ontariffs there is more flexibility. In many countries, governments, aviationauthorities and airlines turn a blind eye to illegal discounting of government-approved IATA fares. In this way de facto liberalization of tariffs has beenintroduced on many international routes. By 1990, the situation was one wherethe most liberalized markets for scheduled air transport were those to and fromthe United States and Canada. On the North Atlantic routes, for instance,capacity or frequency constraints had largely disappeared and entry of newcarriers was in theory easy because of multiple designation. The number of USgateway points had more or less doubled and on many routes US carriers couldadd new gateway points almost at will, though European carriers did not have thesame freedom. The tightly regulated tariffs agreed through the IATA mechanismhad been replaced by a more flexible system of fare zones, with airlines free topitch their fares anywhere within the relevant zones. Attempts to control andstandardize in-flight service had been abandoned. On the transpacific routes thesituation was similar in many respects but not so liberal. Route access was fairlyopen for US airlines, less so for Asian carriers. But, while capacity or frequencycontrols were imposed only on certain routes, there was probably greater pricingfreedom than on the North Atlantic since the agreed fares were widelydiscounted.
Within Europe the situation was very patchy. The most liberalized marketswere those between the UK and the Netherlands and UK to Ireland. At the otherextreme the Austria-Greece scheduled market or air services to eastern Europewere still characterized by capacity controls, revenue-pooling agreements andenforcement of IATA tariffs.
Elsewhere in the world, real liberalization had not progressed very far by 1990.On long-haul routes from Europe to central and South East Asia and Australasiathere was some pricing freedom through widespread discounting of IATA andgovernment-approved fares to which many governments turned a blind eye. Thesame was true of air services within South East Asia and the Pacific region. Onthe other hand, traffic rights and capacities were strictly regulated and revenue-pooling agreements were widespread. In Africa, South America, the Middle East
60 DEREGULATION AND ITS IMPACT ON THE INDUSTRY

and western Asia, deregulation had even less impact and the traditionalregulatory framework remained largely intact.
Thus, in order fully to assess the impact of deregulatory trends in the period upto 1990, one should examine developments on the North Atlantic and thetranspacific routes where international deregulation had started more than 10years earlier.
3.10The impact of international deregulation on the North
Atlantic and transpacific
3.10.1NEW CARRIERS AND EXPANDED CAPACITY
The most immediate effect of the renegotiation of US bilaterals was a dramaticexpansion in the number of airlines operating in deregulated markets and in thetotal scheduled capacity offered in those markets. Such expansion came about asa result of the multiple designation of United States airlines and of the openingof routes to new gateway points in the United States. In addition, several SouthEast Asian airlines started services to the United States for the first time.
Before the Bermuda 2 agreement in 1977 there were only three US carriers onthe North Atlantic—Pan American, TWA and National, though the latteroperated only from Miami. During the next two years or so they were joined byestablished scheduled carriers such as Delta, Braniff and Northwest and byformer charter airlines that had moved into scheduled services, such as WorldAirways, Transamerica or Capitol. The numbers swelled till at one time therewere about a dozen US carriers flying scheduled services on the North Atlantic.The number subsequently declined to fewer than 10 as a result of mergers andthe collapse of airlines such as People Express. Those remaining, however,included new entrants into this market such as American, Delta and Northwest,which operated huge domestic networks in the United States that could providesubstantial feed into their transatlantic operations. But from the European endthere were few new carriers since most countries had only one scheduled airlinecapable of mounting a North American service. Laker Airways started itsSkytrain services in 1978 only to collapse in 1982, though Virgin Atlantic,another British low-fare carrier, subsequently entered the market. Thus thecontinued national regulation of airlines in most European countries meant thatthere were few European airlines able to take advantage of the opening up of theNorth Atlantic.
On the international routes across the North Pacific the jump in the number ofcarriers and of capacity offered was also marked. Prior to 1978 there had beenonly seven airlines on these routes—Canadian Pacific, Pan American andNorthwest Orient from North America, together with China Airlines, Korean, JAL
FLYING OFF COURSE 61
and Philippine Airlines from the Asian side. By 1981 two entirely new Asianentrants had joined the market—Singapore Airlines and Thai International. Theywere joined by China’s CAAC, and in April 1983 Cathay Pacific started flyingfrom Hong Kong to Vancouver. Subsequently, Malaysia Airlines, Garuda andAll Nippon launched services to the United States. It may well be that the entryof so many new Asian carriers into the North Pacific for a time held back USairlines from entering the market. While many airlines showed a keen interestwhen multiple designation became possible, only Braniff went in in a big way in1979 and it subsequently collapsed. Other US airlines flirted with North Pacificservices for a short time before disappearing. By the end of 1983 United Airlineswas the only new US entrant still operating in this market. Within five years ithad taken over Pan American’s Pacific operations, but American and Delta hadalso started flying across the Pacific.
As a result of all this expansion, the number of US gateway points with directservices to Europe or Asian destinations increased dramatically. US cities withdirect air links to Europe more than doubled under the new bilateral agreements.But while by 1990 US airlines linked over 40 US points directly to majorEuropean destinations, European airlines were limited by the terms of thebilaterals to serving only about half that number of cities in the United States. Theimbalance in the Pacific was even greater. Asian airlines served only 8 or 9 citiesin continental United States while US airlines flew transpacific services fromwell over 20 American cities.
3.10.2DOWNWARD PRESSURE ON TARIFFS AND YIELDS
Two factors created a strong downward pressure on fares. First, the short-termabandonment of IATA tariffs following the Show Cause Order together with‘country of origin’ or ‘double disapproval’ tariffs clauses in many bilaterals gaveairlines considerable pricing freedom should they wish to use it. On the NorthAtlantic, the fare zones which were introduced by governments in 1982 andsubsequently adopted by IATA also gave airlines scope for price differentiation.Second, new carriers entering existing markets had a strong incentive toundercut the established airlines in order to capture an appropriate market share.
The impact of new entrants on tariffs and more particularly on yields can beseen in Table 3.1, which shows the average revenue per passenger-mile of UScarriers in the markets in 1979, the first full year of deregulation. It is quite clearthat in each market the airline(s) with the lowest yield and therefore the lowestfares are always the ones which entered these markets for the first time in 1978 or1979. Conversely, the old-established carriers have much higher yields. The caseof Braniff illustrates the point. On US to Latin American routes Braniff was anestablished carrier with a very high yield of 9.30 cents per passenger-mile. Withderegulation Braniff expanded in a big way on the Pacific and to a lesser extenton the Atlantic. To capture market share it went into both markets with very low
62 DEREGULATION AND ITS IMPACT ON THE INDUSTRY

fares. So low, in fact, that on both the Atlantic and the Pacific, Braniff had thelowest yield of any US airline. More surprisingly, Braniff’s Pacific
Table 3.1 Impact of new entrants on average fares: Average revenue per passenger-mileon scheduled services of US airlines in 1979 (US cents per passenger-mile)
Airline Route groups
Atlantic Latin America Pacific
Braniff 5.65* 9.30 4.61**
Delta 5.74 6.86Continental 8.18National 6.12 6.84**
Northwest 5.65** 6.99Pan American 8.27 10.06 7.79TWA 7.14Notes:1. Year of entry of new entrants:2. Underline shows lowest yield in each route group.Source: Compiled from CAB data.
yield was less than half the yield on Braniff’s own Latin American routes.The same pattern was repeated throughout the 1980s, on both the North
Atlantic and the transpacific routes. As new entrants came on to these markets,they invariably undercut the prevailing tariffs to capture market share from theestablished operators.
Laker and Braniff, which were the early price leaders on the North Atlantic,collapsed in 1982, but new carriers came in to replace them. First was PeopleExpress in 1983, later joined by Virgin Atlantic. Others such as World orWestern came in briefly on the North Atlantic and then left, and People Expressitself was taken over at the end of 1986. All these airlines offered most if not allof their capacity at ultra-low fares. With the exception of Laker, they did notcapture a significant share of the market. People Express carried only 1.7 per centof North Atlantic passengers in 1985 (IATA, 1986). But their impact on farelevels was significant, for they forced all the major scheduled airlines to offersome of their seats at fares which matched or were close to those of these newlow-fare entrants.
Further evidence of the falling yields can be found in the mix of traffic by faretype. On IATA airlines’ North Atlantic scheduled services in 1976 there were noultra-low budget or stand-by fares and capacity-controlled advanced purchasefares (APEX) accounted for only 11.1 per cent of the total passenger traffic. Tenyears later, in 1986, and several years after deregulation, 46.1 per cent ofpassengers were travelling on APEX and other capacity-controlled fares, with 1per cent on stand-bys (IATA, 1986). As more and more passengers travelled atthese lower fares, it was inevitable that the average revenue per passenger would
FLYING OFF COURSE 63

decline. Not only were more passengers travelling on these new cheaper faresbut even the North Atlantic average economy fare dropped in real terms (whenadjusted for the composite consumer price of the USA, Canada and westernEurope) in most years—especially in 1978 and 1979 and from 1982 onwards.
The experience of falling yields on the transpacific was similar but less welldocumented. Braniff once again was the early price leader. When it came on thePacific routes in 1979 it offered new very low advance purchase and other specialfares and sold a high proportion of its seats at these lower fares. When Unitedtook over Pan American’s Pacific services, it too started to cut fares to maintainmarket share. It was overtaken by All Nippon Airways, which launched its firstinternational services in 1986 flying from Tokyo to Guam, Los Angeles andWashington. It offered minimum fares of $450 one way to the United States,undercutting the previously prevailing minimum fares of $550 by $100. Here ason the North Atlantic, there was strong downward pressure on yields throughoutthe 1980s. It was not till 1988–9 that yields began to improve because there wasinsufficient capacity to meet the rapid growth in traffic. Under such conditionsairlines were able to push up their fares, at least for a year or two.
3.10.3HIGHER LOAD FACTORS
On the North Atlantic routes, the lower fares which resulted from deregulationand the entry of Laker, Braniff and, later, other low-fare airlines had a dramaticimpact on passenger demand. In 1978, scheduled passenger traffic jumped by 23.4 per cent and the following year it went up by a further 15.5 per cent. After that,as the worsening economic climate following the oil price increases of 1978–9began to bite, scheduled traffic growth slowed down and averaged only 5 per centper annum in the six years from 1980 to 1985 (Table 1.4). It actually dropped in1986 because of the fears of terrorism following the US air raids on Libya earlyin that year and the Chernobyl nuclear disaster. But in 1987 and 1988 trafficgrowth was again rapid. The initial rapid growth in traffic resulted in an equallymarked jump in the average passenger load factor for all North Atlantic servicesfrom 60.7 per cent in 1977 to 66.6 per cent in 1978 and 67.4 per cent in 1979. Itthen stabilized at around 67–70 per cent for the next 10 years, though it droppedback to 62.5 per cent as a result of the traffic fall of 1986. These were exceptionallyhigh passenger load factors when one bears in mind that between 1960 and 1975the average load factor on the North Atlantic never once reached 60 per cent.Thus deregulation had led to a better use of resources in that passenger loadfactors have risen by about 10 percentage points. In fact, the increase in loadfactors resulting from the rapid growth in traffic became a commercial necessityas average fare levels declined. Airlines became locked into a situation wherethey had to try to fill their aircraft to compensate for the lower yields perpassenger that they were obtaining. This was particularly so after fuel costs rosesharply in 1978–9.
64 DEREGULATION AND ITS IMPACT ON THE INDUSTRY

Overall passenger load factors for the transpacific routes are not available, buta similar pattern of development occurred. Lower fares and the entry of severalnew Asian carriers stimulated high growth rates and pushed up passenger loadfactors.
3.10.4THE COLLAPSE OF CHARTER TRAFFIC ON THE
NORTH ATLANTIC
The surge in North Atlantic scheduled passenger traffic in 1978 and 1979 was notall due to new traffic generated by lower fares. Some of it was traffic divertedfrom non-scheduled or charter services. An unexpected byproduct of theliberalization of scheduled services was the collapse of the charter market on theNorth Atlantic. This resulted from the introduction by the scheduled carriers oflow charter-competitive fares which passengers could use in many cases withoutthe constraints and inflexibilities associated with charter flights. The price leaderat this bottom end of the market was Laker Airways, which through its Skytrainconcept introduced charter economics into scheduled services. It did this byoperating aircraft with much higher seating densities and load factors than hadpreviously been thought acceptable for scheduled airlines and it was thereby ableto offer substantially lower fares. The traditional scheduled airlines were forcedto match Laker’s fares for at least a small proportion of their capacity. AfterLaker’s collapse, People Express, Wardair and Virgin Atlantic, all new entrants,became the price leaders in turn. The charters were undermined. From a peak of4.4 million charter passengers in 1977, representing nearly a third of total NorthAtlantic traffic, charter traffic has bottomed out at around 2 million a year. Inrecent years charters’ market share has been well below 10 per cent (Table 1.4above).
3.10.5US AIRLINES INCREASE MARKET SHARE
US airlines appear to have done better out of deregulation than most of theirEuropean or Asian competitors at least in terms of market share. In 1978, whenderegulation began, US airlines carried 43.9 per cent of the passengers betweenEurope and the United States, the European carriers carried about 50 per cent and5–6 per cent travelled with other foreign carriers. On the transpacific routes, theUS airlines’ share was 41.7 per cent (Table 3.2).
As deregulation in both these markets gathered pace, the US airlines at firstlost market share. On the North Atlantic this was partly due to the success ofLaker Airways’ low-fare strategy. On the Far East routes it was the inevitableconsequence of the entry of several new Asian airlines that had not flown acrossthe Pacific previously. As they launched their new services in the early 1980sthey captured market share from the already established US carriers. After
FLYING OFF COURSE 65

Laker’s collapse early in 1982, the US airlines began to push up their marketshare on the North Atlantic. They overtook the European carriers in 1985 and,despite a hiccup in 1986, they captured 47 per cent of the market in 1989. Withother non-European carriers carrying around 6 per cent of the traffic, this left theEuropeans with about 47 per cent. On the US-Far East routes the improvement inthe US airlines’ share came somewhat later, but by 1989 they had 49 per cent ofthe market, which was 7 percentage points higher than in 1978 (Table 3.2). Thusone objective of US deregulation policy, which was
Table 3.2 Share of total passenger traffic (scheduled and charter) carried by US airlines,1978–89
US airlines’ share in each market areaa
US-Europe%
US-Far East%
1978 43.9 41.71979 44.6 44.41980 42.9 42.01981 41.0 39.01982 44.9 39.31983 46.5 41.41984 47.2 42.61985 47.2 41.01986 43.0 40.71987 46.6 41.41988 49.2 45.51989 46.9 49.0Note:a In 1988 these two market areas generated about 56% of international travel to/from the
USA.Source: Compiled by the author from US International Air Travel Statistics, US
Department of Transportation.
to increase US airlines’ market share, appears to have been achieved (seesection 3.4 above).
Many factors explain the growing success of US airlines in these two majormarkets. At first the new US entrants into these markets were some of thesmaller and newer US airlines, such as People Express, or they were formersupplemental (charter) carriers, such as World. Their market penetration wasfairly limited. It was when the major US domestic carriers such as Delta andAmerican came on the Atlantic, and United, and later American and Delta, cameinto the Far East that US airlines’ market share began to improve. These and theother US carriers, which had also strengthened their domestic networks throughmergers, enjoyed a number of advantages.
66 DEREGULATION AND ITS IMPACT ON THE INDUSTRY

To capture market share the new US entrants, as well as the existing carriers,launched their European services from new gateway points such as Minneapolis(Northwest), Baltimore (World and later TWA), Charlotte (US Air) or Raleigh(American) that had previously not had direct European services and to many ofwhich European carriers were precluded from flying by the bilaterals. The samepattern was repeated on transpacific routes. The major US domestic carriersoperated their international flights from their domestic hubs into which theycould provide dozens if not hundreds of feeder services from all over the US.European airlines flying into Atlanta, Delta’s major hub, or into Dallas-FortWorth, American Airlines’ main hub, found it increasingly difficult to competeagainst these US carriers with their huge domestic feed. Similarly, Asian airlinesflying into Los Angeles found that the domestic feeder services into that airportwere dominated by US airlines that were their direct competitors on the Pacificroutes. Two or three of the US carriers enjoyed a further advantage throughhaving computer reservation systems (CRS) in widespread use by US travelagents. For instance, American Airlines’ Sabre system was subscribed to by overone-third of US travel agents. These systems not only gave US airlines animportant marketing advantage in the US but in some cases the CRS wereprogrammed to give display preference to their own airline on servicescompeting with foreign carriers. This was done particularly in relation to theirown connecting flights involving a change of aircraft but shown under a singleflight number.
US airlines, particularly new entrants, have been guilty of aggressive capacityexpansion in order to increase their market share. In the process they haveswamped their European or Asian competitors. In 1985 alone US carriersincreased seats on non-stop transatlantic services to Germany by 78 per cent,while Lufthansa actually cut its own seating capacity by 1 per cent. As a result,Lufthansa’s market share during the summer months fell from 47 per cent to 39per cent (Airline Business, June 1986). In July 1990 Thai International, with atotal of four weekly flights from Bangkok to the United States (via Tokyo), wasbeing swamped with 30 weekly flights operated by Northwest, Delta and United,a 7:1 imbalance. Thai International wanted to mount more services but theUnited States would not grant fifth freedom rights out of Tokyo for anyadditional flights. In November 1989 the Thais, feeling that the post-deregulationbilateral was weighted against them and increasingly concerned at their inabilityto match the US mega-carriers, gave 12 months’ notice of termination of the airservices agreement with the United States.
Finally, the US carriers had used their old-established fifth freedom rights andtheir newly acquired break-of-gauge rights to establish hubs in Tokyo and anumber of European airports such as Paris. The aim was to schedule a group oftheir own arriving and departing flights at the foreign hub in such a way as toprovide a very wide range of connections between US and foreign points. Suchconnections were often given a single through flight number so that passengersmight be unaware that an aircraft change was involved in Tokyo, London or
FLYING OFF COURSE 67

Paris. The workings of Northwest’s Tokyo hub is shown in Figure 3.1. It is clearthat this gave Northwest a major advantage in marketing its services on bothsides of the Pacific. The Japanese, like the Thais, complained of being swampedby US capacity. Japan Air Lines (JAL) early in 1990 claimed that US airlines,taken together, operated 40 per cent of the international slots at Tokyo’s Naritaairport for their transpacific services, whereas JAL had only 42 per cent of theslots with which to mount all its international operations (Bangkok Post, 23 May1990).
3.10.6ADVERSE EFFECT ON PROFITS
Data on the financial performance of European or Asian airlines on transatlanticor transpacific routes are not published, but such data are available for the USairlines. These show that, in the years following the advent of deregulation, theAmerican airlines faced spiralling operating losses in both these markets. On theNorth Atlantic, most of the US carriers made losses each year from 1979 to 1982and on the Pacific losses were incurred annually between 1980 and 1982. Mostof the competing European and Asian carriers also made losses in these marketsduring that period. After 1982 the steady drop in the real price of fuel, especiallyin 1986–7, helped most airlines move into profit as operating costs fell. Evenwhen most operators were making profits, however, the new entrants were losingmoney as they tried to establish themselves. For example, United entered thePacific routes in 1983 and, though the other US airlines made profits in that andsubsequent years, United had four years of losses before posting its first profit of$15.7 million in 1987. In that year and in 1988 substantial profits were made inthis market, yet American Airlines, which entered the Pacific in 1987, madelosses here in both those years. The same pattern manifested itself on the NorthAtlantic. New entrants initially made losses for two or more years and thencollapsed altogether, or left the North Atlantic. Some, such as Northwest,eventually broke through into profitability but after years of losses.
It is difficult, however, to establish the degree to which spiralling losses on theNorth Atlantic and Pacific routes in the three or four years after deregulation canbe attributed to the general economic recession and to the dramatic fuel priceincrease of 1978 rather than to the impact of deregulation. Certainly there is aclose correlation between worsening financial results and the advent ofderegulation in 1978 and 1979, though this does not necessarily indicatecausality. While any casual relationship between deregulation and worseningfinancial performance cannot be conclusively established, it is clear that theabsence of effective capacity and/or tariff controls makes it particularly dificultfor airlines to climb out of a crisis. With no multilateral agreement on tariffs, nosingle airline is prepared to increase its tariffs unilaterally in order to reduce itslosses or to compensate for cost increases for fear of losing traffic. If one airlineactually reduces its tariffs, the others feel they have to match them. The evidence
68 DEREGULATION AND ITS IMPACT ON THE INDUSTRY
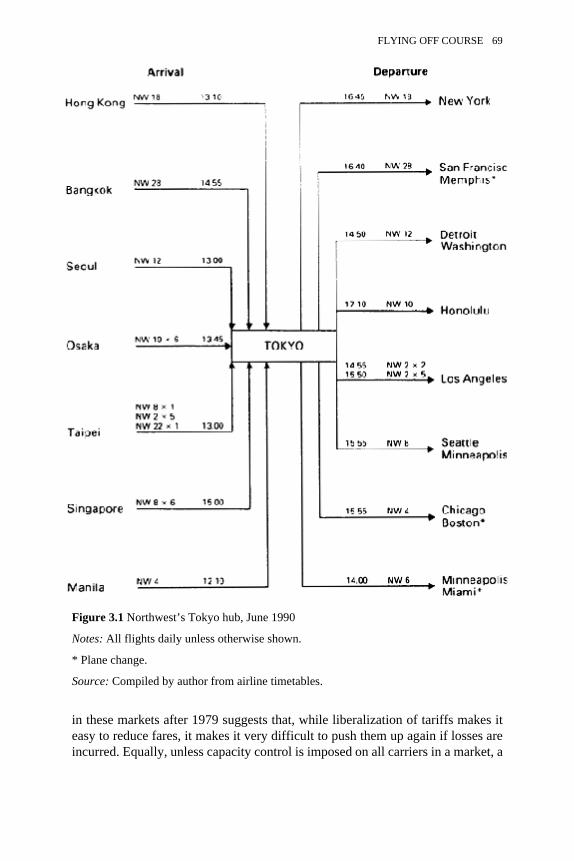
in these markets after 1979 suggests that, while liberalization of tariffs makes iteasy to reduce fares, it makes it very difficult to push them up again if losses areincurred. Equally, unless capacity control is imposed on all carriers in a market, a
Figure 3.1 Northwest’s Tokyo hub, June 1990
Notes: All flights daily unless otherwise shown.
* Plane change.
Source: Compiled by author from airline timetables.
FLYING OFF COURSE 69

single carrier is loath to reduce its own capacity or frequencies for fear of losingmarket share. While airline problems on the North Atlantic or the Pacific in theearly 1980s and especially in 1979–82 cannot be attributed to deregulation, thereis some evidence to suggest that deregulation deepened and prolonged the crisis.In these deregulated markets it became very difficult to raise yields or loadfactors sufficiently to compensate for cost increases when input costs were rising.This raises an important theoretical question: have deregulated airline marketsbehaved as expected?
3.11Competition in international air transport in theory and
practice
The lessons of deregulation of international air transport can best be seen withregard to North Atlantic services where deregulation started earlier, and wentfurther.
The economic theory of perfectly competitive markets requires that theproduct should be homogeneous and that there should be ease of entry for newsuppliers to enter the market and operate without price or capacity controls. Thetheory also requires that consumers should be fully aware of the prices beingoffered by the different suppliers. To obtain the benefits of competition ininternational air transport, United States and other policy makers had to ensurethat these conditions prevailed within the industry. Airline products are fairlyhomogeneous, so this was not a problem (section 1.6 above). Multipledesignation, more US gateway points and relaxation of charter rules ensuredfreedom of entry. Absence of marked cost economies arising from large-scaleoperations within the airline industry facilitated new entrants. Reduction ofgovernment intervention in pricing through country of origin rules, doubledisapproval or zones of reasonableness enabled airlines to have considerablepricing freedom. By removing capacity or frequency controls through thebilaterals and by banning inter-airline pooling agreements as illegal underantitrust legislation, airlines operating to the USA were also freed of any outputlimitations.
Having created conditions of free competition in markets such as the NorthAtlantic, then economic theory predicts what should happen. Airlines competeprimarily in terms of price but also in terms of frequencies, departure times, in-flight service, points served, and so on. Those airlines that are inefficient, eitherbecause they are unable to capture sufficient market share or because their costsare too high in relation to the prevailing tariffs, make losses and withdraw fromthe market. The more efficient, low-cost airlines remain in the market operatingat tariffs that are lower than in the pre-competition days but are neverthelessprofitable. Even if only one or two airlines remain, they will be inhibited fromincreasing tariffs to obtain excessive profits for fear of new entrants coming on tothe routes. This view was reinforced by the so-called theory of contestability
70 DEREGULATION AND ITS IMPACT ON THE INDUSTRY

developed by US economists in the early 1980s. They claimed airline marketswere clearly contestable in that there were no real barriers to market entry orexit. Fear of new entrants would be enough to ensure that monopoly or duopolyoperators did not abuse their dominant position but behaved as if the market wascompetitive. In such a competitive environment, consumers would be better off.They would enjoy lower tariffs and a wider range of services and product features.In brief, this was the theoretical argument put forward by the protagonists ofderegulation.
When applied to international air transport there is a flaw in the theory whichhas been overlooked. The theory of competition requires not only freedom andease of entry but also freedom of exit, so that loss-makers leave the market to themore efficient carriers. In practice, on international air routes the loss-makerstend not to leave the market but continue to operate despite their losses. This isbecause many will be state-owned airlines and may receive direct subsidies, as AirFrance did in the early 1980s, or government support to enable them to raisefurther loans from the government-owned banks, as Olympic Airways has donefor more than a decade. Even if privately owned, unprofitable airlines stay inbusiness by selling off non-airline assets. In the 1970s, Pan Am sold the Pan Ambuilding in New York and in 1981 when it lost $341 million it was able to coverthe loss by disposing of the InterContinental Hotel chain. In 1985 it sold its Pacificnetwork to United Airlines in order to salvage its Atlantic operations. After aloss of $337 million in 1989, it offered its internal German and US shuttleservices for sale in the spring of 1990. In the last analysis, loss-making airlines maybe able to continue operating for longer than would otherwise be the casebecause of their ability to reschedule their debts, as Braniff did for a time beforeits collapse in May 1982. Then there are the marginal carriers, that is, airlineswhose transatlantic services are only a small part of their total operations. Suchairlines, as mentioned in the previous section, can cross-subsidize losses forseveral years from domestic or other profits. Thus Northwest made losses on theNorth Atlantic for four years after it launched its services in 1979 but still keptgoing.
A further market distortion arises because it is often the loss-making airlinesthat are the price leaders. There was considerable evidence of this ontransatlantic routes. As Laker and Braniff faced financial difficulties, they cutfares to generate cash flow. Since other carriers matched them, they therebyreduced or destroyed everyone’s profitability. This happened repeatedly. Asairlines got into difficulties they dropped their fares. In the spring of 1986,People Express filed proposals for a one-way advanced purchase fare London toNew York at $99/£66 for the first 30 seats and $149/£99 for the next 70 seats andat the same time offered agents’ commissions of up to 18 per cent (LloydsAviation Economist, August 1986). These were the panic measures of an airlineon the verge of collapse. But since People kept going for another nine months, ithad a depressive effect on all airlines’ tariffs. TWA, which was also facing
FLYING OFF COURSE 71

growing financial problems on the North Atlantic in 1986, was the other priceleader.
The ability of transatlantic airlines to continue to operate on routes on whichthey were incurring substantial losses, while pushing tariffs downward, clearlyundermined the economic theory. It resulted in over-capacity and in subsidizedor cross-subsidized competition, which forced the tariffs of all operators down touneconomic levels. Airlines became locked into a situation where tariffs weretoo low in relation to the costs of even the more efficient operators but where itwas impossible to raise the tariffs or reduce capacity because of competitivepressure from loss-making airlines. Virtually all airlines ended up making lossesfor several years after deregulation started. No one seemed able to break out ofthis mould until costs fell when oil prices slumped.
Even in the later 1980s when many airlines were making good profits on theNorth Atlantic and North Pacific markets, other airlines were continuing tooperate at a loss. The most spectacular example was Philippine Airlines. It wascarrying two-thirds of the traffic between the Philippines and the United States,its daily flights operated at very high load factors, yet it made large losses on thisroute because its yields were too low. They were so low that its breakeven loadfactor was reputed to be above 100 per cent. It continued to accumulate lossesyear after year, unable either to break out of the loss-making spiral or to leavethis market altogether.
What about the consumer viewpoint on all this? There can be little doubt thaton both the North Atlantic and the North Pacific routes consumers havebenefited. First, they have had a wider range of airlines and airline products tochoose from. Secondly, the passenger has benefited from much lower fares. Thevery low walk-on fares introduced on Laker Airways’ Skytrain servicesgenerated a host of new low-fare types on the North Atlantic such as budgetfares, standby fares, and so on as well as the illegal discounting of fares.Subsequently, low-cost operator People Express (until its demise) and, morerecently, Virgin Atlantic have maintained the pressure for low fares on the NorthAtlantic. On the North Pacific it was Braniff, through its ultra-low budget andAPEX fares, which was the early leader in inducing other carriers to lower ordiscount their fares. But each new entrant, as shown earlier, has undercut theprevailing tariffs. Finally the consumer has benefited from an increase in thenumber of direct point-to-point air services between new US gateways anddestinations (or origins) in Europe and Asia. These benefits have also accrued tothe cargo shipper.
The consumers have clearly benefited from lower fares, high frequencies andgreater product choice. But airlines have found themselves in a position where thecontinued operation of loss-making services, which in theory should have beenwithdrawn, jeopardizes the profits of all airlines—even the most efficient. Thissuggests that international air transport cannot operate entirely free of bothcapacity and price regulation. Indications from other market areas, notably thatof South East Asia where there is de facto liberalization of tariffs but some
72 DEREGULATION AND ITS IMPACT ON THE INDUSTRY

bilateral controls on capacity, suggest that most consumer benefits can beachieved while ensuring airline profitability if there is some control of capacityin deregulated markets. International air transport exhibits too many marketimperfections to work as theory would suggest in a totally deregulatedenvironment.
FLYING OFF COURSE 73

41992 and All That— Liberalization in
Europe
4.1The focus switches to Europe
While in the early 1980s the pressure for international liberalization and changeemanated from the United States and primarily affected air services to and fromNorth America, in the second half of the decade the focus of deregulationswitched to Europe. Consumer pressures for liberalization of air transport builtup throughout the 1980s. They were reinforced by the mounting pressure bothfrom within the European Parliament and from the Commission of the EuropeanCommunities for major changes to the structure of regulations affecting airservices between the member countries of the Common Market. But it was nottill the mid-1980s that the first significant breakthroughs were achieved. Changesin the regulatory environment were introduced in two ways: first, bilaterallythrough the renegotiation of air services agreements between pairs of countries;secondly, multilaterally, through actions initiated by the European Commissionin Brussels or the European Court of Justice. While these two bodies broughtabout liberalization of air services within the 12 member states of the EuropeanCommunity, they inevitably induced some liberalization within the wider Europeof 23 states grouped within the European Civil Aviation Conference (ECAC).The 11 ECAC member states that were not within the European Communitywere anxious not to be bypassed by the regulatory changes taking place withinthe Community.
4.2Bilateral liberalization
The more liberal and free-market attitudes towards air transport prevailing in theUnited Kingdom pushed it to renegotiate most of its key European bilaterals inthe period from 1984 onwards. The first major breakthrough was in June 1984when a new air services agreement was negotiated with the Netherlands, anothercountry set on liberalization. This agreement, together with further modificationin 1985, effectively deregulated air services between the two countries.

Free entry of new carriers, access by designated airlines to any point in eithercountry, no capacity controls and a ‘double disapproval’ regime for fares (seesection 3.5 above) were the key features introduced. These features, some ofwhich were first introduced in the revised United States bilaterals discussedearlier, represented a clear break with the traditional European bilaterals whichhad prevailed till then (Table 4.1). These earlier agreements were very restrictivein terms of market access and, by limiting capacity and price competition, theyhad severely reduced the scope for airline competition.
The UK-Netherlands agreement set the pattern for the renegotiation ofEuropean bilaterals. Later in 1984 the UK signed a new air services agreement withGermany and in the following year agreements were concluded withLuxembourg, France, Belgium, Switzerland and the Irish Republic. Not all theseagreements went as far as the UK-Netherlands agreement had done in removingconstraints on competition, but all of them allowed for multiple designation ofairlines by each state, while several of them also removed capacity restrictionsand introduced double disapproval of tariffs. Others maintained some capacityand fare controls, as was the case with the UK-France agreement.
Some UK bilaterals went through a two-stage process. An initial agreementbrought partial liberalization, to be followed by a more
Table 4.1 Traditional and new-style European air services agreements
Traditional bilateral New-style bilaterala
Airlines One per route from each state—inmost cases this was the nationalcarrier
Multiple designation
Routes Only to points specified inbilateral
Open route access—airlines can flyon any route between two states
Capacity Shared 50:50— between airlines oftwo states
No capacity control
Fares Approval of both governmentsneeded— but negotiated throughIATA
Double disapproval—fares can berejected only if both governmentsdisapprove
a e.g. UK-Netherlands as negotiated in 1984 and amended 1985.
radical second agreement. This happened with the UK-Ireland bilateral. Arevised agreement in 1985 was superseded by a further agreement in 1988 whichallowed for multiple designation, open route access, no capacity restrictions anddouble disapproval of fares.
While the United Kingdom set the pace, other European states also began torenegotiate their bilaterals in this period. Though they did not usually adopt allthe features of the UK-Netherlands agreement in one go, the aim of suchnegotiations was usually to introduce gradual liberalization.
The impact of this bilateral liberalization was greatest in countries wheredomestic liberalization had encouraged the emergence of several airlines with the
1992 AND ALL THAT—LIBERALIZATION IN EUROPE 75

potential for international operations. Where the domestic air transport regimewas highly regulated and controlled, then the impact of liberalization was moremuted. Thus the French government’s strategy of maintaining Air France asFrance’s major international airline in Europe meant that by 1990 this airline wasthe sole French operator on the various London-Paris routes. Yet from the Britishside six airlines were operating on the route— British Airways, Air Europe, DanAir, Air UK, British Midland and Brymon—and it was the new British entrantssuch as Air Europe which were most innovative in their pricing. But even they wereheld back by the French government’s refusal to approve 30 per cent lower fareswhen Air Europe entered the London-Paris market in 1988. A 15 per centreduction was eventually approved.
The potential effect of bilateral liberalization can be seen most clearly in theUK-Netherlands market because here the regulatory regimes at both ends werealready very liberal. In June 1984 there were four airlines flying betweenAmsterdam and the various London airports: British Airways and KLM flewfrom London-Heathrow, Air UK from Stansted, and British Caledonian fromLondon-Gatwick. In so far as Rotterdam is close to Amsterdam, one should alsoinclude the NLM services from Heathrow to Rotterdam. As with the NorthAtlantic, deregulation attracted many new entrants. By the end of 1986 these fivecarriers had been joined by British Midland (Heathrow-Amsterdam), Transaviaand KLM (Gatwick-Amsterdam), Netherlines (Luton-Amsterdam), and BritishCaledonian (Gatwick-Rotterdam). Nine airlines in all were serving this market.In April 1987 two more, Brymon and London City Airways, were licensed tooperate STOL services to Amsterdam from London’s new Docklands airport. By1990 there were still 10 carriers on the London-Amsterdam/Rotterdam routes,though some of the names had changed.
There was inevitably a significant jump in the capacity available on London-Amsterdam/Rotterdam services. In 1985 capacity grew by close to 20 per centand by the end of 1986 by a further 30 per cent or so. This capacity growth wasmarkedly higher than that on most European routes from London. Traffic growth,however, did not match capacity growth despite a significant drop in the level ofpromotional fares. On services from Heathrow, Gatwick and Stansted toAmsterdam/Rotterdam, passenger numbers grew only 6.7 per cent in 1985 and afurther 9 per cent in 1986. These growth rates were broadly similar to thoseachieved on other major European routes from London, such as those to Paris,Brussels or Frankfurt, where liberalization had as yet had little impact. Thus, thegrowth on London—Amsterdam/Rotterdam, which in any case was notremarkable, cannot be attributed to liberalization of air services. Moreover, thefact that capacity has been growing faster than traffic led initially to a markeddrop in passenger load factors. It was only in 1988 that load factors began toimprove.
76 FLYING OFF COURSE

4.3Multilateral liberalization
4.3.1THE EUROPEAN COMMISSION’S AIR TRANSPORT
OBJECTIVES
The European Commission’s Directorate General for Transport espousedliberalization early on and has been trying to push various proposals through theCouncil of Ministers since 1975. Initially its only limited success was the July1983 Council Directive on Inter-Regional Air Services (CEC, 1983). Thisallowed airlines flying aircraft of 70 seats or fewer to develop air routes freelybetween regional airports within the European Community. However, byexcluding air routes from regional centres to capitals or major hubs, this directivehad relatively little effect.
The European Commission outlined its own air transport objectives in theMarch 1984 Civil Aviation Memorandum No. 2 (CEC, 1984). This includedproposals for a reduction of capacity controls within Europe, for greater pricingflexibility through the adoption of fare zones or ‘zones of reasonableness’, andfor allowing revenue-pooling agreements only if the transfer limits were verytight and thereby encouraged competition. From this Memorandum and fromvarious subsequent speeches by officials of the Directorate General for Transportit was possible to identify the Commission’s long-term air transport objectives.These could be summarized as follows:
(1) Community airlines should be free to operate between any airports in the 12member states.
(2) Until the creation of the single internal market on 1 January 1993, fifthfreedom rights should be available for members’ airlines on intra-Community services but with some limits on the capacity offered.
(3) Multiple or double designation of airlines on all routes once traffic surpassescertain threshold levels.
(4) No capacity controls on air services.(5) Cabotage (that is, the right to carry traffic between two points in the same
country) should be available within limits.(6) Fares to be set freely by airlines but states should have powers to control
predatory pricing. In time, a ‘double disapproval’ regime should beintroduced.
(7) Airlines of one state (A) should have the same rights in another state B asairlines of that state (B).
(8) Anyone meeting the technical and economic standards required forestablishing an airline in any Community state should have the right to setup an airline in that state without hindrance.
1992 AND ALL THAT—LIBERALIZATION IN EUROPE 77

(9) Negotiations of traffic rights with non-Community states should be carriedout by the Community rather than bilaterally as previously.
These objectives of Community aviation policy emerged slowly during themid-1980s but they do give a clear indication of the degree to whichliberalization will be pursued both with regard to intra-Community air servicesand with the aim of opening up restricted national markets such as those ofGreece. Clearly objectives (7) and (8) above are aimed at undermining anyattempts to preserve national monopolies such as those of Olympic Airways.
Attempts were made to introduce some of these objectives, even in a limitedform, through the Council of Ministers in 1986. But it was not till December1987 that the Community transport ministers agreed on an air transport packageof measures, which was the first major step towards gradual liberalization. Moreof this later (section 4.3.3).
4.3.2APPLICATION OF COMPETITION RULES TO AIR
TRANSPORT
Meanwhile, impetus for change within the European Community followed amore legalistic form. The breakthrough came with the April 1986 decision of theEuropean Court of Justice on the ‘Nouvelles Frontières’ case. The court decidedthat the competition articles 85–90 of the Treaty of Rome do apply to airtransport and that only a specific decision by the Council of Ministers could giveexemptions for inter-airline agreements. Pending such a Council decision,competent authorities—that is, the Commission or individual governments —candeclare particular airline activities illegal. It was on this basis that in September1986 Peter Sutherland, Commissioner for Competition, wrote to all the majorscheduled airlines of the Community asking them to explain and justify any anti-competitive agreements, such as revenue pools or price agreements, which theyhad entered into with other airlines.
Sutherland’s action made it essential for agreement to be reached atCommunity level. One of the package of measures agreed by the Ministers ofTransport in December 1987 was the specific application of the competitionarticles of the Treaty of Rome to air transport. This explicitly removed anyambiguity or uncertainty. Two of the articles were particularly designed to fostercompetition within the European common market:
• Article 85, which prohibits and makes unenforceable anti-competitiveagreements, decisions and concerted practices which eliminate, reduce ordistort competition unless specific exemptions have been granted;
• Article 86, which prohibits an abuse of a dominant position within theCommunity or any part of it so as to affect trade between EEC member states.
78 FLYING OFF COURSE

While the categories of prohibited agreements under Article 85 were not clearlydefined, it was apparent that capacity-sharing agreements, tariff-fixing andrevenue-pooling were not likely to be acceptable. Yet these were traditionalelements of the hitherto existing regulatory regime in Europe as in much of theworld. The Commission was given powers in December 1987 to grantexemptions, as it did in July 1988 (see section 4 3.3 below), but such powerswere limited to intra-Community services only. Exemptions could not be grantedfor agreements between Community and non-Community airlines.
The application of Article 86 regarding the abuse of dominant position wasmore problematic since it involved defining what constitutes a dominant position.According to Dr John Temple Lang of the Directorate General for Competition,a ‘dominant position is one in which a company is able to behave to anappreciable extent independently of other companies and has the power toprevent effective competition being maintained. Dominance is indicated by amarket share over 40 per cent, advantages not shared by competitors—economies of scale and of scope—and other circumstances’ (Lang, 1989). Suchdominant airlines must not restrict competition or take advantage of their marketpower by discriminating against other airlines wishing to use any facilities (suchas a computer reservation system) which they might control. According to DrLang, dominant airlines are obliged, among other things:
• not to enter agreements on fares or otherwise which eliminate competition;• not to give travel agents commissions so as to cause the agents to deal with
them exclusively;• not to use their computer reservation systems (CRS) to give themselves undue
advantage over their competitors;• not to buy equipment only from suppliers of their own nationality (European
Court’s Saachi judgment);• not to refuse to accept interline traffic from another airline without sufficient
justification. The fact that the other airline charges lower fares is notsufficient justification;
• not to manipulate their airport arrangements in such a way as to causeartificial disadvantages for their competitors, such as by tying up moreterminal facilities or runway slots than necessary;
• not to use ‘predatory pricing’ to force competitors out of a market (Lang,1989).
The Commission believed that by 1989 all these rules followed from existingCommunity law and did not require to be specifically introduced in any airtransport measures. However, there were areas of possible abuse of dominantposition, such as runway slot allocation methods, CRS bias or exclusive groundhandling arrangements, which would require direct Commission intervention.
The European Commission has very wide powers to investigate possibleinfringements of the competition rules, and may enter premises, make copies of
1992 AND ALL THAT—LIBERALIZATION IN EUROPE 79

documents, take statements and generally demand information from thoseinvolved. It may also impose very large fines on those who do not cooperate inits investigations or who infringe the competition rules. Fines of several millionECU, the European standard currency, have been imposed on companies in otherindustries (an ECU was worth US$1.22 early in 1990). Companies fined canappeal to the European Court of Justice.
The trend towards mergers and purchases of minority shareholdings amongCommunity airlines which began to manifest itself in 1987 raised the question ofwhether the competition rules could be circumvented through mergers or otherlinkages. The Commission has always claimed that it had powers to controlmergers and cross-shareholdings under the existing Articles 85 and 86. It usedthese powers in March 1988 to force British Airways to give up a significantnumber of routes and runway slots at London’s Gatwick airport when it took overBritish Caledonian. The Commission, however, has no clearly defined policy onmergers. It treats each case on its merits, its aim being to ensure that there is noabuse of dominant position and that a ‘sufficient number of competitors isavailable to provide effective competition in the future’ (Lang, 1989).
Such general guidelines are of little help to airlines in their strategic planning.As a result, mergers and share buying proliferated between 1988 and 1990 andthe Commission seemed very slow in responding. It was taking many months toreach decisions on crucial issues referred to it. When in November 1988 theFrench government announced a policy of one French airline per route, UTA(the French private airline) complained to the Commission since the decisioneffectively precluded it from entering any routes already operated by Air France.The Commission dragged its feet and before it had pronounced on the issue AirFrance bought a majority share in UTA in January 1990. Early in 1990, afterKLM and British Airways each took a 20 per cent shareholding in Sabena WorldAirlines, the Commission responded more quickly. It declared in June 1990 thatthe deal could not be exempted from scrutiny and opened discussions with thethree partner airlines.
Meanwhile, in December 1989 the Council of Ministers approvcd a regulation*
on mergers which would come into effect in September 1990. This establishedthe threshold for mergers which would be subject to investigation only by theCommission and not by national authorities as well. These would be mergerswhere the joint turnover of the two companies would be at least 5 billion ECU(that is over $6 billion) while that of each company was at least 250 million ECU.Mergers meeting this threshold but where each partner had at least two-thirds ofits turnover in one state would be exempt from direct Commission investigation.This regulation further confused the issue since only a few airline mergers wouldbe large enough to meet the 5 billion ECU threshold. By implication this wouldmean that they would be subject to investigation only by any national controlauthority. However, the Commission claimed that this did not exempt airlinemergers below the threshold from Community laws on competition rules.
80 FLYING OFF COURSE

4.3.3THE 1987 AND 1990 PACKAGES
It is evident that deregulation of air transport within the European Community iscoming about as a result of strong pressure from two separate directions, namelyfrom the Directorate General for Transport (DG VII), which is concerned withair transport policy, and the Directorate General for Competition (DG IV). Whileother Directorates have becomc involved in a number of related but marginalissues, it is these two Directorates which have pushed deregulation forward. Theirefforts have frequently been facilitated by decisions of the European Court ofJustice, which has also played a key role.
However, the gradual steps towards air transport deregulation can beunderstood only within the wider political context of European integration andthe creation of a single internal market covering the 12 member states of theEuropean Community. In a series of meetings during the early 1980s the headsof state of member governments had pledged themselves to the completion of theinternal market as the Community’s first priority. The agreed date for the singlemarket to come into existence was 1 January 1993. This meant that by the end of1992 immigration and customs controls between the 12 were to be abolished sothat to all intents and purposes the European Community would become a single‘domestic’ market open to the free movement of goods, services and people. TheEuropean Commission, in effect the administrative arm of the Community,acting through the Council of Ministers, took steps in all areas of economicactivity to ensure that the movement of goods and services within the internalmarket was not distortcd by artificial barriers to trade. Liberalization of airtransport was only one of the Commission’s many initiatives. The abolition ofinternal frontiers would have farreaching implications for airport layout and forthe operation of international air services. Yet by early 1990 the member stateshad not yet decided how and to what degree internal immigration controls wouldbe removed.
Meanwhile, the air transport and competition objectives outlined earlier havebeen achieved in stages. The first was the so-called ‘December 1987 Package’ ofmeasures agreed by the Council of Ministers. This was the first step towardsliberalization of air transport within the Community as a whole (Table 4.2). Itintroduced a more liberal fares regime including the concept of fare zones. Itabandoned the equal sharing of capacity by airlines of each state and facilitatedthe entry of new airlines by opening up market access (CEC, 1987a).
In their 1987 package, the ministers of transport explicitly acknowledged thatthe competition articles of the Treaty of Rome applied to air transport (CEC,
* ‘Regulations’ agreed by the Council of Ministers are binding in their entirety anddirectly applicable in all member states. ‘Directives’ are binding on member states as tothe results to be achieved but leave implementation to individual states through their ownlegislation.
1992 AND ALL THAT—LIBERALIZATION IN EUROPE 81

1987b). Many of the inter-airline agreements then in existence would be illegalunless specific exemptions were granted. The exemptions were published by theEuropean Commission in August 1988 and covered agreements andarrangements between Community airlines which were concerned with aspectsof:
capacity-planningrevenue-pooling
tariff agreements runway slot allocation and scheduling
jointly owned computer reservation systemsaircraft, passenger or cargo handling.
These block exemptions were granted only if certain demanding conditions weremet (CEC, 1988), the aim of such conditions being to avoid abuse ofoligopolistic power or discrimination against new entrants or airlines not wishingto join such agreements. Thus, revenue pools were exempted only if their aimwas to compensate airlines for schedules at unpopular times, if there was atransfer limit of 1 per cent of the donor airline’s revenue and if no cost-sharing wasinvolved. Tariff agreements were exempted when subject to governmentapproval and if they did not involve capacity-sharing. Also they should not bebinding on other airlines.
The second stage in the liberalization process was set in motion in the autumnof 1989 when the Commission prepared a new package of measures for theDecember 1989 meeting of the Council of Ministers of Transport. The ministers,while not accepting all the Commission’s proposals, committed themselves tothe principles that
Table 4.2 December 1987 decisions of the European Community Council of Ministers
Area Key elements—intra-Community air services
Air fares Governments obliged to agree fares if they reflect costs.Creation of zones for discount and deep discount fares within whichairlines free to set fares meeting specific conditions.
Capacity Equal sharing abandoned. Up to 55% share by one country’s airline(s)allowed in 1988 and 1989 and up to 60% in 1990.
Market access Traffic rights created between regional airports and main airports evenif not existing in current bilaterals (some exceptions in Greece, Spain,Italy and Denmark).Countries can designate a second carrier on intra-Community routesonce traffic levels pass certain levels.Fifth freedom rights granted for airlines on routes between two otherCommunity states (for 30% of seats on the route).
would be incorporated in the second package and to the longer-term objectives.It was not till their meeting in Luxembourg in June 1990 that the ministers
agreed the details of a new second package. First, the existing zonal fare system
82 FLYING OFF COURSE

was replaced by a ‘more liberal and effective’ zonal system. Secondly, anymember state whose airline(s) had already reached a 60 per cent share of thetotal capacity on a country-to-country basis would be allowed to add a further 7.5percentage points in each of the subsequent two years, though with somesafeguards on routes with excessive charter capacity. Lastly, increased marketaccess would be achieved by allowing multiple designation on all Communityair routes with more than 140,000 passengers per annum (reduced to 100,000 in1992), by opening all intra-Community points (with a very few exceptions) tothird and fourth freedom carriers and by increasing fifth freedom rights to 50 percent of the seats on a through service. Previous exemptions granted to specificairports on grounds of congestion were also withdrawn.
More significant were the longer-term objectives approved by the ministers inJune 1990. They gave a firm commitment that all bilateral limits on capacityshares would be abolished by 1 January 1993. They agreed that doubledisapproval of all intra-Community air fares remained another objective to beachieved by that date. But earlier still, by July 1992, each member state would berequired to formulate a licensing system which allowed the establishment of newairlines meeting such licensing requirements and which also opened access tothat country’s air routes by airlines of other Community members. The Councilof Ministers was to agree common specifications for such licensing systems byJune 1991.
All these developments and proposals, if implemented, would have created avery liberal regulatory regime for air transport services within the Community by1993. Airlines would be free to operate at will on any routes from their own stateto anywhere else in the Community with extensive fifth freedom rights butwithout any capacity controls and few tariff controls since double disapprovalwould be needed to block any fare proposals.
4.3.4THE EXTERNAL DIMENSION
The deregulation of air transport within the European Community will have onlylimited impact on airline competition if the external dimension is ignored, sincethe latter is crucial in ensuring the free provision of air services. Two externalaspects are of critical importance. First, do the competition rules apply to airservices to or from the Community or only to those between Community states?In other words, do the Community rules have any extra-territorialvalidity? Secondly, will the creation of a single European market by January1993 invalidate the terms of existing bilateral air services agreements betweenindividual Community states and third countries?
It is clear that the Community’s competition rules and other regulations doapply to non-Community airlines operating to or through the Community.Revenue pools, capacity-sharing agreements or fares coordination on air routesto Community member states are therefore illegal. Moreover, the Commission
1992 AND ALL THAT—LIBERALIZATION IN EUROPE 83

has not had the powers to give exemptions to such agreements with non-Community airlines as it has to give block exemptions to agreements on purelyintra-Community air services. Peter Sutherland, then Commissioner forCompetition, stated this clearly in the autumn of 1988 in a speech in Sydney:‘the Treaty [of Rome] applies stricter rules to such third country cartels oragreements. The block exemption does not apply and the Commission has nopower to grant an individual exemption…’
Two European Court of Justice decisions have reinforced the extra-territorialnature of Community rules. In 1988 in the ‘Pulp Paper Case’, the Court upheld adecision of the Commission to fine 36 US, Canadian and Scandinavian pulppaper companies for price-fixing even though they were not Communitycompanies and their agreement was made outside the Community. This viewwas re-endorsed by the Court’s ‘Ahmed Saeed’ judgment in April 1989. TwoFrankfurt travel agencies were taken to court in Germany for selling cheapFrankfurt-Tokyo tickets, which had been bought very cheaply by the agents inPortugal as Lisbon-Frankfurt-Tokyo tickets. The agencies resold these ticketsafter throwing away the Lisbon-Frankfurt coupon. This was contrary to IATAand German regulations. The German court sought guidance from the EuropeanCourt, which decided that the Community’s competition rules apply to all airfares charged by airlines serving the Community. By implication, any attempt tomaintain or fix fares at artificially high levels by airlines’ agreements is illegal.Thus IATA or any other tariff agreements would appear to be illegal withinCommunity states, whether they involve Community or non-Communityairlines, if they restrict the freedom of others to charge less.
The implications of the ‘Ahmed Saeed’ judgment are clearly far-reaching,particularly for non-Community airlines whose governments may not haveespoused a liberal airline policy. After the judgment, the Commission putforward a proposal to the December 1989 Council of Ministers of Transportwhich would give the Commission new powers to grant exemptions toagreements between Community airlines and third-country airlines. The Councildecided that it wanted to see further details of the kinds of agreements that wouldbe exempted before considering this proposal further. A decision on the proposalwas postponed.
The aim of the creation of the single market is that producers (in this caseairlines) should be free to supply their services freely and without discriminationthroughout the Community. This clearly cannot be done if airlines are restrictedby existing bilaterals as to the Community airports from which they can operateinternational services to points outside the Community. Thus British Airwaysmay wish to fly from Athens to Bangkok but under the Greece-Thailand airservices agreement only a Greek- or Thai-owned airline could be designated toenjoy the traffic rights on this route. To overcome this problem the Commissionis pursuing two parallel lines of action. First, it is making it possible, aspreviously mentioned, for Community airlines to establish themselves in andoperate from other Community states. Secondly, its long-term objective has been
84 FLYING OFF COURSE

that the Community members should negotiate air services agreements as agroup of 12 states and not, as hitherto, individually. With this in mind a newproposal [COM(90)17] for a Council of Ministers decision on relations with thirdcountries was published in January 1990. This claimed that Article 113 of theTreaty of Rome already gives the Commission exclusive competence tonegotiate commercial agreements, which is what air services agreements are.Thus no new powers are required. It also argues that the Rome Treaty overridesrequirements in existing air services agreements requiring control of designatedairlines by nationals of that state. In other words, the designated airline of Greecefor Athens-Bangkok could be any Community airline, not merely a Greek-ownedone. The Commission went on to argue that the creation of the internal marketmeant that the Community should be considered as one entity and therefore as acabotage area. Moreover, the Commission believed it could create an intra-Community cabotage area which would not be in conflict with Article 7 of theChicago Convention, of which all Community states are signatories. The January1990 proposal concluded with a proposed Regulation by which the Commissionwould progressively take over bilateral negotiations between the Community as awhole and third countries. In June 1990 action on this was deferred at theCouncil of Ministers meeting, but the proposal was sure to re-emerge.
Community-wide negotiation of air services agreements is a very dramaticstep towards the creation of a single aviation market. There will be opposition tothe proposal from individual member states and airlines and this may delay itsadoption. But the assumption of Commission power would be gradual. At firststates would continue to negotiate bilaterally, provided agreements signed did notconflict with the Community’s aviation policy. Already in March 1990 theTransport Commissioner instructed Community governments not to negotiateaway fifth freedom rights without first referring them to the Commission. Sooneror later, however, negotiation of air services agreements by the Commission isinevitable because it will strengthen the Community’s bargaining power. This isone aim of the proposal. Community airlines are eager to gain access to UnitedStates domestic routes, that is to US cabotage rights, in exchange for theextensive fifth freedom rights currently enjoyed by US airlines on internationalroutes within the Community. The latter will become internal domestic cabotageroutes after 1992 and the United States might be pressured to give up its rights onsuch routes unless it offers reciprocal rights within the United States to Europeancarriers.
The Commission’s proposals will have a major impact on other states as well.In the first place, their relative bargaining strength will be reduced unless theyare major traffic-generating countries such as Japan. Take as an example thequestion of reciprocity of route rights. In negotiating with say Singapore, theCommunity negotiators may offer five points from Europe to Singapore to theSingaporean airline in exchange for European carriers being allowed to fly fromfive points in Europe to Singapore. This would represent a ‘fair and equal’exchange. But the European negotiators might adopt the US approach by
1992 AND ALL THAT—LIBERALIZATION IN EUROPE 85

offering five European points to the Singaporean airline but demanding thatEuropean airlines should be able to fly from any point in the Community toSingapore. Secondly, non-Community states might lose their existing fifthfreedom rights on routes between Community countries. It has been estimatedthat Asian airlines enjoy fifth freedom rights on more than 30 intra-Communitysectors and at the start of 1990 were operating more than 200 services a week onsuch sectors (Nuutinen, 1990). These too will become domestic cabotage routes.While the Commission disclaims any intention to take such traffic rights away,they must come under pressure in the longer term. Will other countries be forcedto give away their own cabotage rights as a quid pro quo? Will Thailand have tooffer rights on Bangkok-Phuket in order to continue picking up passengersbetween Copenhagen and Munich? Finally, renegotiation of bilaterals on aCommunity-wide basis must lead to multiple designation of Community airlinesfrom European points. So that on routes where previously third-country airlineswere competing with a single and possibly weaker European carrier (such asOlympic out of Athens), they may find themselves competing with two or morestronger European carriers. This question of how the Commission will decidewhich Community airlines to designate for any international route is another areaof potential controversy which has yet to be resolved.
4.3.5ECAC AND EFTA JOIN IN
While the European Community was liberalizing its air services in stages itbecame apparent that other countries in western Europe did not want to bebypassed by the tide of deregulation. Some of them were in any case signing thenew open bilaterals pioneered in Europe by the UK-Netherlands agreement of1984. The Swiss, for instance, had signed a fairly liberal bilateral with the Britishas early as 1985. The European Civil Aviation Conference (ECAC), anintergovernmental agency which groups 23 west European states including the12 Community members, began moving cautiously towards liberalization of theair services between its respective countries.
In June 1987 an ECAC agreement allowed airlines of member states to modifytheir capacity share on routes within the ECAC area from the previous 50:50position to a 55:45 split. This could be done without government approval and foran initial two-year period. A later ECAC decision permitted airlines unilaterallyto file fares which would be automatically approved if within agreed fare zones.Early in 1989 ECAC produced its own rules of conduct for computer reservationsystems.
ECAC followed in the footsteps of the Community, but rather more slowly sinceagreement between its 23 members was at times difficult to obtain. A group ofthese states were also members of the European Free Trade Area (EFTA) andwere particularly keen to keep pace with aviation developments within theCommunity. Two of them, Switzerland and Austria, felt this strongly because of
86 FLYING OFF COURSE

their central geographical position, while for Norway and Sweden closer linkswith the Community were crucial since their jointly owned airline SAS wasconsidered a Community airline as it was also partly owned by Denmark, aCommunity member. The last two EFTA members, Iceland and Finland, did notwant to be left out. Late in 1989 the EFTA group approached the Communitywith a view to concluding an agreement on scheduled air services between thesecountries and the Community. They proposed that the December 1987 packageshould provide the basis for negotiation. In other words, they wanted the termsof that package extended to include their six countries as well. As a result of thisinitiative the Commission proposed in January 1990 that it should be authorizedto open negotiations with the EFTA states. This was agreed to by the Council ofMinisters in May 1990. These were to be the first air transport negotiationsbetween the Community and third countries.
It is evident that multilateral liberalization of air services is affecting a widerEurope than just the 12 member states of the Community. The 11 non-Community members of ECAC, and more especially the six of these that areEFTA states, are keen not to be left behind. They are adopting many of theCommunity’s air transport proposals, though often after a time lag. In 1990 someof the states of eastern Europe also began to talk of moving in the samedirection. For non-European airlines it is crucial to be aware of this changingregulatory environment in Europe.
4.3.6OTHER COMMUNITY MEASURES
While the various liberalization measures outlined above have been increasingthe scope for inter-airline competition within the Community, the Commissionhas adopted a very detailed interventionist approach in drafting regulations toprotect consumer interests. Such regulations and directives, which becomeenforceable in law, undoubtedly have a direct impact on airlines’ marketing anddistribution strategies. This is equally true for Community and non-Communityairlines.
In July 1989 the Council of Ministers approved a code of conduct forcomputerized reservation systems (CEC, 1989). The Regulation statesspecifically that the code applies to any CRS system offered for use within theterritory of the Community irrespective of the status or nationality of the vendoror the geographical location of the air services concerned. The extra-territorialityof the code is therefore clear. The code ensures that the system must be open to allairlines without discrimination and on an equal basis. Participating airlines mustbe free to join other systems as well. Flight options must be ranked in thefollowing order: first, all non-stop direct flights between the two city-pairsranked by departure time; secondly, direct flights with stops but not involvingchange of aircraft; lastly, connecting flights involving a change of aircraft. Code-
1992 AND ALL THAT—LIBERALIZATION IN EUROPE 87

sharing flights must be treated as connecting flights. Screen displays should notgive excessive exposure to particular options nor discriminate against others.
In December 1989 a Directive was agreed by the Council of Ministersoutlining rules for package holidays. The aim was to enshrine in law the liabilityof travel companies, including airlines or their subsidiaries, for the holidayswhich they sell to the public. The directive covered many aspects of the holidaycontract. Most importantly it stipulated that a holiday brochure must be regardedas part of the contract between buyer and seller and its contents must therefore befully met by the seller. If a hotel is described as quiet it must be quiet. If,furthermore, customers suffered loss or damage through the failure of all or partof the holiday arrangements they could claim compensation without having toprove negligence on the part of the holiday company.
A proposed Regulation on compensation for denied boarding was approved bythe Council of Ministers in December 1990. It laid down common rules both forthe criteria to be used in deciding which passengers should be offloaded on anoverbooked flight and for the compensation to be paid to those who were deniedboarding. Compensation should be 100 per cent of the fare where no suitablealternative flight is available, 50 per cent if alternative seats are offered on flightsarriving more than 2 hours after the original scheduled time, and 25 per cent if analternative arriving within 2 hours of the original flight is found.
In addition to the above, the European Commission had by 1990 given noticethat it was also looking to produce Directives on a code of conduct for travelagents, on rules for runway slot allocations and on non-national ownership ofCommunity airlines. It produced a first discussion paper on slot allocation inMay 1990. All this was in addition to action already being undertaken onaviation personnel licensing, on pilot flight-time limitations and aircraftairworthiness requirements.
In a very real sense European deregulation is a paradox. On the one handregulations have been and continue to be removed to allow more direct andintense airline competition. On the other, a host of rigid rules and codes ofconduct are being introduced, with the twin aims of harmonizing the terms ofcompetition and of consumer protection, but which increasingly constrain airlinemanagers’ freedom of action.
4.4The impact of deregulation on European air transport
4.4.1MERGERS AND TRANSNATIONAL ALLIANCES
The process of liberalization which began with the transatlantic services to theUnited States after 1978 and then spread into Europe through both therenegotiation of bilateral air services agreements and action within the European
88 FLYING OFF COURSE

Community has led to significant changes within the European airline industry.Such changes have been both structural and operational as airlines adjusted to thechanging regulatory environment. Moreover, the pace of change accelerated asthe single market of 1 January 1993 approached.
The European scheduled airlines saw their highly regulated and controlledmarkets being opened up to increased competition both from other scheduledairlines and from charter operators. At the same time they were very consciousof the growing concentration within the US airline industry which had followedthe initial and short-lived proliferation of airlines after deregulation in 1978. By1989 the six largest US carriers generated 84 per cent of US domestic passenger-kilometres. The US experience showed that large size was crucial for success, notbecause of cost economies of scale but because of the marketing benefits ofscope. To be successful, an airline had to be active in virtually everymarketplace. As early as 1985 an IATA working party had clearly pinpointedwhat these benefits of scope were (IATA, 1985).
• attractions of large and widespread network• ability to dominate operations at a hub(s)• control of distribution especially through CRS (computer reservation system)• ability to exercise price leadership• value of network size in ‘loyalty’ marketing schemes, e.g. ‘Frequent Flyer’• range of markets allows cross-subsidizing of competitive pricing on particular
routes• marketing power of large-scale advertising.
The European airlines were not slow to appreciate the implications. They allneeded to widen their market base to be competitive and to survive in aderegulated environment.
Interestingly, it was some of the smaller, more marginal carriers that learnt thelesson first. The Scandinavian airline SAS (Scandinavian Airline System) was acase in point. It was a high-cost operator but very profitable as it concentrated onthe high-fare business market. It was also one of the smaller scheduled nationalairlines in Europe with a relatively small population base in its three homecountries. It survived because it operated mostly in highly protected markets withlimited competition. Faced with liberalization and the opening up of Europe itset out frantically looking for partners to link up with, through either sharepurchases or marketing alliances. No airline in the world seemed to have escapedSAS interest but several of its plans were thwarted, as was its attempt to buy asubstantial share of British Caledonian in 1987. Many of the proposed linkages,especially with South American carriers, appeared to have little commerciallogic. But by early 1990 SAS was the centre of a web of alliances (Figure 4.1).
Other European airlines, particularly the larger ones, were more circumspectand less frenetic than SAS in their search for a wider marketing base. Theyfollowed three lines of approach. First, they bought out or bought into the
1992 AND ALL THAT—LIBERALIZATION IN EUROPE 89

smaller scheduled and feeder airlines in their own countries in order both to gainwider control of their domestic marketplace and to preclude future competitorsemerging. In a few cases, such as KLM, they also acquired shares in theircountry’s charter airlines. Secondly, some airlines, such as SAS, followed astrategy of buying shareholdings in other European scheduled airlines and, in afew cases, in airlines outside Europe. US airlines were the favoured targetoutside Europe because of the marketing spread they provided; SAS and KLMbought significant shares in Texas Air and Northwest respectively. The thirdstrategy was to set up marketing alliances with other large carriers, especiallythose operating in different markets, so as to achieve the benefits of scopewithout buying shares. In some cases marketing alliances were consolidated byshare swops, as in the case of the Swissair-Delta-SIA link-up.
British Airways pursued all three strategies. In 1987 it bought 40 per cent ofBrymon Airways, a small turbo-prop regional operator in the south-west ofBritain. Brymon subsequently merged with Birmingham Executive Airways in1988. Meanwhile at the end of 1987 British Airways had taken over Britain’s‘second force’ airline, British Caledonian. This was an airline with an extensivedomestic and international network which included parts of Africa and theMiddle East not served by British Airways. It was also the largest operator out ofLondon’s second airport at Gatwick, where it had access to around a quarter ofthe runway slots. Having consolidated its domestic position, British Airways setabout improving its international scope. In 1987 it set up a worldwide marketingalliance with United in the USA and in 1989 tried unsuccessfully to buy intoUnited. Early in 1990 the airline bought a 20 per cent shareholding in SabenaWorld Airlines, a new company jointly owned with Sabena (60 per cent) andKLM (20 per cent). In addition to operating the existing Sabena network, SWAplanned to develop a wide European network, based on a Brussels hub linking 75European regional centres.
Air France’s strategy has been to concentrate on ensuring total dominance ofits home market. It started this by building up its shareholding in Air Inter, thedominant French domestic carrier, and by acquiring 40 per cent of TAT, thelargest of the French regional carriers. The final success of its strategy was theacquisition early in 1990 of 54.6 per cent of UTA, France’s only other largeinternational scheduled airline. Since UTA also held over a third of Air Inter’sshares, this deal gave Air France total control of Air Inter as well (Figure 4.2).Air France’s strategy was helped in no small way by a French government policystatement of November 1988 which reconfirmed that the government woulddesignate only one airline per route. This precluded UTA from gaining access toAir France’s more lucrative international routes except after a lengthy battle inthe European Court. UTA gave up the struggle!
Most of the other west European airlines also became involved in sharepurchases, share swops and marketing alliances. The longer-term effect of all thesemoves would be to reduce the potential for competition between the majorEuropean scheduled carriers at a time when liberalization was creating a more
90 FLYING OFF COURSE

competitive environment. The other source of potential competition was theEuropean charter industry, where structural changes were also taking place.
Figure 4.1 SAS marketing spread, September 1990
Source: Compiled by author.
1992 AND ALL THAT—LIBERALIZATION IN EUROPE 91

4.4.2CHARTER AIRLINES MOVE INTO SCHEDULED
MARKETS
Competition between charter and scheduled services had previously beenindirect and confined to the inclusive tour markets and in recent years to thebottom sector of the leisure market catered for by ‘seat only’ charter tickets.Direct competition was limited by the fact that on many holiday routes onlycharter flights were available while many of the major European routes weremore or less exclusively served by scheduled carriers, as in the case of London-Paris. But as the bilaterals were liberalized, especially those of the UnitedKingdom, a number of charter airlines began to operate scheduled services.
Figure 4.2 Air France shareholdings, September 1990
Source: Compiled by author.
92 FLYING OFF COURSE

At first, such scheduled services were to Mediterranean holiday destinations.Most of the large British charter airlines started operating one or two scheduledroutes to Spain or Portugal in 1986. But in October 1986, the Dutch chartercarrier Transavia launched an Amsterdam-London (Gatwick) service, while amonth later Air Europe applied for 11 scheduled licences to Europe, includingseveral to business destinations. This process was accelerated in 1988 whenBritish Airways was forced by the European Commission to give up some ofBritish Caledonian’s scheduled routes when it took over that airline. Some ofthese routes were snapped up by charter airlines, notably Air Europe. By early1990 Air Europe had built up a network of over 15 scheduled routes, mainly fromLondon, serving many of the major European cities. Other charter airlines hadalso developed their scheduled networks but to a more limited extent. Meanwhilein Germany in 1988 charter airlines, such as Aero Lloyd, had been allowed tolaunch scheduled domestic services and later some international flights as well.
The reasons for these moves into scheduled operations were fairly mixed.They enabled charter airlines to increase their yields by tapping into the higher-fare business and independent leisure market while continuing to cater for thecharter market through selling blocks of seats on their scheduled flights to touroperators at charter rates. Scheduled services improved aircraft and crewutilization during the winter months when charter demand slumped. Year-roundoperations also ensured higher priority in the allocation of scarce runway slots atcongested airports than did seasonal charter flights. The ultimate rationale was toexpand the charter airlines’ total market base and hence their profitability. Theyalso felt that their lower operating costs (see Chapter 7) would make them verycompetitive with the previously entrenched scheduled carriers. The real question,however, was whether they could maintain this operating cost advantage as thesize of their scheduled networks expanded. Whether, in other words, they couldintroduce charter economics into scheduled services?
American experience was not encouraging. After deregulation in 1978 all themajor US supplemental (charter) carriers expanded into scheduled services. Oneby one they collapsed. One of the better known was World Airways, whichdeveloped a fairly extensive scheduled operation across both the Atlantic and thePacific. But its losses mounted and in September 1986 it was forced to pull outof all scheduled services. It managed to survive by becoming a pure charterairline. None of the other supplementals that entered scheduled markets in theearly 1980s still survives today.
There were several reasons for the failure of the US supplementals to survivein scheduled markets. Their low fares based on lower costs could be selectivelymatched where necessary by the scheduled airlines once fares were deregulated.The supplementals lacked recognition among the travelling public and did nothave the critical mass, in terms of size, to compete effectively in the markets theyentered. Many of their aircraft were too large for the scheduled markets in whichthey operated new services. As a result frequencies were too low. Furthermore,US anti-trust legislation effectively prevents vertical integration between tour
1992 AND ALL THAT—LIBERALIZATION IN EUROPE 93

operators and airlines. The European charter airlines are in a stronger positionwhen entering scheduled markets. They are substantially larger and better-knownairlines, at least in their home markets, than their US counterparts were. Mostalso have close links with large tour operators and travel agencies that canprovide both a distribution network and a source of passengers. However, byearly 1990 there were clear indications that the charter airlines were having troublein coping with the demands of scheduled services. Air Europe, which haddeveloped the most extensive scheduled operations, was in some difficulty. Itscosts were rising as it tried to meet the needs of a scheduled operation, while it washaving problems marketing its services in the non-UK points it served because itwas unknown. Its scheduled load factors, which initially had been relatively highat around 75 per cent, began to decline as the scheduled network was expanded.Growing problems with its scheduled operations together with a downturn in thecharter market induced Air Europe’s parent company to consider selling theairline in April 1990. Other airlines heavily involved in both charter andscheduled operations also looked vulnerable at that time, notably the Britishairline Dan Air. Meanwhile, Britannia, the largest charter airline, decided inAugust 1990 to discontinue its limited scheduled services.
4.4.3GROWING CONCENTRATION AMONG TOUR
OPERATORS
As 1993 and the single European market approached, the large tour-operatingcompanies began to follow the airlines’ lead. They looked for mergers andalliances which would generate substantial scale benefits and consolidate theirmarket base while giving them greater marketing scope. This trend was mostmarked in the United Kingdom. It began in the summer of 1988 when ThomsonHolidays, the largest UK tour operator, took over Horizon Holidays, which wasthe third largest, together with its charter airline Orion. Orion was absorbed byThomson’s own charter airline Britannia. In an industry where there aresubstantial economies of scale, firms struggled to increase their size. But thecompetitive pressures meant that many failed, especially when growth in demandweakened from 1988 onwards, and they were absorbed by the bigger companies,which themselves needed to increase in size. By the spring of 1990 three giantshad emerged in the UK: Thomson Holidays, the International Leisure Group andOwners Abroad. Together they controlled about 50 per cent of the UnitedKingdom market for inclusive package holidays.
The same trend was apparent in other west European countries. In France, twovery large groups emerged as a result of consolidations. In 1989, the two marketleaders, Club Mediterranée and Nouvelles Frontières, joined forces in an alliancewhich involved the former taking a substantial shareholding in the latter. Theymerged their sales and distribution systems. Then in April 1990 ClubMediterranée bought 50 per cent of Minerve, France’s leading charter company.
94 FLYING OFF COURSE

Also in 1989, Sotair (an Air France subsidiary), Frantour (a French railways’subsidiary) and Fram joined forces to create a second major alliance of touroperators. Meanwhile, Tjaereborg, Scandinavia’s largest tour operator, had beentaken over by the Danish travel company Spies.
These consolidations within the European travel industry had importantimplications for the airlines. They meant that the leisure market, and in particularthe inclusive tour market which generates well over half intra-European airtravel, would be increasingly controlled by a small number of mega touroperators. These would have considerable market power and several of themowned or were establishing direct links with their own charter airlines.
4.4.4OPERATIONAL CHANGES
The first noticeable operational change was the entry of several new smallairlines onto scheduled routes in addition to the charter airlines previouslymentioned. A few of the new entrants were start-up airlines, created as a result ofliberalization, such as Ryanair in Britain or Hamburg Airlines in Germany. Butmost of the new entrants were previously existing domestic or regional carrierswhich substantially expanded their operations to take advantage of the increasedopportunities available. Crossair, in Switzerland, and British Midland were twosuch companies. Though larger than the start-up entrants, these too wererelatively small airlines.
Equally significant was the emergence of new fifth freedom operationsbetween Community states. These were a direct result of the December 1987package (see section 4.3.3 above). Two airlines in par-ticular set out to takeadvantage of the fifth freedom rights which were opened up. The Irish airlineAer Lingus developed a number of routes from Dublin via Manchester and otherpoints in the UK to European destinations such as Amsterdam, Paris orCopenhagen, picking up fifth freedom traffic between the UK and Europe. Itsaim was to develop a secondary hub in Manchester. Air Portugal also launched anumber of European services from Lisbon to European destinations viaintermediate points from which it automatically had fifth freedom rights. Oneexample was its Lisbon-Amsterdam-Hamburg service. Other EuropeanCommunity airlines also launched new routes where they could exploit the newlygranted fifth freedom provisions.
Another consequence of the December 1987 package was the abandonment ofmost of the revenue-pooling agreements which had previously been commonbetween European carriers. The block exemptions granted in July 1988 allowedpooling agreements only if revenue transfers were limited to a maximum of 1 percent of the total pool revenue. Given this constraint and the generally hostileclimate towards pooling within the European Commission, most of theCommunity airlines abandoned their pool agreements. A few, such as OlympicAirways, continued to maintain their pools but essentially as a way of
1992 AND ALL THAT—LIBERALIZATION IN EUROPE 95

coordinating schedules with their pool partners rather than for the purpose ofsharing revenues. One important result of the break-up of many pool agreementswas that schedule coordination was abandoned. Airline flights, which onpreviously pooled routes had been well spaced throughout the day, began tobunch up at the more popular times as former pool partners competed head-on.
4.4.5DECLINING YIELDS ON SOME ROUTES
Lastly, as a result of decontrol of fares and the entry of new carriers seekingmarket share, there has been a strong downward pressure on yields. This has notbeen universal because most scheduled intra-European routes are still dominatedby the two national carriers from either end of the route. Though abandoningtheir revenue-pooling agreements, such duopolists have avoided price wars andhave been willing to maintain the existing fares. Fares and yields declinedappreciably only where one or more new entrants set out to capture market shareby substantial fare reductions which the established carriers had to match insome way. This happened with some of the new entrants on the London-Amsterdam route and more dramatically with the entry of Ryanair on theLondon-Dublin market.
The general pattern was for club-(business-) class and full economy fares toremain unchanged while the new entrants introduced a variety of much lowerdiscount fares, some of which were matched by the incumbent national carriers.On London-Amsterdam the club and economy fares in 1989 were onlymarginally higher than they had been in 1983 before deregulation. This meansthat in real or constant value terms they actually declined. In 1989, of the threemajor carriers on the route, British Airways and KLM were both chargingidentical club and economy fares, while British Midland also charged the sameeconomy fare but offered a club-class product for it. Thus relatively littleapparent price competition emerged at the top end of the fare range. But at thesame time there was a dramatic proliferation of low promotional fares. In 1983,prior to the revision of the UK-Netherlands bilateral, the cheapest London-Amsterdam fare was an advance purchase fare of £82 return, and only threeother reduced fares were available. Within two years of the new bilateral beingsigned, 15 different discount fares were available and the lowest round-trip farecost only £55. By 1989, the number of separate fares had increased to around 30and the cheapest return fare was £62. The multiplicity of different fares wasconfusing to the public, especially as they all had different and often complexrestrictions placed on them. Nevertheless, their effect on yields was significant.New carriers began to impact on the London-Amsterdam route at the end of 1986and average yields fell by about 15 per cent over the next two years. Between1986 and 1988 KLM’s yields on London-Amsterdam went down by 16 per cent.KLM’s response was to cut capacity by 20 per cent and change from Airbus tosmaller Boeing 737s so as to increase frequency. It also pulled out of Gatwick. As
96 FLYING OFF COURSE

a result of this strategy of going for the ‘schedule-driven’ market, KLM yieldswent up slightly but its market share went down. At more or less the same time,KLM bought a 14.9 per cent share in Air UK as another way of participating inthe UK-Netherlands and beyond markets, and 40 per cent in Transavia, a Dutchcharter airline which had launched a scheduled Amsterdam-London service.
In terms of both fare reductions and traffic growth, bilateral liberalization inEurope had its most dramatic impact on the UK-Ireland market. Here a newairline, Ryanair, started a Dublin service from Luton, just north of London, inMay 1986 with very low unrestricted fares. In subsequent years Ryanair andanother new entrant, Virgin Atlantic, were offering unrestricted fares which wereless than half the normal economy fares. This forced the established carriers, AerLingus and British Airways to introduce a host of lower but restricted fares. Aswith London-Amsterdam, the number and variety of discount fares mushroomed.Average yields are estimated to have dropped by nearly one-third (Barrett,1989). Traffic boomed. In the five years 1980–5, London-Dublin traffic grew byonly 2.9 per cent. But the 1985 traffic level was doubled in the first three yearsof liberalization, that is by 1988. This phenomenal growth was due to the specialcharacteristics of this market, notably the large Irish population in the UnitedKingdom and a very substantial volume of seaborne ferry traffic which was ripefor diversion to air as fare levels fell. It is unlikely that deregulation elsewhere inEurope will have such a profound effect of doubling traffic in two years.
4.4.6IMPACT LESS DRAMATIC
With the exception of the UK-Irish market, the overall impact of Europeanliberalization during its first five years or so to 1990 appeared to be much lessdramatic in terms of traffic growth, fare reductions and the emergence of newentrants and new airlines than had been the case following domestic deregulationin the United States. There would appear to be two reasons for this. First, unlikethe United States where deregulation was virtually total and implemented in avery short period of time, the process within Europe has been gradual and slow.As the preceding analysis has shown, it was a step-by-step liberalization ratherthan total deregulation. Even by 1990 only one or two bilateral markets withinEurope were largely deregulated as a result of new air services agreements.Elsewhere a greater or lesser degree of regulation still persisted. Within theEuropean Community, a deregulated environment more closely akin to that ofthe United States was unlikely to emerge till after 1992. Given the slow pace ofliberalization, airline responses were also relatively slow and careful. The largerairlines were more concerned with preparing and positioning themselves for themore competitive environment that was to come than in embarking on short-termprice or frequency wars.
Secondly, no large and aggressive new entrant or start-up airlines emerged inEurope to challenge the dominance of the existing national carriers. There was
1992 AND ALL THAT—LIBERALIZATION IN EUROPE 97

nothing anywhere nearly comparable to US developments such as the expansionof Braniff up to 1982 or to People Express. This was no doubt related to thegradual pace of liberalization and the continued existence of barriers to newentrants in many European countries. In western Europe no new start-up airlineswere created to compete head-on with the established national carriers. In somecountries, existing small airlines, such as Germany’s Nürnberger Flugdienst or AirLittoral in France, or one or two entirely new carriers such as Sudavia increasedtheir international services. Usually these were on thin regional routes and rarelyinvolved direct competition. In most of Europe there were no scheduled airlinesthat could effectively compete with their national carriers on the dense routeswhere competition was justified. France had two such airlines, Air Inter andUTA, but the French government prevented them from entering routes alreadyserved by Air France. Only in the United Kingdom were there independentairlines capable of taking advantage of the new multiple designations andincreased route access that became available. The largest of these, BritishCaledonian, was taken over by British Airways in 1987. The others weregenerally smaller airlines, such as British Midland, Dan Air or Air UK, flyingrelatively small aircraft and characterized by high costs. Nor did they have muchmarketing power. As a result they had little scope for price or product innovation.They were also conservative in their approach and expanded only slowly ontonewly liberalized routes. Unlike their US counterparts, they did not merge so asto challenge the majors. Even the entry of low-cost charter airlines at first hadlittle impact. Transavia was one of the first charter airlines to enter a scheduledmarket (Amsterdam-London), but it was happy to accept the prevailing farelevels. Other charter airlines generally flew to Mediterranean holidaydestinations when launching new scheduled services. It was not till Air Europebegan systematically to develop an extensive scheduled network in 1988 that theincumbent European carriers began to face serious competition on trunk routesout of the UK from a low-cost carrier with a determined low-fare strategy. By1990 the Air Europe scheduled services had not been in operation long enough toassess their true impact on fare levels and traffic growth. Nor was it clear whetherthe Air Europe strategy of a massive and rapid expansion into scheduled serviceswould prove successful.
What is clear is that by 1990, and with the exception of Air Europe, no seriouscompetitor had emerged to challenge the dominance of the existing nationalcarriers. Thus, as liberalization moves towards deregulation in the Europe of the1990s, real competition can come only from the existing airlines. But will theseairlines, with their mutual shareholdings, share swops and marketing alliances,be prepared to compete with each other? In the US domestic airline industry,sudden deregulation led over 10 years to the emergence of five or six dominantcarriers. In Europe, it was hoped that a gradualist approach to deregulation wouldprevent the consolidation of market power among a handful of airlines byensuring that a more open and competitive environment prevailed. It is difficult
98 FLYING OFF COURSE

to see where the new competitors to the incumbent European carriers will comefrom.
1992 AND ALL THAT—LIBERALIZATION IN EUROPE 99

5The Structure of Airline Costs
5.1The need for costing
The costs of supplying airline services are an essential input to many decisionstaken by airline managers. The way that an airline’s costs are broken down andcategorized will depend on the purpose for which they are being used. In airlineplanning, cost information is required for three key purposes. First, airlinesrequire an overall breakdown of their total expenditure into different costcategories as a general management and accounting tool. They need a generalbreakdown of costs to show cost trends over time, to measure the cost efficiencyof particular functional areas such as flight operations or passenger services, andultimately to enable them to measure their operating and non-operating profit orloss. Secondly, an assessment of costs is essential in any evaluation of investments,whether in new aircraft or in new routes or services. Lastly, cost identification iscrucial in the development of pricing policies and pricing decisions, for bothpassengers and cargo.
No single cost categorization is capable of satisfying all of these threemanagement requirements simultaneously. A cost breakdown developed forgeneral management purposes may be useless as a guide to pricing strategy. As aresult, most airlines break down their costs in two or more different ways inorder to use them for different aspects of management. While the approach tocost categorization used by each airline is strongly influenced by accountingpractices in its home country, it is also influenced by the cost classificationadopted by the International Civil Aviation Organization (ICAO). Thegovernments of the member states of ICAO are required to provide ICAO eachyear with financial data about their airlines on a standard form. These dataprovide the basis for ICAO’s annual Digest of Statistics, Series F, FinancialData, which contains the balance sheets and profit and loss statements for all theICAO member airlines, though in practice data for several airlines are missing. Theneed to provide ICAO with a particular breakdown of costs and the ability oncethis is done to compare one’s costs on a fairly straightforward basis with those ofother airlines have over time induced many airlines to adopt a cst classification

similar to that of the ICAO. The ICAO cost classification was in any case basedfairly closely on prevailing cost practices in the United States and among severalEuropean airlines. Thus world wide throughout the airline industry there tends tobe a fairly standard approach to the categorization of costs for generalmanagement use.
5.2The traditional approach to airline costs
5.2.1OPERATING AND NON-OPERATING ITEMS
It is normal practice to divide airline accounts into operating and non-operatingcategories. The aim is to identify and separate out as non-operating items allthose costs and revenues not directly associated with the operation of an airline’sown air services. ICAO, the former US Civil Aeronautics Board (CAB) andmost airlines have adopted this practice.
ICAO identifies five non-operating items:
(1) The gains or losses arising from the retirement of property or equipment,both aeronautical and non-aeronautical. Such gains or losses arise whenthere is a difference between the depreciated book value of a particular itemand the value that is realized when that item is retired or sold off.
(2) Interest paid on loans, as well as any interest received from bank or otherdeposits. For some costing purposes, however, such as aircraft evaluation,some airlines would include interest paid on aircraft-related loans as anoperating cost.
(3) All profits or losses arising from an airline’s affiliated companies, some ofwhich may themselves be directly involved in air transport. In some casesthis item may be of some importance in the overall financial performance ofan airline. In 1990 British Airways, for example, had over 15 wholly ownedsubsidiaries and shareholdings in another 10 or so related companies.
(4) An assortment of other items which do not fall into the previous threecategories, such as losses or gains arising from foreign exchangetransactions or from sales of shares or securities. In recent years airlineshave from time to time made large losses or profits as a result of suddenmarked fluctuations in exchange rates. These are clearly a non-operatingitem.
(5) The final item is direct government subsidies or other governmentpayments. In the case of some airlines, subsidies have at times been verysubstantial. Thus, in the early 1980s Air France, like several other airlines,received government subsidies to see it through the loss-making years that
THE STRUCTURE OF AIRLINE COSTS 101

followed the fuel price escalation of 1978–9. Such subsidies would appearas non-operating items.
For some airlines non-operating items may have a major impact on theirfinancial results. Thus, in the financial year 1989/90 Singapore Airlines producedan overall profit before tax of US$718 million. Of this, only US$503 million or70 per cent was from airline operations. The remainder came from non-operatingitems. As much as $37 million was dividends from subsidiary companies, therewas a surplus on the sale of aircraft and other assets of US$98 million while theairline earned a further net surplus of $80 million from bank interest. Non-operating items are not necessarily profits or surpluses. They may well be lossesor costs. In particular, most airlines normally pay out a great deal more ininterest charges on their loans than they receive from their own cash deposits atthe bank. Thus in 1988 TWA had a net interest charge for the year of $344million. In other words, it was paying almost $1 million in net interest each day.In the same year, Continental, the US carrier, turned an operating surplus of $83million into a deficit of about $315 million before tax by the inclusion of threelarge non-operating costs—a $129 million provision for extraordinary items,interest charges of $285 million and a loss of $12 million from affiliatedcompanies, though there was a profit of $27 million from the sale of assets(ICAO, 1988a). Since the nature of each airline’s non-operating costs andrevenues is probably unique, in that many non-operating items are influenced bycircumstances which are very particular to each airline, inter-airline comparisonsof total non-operating costs are of little value.
On the operating side, airline accounts are divided into operating revenue andoperating costs. The latter can be further subdivided into direct operating andindirect operating costs. In theory, the distinction between these two costcategories is fairly clear. Direct operating costs should include all those costswhich are associated with and dependent on the type of aircraft being operatedand which would change if the aircraft type was changed. Broadly speaking,such costs should include all flying expenses (such as flight crew salaries, fueland oil), all maintenance and overhaul costs and all aircraft depreciation costs.Indirect operating costs are all those costs which will remain unaffected by achange of aircraft type because they are not directly dependent on aircraftoperations. They include areas of expenditure which are passenger related ratherthan aircraft related (such as passenger service costs, costs of ticketing and sales,and station and ground costs) as well as general administrative costs. In practice,however, the distinction between direct and indirect operating costs is not alwaysclear cut. Certain cost items, such as maintenance administration or costs ofcabin staff, are categorized as direct costs by some airlines and as indirect costsby others.
The main categories of airline operating costs are shown in Table 5.1. Thecost categories shown are those currently accepted and used, with somemodification, by ICAO, by the UK Civil Aviation Authority and by the US
102 FLYING OFF COURSE

Department of Transportation. Similar cost categories are used by the majority ofairlines round the world.
5.2.2DIRECT OPERATING COSTS
Cost of flight operations
This is undoubtedly the largest single element of operating costs. It includes,in the first place, all costs associated with flight crew. Such costs cover not onlydirect salaries and travelling and stopover expenses but also allowances,pensions, insurance and any other social welfare payments. Flight crew costs canbe directly calculated on a route-by-route basis or, more usually, they areexpressed as an hourly cost per aircraft type. In the latter case the total flightcrew costs for a particular route or service can be calculated by multiplying thehourly flight crew costs of the aircraft being operated on that route by the blocktime for the route.
The second major cost element of flight operations is fuel. Fuel consumptionvaries considerably from route to route in relation to the sector lengths, the aircraftweight, wind conditions, the cruise altitude, and so on. Thus an hourly fuel costtends to be even more of an approximation than an hourly flight crew cost, and itis normal to consider fuel consumption on a route-by-route basis. In addition toaviation fuel, aircraft also use up oil. But the oil consumption is negligible and,rather than try to calculate it directly for each route, the normal practice is tohave an hourly figure for oil consumption for each type of engine. The oilconsumption on a particular route is then calculated from the number of engineson the aircraft flying the route multiplied by the hourly oil consumption for thatengine and by the block time. For turbo-prop aircraft there is additionalexpenditure on water methanol, which is used to boost engine power at take-off.This is a very small cost element which can be directly related to the number oftake-offs per route. Fuel and oil costs include all relevant taxes and duties, suchas taxes on fuel or oil levied by governments, or fuel throughput charges leviedby some airport authorities on the volume of fuel uplifted.
Another significant element of flight operation costs is made up of airport anden route charges. Airlines have to pay airport authorities for the use of therunway and terminal facilities. Airport charges normally have two elements: alanding fee related to the weight of the aircraft and a passenger charge levied onthe number of passengers boarded at that airport (occasionally it is calculated onthe number of disembarked passengers). Many Third World airports do notcharge the airlines for the number of passengers embarked but collect a feedirectly from each passenger on departure. This does not appear as an airlinecost. Additionally, if an aircraft stays at an airport beyond a stated time period, itwill have to pay parking or hangarage fees. These are relatively small comparedwith the basic landing and passenger charges.
THE STRUCTURE OF AIRLINE COSTS 103

Table 5.1 Structure of operating costs
DIRECT OPERATING COSTS (DOC):
1 Flight operations—Flight crew salaries and expenses—Fuel and oil—Airport and en route chargesa
—Aircraft insurance—Rental/lease of flight equipment/crewsb
2 Maintenance and overhaul—Engineering staff costs—Spare parts consumed—Maintenance administration (could beIOC)3 Depreciation and amortization—Flight equipment—Ground equipment and property (couldbe IOC)—Extra depreciation (in excess of historiccosts)—Amortization of development costs andcrew trainingINDIRECT OPERATING COSTS (IOC):4 Station and ground expenses—Ground staff—Buildings, equipment, transport—Handling fees paid to others5 Passenger services—Cabin crew salaries and expenses (couldbe DOC)—Other passenger service costs—Passenger insurance6 Ticketing, sales and promotion7 General and administration8 Other operating costsNotes:a ICAO classifies airport and en route charges as an indirect operating cost under ‘Station
and ground expenses’.b The US practice is to classify rentals under ‘Depreciation’.
Airlines must also pay en route navigation charges to cover the cost of en routenavigation aids that their aircraft use while flying. The actual level of thenavigation charge is related to the weight of the aircraft and the distance flown
104 FLYING OFF COURSE

over a country’s airspace. As a result, both airport charges, where they are notpassenger related, and navigation services charges will vary with the type ofaircraft used and are therefore considered as a direct operating cost. On the otherhand, passenger-related charges do not vary with aircraft type. This may partlyexplain why ICAO insists on treating landing and en route charges as an indirectcost, though few airlines follow this lead. Since landing and en route chargesvary by individual airport and country, they must be separately calculated foreach flight or route.
A relatively small cost in flight operations is that of the insurance of the flightequipment. The insurance premium paid by an airline for each aircraft iscalculated as a percentage of the full purchase price. The annual premium maybe between 1.5 per cent and 3 per cent depending on the airline, the number ofaircraft it has insured, and the geographical areas in which its aircraft operate. Ifthe airline wants full war risk cover, if it wants to be covered against terroristaction or if it is operating in or through an area where there is armed conflict, anadditional premium of up to 2 per cent may need to be paid. The annual premium,which is fixed, can be converted into an hourly insurance cost by dividing it bythe projected aircraft utilization, that is, by the total number of block hours thateach aircraft is expected to fly during the year.
Lastly, there may be some costs related to flight operations which do not fallinto any of the above categories. Such additional costs may include costs offlight crew training or of route development. However, if training costs areamortized over two or three years then they are grouped together withdepreciation. Some airlines may, in addition, have to meet rental or lease chargesfor the hiring or leasing of aircraft or crews from other airlines. These are usuallyconsidered as part of flight operation costs. Several of the small national airlineswere originally launched on the basis of leased aircraft, though more recentlyoperating leases have become widespread even among larger airlines. In suchcases, rental or lease charges are high, pushing up that airline’s total flightoperations costs to abnormally high levels. This is because the rental charges forleased aircraft effectively cover both the depreciation and the interest chargespaid by the owners of the aircraft. Conversely, airlines heavily dependent onleased equipment tend to have very low depreciation charges, since they pay fordepreciation indirectly through the rental charge. It is because rentals include alarge element of depreciation that the American practice is to categorize rentalcharges under the heading of depreciation rather than to treat them as a cost offlight operations.
Maintenance and overhaul costs
Total maintenance costs cover a whole series of separate costs, related todifferent aspects of maintenance and overhaul, which ideally ought to be treatedseparately. In practice there are so many joint costs in the separate maintenanceareas that it is difficult, if not impossible, for many airlines to break down total
THE STRUCTURE OF AIRLINE COSTS 105

maintenance costs into separate cost categories. As a consequence both ICAOand the UK Civil Aviation Authority, which closely follows ICAO practice,group all maintenance and overhaul expenditure into a single undivided cost item.This item covers not only routine maintenance and maintenance checks but alsoperiodic overhauls and repairs. It encompasses labour costs and expenses relatedto all grades of staff involved directly or indirectly in maintenance work. Wherepossible, costs of maintenance staff at outstations should be separated out fromstation costs and included under maintenance. The costs of components andspare parts consumed are also included, as are the costs of workshops,maintenance hangars and offices. Finally, if an airline is subcontracting out anyof the maintenance done on its own aircraft, then the charges it pays for any suchwork should be allocated to the maintenance and overhaul category.
In the United States, the CAB and subsequently the Department ofTransportation have required airlines to split their flight equipment maintenancecosts into three categories: direct maintenance on the airframe; directmaintenance on the engines; and a maintenance burden. The maintenance burdenis essentially the administrative and overhead costs associated with themaintenance function which cannot be attributed directly to a particular airframeor engine but are allocated on a fairly arbitrary basis. US airlines are obliged tofurnish the federal government with these three categories of maintenance costsseparately for each aircraft type that they operate. These data are publishedquarterly and provide an excellent basis for the comparison of maintenance costsbetween airlines and also between different aircraft types and engines (Avmark,1990).
Outside the United States, airlines also try to apportion their maintenancecosts between different aircraft types but there is no standard way of doing this,so inter-airline comparisons would not be valid even if such data were publiclyavailable. Individual airlines, having estimated the total maintenance costs forone particular aircraft type, may then convert these costs into an hourlymaintenance cost by dividing them by the total number of block hours flown byall the aircraft of that particular type operated by the airline.
Depreciation and amortization
Depreciation of flight equipment is the third component of direct operatingcost. Airlines tend to use straight-line depreciation over a given number of yearswith a residual value of 0–15 per cent. Up to the early 1970s, depreciation periodswere generally 12 years or less. The introduction of wide-bodied jets led to alengthening of the depreciation period, first, because the capital cost of suchaircraft was very much higher than that of the previous generation of aircraft;second, because air transport technology appeared to have reached a plateau. Itbecame much more difficult than it had been previously to predict that furtherdevelopments in technology might adversely affect and shorten the economic lifeof the wide-bodied jets. Their economic life was dependent on the strength and
106 FLYING OFF COURSE

technical life of their various components and was unlikely to be affected by anynew leaps forward in aircraft technology which might make them obsolescent. Inresponse to these two factors, airlines throughout the world have tended tolengthen the depreciation period of their large wide-bodied jets to 14–16 yearswith a residual value of around 10 per cent. For smaller short-haul aircraft,depreciation periods are shorter, generally 8–10 years.
The annual depreciation charge or cost of a particular aircraft in an airline’sfleet depends on the depreciation period adopted and the residual value assumed.An airline buying a Boeing 747–400 early in 1990 might have paid $127 millionfor the aircraft and another $13 million for a spares holding, making a total of$140 million. Assuming it depreciated the aircraft over 15 years to a 10 per centresidual value, then the annual depreciation charge could be calculated asfollows:
Annual depreciation
If an airline chooses a shorter depreciation period, then the annual depreciationcost will rise. Thus Singapore Airlines in the financial year 1989/90 depreciatedits aircraft over 10 years. On this basis and with a 10 per cent residual value, thenthe annual depreciation cost of the Boeing 747–400 aircraft would rise from $8.4million to $12.6 million, thereby increasing operating costs.
The hourly depreciation cost of each aircraft in any one year can beestablished by dividing its annual depreciation cost by the aircraft’s annualutilization, that is, the number of block hours flown in that year. Thus, if theBoeing 747–400 above achieved 3,500 block hours in a year, its hourlydepreciation cost would be $2,400 ($8.4m divided by 3,500). If the annualutilization could be pushed up to 4,500 hours, then the hourly cost would be cutto $1,867 ($8.4m divided by 4,500). It is evident that any changes in thedepreciation period, in the residual value or in the annual utilization will all affectthe hourly depreciation cost.
A major issue for airline accountants in recent years has been whether to usethe historic purchase price of the aircraft as the basis for calculating its annualdepreciation cost or the current cost of replacing that asset (aircraft), which maybe substantially higher, especially for aircraft that are more than five or six yearsold. Current cost depreciation would result in substantially higher annualdepreciation charges and few airlines have adopted this. Some airlines, however,Swissair among them, have adopted a policy of charging extra depreciation ingood years when profits are high. This enables them to put more money aside forfleet replacement.
THE STRUCTURE OF AIRLINE COSTS 107

It is ICAO practice to include depreciation of ground property and equipmentas a further item of direct operating costs. This practice is questionable in thatsuch depreciation charges are not directly related to the operation of aircraft and,except where they relate to ground equipment which is specific and unique to aparticular aircraft type, they will remain unaffected if an airline changes its fleet.
Many airlines amortize the costs of flight crew training as well as anydevelopmental and pre-operating costs related to the development of new routesor the introduction of new aircraft. In essence this means that such costs, insteadof being debited in total to the year in which they occur, are spread out over anumber of years. Such amortization costs are grouped together withdepreciation.
5.2.3INDIRECT OPERATING COSTS
Station and ground expenses
Station and ground costs are all those costs incurred in providing an airline’sservices at an airport other than the cost of landing fees and other airportcharges. Such costs include the salaries and expenses of all airline staff locatedat the airport and engaged in the handling and servicing of aircraft, passengers orfreight. In addition there will be the costs of ground handling equipment, ofground transport, of buildings and offices and associated facilities such as telexmachines, telephones, and so on. There will also be a cost arising from themaintenance and insurance of each station’s buildings and equipment. Rents mayhave to be paid for some of the properties used. By far the largest expenditure onstation and ground staff and facilities inevitably occurs at an airline’s home base.At some of the smaller airports it serves, an airline may decide to contract outsome or all of its check-in and handling needs. Handling fees charged by thirdparties should appear as a station expense.
Some aircraft maintenance may be done at an airline’s outstations and thecosts arising from such maintenance work should ideally be included as a directoperating cost under the ‘maintenance and overhaul’ category. But maintenanceexpenditures are frequently difficult to disentangle from other station costs andare in many cases left as part of station and ground costs.
Costs of passenger services
The largest single element of costs arising from passenger services is the pay,allowances and other expenses directly related to aircraft cabin staff and otherpassenger service personnel. Such expenses would include hotel and other costsassociated with overnight stops as well as the training costs of cabin staff, wherethese are not amortized. As the number and grading of cabin staff may vary byaircraft type, some airlines consider cabin staff costs as an element of flightoperations costs; that is, as a direct operating cost.
108 FLYING OFF COURSE
A second group of passenger service costs are those directly related to thepassengers. They include the costs of in-flight catering, the costs ofaccommodation provided for transit passengers, the costs of meals and otherfacilities provided on the ground for the comfort of passengers, and expensesincurred as a result of delayed or cancelled flights.
Lastly, premiums paid by the airline for passenger liability insurance andpassenger accident insurance should also be included. These are a fixed annualcharge based on an airline’s total passenger-kilometres produced in the previousyear. The premium rate will depend on each airline’s safety record but is likely tobe within the range of 35–55 US cents per 1,000 revenue passenger-kilometres.
Ticketing, sales and promotion costs
Such costs include all expenditure, pay, allowances, etc., related to staffengaged in ticketing, sales and promotion activities as well as all office andaccommodation costs arising through these activities. The costs of retail ticketoffices or shops, whether at home or abroad, would be included. Problems ofcost allocation arise. It is frequently difficult, especially at foreign stations, todecide whether particular expenses should be categorized as station and groundexpenses or as ticketing, sales and promotion. For instance, where should anairline allocate the costs of ticketing staff manning a ticket desk at a foreignairport who may also get involved in assisting with the ground handling ofpassengers? The same difficulty arises with the costs of an airline’s ‘countrymanager’ in a foreign country who may have overall charge for sales as well asthe handling at the airport.
The costs of all advertising and of any other form of promotion, such asfamiliarization visits by journalists or travel agents, also fall under this heading.Lastly, commissions or fees paid to travel agencies for ticket sales wouldnormally be included here.
General and administrative costs
General and administrative costs are generally a relatively small element of anairline’s total operating costs. This is because, where overhead costs can berelated directly to a particular function or activity within an airline (such asmaintenance or sales), then they should be allocated to that activity. Thus, strictlyspeaking, general and administrative costs should include only those cost elementswhich are truly general to the airline or which cannot readily be allocated to aparticular activity. Inter-airline comparison of these general costs is of littlevalue, since airlines follow different accounting practices. While some airlinestry to allocate their central costs to different cost centres as much as possible, otherairlines do not do so either as a matter of policy or because their accountingprocedures are not sophisticated enough to enable them to do so.
THE STRUCTURE OF AIRLINE COSTS 109

Where airlines cannot legitimately include a particular expense under one ofthe cost categories discussed above, they may include it as a separate item under‘Other operating expenses’.
5.3Trends in airline costs
The distribution of total operating costs between the various cost elementsdiscussed above can be seen in Table 5.2. It is apparent that for the world’sscheduled airlines as a whole just over half of total operating costs now arisefrom direct costs, though in the 1980s the figure was generally around 55 per cent.The rest are indirect costs. While this is a useful generalization, it hides the factthat there may be differences between airlines in the cost structure. A number offactors cause variations in airline cost structures, but direct operating costs aregenerally between 45 per cent and 60 per cent of total operating costs. It is onlyin non-scheduled operations that direct costs generally surpass 60 per cent oftotal operating costs and may reach as high as 80 or 85 per cent.
It has previously been pointed out (Figure 1.1) that, as a result of rapidtechnological developments since the Second World War, the unit operatingcosts of air transport declined steadily in real terms in the 1950s and 1960s. Thisdownward trend bottomed out in 1970 and the unit operating costs then remainedfairly steady in real terms despite two hiccups in 1974 and 1979/80. After 1980,the downward trend in real unit costs returned, though the decline was slowerthan it had been previously. In current terms, the unit operating costs of theworld’s scheduled airlines rose by about half in the decade 1978–88 from 30.1US cents per available tonne-kilometre to 46.8 cents.
The two successive oil crises of 1973 and 1979/80 have dramatically alteredthe structure of airline costs. Whereas in 1972 fuel and oil had on averagerepresented about 10–11 per cent of ICAO airlines’ total operating costs, by 1978this figure had gone up to about 18 per cent (Table 5.2). Three years later, in1982, fuel and oil accounted for close to 29 per cent or nearly one-third of airlinecosts. As the real price of fuel declined after 1982 so did its share of total costs,so that by 1988 this was down to 14.5 per cent. It was largely as a result of theescalation of fuel prices that flight operations costs went up from just under 30per cent of total costs in the early 1970s to a peak of 43–44 per cent in 1980/1before declining to just above 30 per cent.
Table 5.2 Distribution of operating costs: scheduled airlines of ICAO, 1978–88
1978%
1983%
1988%
Direct operating costs:1 Flight operations 35.2 39.1 31.1
110 FLYING OFF COURSE

1978%
1983%
1988%
Flight crew salaries/expenses (8.5) (7.1) (6.8)Fuel and oil (18.4) (24.5) (14.5)Airport and en route fees (5.2) (4.8) (5.2)Insurance and aircraft rentals (3.1) (2.7) (4.6)
2 Maintenance and overhaul 12.3 10.0 11.53 Depreciation and amortization 7.9 7.2 7.8
Total DOC 55.4 56.3 50.4Indirect operating costs:4 Station and ground expenses 12.6 11.1 12.65 Passenger services 10.1 9.2 10.56 Ticketing, sales and promotion 15.5 16.4 17.67 General and administrative 6.4 7.0 8.9
Total IOC 44.6 43.7 49.6Total operating costs 100.0 100.0 100.0Source: ICAO (1990).
Figure 5.1 Changes in the real price of jet fuel, 1970–89
Source: Airbus Industrie.
THE STRUCTURE OF AIRLINE COSTS 111

The two other elements of direct operating costs—maintenance costs anddepreciation—were not as adversely affected by the general inflation of costs aswere flight operations. Both these cost elements, but particularly depreciation,were helped by the introduction of the wide-bodied jets during the last twodecades, which were technically more proficient and had lower maintenancerequirements. At the same time, their annual productivity was such that, despitetheir high purchase price, their unit cost of depreciation was actually lower in realterms than that of the aircraft they were replacing. As a result, the share of bothmaintenance and depreciation in total costs has been fairly stable. However, thelarge variations in the price of fuel and, as a consequence, in flight operationcosts has meant that direct operating costs as a whole rose from about 55 percent of total operating costs to a peak of 60 per cent in 1980/1. They thendeclined gradually to stabilize at around 50 per cent.
In terms of indirect operating costs, the most marked increases have occurredin ticketing, sales and promotion costs. Ticketing, sales and promotion are todayby far the most significant indirect cost element, accounting for almost 18 percent of total costs (Table 5.2). The other worrying trend is the steady increase inthe proportion of expenses attributed to general and administrative functions.
5.4The concept of ‘escapability’
The traditional classification of costs described above is essentially a functionalone. Costs are allocated to particular functional areas within the airline, such asflight operations or maintenance, and are then grouped together in one or twocategories, as either direct or indirect operating costs. This cost breakdown is ofconsiderable value for accounting and general management purposes. This isparticularly so where the organizational structure within an airline correspondsfairly closely to the same functional areas as may be used for costing purposes—in other words, where an airline has a flight operations division, an engineering(maintenance) division, a sales division, and so on. A functional classification ofcosts is useful for monitoring an airline’s performance over time and also forinter-airline comparisons. Costs can be broken down relatively easily to producedisaggregate costs within a particular functional area. For instance, one couldanalyse separately labour costs in the maintenance area as opposed to the labourcosts in station and ground operations.
In addition, the broad division into direct and indirect costs is especially usefulwhen dealing with aircraft evaluation. The indirect costs of a particular networkor operation can be assumed to remain constant, since they are unaffected by thetype of aircraft used. An evaluation of a new aircraft type or a comparisonbetween several aircraft can then be based purely on an assessment of the directoperating costs. This simplifies the process of evaluation.
The great advantage of the traditional approach to cost classification is itssimplicity and the fact that in allocating costs by functional area it avoids many
112 FLYING OFF COURSE
of the problems associated with trying to allocate joint or common costs. Forinstance, station and ground costs common to a number of different services aregrouped together and are not allocated to particular flights or services. However,the simplicity of this cost classification is also its major drawback. It is of onlylimited use for an economic evaluation of particular services or routes; or forpricing decisions; or for showing how costs may vary with changes in the patternof operations on a particular route.
To aid decision-making in these and other related areas the concept of‘escapability’ of costs needs to be introduced. The degree of escapability isdetermined by the time period required before a particular cost can be avoided.Clearly some costs may be immediately escapable, as a result of a particularmanagement decision, while others may not be avoided except in the very longrun. The concept of escapability involves a temporal dimension. Different costswill require different periods before they can be avoided, but ultimately all costsare escapable. There is also a technical dimension to the concept, in that thedegree of escapability also varies with the size and nature of the airline service oractivity being considered. Thus, if all services on a particular route were to becut, the nature of the escapable costs would be other than if only one flight on aparticular day of the week were cancelled on this same route. The first course ofaction might involve not only a saving of flight operation costs but also theclosure of a complete station or a reduction in the number of crews or even thenumber of aircraft in the fleet. Cancellation of only one flight a week may involvea reduction in some flight operation costs but little else. This is because manycosts are joint or common costs and will go on being incurred to support theremaining flights even if one flight a week is cancelled. The interaction of thetemporal and technical aspects of escapability must be constantly borne in mindby airline managers.
Airlines vary in the way they introduce the concept of escapability into theircosting procedures. The most usual way is by adopting the traditional accountingdistinction of fixed and variable costs. Airlines do this by taking those elementsof cost generally accepted as being direct operating costs and further subdividingthem into ‘fixed’ and ‘variable’ costs. There are several ways in which this canbe done because of the temporal and technical considerations outlined above.The larger and more sophisticated airlines may use one breakdown of costs for,say, pricing decisions and a different one for evaluating the profitability ofparticular services or routes. One possible approach is discussed below.
5.4.1FIXED AND VARIABLE DIRECT OPERATING COSTS
Fixed or standing costs are those direct operating costs which in the short run donot vary with particular flights or even a series of flights. They are costs which inthe short or medium term are not escapable. They are certainly not escapablewithin one scheduling period. That is to say, having planned its schedules for a
THE STRUCTURE OF AIRLINE COSTS 113

particular programme period and adjusted its fleet, staff and maintenancerequirements to meet that particular schedules programme, an airline cannoteasily cut back its schedules and services, because of public reaction and its ownobligations towards the public, until the next schedules programme isintroduced. New schedules would normally be introduced twice a year. If theairline decided to cut back its frequencies when the next schedules programme wasintroduced, it could reduce its fleet by selling some aircraft and it could reduceits staff numbers and cut its maintenance and other overheads. Thus fixed orstanding DOCs may be escapable but only after a year or two, depending on howquickly the airline could actually change its schedules and cut back on aircraft,staff, and so on.
Variable or flying costs are costs which are directly escapable in the short run.They are those costs which would be avoided if a flight or a series of flights wascancelled. They are immediately escapable costs, such as fuel, flight crewovertime and other crew expenses arising in flying particular services, landingcharges, the costs of passenger meals, and so on. These are fairly self-evident.Less self-evident are the engineering or maintenance costs which should beclassified as variable. Certain maintenance checks of different parts of theaircraft, involving both labour costs and the replacement of spare parts, arescheduled to take place after so many hours of flying or after a prescribed numberof flight cycles. (A flight cycle is one takeoff and landing.) Undercarriagemaintenance, for example, is related to the number of flight cycles. Since a largepart of direct maintenance is related to the amount of flying or the flight cycles,cancelling a service will immediately reduce both the hours flown and the flightcycles and will save some engineering expenditure, notably on the consumptionof spare parts, and some labour costs.
While most indirect operating costs are fixed costs in that they do not dependin the short term on the amount of flying undertaken, others are more directlydependent on the operation of particular flights. This is particularly true of somepassenger service costs such as in-flight catering and hotel expenses and someelements of cabin crew costs. Fees paid to handling agents or other airlines forground handling of aircraft, passengers or freight can be avoided if a flight is notoperated. Some advertising and promotional costs may also be escapable in theshort run. Airlines breaking down their costs according to their escapability takesome or all of the above expenses previously categorized as indirect costs andredefine them as fixed or variable direct operating costs. This leaves within theindirect cost category costs which are not dependent on the operation ofparticular services or routes. They are fixed in the short term.
One possible division of costs based on the concept of escapability is shown inTable 5.3. In this example, all cabin crew costs, handling fees paid to others andthe costs of in-flight catering and passenger hotels all previously categorized asindirect operating costs (in Table 5.1) are here shown as direct costs. Usingpublished operating cost data for the financial year 1988/9 (CAA, 1990b) itproved possible to break down British Airways’ costs in the way suggested in
114 FLYING OFF COURSE

Table 5.3. This analysis showed that British Airways’ costs in that year weremade up as follows:
Direct operating costsVariable 36.2%Fixed or standing 22.3%Indirect operating costs 41.5%
100.0%
This breakdown is shown in greater detail in Figure 5.2. It is clear that in BritishAirways’ case more than a third of the total operating costs are immediatelyescapable. The same exercise conducted a few years earlier (that is, after the fuelprice increases of 1978) would have shown that variable costs were around 50per cent or more of total costs.
The high proportion of variable costs has important implications foroperations planning and for pricing. It shows that significant savings can beachieved in the short term by cancelling a flight or a series of flights. Thepotential savings are greatest when the price of fuel is high, since this increasesthe relative proportion of variable costs.
Variable costs are those that are immediately escapable. In the medium term,that is, within a period of a year or so, many costs previously considered fixedstart to become variable. Aircraft can be sold, cutting depreciation costs, staffnumbers can be run down or staff redeployed, sales offices shut, headquartersbuildings sold off. Elements of both fixed direct costs and indirect costs areescapable in the medium term. Ultimately all costs are escapable. What is perhapsmore significant and often forgotten is that as much as 90 per cent of
Table 5.3 Cost structure based on fixed and variable direct operating costs
VARIABLE DIRECTOPERATING COSTS
FIXED/STANDING DIRECT OPERATING COSTS
1 Fuel costs 7 Aircraft standing charges– fuel – depreciation or rental– oil consumed – insurance– water methanol (if any) 8 Annual flight crew costs
2 Variable flight crew costs – fixed salaries and otherexpenses unrelated toamount of flying done
– flight crew subsistenceand bonuses
3 Variable cabin crew costs – flight crewadministration
– cabin crew subsistenceand bonuses
9 Annual cabin crew costs
THE STRUCTURE OF AIRLINE COSTS 115

– fixed salaries and otherexpenses unrelated toamount of flying done
4 Direct engineering costs– related to number of
flying cycles– cabin crew
administration– related to number of
flying hours10 Engineering overheads
– fixed engineering staffcosts unrelated toaircraft utilization
5 Airport and en routecharges– landing fees and other
airport charges– maintenance
administration andother overheads
– en route navigationcharges
6 Passenger service costs– passenger meals/hotel
expenses– handling fees paid to
othersINDIRECT OPERATING COSTS
11 Station and ground expenses12 Passenger services
– passenger service staff– passenger insurance
13 Ticketing, sales and promotion14 General and administrative
Note: Cabin crew costs, passenger meals/expenses and handling fees here classified asdirect costs whereas in Table 5.1 they were part of indirect costs.
total costs can be varied in the medium term either by discontinuing alloperations or by a partial withdrawal of certain operations. Airlines can disinvestor dramatically cut their operations more easily than most forms of publictransport because they do not have fixed investments in navigational aids,runways or terminals, though there may be some exceptions, as in NorthAmerica where airlines may own terminals.
116 FLYING OFF COURSE

5.5Allocation of costs
In order to be able to use the concept of cost escapability in making operatingdecisions—such as whether to cut one frequency on a route or whether to openup an entirely new route—the various fixed and variable costs need to beallocated to individual flights or routes. Broadly speaking, the approach adoptedby various airlines is similar, though there may be differences in the details.
Figure 5.2 British Airways’ costs in terms of escapability, 1988/9
Source: Compiled using CAA data.
THE STRUCTURE OF AIRLINE COSTS 117

Allocating variable direct operating costs is fairly straightforward since nearlyall of them are specific to individual flights. Fuel costs, variable flight and cabincrew costs, airport and en route charges and passenger service costs (as definedin Table 5.3) depend directly on the type and size of the aircraft used and theroute over which it is being flown. They are clearly very specific and can beeasily measured. The exceptions are the variable engineering or maintenancecosts. Here some averaging out is required.
Some direct maintenance work and checks are related to the amount of flyingthat an aircraft undertakes, while other checks depend on the number of flightcycles. Maintenance on those parts of the aircraft which are most under pressureon landing or departure, such as the undercarriage or the flaps, is clearly relatedto the flight cycles undertaken. For each aircraft type an airline will normallywork out an average cost of maintenance per block hour and a separate averagecost per flight cycle. The variable maintenance cost of an individual flight canthen be calculated on the basis of the number of block hours and flight cyclesrequired for that flight.
An airline’s fixed direct operating costs are normally converted into a cost perblock hour for each aircraft type within its fleet. They can then be allocated toeach flight or route on the basis of the aircraft type(s) being used and the blocktimes for the sector or route. It is relatively easy to identify the annual flight crewcosts, since each aircraft type has its own dedicated complement of pilots, co-pilots and flight engineers. In many cases, if there are several aircraft of a particulartype, that fleet will have its own administrative managers as well. Some flightcrew overheads, however, will not be aircraft type specific and will need to beallocated on some basis between the different aircraft types, usually the numberof aircraft or annual utilization. The total annual fixed flight crew cost for a fleetof aircraft of a particular type can then be divided by the total annual utilization(that is, block hours) flown by all the aircraft in that fleet to arrive at a flight crewcost per block hour for that aircraft type. A similar approach is adopted withother fixed elements of direct operating costs. In the case of cabin crew,problems of allocating fixed annual costs between aircraft types do arisebecause, unlike flight crew, cabin crew can work on different aircraft types atany time. Nevertheless, the annual cabin crew costs can be apportioned todifferent aircraft types on the basis of the number and seniority of the cabin crewthey use and the sectors they fly on. Some fixed maintenance costs will beaircraft type specific, others will be common costs that need to be allocatedbetween aircraft types, usually on the basis of maintenance man hours requiredfor different aircraft. Thus, for each aircraft type, airlines can estimate an hourlyflight crew and cabin crew cost and an hourly maintenance cost to cover thefixed element of such costs. Some airlines take this process a step further andcalculate different hourly crew and maintenance costs for different types of routes.KLM, for instance, uses a higher hourly flight crew cost for a given aircraft typewhen it is flying on short sectors than when it is used on longer sectors. This is toreflect the poorer flight crew utilization that is achieved on short sectors.
118 FLYING OFF COURSE

The last element of fixed direct operating costs is aircraft standing costs, thatis, depreciation and aircraft insurance. These are aircraft type specific since theydepend on the purchase price of the aircraft. They are a fixed annual cost, basedon the number of aircraft of a particular type, which when divided by the annualutilization of these aircraft produces a depreciation and insurance cost per blockhour.
Since all the fixed direct costs discussed above are allocated to specificaircraft types, some airlines refer to them as ‘fleet’ costs, associated withoperating a fleet of aircraft of a particular type.
When one turns to indirect operating costs, difficult problems of allocationarise since by definition such costs are independent of the type of aircraft beingoperated. Some indirect costs may be route specific and may be escapable in themedium term if a whole route operation is closed down. If an airline operates asingle route to another country, the sales and advertising costs in that country aswell as the station and ground costs at the airport served can be readily identifiedas a cost specific to that route. But most indirect costs are fixed joint andcommon costs that cannot be easily allocated to individual flights or routesexcept on some arbitrary basis. Most station costs, indirect passenger serviceexpenses and the costs of ticketing, sales and promotion as well as overheadadministrative costs will normally be allocated to particular services or routes onthe basis of some output measure such as the revenue tonne-kilometres orrevenue generated. Each approach has its advantages and drawbacks. Usingrevenue tonne-kilometres may penalize long-haul routes where tonne-kilometresgenerated are high but revenues per kilometre are low because fares, like costs,taper with distance. Allocating indirect costs on the basis of revenue earned mayappear more equitable, but would bias against shorter routes where fares perkilometre are high. More than one allocative method may be used. Sales,ticketing and passenger service costs may be divided between flights on the basisof passenger-kilometres produced, while cargo-specific costs may be apportionedusing freight tonne-kilometres carried.
Using an allocative methodology such as that outlined above, but adapted toits own particular requirements and accounting procedures, an airline canidentify the variable and fixed costs of individual flights or routes. By comparingthem with the revenues generated, it is then in a position to make decisions as tothe number of frequencies it should operate on a route or whether it shouldoperate a route at all.
THE STRUCTURE OF AIRLINE COSTS 119

6Determinants of Airline Costs
6.1Management control of costs
Variable operating costs, which may represent up to 50 per cent of totaloperating costs, can be escaped in the short term by cancellation or withdrawalof services. In the medium term, perhaps as much as 90 per cent of costs can besaved by disposal of aircraft, reduction of staff, closing of offices, and so on.Through their ability to increase or reduce their scale and pattern of operations,airline managements can directly affect their total costs. In this sensemanagement control over costs may be absolute and constrained only by thedesires of shareholders—whether governments or private individuals or firms.Clearly, overall costs are broadly determined by the level of supply (that is, thevolume of output) decided upon by the management. But, once a level of outputhas been decided upon and is being planned for, what factors then determine theprecise level of costs that will be incurred?
Airline managers’ prime objective is to match the supply of air services, whichthey control, with the demand, over which they have much less control, in such away as to be both competitive and profitable. Having decided upon the appropriatelevel of supply for particular routes or markets, they must then ensure that theiroperating costs are as low as possible. In deregulated markets, with little or notariff or entry control, costs per passenger kilometre or tonne-kilometre must beat least as low as those of other competing airlines. If not, the airline may beunable to compete effectively and be profitable at the same time. Even inregulated markets, unit costs must be kept low, not so much for competitivereasons but in order to ensure high or at least adequate profits at the prevailingtariffs.
Unit cost levels among international airlines vary widely. Table 6.1 shows theunit costs for the six largest international carriers (in terms of international tonne-kilometres performed and for which data were available) in each of three regionsin the world. Together these 18 airlines carried 50 per cent of the world’sinternational tonne-kilometres in 1988. The unit costs are for their totaloperations. (Subsequent tables also refer to these 18 airlines except where data

are unavailable.) The table amply illustrates both the wide range in cost levelsbetween airlines and the existence of marked regional vari-ations. High-costairlines such as Lufthansa or Swissair have unit costs twice as high as low-costSingapore Airlines (SIA) or Cathay Pacific. Asia/Pacific is the region whichstands out as having the lowest-cost airlines, though it also encompasses one ortwo higher-cost operators, notably Japan Air Lines (JAL). The North Americancarriers are also relatively low-cost operators and it is noticeable that there isrelatively little variation in cost levels between them. In contrast, the sixEuropean carriers tend to be at the bottom of the list, indicating relatively highcosts.
The numerous factors which affect airline operating costs can be grouped intothree broad categories according to the degree to which they can be influencedby management. First, one can identify a number of external economic factorsover which airlines have little control. Such factors include the prevailing wagelevels, fuel prices and airport and en route navigation charges. An airline has toaccept these as more or less given and can only marginally mitigate their impactthrough negotiations with unions or fuel suppliers. The levels and patterns ofdemand that an international airline is trying to satisfy are also largely externallydetermined by economic and geographical factors beyond its control. Secondly,there are two major determinants of costs over which airlines have somewhatgreater but still limited control. These are the type of aircraft used and the patternof operations for which the aircraft are used. While both of these might seem tobe entirely at the discretion of airline management, in practice managements’hands are tied to some extent by factors beyond their control. The geographicallocation of an airline’s home base, the bilateral air services agreements signed byits government, the traffic density on its routes and other such factors willstrongly influence the type of aircraft required and the network operated.Management does not have an entirely free hand to do as it wishes. This isparticularly so of national airlines in countries with only one flag carrier. Thethird category of cost determinants is that over which managements have moreor less total control. Marketing, product planning and financial policy fall intothis category. In the final analysis one must also consider managerial efficiencyas a cost determinant. It is crucial in that it determines the degree to which theimpact of the other factors mentioned above, whether favourable orunfavourable, can be modified to the benefit of the airline concerned.
The analysis in this chapter of the effect of different variables on costs isqualitative rather than quantitative. Earlier studies have used various forms ofmultivariate analysis to establish the influence of a range of independentvariables (for instance, airline size, pilot wage levels or stage length) on adependent variable such as unit costs or labour productivity. Stratzheim (1969)used a multivariate approach in his examination of international airlines, as didPearson (1977) in his study of European carriers. In theory, multivariate analysisshould be able to establish the relative impact of the various independentvariables on the unit costs of the airlines concerned. Certainly Pearson was able
FLYING OFF COURSE 121

to produce high coefficients of determination suggesting that a high proportionof the variations in the dependent variable could be explained by variations in theindependent variables. Subsequent work by the Civil Aviation Authority hasquestioned the value of multivariate analysis (CAA, 1977c, Appendix B). TheCAA carried out its own multivariate analysis of European airline performance.For instance, it examined labour productivity as a dependent variable. Usingdifferent independent variables from Pearson, but comparable ones, it was able toproduce equally high coefficients of determination. However, one or two airlinesthat were labour efficient when analysed by Pearson were inefficient in their useof labour when assessed by the CAA model. Such discrepancies occurred in otherareas too. Two models using the same technique and broadly comparable sets ofexplanatory variables should have produced consistent results. The fact that theydid not raises serious doubts about the validity of multivariate analysis forcomparative studies of international airlines.
Table 6.1 Unit operating costs: selected international airlines, 1988 (US cents per tonne-km available)
Rank North American European Asia/Pacific
US¢ US¢ US¢
1 SIA 31.02 Cathay Pacific 32.33 Air India 34.24 Northwest 36.45 TWA 37.26 American 39.27 = Air Canada 39.5 Thai International 39.589 Pan Am 40.210 United 41.311 Qantas 42.212 Air France 43.313 KLM 44.314 JAL 52.415 Alitalia 53.516 British Airways 56.317 Lufthansa 59.218 Swissair 76.2Source: ICAO (1988a).
It has subsequently been argued by some economists that studies such as thosementioned above are essentially inductive. They can correlate events rather than
122 DETERMINANTS OF AIRLINE COSTS

establish cause and effect between them. This is an added shortcoming of suchan approach. The alternative might be to develop a deductive approach, which byusing selected measures of total factor productivity allows comparisons betweenairlines in different countries by adjusting for differences in factor prices,network characteristics, aircraft size and so on (see, for example, Gillen et al.,1985). This is an interesting and potentially valuable approach, but it ismathematically complex.
In order to provide a better conceptual understanding of the determinants ofairline costs it was felt that for the purpose of the present study a morequalitative approach would be preferable to both the above techniques.
6.2Externally determined input costs
The cost of a number of key airline inputs or factors of production is determinedby external economic variables that are largely outside the control of individualairline managements. Since the external variables vary between countries andregions, the input prices of different airlines may also vary significantly. Whileairlines can try to reduce the prices of their inputs, in the case of some key inputsthey can do so only to a limited extent. They have to accept the general level ofthese input prices as given and they have only limited scope to negotiatedownwards from that given level. Another feature of these input prices is thatthey are subject to sudden and often marked fluctuations. Adjusting to suddenchanges in the price of fuel or in the level of charges at a particular airport is acommon headache among airline managers.
6.2.1PREVAILING WAGE LEVELS
For most international airlines wage costs represent 25–35 per cent of their totaloperating costs, though the figure is lower for many Third World airlines. Sincewages represent a high proportion of total costs, variations in the average level ofwages paid have a direct effect on an airline’s total costs and may also lead toappreciable cost differences between airlines. However, the salaries and wagespaid by any airline depend primarily on prevailing salary levels and the labourmarket in its home country rather than on the negotiating skill of the airline’spersonnel department.
In a country with free wage bargaining it is the interplay of supply of anddemand for the categories of labour required by the airline(s) together with thestrength of particular unions which will broadly determine the level of wagesthat an airline has to pay for its various categories of staff. In other countries,wage levels may be set by national agreements between governments oremployers’ associations and the trade unions. In some cases governmentsthemselves virtually determine the levels to be paid and impose them on
FLYING OFF COURSE 123

employers and employees alike. In all cases the prevailing wage levels arerelated to the standard and cost of living in the country concerned. Airlines cannegotiate with the unions representing their employees but usually only within afairly narrow band whose level is predetermined by the prevailing wage levels inthe country concerned. An interesting byproduct of deregulation in the UnitedStates was the way in which new, largely non-unionized airlines undermined thepower of the established airline unions, including the pilots’ union ALPA. Thenew carriers had no trouble in getting employees willing to work at much lowersalaries and stricter work conditions. The established carriers were forced eitherto induce their employees to accept wage cuts which was done by severalairlines, or to introduce a two-tier wage structure whereby any new employeeswere taken on at much lower salaries than existing ones (Nammack, 1984).American Airlines did the latter.
The significant variations in wage levels for similar categories of staff betweenregions and between airlines in the same region are illustrated in Table 6.2. Thisshows the average annual remuneration or wage for three discrete types of airlineemployees for most of those airlines whose costs were given in Table 6.1. Somevariation in pilot salaries may be due to differences in flight equipment, sincepilot salaries vary with the type of aircraft flown, or with the age and seniority ofthe pilots. Nevertheless, allowing for this and other minor discrepancies, someinteresting conclusions emerge.
US airlines, which 10–15 years ago tended to pay higher wages for allcategories of staff than other international airlines, now find themselves payingless than several of the high-wage European carriers. The wage costdisadvantage of North American carriers has largely disappeared. At the sametime, wages paid in the United States tend to be very similar for all carriers. Inother words, it is the prevailing labour market conditions that set the levels, andmost airlines, with one or two particular exceptions, pay wages close to the norm.Conversely, when one examines European or Asian carriers one finds largedifferences in wage levels even between airlines in neighbouring states. ThusSwissair pilots or cabin attendants are getting paid nearly twice as much as theirBritish counterparts.
Lastly, it is apparent that Asian carriers, with the exception of JAL, pay verylow wages for all categories of staff when compared with most of theirinternational competitors. This explains why wage costs are a relatively smallproportion of their total costs. For most Asian airlines, other than JAL, staff costsare generally 10–20 per cent of total operating costs. This contrasts with NorthAmerican carriers where the figure is around 30–35 per cent and Europeanairlines where it is normally in the range 25–35 per cent. Lower staff costs may alsobe one explanation for the low unit costs of Asian carriers shown in Table 6.1.An extreme case is Air India, where wage rates are very low even by Asianstandards. On the other hand, Air India wages are likely to be commensuratewith wages for similar employment within other Indian companies. Significantlylower wage levels are a distinct cost advantage enjoyed by a number of Third
124 DETERMINANTS OF AIRLINE COSTS

World airlines. More surprisingly it is also a relative advantage enjoyed byBritish airlines (and British Airways in particular), since airline salaries in theUnited Kingdom have lagged behind those in other European countries. Thegradual devaluation of sterling over many years has reinforced this tendency.
Table 6.2 Average annual remuneration for different staff categories in selected airlines,1988
Region/airline Average annual remuneration (US$)
Pilots and co-pilots Cabin attendants Maintenance and overhaulstaff
North America:United 116,100 29,600 40,500Delta 93,600 27,600 34,300TWA 93,000 26,400 31,000Northwest 86,200 26,300 47,900Pan Am 85,600 32,300 28,500Air Canada 76,100a 25,800 32,800
Europe:Swissair 165,300 42,400 n.a.KLM 142,200 32,900 31,200Lufthansa 135,100a 45,800 44,200Alitalia 100,200a 65,300 n.a.British Airways 84,600 24,500 32,300
Asia/Australasia:JAL 170,600a 65,200 n.a.Qantas 86,400 28,900 28,300SIA 69,000 21,100 26,600Malaysia Airlines 50,800 16,100 8,900Thai International 35,400a 8,200 7,900Air India (1987) 29,400 10,000 3,300
Note:a Figures include flight engineers.Source: ICAO Digest of Statistics: Fleet and Personnel 1988.
The ultimate cost of labour depends not only on the wage rates paid but also
on the productivity of that labour. This partly depends on institutional factorssuch as working days in the week, length of annual holidays, basic hours workedper week, maximum duty periods for flying staff and so on, and partly onoperational factors such as size of aircraft, stage length and frequencies operated.Within these constraints, management has a role to play in trying to achieve as
FLYING OFF COURSE 125

high productivity as possible amongst its various groups of workers. Inparticular, airlines paying high wages can try to compensate for their high wagelevels by achieving high productivity per employee. When comparing wagelevels (Table 6.2) and employee productivity (Figure 6.1), it is evident thatseveral North American carriers, such as Pan American, Northwest and TWA, dothis, as does JAL. European carriers are noticeable as a group for their generallylow productivity even when, as is the case with KLM or Swissair, their wagelevels are unusually high. Airlines which have both relatively low wage levelsand high labour productivity are in a very strong competitive position. SingaporeAirlines is in this situation. Conversely, a few very low-wage airlines, such asAir India, are overstaffed and do not appear to get the full cost advantage of theirlow wages.
While available tonne-kilometres (ATK) per employee is the traditionalmeasure of labour productivity, in the highly competitive world of internationalair transport it is not the number of employees which is critical but the cost ofsuch employees in relation to the output they generate. It does not matter if anairline is apparently overstaffed if it pays relatively low salaries. If labour is acheap resource, there may be operational or service benefits in employing morethan is strictly necessary. Since comparative wage rates vary enormously, it maybe more indicative of efficiency in the use of labour to compare airlines in termsof ATKs per $1,000 of labour cost (Figure 6.2). Many of the Asian carriers nowcome into their own, with labour productivity levels double or triple those oftheir European or North American counterparts. Airlines like Air India orPakistan International Airlines (PIA), the least efficient users of labour inphysical terms, are now among the most efficient in terms of resource costs.Conversely, among US airlines the high ATKs per employee are substantiallyeroded by the relatively high wage levels, so that their ATKs per $1,000 of labourcost do not look so impressive.
Some Third World airlines face a particular labour problem, which is the needto employ expatriate staff as flight crew and in engineering. Expatriate staff arevery expensive both because they expect to receive salaries comparable to thosein their own country and also because they receive accommodation and otherallowances in order to move to the country of the airline employing them.Singapore Airlines, for example, because of its rapid expansion, had toemploy many expatriate pilots during the late 1980s and this pushed up itsaverage remuneration for pilots to levels which were high in comparison withneighbouring airlines in South East Asia (Table 6.2). Management in airlinesusing expatriate staff can significantly reduce their labour costs by encouragingand financing the training of their own nationals as pilots and aeronauticalengineers.
126 DETERMINANTS OF AIRLINE COSTS

6.2.2PRICE OF AVIATION FUEL
The price of aviation fuel at any airport depends partly on the companiessupplying the fuel and partly on the government of the country concerned. As faras the fuel companies are concerned, the price of crude and refinery costs are
Figure 6.1 Labour productivity, 1988: available tonne-km per employee
Source: Compiled using ICAO data.
FLYING OFF COURSE 127

fairly similar world wide. But distribution and handling costs vary considerably.While oil refineries are widely scattered around the world only a relatively smallnumber refine jet fuel. The supply of fuel to some airports may involve lengthyand costly transportation, especially if the airport is well away from a port.Transportation costs also rise if the volume of fuel supplied to an airport is small.Handling costs vary in relation to the facilities used and the volume handled.
Figure 6.2 Labour productivity, 1988: available tonne-km per US$1,000 labour cost
Source: Compiled using ICAO data.
128 DETERMINANTS OF AIRLINE COSTS
Governments may influence the price of jet fuel in two ways. They may imposeimport duties or some other kind of tax, though many governments do neither ofthese things for fuel supplied to international flights. Philippine Airlines, forexample, has for many years complained of the high prices it pays for jet fuel inits own country because of government taxes. Some governments may also try tocontrol or fix the price of fuel as a matter of government policy. During the1970s both the United States and Australian governments maintained domesticcrude oil prices and the prices of refined products at well below world levels butsubsequently abandoned this policy. As a result, in both countries the price of jetfuel is now closer to prices in other countries. But other governments, that ofBrazil is one, continue to impose price controls on fuel.
The interplay of oil company costs and pricing strategies and individualgovernment policies on taxation and fuel price control determines the posted fuelprices at airports around the world. Inevitably considerable variations arise. In May1990 the posted fuel price per US gallon exclusive of duties or taxes was 170 UScents in London or Manchester, 145 cents in Entebbe (Uganda), 100 cents inManila, 95 cents in Singapore and only 84 cents at any Brazilian airport becauseof the Brazilian government’s policy (Shell, 1990). Regional variations are alsoquite marked. African airlines seem particularly disadvantaged by the very highfuel prices at most African airports south of the Sahara except Lagos, while fuelprices in North America are generally the lowest (Table 6.3).
Few airlines pay the posted price. Regular users of an airport will negotiatetheir own contract price with the fuel suppliers. This will be at a discount on theposted price, the level of the discount depending on the total tonnage of fuel thatan airline expects to uplift during the contract period. Thus in May 1990, whenthe posted price in London was 170 US cents per US gallon, a large carrieruplifting over 50 million US gallons a year was probably paying around 60 centsa gallon. Airlines with only a handful of flights a week would be paying more. InHong Kong, where the posted fuel price was only 110 cents, a big buyer wouldhave been paying around 58 cents. In other words, the prevailing discount on theposted price in Hong Kong is less than that in London. The discount will also beinfluenced by the number of fuel suppliers. If there is only one oil companyproviding fuel, the scope for pushing down the price is clearly limited. At mostairports around the world there are generally only a few available fuelcompanies. In the United States, on the other hand, the existence of a large numberof small refineries and of common carrier pipelines open to use by any companyhas resulted in very large numbers of companies competing for fuel supplycontracts. This has a strong downwards pressure on jet fuel prices. In a fewcountries such as India, fuel prices may be fixed by the government and may benon-negotiable.
FLYING OFF COURSE 129

Table 6.3 Fuel prices on international scheduled services, 1987
Route group Average fuel/oil price paid (US¢ per litre) Index North America=100
Africa 25.7 178South America 23.0 160Asia/Pacific 19.0 132Middle East 18.1 126Europe 16.4 114North America 14.4 100World average 17.3 120Source: ICAO (1989a).
The price of fuel is crucial for airlines since on any particular route it mayrepresent as much as 25 per cent of operating costs, though overall it accountsfor 10–20 per cent of the total costs of many airlines. The cost of fuel for anyairline will depend on the posted prices at its main operating airports, and inparticular its home base, and on its ability to negotiate discounts on those postedprices. However, the discounted prices paid by large users at any airport will befairly similar, since the fuel buyers in each airline will have a fairly good idea ofwhat other airlines are paying. Thus the general level of the fuel price at anyairport for large users is set by prevailing market conditions. Airline fuel buyers,if very good negotiators, may marginally reduce the price they have to pay, buttheir impact is only very marginal.
Airlines can try to mitigate the impact of high fuel prices at certain airports byreducing their fuel uplift at those airports. Instead, cap-tains may be instructed totanker as much fuel as possible at airports where fuel prices are low. Such apolicy, however, needs careful monitoring since extra fuel will be burnt duringthe flight to carry the additional fuel loaded, as fuel consumption rises with thetotal weight of the aircraft.
An added problem for airlines is that oil companies now generally insist onescalation clauses in fuel supply contracts. These allow the fuel price to move upor down in response to changes in the price of crude oil. In some contracts pricesmay also fluctuate in response to supply and demand considerations. Airlines canno longer use fixed-price contracts to isolate themselves from external economicfactors leading to a sudden jump in the price of aviation fuel.
The differential impact of fluctuating exchange rates may also adversely affectsome airlines, since fuel prices in most parts of the world are quoted in USdollars. If the dollar exchange rate of a particular currency drops rapidly, then thecost of fuel in that country in terms of its own currency will rise equally rapidly.This will hit hardest the country’s own national airline, most of whose earnings arein local currency. This happened in many countries in recent years.
While unable to influence the basic price of fuel except marginally, airlinescan lower their fuel costs by trying to reduce their fuel consumption. A number of
130 DETERMINANTS OF AIRLINE COSTS

options are open to them. They can try to reduce the weight of their variousaircraft by using lighter equipment in the cabin, and less paint on the outside oftheir aircraft. They can also reduce weight by avoiding unnecessary ‘tankering’,that is, carrying more fuel than is required to meet safety minima on a particularsector. Then they can save fuel by reducing the aircraft cruising speed. A 3–4 percent reduction in the cruising speed of a jet aircraft on a sector of 1 hour or moremay reduce fuel consumption by 6–7 per cent at the cost of a few minutes’ extraflying. Computerized flight planning can also help. By choosing particular ratesof climb or descent and particular cruise altitudes, airlines may be able to reducefurther the fuel consumed. But ultimately the biggest savings come fromswitching to newer, more fuel-efficient aircraft, especially where one can replacethree- or four-engined jets by aircraft having fewer and more advanced engines.
6.2.3USER CHARGES
For the world’s airlines as a whole, user charges (that is, airport charges and enroute facility charges) account for just over 5 per cent of their total costs. Theproportion generally rises for international airlines operating relatively shortsectors, where landings occur more frequently. In 1988, Finnair and BritishMidland, both short-haul airlines, found that airport and navigation user chargestogether represented close to 20 per cent of their total costs; for Finnair it was 19–9 per cent and for British Midland 20.3 per cent. Yet for some airlines, such asKLM or SIA, the proportion dropped to just below 5 per cent, while for UScarriers it was generally 2–4 per cent.
User charges, like wage levels and fuel prices, are largely externallydetermined. But, in contrast, user charges give little room for manoeuvre. Whilethe airlines as a whole acting through the International Air Transport Association(IATA) may try to hold down increases in landing fees or en route charges in aparticular country, an individual airline has no scope for negotiating better ratesfor itself. All are in the same boat.
The level of airport charges will depend partly on the costs at the airports andpartly on whether the airport or the government is trying fully to recover thosecosts or even make a profit. As a result, landing charges vary enormouslybetween different airports (Table 6.4). Except in the United States, airportcharges consist of two major elements; a landing fee based on the weight of theaircraft and a passenger charge levied on a per passenger basis. The InternationalCivil Aviation Organization (ICAO) recommends that the passenger chargesshould be levied on the airlines and their cost recouped through the ticket. MostEuropean and some Third World airports do this. Elsewhere the fee is levieddirectly on passengers on departure and therefore does not appear as an airlinecost. Airlines based in or operating through airports where passenger charges arelevied directly on passengers enjoy a cost advantage. This is reinforced if the
FLYING OFF COURSE 131

aircraft landing fee is also low. Examination of Table 6.4 suggests that this mightwell be the case with South East Asian or South American airlines.
Table 6.4 Representative airport charges, 1990
Landing plus passenger feesa (US$)
Airport Boeing 747 MD 80
Manchester (peak) 8,157 2,190Manchester (off-peak) 7,035 1,725London-Heathrow (peak) 6,477 3,080Frankfurt 6,470 1,524Tokyo-Narita 6,305 1,062Montreal 5,238 1,768Amsterdam 5,147 1,321Paris 4,758 1,109Zurich 4,568 1,230Rome/Milan 4,030 1,188New Delhi/Bombayb 3,297 384Buenos Airesb 2,732 338Cairo 2,343 729Singaporeb 1,876 254Rio de Janeirob 1,754 295Bangkokb 1,513 220Kuala Lumpurb 1,320 184New York 1,297 219London-Heathrow (off peak) 1,221 795Caracasb 1,140 192Hong Kong (peak)b 1,022 356Nairobib 529 72San Francisco 490 83Notes:a Based on 70% seat factor.b Excludes passenger charge because paid direct by passenger to airport.Source: IATA Airport and En-Route User Charges Manual.
The position in the United States is unique. Passenger charges imposed byairports are forbidden and landing fees are generally low. On the other hand,airlines at most airports build and run their own terminals, which clearlyincreases their costs. Elsewhere in the world it is very unusual for airlines tooperate their own passenger terminals, though they may have their own cargocomplexes.
132 DETERMINANTS OF AIRLINE COSTS

En route navigation charges are imposed by civil aviation authorities onaircraft flying through their air space to cover the cost of air traffic control andnavigational and other aids provided. The charges are generally levied on the basisof the weight of the aircraft and the distance flown within each country’s airspace. While there is some uniformity in the method of charging, the level ofcharges varies enormously, as can be seen in Table 6.5. By far the highestcharges are those in Japan and those imposed by Eurocontrol for use of the air spacein western Europe. At the other extreme, many countries have very low chargesor none at all, like South Africa or the United States. In the States, navigationalfacilities are provided as a free public service without a direct charge to theairlines by the Federal Aviation Administration. Costs are recovered by a tax onairline tickets paid by passengers.
A few airlines have been able to persuade their governments or airportauthorities to give them preferential treatment on airport or en route navigationcharges. They are either exempted from payment altogether or they may get asubstantial discount. The Greek airline
Table 6.5 Representative en route charges, 1990
Country Charges for a 500 km overfly distance (US$)a
Boeing 747 MD 80
Japan 1,493 1,293UK 1,134 465France 819 336Italy 777 319Germany 762 312Netherlands 631 259India 544 306Argentina 536 200Egypt 359 94Kenya 199 64Venezuela 183 51Canada-Atlantic routes 129 129Philippines 100 100United States none noneNote:a Based on aircraft weights of 380 tonnes for Boeing 747 and 64 tonnes for MD 80.Source: As for Table 6.4.
Olympic, for instance, was for many years not paying landing fees at Athens onits international flights. Elsewhere, some national airlines are billed but do notpay their bills to the civil aviation authorities. Such cases are relatively few,however, because such preferential treatment runs counter to Article 15 of the
FLYING OFF COURSE 133

Chicago Convention and to the principle of equal treatment of each other’sairlines which is enshrined in bilateral air services agreements.
The costs of labour, fuel and airport and navigation facilities togetherrepresent between 40 and 50 per cent of most airlines’ total expenditure.Therefore the prices that any airline pays for these inputs have a major effect onits cost levels. Moreover, differences in input prices may explain some of thevariation in costs between airlines. Yet airlines can only marginally influence thelevel of these input prices. What they can do is try to minimize the use of theseinputs for any given level of output. In other words, they must strive to be asefficient as they can in their use of inputs. A key determinant of efficiency in theuse of inputs is the type of aircraft being used and the sector lengths over whichit is being flown. However, before considering the impact of aircraft type oncosts, one needs to consider the influence of demand.
6.3The influence of demand on costs
It is generally understood and accepted that airline costs have a direct impact onthe demand for air services since they influence the prices at which thoseservices are sold. What is frequently forgotten, however, is that costs are notentirely independent of demand; they are themselves influenced by demand.There is a two-way relationship between supply (costs) and demand. Twoaspects of demand, in particular, impact on costs, namely route traffic densityand sector length.
The traffic density on a route and the sector length(s) on that route willinfluence the size and type of aircraft chosen for that route. Aircraft type, andmore especially the size of the aircraft, is a key determinant of unit costs. Routetraffic density also influences the frequencies which are needed and will therebyaffect the annual utilization, that is, the number of hours flown by each aircraft.The higher the utilization, the lower the costs. Traffic density also affects thelevel of station costs per passenger or tonne of cargo. Since station costs do notgo up in proportion to the traffic handled, then more traffic going through astation means lower costs per unit of traffic. These relationships will becomeclearer in the following sections.
There is one other aspect of demand which impacts on costs and that is thevariations in demand over time. Marked seasonal peaks create a need for extracapacity in terms of aircraft, crew, ticketing and sales staff, catering facilities andso on, which may be grossly under-utilized in off-peak periods. Carrying thatextra capacity during the off-peak is costly. From a cost point of view, airlinesare better off if they are trying to satisfy a pattern of demand that is more or lessconstant throughout the year (section 8.6).
In a truly competitive environment airlines would be free to choose their ownmarkets in terms of the length of routes and traffic densities that they wish toserve. This may be happening among US domestic airlines and to a more limited
134 DETERMINANTS OF AIRLINE COSTS

extent among European charter airlines. But the vast majority of internationalairlines do not have an entirely free hand with regard to the demand that they setout to satisfy. The routes that they serve and the density of demand on thoseroutes are largely determined by the interplay of geographical, political,economic and social factors outside the airlines’ control. The starting point forany international airline is its home base. The geographical location of the homebase, together with the level of business and tourist interaction between the homecountry and other nations, will influence the potential sector lengths and trafficdensities that can be fruitfully operated. Australia and Malta represent the twoextremes. The international airline of Australia must be a long-haul carrierbecause of its geographical location. Conversely, the national airline of Malta, asa result of the island’s location and size, is predetermined to be a short- tomedium-haul airline with only a small number of relatively thin routes.
Where an airline is a country’s only international airline, which is the casewith most airlines, it may also be under political pressure to operate some routeswhich it would otherwise ignore. Conversely, where there are two or moreinternational carriers, as in the United Kingdom or the United States, they mayhave much more choice as to the routes they can serve.
Though constrained by some of the above factors, airlines do have someability to influence the patterns of demand on the routes they serve or wish toserve. First, they can as a matter of policy concentrate on the denser trafficsectors. Second, they can try to increase the total traffic on their routes throughtheir pricing policy and promotional activity. Third, they can try to improve theirown traffic density by increasing their market share when they have competitorson the route. Many airlines place considerable emphasis on increasing theirmarket share on their major routes. This is not merely because it increases theirrevenues but also because it can help them to reduce costs.
6.4Aircraft type and characteristics
Many technological aspects of each aircraft type have a direct effect on thataircraft’s operating costs. The most important from an economic viewpoint arelikely to be the size of the aircraft, its cruising speed and the range or distancewhich that aircraft can fly with a full payload. The significance of size, speed andrange is reinforced in that, taken together, they determine an aircraft’s hourlyproductivity, which in turn also affects costs.
6.4.1AIRCRAFT SIZE
As a general rule, though there are exceptions, the larger an aircraft the lowerwill be its direct operating costs per unit of output, that is, per tonne-kilometreavailable or per seat-kilometre. In other words, other things being equal, the
FLYING OFF COURSE 135

direct operating costs of aircraft do not increase in proportion to their size ortheir payload capacity. The cost per hour of the larger aircraft will be higher thanthat of a smaller aircraft but when converted into a cost per seat-kilometre or pertonne-kilometre it is lower. For example, in 1989, in the United States a Boeing737–200 aircraft with say, 110 seats would have incurred direct operating costs ofabout $1,510 per block hour (Avmark, 1990). An Airbus A320 aircraft with 150seats would cost about $1,700 per block hour to fly. The larger aircraft’s hourlycosts were almost 13 per cent higher than those of the Boeing but its capacity interms of seats was about 36 per cent more. The A320’s greater capacity morethan compensated for its higher hourly cost. As a result, the cost per seat-kilometre of the A320 was significantly lower. Assuming the same average blockspeed of 505 km per hour for both aircraft, the direct cost per seat-kilometre ofthe Boeing would have been 2.71 cents and of the A320 only 2.24 cents, or 17per cent less.
Aircraft size influences costs in two ways. In the first instance, there arecertain aerodynamic benefits from increased size. Larger aircraft haveproportionally lower drag and more payload per unit of weight. At the sametime, larger and more efficient engines can be used. Thus the 260-seater AirbusA300 has a maximum take-off weight which is nearly three times as great as thatof the Boeing 737–200, yet its hourly fuel consumption is only slightly morethan twice as high (Avmark, 1990). It is relatively easier and cheaper per unit ofweight to push a large mass through the air than a smaller one. (The same appliesto mass in water. Hence the development of supertankers.) Secondly, there areother economies of size related to the use of labour. Maintenance costs, a largepart of which are the costs of labour, do not increase in proportion to increases inaircraft size. One can see this clearly when comparing two aircraft from the samemanufacturer, the Boeing 737–300 and the Boeing 757–200. Their hourlymaintenance costs among US airlines in 1989 were almost identical, at just over$300 per block hour, yet the 757 could carry up to 40 per cent more passengers.In addition, large economies also arise in flight crew costs since larger aircraft donot require more flight crew, though the pilot and co-pilot may be paid slightlymore for flying a larger aircraft.
Thus, when in 1979 Cathay Pacific introduced Boeing 747s in place ofTristars, both with three-man crews, it found that the crew costs went up by about12 per cent but the larger aircraft offered 40 per cent more seats. Since the early1980s three new large twin-jet aircraft (the Boeing 757 and 767 and the AirbusA310) and frequently smaller jets, such as the Airbus A320, specificallydesigned for two-man operation, have been available. Developments in digitaland cathode ray display technology allowed redesign of the cockpit so as toeliminate the role of the flight engineer. Airlines switching from some smallerolder aircraft types such as Boeing 727s to these newer and larger jets obtain asignificant saving in flight crew costs as flight crew numbers are cut from threeto two.
136 DETERMINANTS OF AIRLINE COSTS

The close relationship between aircraft size and unit costs for the majoraircraft types operated by US trunk airlines can be seen in Figure 6.3, whichshows (right-hand axis) how hourly costs increase in a linear progression asaircraft size, measured in seats, rises. However, since hourly costs increase lessthan proportionately to size (that is, the slope of the straight line is less than 45°),when they are converted to costs per seat-kilometre there is a strongly downward-sloping curve (left-hand axis). The relationship between increasing size orseating capacity and declining unit costs is clear, though there are deviations.Such deviations relate either to new and improved versions of existing aircrafttypes, which explains the lower unit costs of the MD 80 or Boeing 737–300compared with the Boeing 727, or to the newer generation of twin-engine
Figure 6.3 Direct operating costs against aircraft size: US airlines, year to 30 September1989
Source: Compiled using Avmark (1990) data.
FLYING OFF COURSE 137

aircraft, such as the Boeing 767, with unit costs lower than those of some largeraircraft. It should always be borne in mind that the aircraft illustrated are inpractice flown on different average sector lengths and this also influences theunit costs shown in the diagram.
Lastly, it is important to emphasize that, while larger aircraft generallyproduce lower seat-kilometre or tonne-kilometre costs than smaller aircraft whenflown on the same sectors, their total round-trip costs are in most cases higher.This is a basic conundrum of airline planning. Does an airline choose the aircraftwith the lower seat-kilometre costs or the one with the lower trip costs?
6.4.2AIRCRAFT SPEED
Apart from size, aircraft speed also affects unit costs. It does this through itseffect on an aircraft’s hourly productivity. Since hourly productivity is theproduct of the payload and the speed, the greater an aircraft’s cruising speed thegreater will be its output per hour. If an aircraft flies at an average speed of 800km/h and has a 20 tonne payload, its hourly output is 16,000 t-km. An aircraftwith a similar payload flying at 900 km/h would generate 18,000 t-km per hour,or about 12.5 per cent more than the slower aircraft. Some elements of costmight be higher for a faster aircraft. Fuel consumption might be slightly higher,unless the faster speed was due to improved aerodynamic design. Many costs,however, particularly those that are normally estimated on a per block hourbasis, would be similar. Flight and cabin crew costs, maintenance costs,insurance, landing fees and depreciation would certainly be fairly similar. Thesesimilar hourly costs would be spread over 12.5 per cent more tonne-kilometres.Therefore, assuming other things are equal, the cost per tonne-kilometre for thefaster aircraft would be lower. In the earlier cost comparison between the Boeing737–200 and the Airbus A320 it was assumed that both aircraft had an airbornespeed of 505 km/h. This was in fact the average speed achieved in 1989 by thesmaller aircraft. The Airbuses were actually faster and their average speed wasaround 590 km/h. At this speed the Airbus unit costs go down from the 2.24cents per seat-kilometre previously calculated to 1.99 cents per seat-kilometre.This compares with the 2.71 cents per seat-kilometre of the smaller and slowerBoeing 737 and produces a unit cost reduction of 27 per cent. Since in practicethe faster aircraft are frequently larger as well, the cost advantages of size andspeed reinforce each other, producing the lowest seat-kilometre or tonne-kilometre costs.
6.4.3TAKE-OFF PERFORMANCE AND RANGE
The lower unit costs of larger and faster aircraft do not mean that airlines shouldalways choose to operate such aircraft in preference to smaller, slower aircraft.
138 DETERMINANTS OF AIRLINE COSTS

Airlines must resolve the conundrum previously mentioned. The larger aircraftwith the lower tonne-kilometre costs will have higher trip costs than smalleraircraft. In making a choice between aircraft types, other factors must also beconsidered, such as the level and pattern of demand on the routes for whichaircraft are needed and the deign characteristics of the aircraft in relation to thoseroutes. Aircraft are designed to cater for particular traffic densities and stagelengths. As a result, each aircraft type has different take-off and rangecharacteristics and these in turn influence unit costs. An aircraft requiringparticularly long runways or with engines adversely affected by high ambienttemperatures at airports suffers cost penalties. In either case it can overcome itsdesign handicap by reducing its payload so as to reduce its take-off weight. Thiswould enable it to take off despite a runway or temperature limitation. But thereduced payload immediately results in higher costs per tonne-kilometre sincethe same costs need to be spread over fewer units of output.
An aircraft’s range performance is illustrated in payload-range diagrams suchas the one for the Airbus A310 in Figure 6.4. Each aircraft is authorized to takeoff at a maximum take-off weight (MTOW). This weight cannot be exceeded for
Figure 6.4 Payload for two versions of the A310
Note: The 300 series is an extended-range version of the 200 series. Passenger payload isbased on 18 first class at 100.7 kg each plus 200 economy at 0.7 g.
Source: Airbus Industrie.
FLYING OFF COURSE 139

safety reasons. The MTOW is made up of the ‘operating weight empty’ of theaircraft, plus some combination of fuel and payload. With maximum payload theaircraft taking off at its MTOW will be able to fly up to a certain distance forwhich it has been designed. This is known as the ‘range at maximum payload’. Tofly beyond this distance the aircraft must substitute fuel for payload, alwaysensuring that it does not exceed its MTOW. Initially the reduction in payloadmay be in terms of belly-hold freight rather than passengers. The aircraft’s rangecan be progressively increased by a further uplift of fuel and a continuingreduction in payload. This process continues until the fuel tanks are full and noextra fuel can be uplifted. The amount of payload at this point is known as‘payload at maximum range’. This is the effective maximum range of theaircraft. In practice, an aircraft could fly further without more fuel by reducingits payload since a lighter aircraft consumes less fuel per hour. This is why thepayload line at maximum range is not exactly vertical but very steeply sloping. Theshape of each aircraft’s payload range’ line is different, since aircraft have beendesigned to satisfy particular market needs.
Aircraft size, speed and range together determine an aircraft’s productivitycurve and hence its unit costs. The relationships are illustrated in Figure 6.5.Hourly productivity is the product of aircraft size and speed. As sector lengthincreases, average aircraft speed rises. This is because aircraft speed is calculatedon the basis of the block time for a journey. Block time is from engines on toengines off. It therefore includes an amount of dead time on the ground. Groundtime will vary with runway, taxiway and apron layout at each airport and withthe number of aircraft movements during a given period. On departure at a verybusy international airport such as London-Heathrow or Frankfurt, aircraft mayspend up to 20 minutes from engine start-up to lift-off. This may be spent onbeing pulled out from the stand, disconnecting from the ground tractor unit;awaiting further clearance from ground traffic control; taxiing to the end of thetake-off runway, which may be some minutes from the stand; perhaps waiting ina queue of aircraft for clearance to taxi onto the runway and take off. On landing,the ground time is usually less, though at peak periods an aircraft may have towait for a taxiway to be clear or even for a departing aircraft to vacate a stand.The total ground manoeuvre time at both ends of a flight may amount to 20 or 30minutes at large and busy airports and will rarely be less than 15 minutes on anyinternational air services. When airborne, the aircraft may have to circle theairport of departure and it will then climb to its cruise altitude. The climb anddescent speeds are relatively slow, especially if based on the horizontal distancetravelled. On short sectors an aircraft may spend most of its airborne time ineither climb or descent, that is, at slow speeds, and may fly at its higher cruisingspeed and altitude for only a few minutes. As the stage distance increases, moreand more time is spent at the cruising speed and the ground manoeuvre, climband descent phases become a smaller proportion of block time. Average blockspeed therefore increases.
140 DETERMINANTS OF AIRLINE COSTS

Figure 6.5 Payload-range, productivity and cost relationships
(a) Payload-range
(b) Hourly productivity
(c) Unit costs
FLYING OFF COURSE 141

At first the payload capacity is constant. The increasing average speed ensuresthat hourly productivity rises (Figure 6.5b). It continues to rise until the range atmaximum payload is reached. For distances beyond this, payload falls and,though average speed may still be rising marginally, the net effect is that hourlyoutput falls.
Hourly productivity directly affects unit costs because all the costs which areconstant in hourly terms, such as flight crew costs or depreciation, are spreadover more units of output. Thus a unit cost curve can be derived from theproductivity-range curve showing how unit costs decline as range and hourlyproductivity increase (Figure 6.5c). Unit costs continue to decline until payloadhas to be sacrificed to fly further and hourly productivity begins to drop. Theunit cost curve is typically U-shaped. The precise level and shape of the costcurve will vary for each aircraft type depending on its size, speed and rangecharacteristics. For each aircraft type it is possible to identify a range of distanceover which its unit costs are uniformly low. This might be considered theoptimum cost range for that aircraft.
The preceding discussion has assumed that total costs per hour are constantirrespective of sector length. Section 6.5.1 below on the effect of stage length oncosts will indicate that costs decrease relatively with distance. This reinforces theeffect of increasing hourly productivity. More of this later.
6.4.4ENGINE PERFORMANCE
A key characteristic of any aircraft type is the engine it uses. Increasingly, thesame engines or engines with similar thrust made by different manufacturers arebeing used by broadly similar types of aircraft. This is because there are onlythree major manufacturers of civil jet engines in the western world andcompetition to get their engines into the same aircraft drives them to producesimilar products. This should not obscure the fact that even similar engines mayhave different fuel consumption. The earlier Boeing 747s were powered by thePratt and Whitney JT9D–7A engines. Later versions of the same engine on thesame aircraft were more fuel efficient. This is why late in 1979 SingaporeAirlines (SIA), which had been operating Boeing 747s with the 7A engine, beganthe gradual introduction into its fleet of 12 Boeing 747s powered by the JT9D–7Q engine. These engines had lower maintenance costs than the 7As and wereexpected to offer a 2–3 per cent better fuel consumption. By 1981/2 SIA’s fuelcosts were 32 per cent of their total cost; thus a 3 per cent saving in fuelconsumption would represent a saving of almost 1 per cent in total costs. Atabout the same time, Qantas was introducing newer 747s into its own fleet butwith Rolls-Royce RB211 engines. It found that the Rolls-Royce engines weresaving 5–7 per cent on fuel compared with the older Pratt and Whitney engines,but there was a weight penalty because the new engines were heavier. It is clearfrom these two examples that the type of engines in an airline’s fleet and in
142 DETERMINANTS OF AIRLINE COSTS

particular whether they are new or old versions of the engine type may influenceoperating costs. Subsequently Boeing claimed that third-generation engines suchas the Pratt and Whitney JT9D–7R4 or the RB211–524G together with otherrefinements on their 747 aircraft would reduce fuel burn per seat by 26 per centcompared with early models of the same aircraft (Flight International, 15October 1983). In assessing the costs of different airlines, one needs to considerthe impact not only of the aircraft type being used but also the version of enginewhich powers it.
There can be little doubt that the type of aircraft operated has a significanteffect on cost levels. With this in mind the key question is how far an airline hasthe freedom to choose any aircraft type it wishes or how far the choice isconstrained by the sector lengths and the traffic densities on the routes concerned,or other factors. The choice of aircraft occurs in two stages and managementinfluence is critical only in the second. The first stage is shortlisting the possibleaircraft types for a given operation. As previously emphasized, an internationalairline’s route structure and demand pattern are dependent on its geographicallocation and on economic and political factors largely beyond its control. Theroute structure, the airports used and the traffic density on those routes willbroadly delimit the type of aircraft needed. For particular parts of its network, thesector lengths and traffic densities taken together will reduce the options open tothe airline to perhaps only two or three aircraft types. In some cases only onetype may fit the requirements. In 1990 airlines operating relatively long-haulroutes of say about 4,000 km but with traffic flows that were too thin to support a400-seater Boeing 747 would have been looking for a 200–250-seater twin-jet.Given these market constraints, the choice would probably have been between anAirbus A310 or a Boeing 767. At another level, an airline planning to operateinternational charters into the Aegean islands of Greece, such as Myconos, canuse only Boeing 737 or MD 80 series aircraft because of runway limitations. Inboth these examples it is a combination of external factors that produces theshortlist of possible aircraft. It is only when one moves to the second stage, thatof choosing between the shortlisted aircraft, that the role of managementbecomes critical. Management has to make several key and related decisions. Itmust not only choose the aircraft which best meets its airline’s needs andobjectives, but it must also choose the number of aircraft and optimize the mix ofaircraft in the fleet. Management must also decide on the engines which willpower its aircraft, if more than one engine type is available. All these decisions willeventually affect the airline’s cost levels.
Once an airline has made its choice and invested in particular aircraft types forvarious parts of its network, then those aircraft types have to be considered asgiven. They cannot be changed from year to year. Because of investment inflight crew training, maintenance and ground facilities, aircraft types are unlikelyto be changed except after several years. Once aircraft have been introduced intoan airline’s operation, the most significant factor which will then affect their
FLYING OFF COURSE 143

costs of operation, other than the level of input costs, is the route structure onwhich they will be operated.
6.5Pattern of operations
6.5.1STAGE LENGTH
Several aspects of an airline’s operating pattern may influence its costs but themost critical is the stage lengths over which it is operating its aircraft. Theaverage stage lengths will vary within an airline by aircraft type, since it is likelythat different aircraft will have been chosen for different types of routes withinthe total network. For each aircraft type, nevertheless, the longer the stage lengthwhich can be flown the lower will be the direct operating costs per unit. This isso until sectors get so long that payload has to be sacrificed.
The rapid decline of unit costs as stage distance increases is a fundamentalcharacteristic of airline economics. A number of factors help to explain thisrelationship. One of these, the effect of stage length on block speed, has alreadybeen discussed in the previous section. It was pointed out that ground manoeuvretime and the relatively slow climb and descent phases of a flight become adecreasing proportion of the total block time as stage length increases.Consequently, the average block speed increases. In turn, the hourly productivityin terms of tonne-kilometres or seat-kilometres also rises. Fixed costs, bothdirect and indirect, are spread over more units of output and therefore the totaloperating cost per unit goes down.
The same considerations which affect block speed also influence block fuel.During ground manoeuvre time on departure or arrival aircraft are burning fuel.In 20–30 minutes on the ground they can burn a considerable amount of it.During climb and to a lesser extent during the descent phase, fuel consumption isrelatively high in relation to the horizontal distance travelled. Conversely, fuelconsumption is least at higher altitudes and in the cruise mode. Groundmanoeuvre and climb and descent fuel becomes a decreasing proportion of totalfuel burn as stage distance increases. The net result is that fuel consumption doesnot increase in proportion to distance. Thus if an Airbus A310 or a Boeing 767doubles its stage distance from, say, 500km to 1,000 km the fuel burnt will notdouble. Depending on the particular circumstances of the route, the fuelconsumed will increase by only about 60–70 per cent. Looking at an actualexample, it can be seen that in 1990 the Airbus A320–200 on London—Pariswith a full passenger load and no cargo would have consumed about 1,700 kg offuel. Flying to Geneva, whose distance from London is 118 per cent greater, theAirbus would have burnt about 2,800 kg, an increase of only 65 per cent. As aresult, the fuel burned per km and the fuel cost per km would have dropped by 25
144 DETERMINANTS OF AIRLINE COSTS

per cent (Figure 6.6). This is a major saving, given that fuel may be a significantproportion of total costs. On longer sectors beyond 2,500 km the fuel savingsfrom additional sector distance become marginal.
Stage length influences aircraft and crew utilization and this too impacts oncosts. An aircraft is a very expensive piece of capital equipment. It is earningrevenue and paying back its high initial cost only when it is flying. The moreflying it does, the lower become its hourly costs. This is because the standingannual charges, notably depreciation and insurance, can be spread over a greaternumber of productive hours. It is much easier to keep aircraft in the air if stagelengths are longer. On short sectors such as London-Paris or Singapore-KualaLumpur, where aircraft have to land after every 40–45 minutes of flight and thenspend up to an hour on the ground, achieving more than 5 or 6 block hours perday with an aircraft becomes very difficult. Higher utilization requires either areduction in the aircraft turn-round time so as to carry out more flights within theoperating day, or an extension of the operating day by scheduling very earlymorning or late evening departures. Charter airlines in Europe achieve very highutilization on relatively short sectors by extending the operating day.
Figure 6.6 Impact of sector distance on fuel burn: Airbus A320–200 on routes fromLondon
Note: Fuel burn is average of outward and return trips based on 65% load factor.
Source: Airbus Industrie.
FLYING OFF COURSE 145

Conversely, when one looks at longer sectors involving, say, 5 block hours, anaircraft can fly out and back and with just two flight sectors achieve a dailyutilization of 10 block hours while spending only a couple of hours or so on theground. The close relationship between stage length and aircraft utilization canbe seen by examining British Airway’s Lockheed Tristars in 1988. The 200series aircraft flown on long-haul routes and with an average stage length of 3,245 km achieved a daily utilization of 11.2 hours. Yet the 100 series aircraftbeing flown on European sectors of 1,640 km could achieve an average of only 8.1 block hours per day, equivalent to about 1,100 hours per year less than the 200series aircraft.
Flight and cabin crew, like aircraft, are a valuable and costly resource. A highproportion of crew costs are fixed and do not vary in the short term. The moreflying that crews can actually do, the lower will be the crew costs per block hour.On short sectors, crews spend relatively more of their time on the ground. On 1–hour sectors, crews may actually be flying for only 4–6 hours during a 12–14hour duty period. As stage lengths increase, they should be able to spend more oftheir duty period actually flying.
A more obvious implication of short stages is that airport charges and stationcosts are incurred more frequently than on longer stages. Their impact on totalcosts is therefore greater. One can see this when examining the cost structure ofshort-haul airlines, whether international or domestic. In 1988, landing and otherairport charges represented about 3.7 per cent of scheduled airlines costs worldwide. For short-haul operators the figure was much higher. For the small Britishcarrier British Midland, with an average sector length of only 421 km, airportcharges came to a staggering 15.7 per cent of their total costs. While for Finnair,with an average stage length of 831 km, the figure was 11.3 per cent (ICAO,1988a).
Some elements of maintenance expenditure are also related to stage length. Thisis because certain maintenance checks and spare parts replacement schedules arerelated to the number of flight cycles, that is, take-offs and landings. These occurless frequently as stage length increases. The most obvious part of the aircraftwhose maintenance is related to the number of flight cycles is the undercarriage,though there are others too.
All the above factors reinforce the cost-range relationship, based on aircraftproductivity, discussed in the preceding section. Together, they result in atypically U-shaped cost curve for every aircraft type. Unit costs fall rapidly atfirst as stage length increases, then gradually flatten out until they rise sharply aspayload restrictions begin to push up costs. A cost curve based on a 1990 route-costing study of the Airbus A320 is shown in Figure 6.7. The A320 study andother similar analyses indicate that the most significant economies with respectto distance occur by increasing stage lengths at the short to medium range. Theimplication for airlines is clear. They must avoid short sectors, because theyimpose much higher costs, and should try to operate each aircraft at or near thestage distances where costs are at their lowest.
146 DETERMINANTS OF AIRLINE COSTS

In so far as larger aircraft tend to be used on longer stages, the twin effects ofaircraft size and stage length frequently reinforce each other. The result is thatoperating costs on long sectors flown by large wide-bodied aircraft may be aslow as 20–40 per cent of the costs on short-haul sectors flown by smalleraircraft. This is vividly illustrated by comparing two new-generation Airbusaircraft on routes out of London, the 150-seater short-medium-range A320 andthe much larger 300-seater long-haul A340 (Figure 6.8). The larger aircraft’sdirect operating costs on long sectors are only 40 per cent of those of the smalleraircraft on London-Paris. The unit cost discrepancy would be even greater if anolder generation aircraft was being used on the shorter sectors.
Airlines operating primarily large aircraft over long sectors will always appearto have lower unit operating costs than airlines flying smaller aircraft ondomestic and shorter-haul international services. But their lower costs will beprimarily a function of aircraft size and sector distance rather than bettermanagerial efficiency! It is no coincidence that the three airlines with the lowestunit costs in Table 6.1 above—namely Singapore Airlines, Cathay Pacific andAir India —operate very large aircraft over average sector distances which arewell above the average for the 18 airlines in the group. The only other airlineswhich are comparable to these three in terms of aircraft size and sector distancesare Qantas and Japan Airlines but these are penalized by high labour costs,especially in the case of JAL.
Figure 6.7 Impact of sector distance on unit costs: Airbus A320 on routes from London
Source: Airbus Industrie.
FLYING OFF COURSE 147

6.5.2FREQUENCY OF SERVICES
High frequencies provide airlines with greater flexibility in schedules planning,thereby enabling them to increase aircraft and crew utilization. The availabilityof further schedules to be operated whenever an aircraft and crew return to basemakes it much easier to keep them flying throughout the operating day. Airlinesoperating low frequencies face the problem of what to do with their aircraft whenthey have completed their first round trip. On long-haul routes, high frequenciesalso enable airlines to reduce the length and cost of crew stopovers. Conversely,low frequencies prove costly. Malaysia Airlines’ European services early in 1984provide a good example. Of the four weekly flights between Kuala Lumpur andEurope, two stopped in Kuwait and two in Dubai. Crews were changed in bothplaces on both outward and return flights. The split operations in the Middle Eastmeant that at both Kuwait and Dubai there were at all times two crews stoppingover for three or four nights waiting to take over the next flight. In October 1984all four flights were scheduled through Dubai and the Kuwait station was closed.
Figure 6.8 Impact of sector distance and aircraft size on unit costs: Airbus A320 andA340–300 on routes from London
Note: The A320 is a 150-sealer twin-jet; the A340–300 is four-engined and here operatedwith 295 seats The A320 is operated on short sectors, the A340–300 on long sectors.
Source: Airbus Industrie.
148 DETERMINANTS OF AIRLINE COSTS

As a result the airline saved about $1.5 million per annum. Among other economiesit was able to cut its cabin crew numbers by about 50.
Despite this experience, Malaysia Airlines in 1988 operated three flights aweek between Kuala Lumpur and Los Angeles via Tokyo, one of which was aDC-10 and two were Boeing 747s. This was a very expensive mix since flightcrew, that is pilots, were not interchangeable between the two aircraft types. As aresult, the weekly DC-10 had a crew change en route at Honolulu. That completecrew had to wait a week in Honolulu to fly the following week’s service on toLos Angeles. Another week’s stop-over was necessary in Los Angeles togetherwith a further week in Honolulu on the way back. While cabin crew could beswitched to the Boeing 747 aircraft at Los Angeles, the flight crew could not.The latter would have been away from base for three weeks, with all theattendant expenses, but would have flown only four sectors. This low-frequencyDC-10 service was very costly and inefficient in its use of human resources. Itwas discontinued in 1990.
6.5.3LENGTH OF PASSENGER HAUL
Many costs associated with sales, ticketing and the handling of passengers arerelated to the number of passengers rather than to the distance that eachpassenger travels with the airline on a particular journey. This is true with costsof reservation, of ticketing and of the handling of both passengers and theirbaggage. It is also frequently true of airport passenger charges when paid byairlines. In other words, a passenger who buys a single ticket and travels 3,000km on an airline network will cost the airline less than three separate passengerseach travelling 1,000 km. In the latter case, each of the three will impose theirown ticketing and handling costs and the airline may have to pay a separateairport charge for each. From the cost point of view, an airline is better offcarrying fewer passengers travelling long distances rather than many morepassengers on short journeys. Although the shorter-haul passengers may producehigher yields and generate more income because of the way fares are structured(see Chapter 11), purely in cost terms the long-haul passenger is to be preferred.What is surprising is how the average length of passenger haul varies betweenairlines operating what outwardly appear to be very similar types of networks.This point is illustrated by reference to four airlines whose internationaloperations have common features. These are a strong regional network coveringEast Asia and Australasia, one or more routes to Europe together with atranspacific route as well. In 1988, the average length of haul for internationalpassengers varied widely from 6,650 km for Qantas and 5,190 km for JAL to 4,640 km for SIA and 3,690 km for Thai International. Qantas is in a particularlyfavoured position.
An international airline’s stage lengths are broadly influenced by itsgeographical location and the patterns of demand it is trying to meet. Demand
FLYING OFF COURSE 149

patterns, together with bilateral air services agreements or inter-airlineagreements, influence or even determine the frequencies to be operated. Incountries such as the United States, Canada, United Kingdom or France wheremore than one national carrier operates international services, the country’s ownlicensing or regulatory controls may influence the sectors on which their airlinesoperate. While a number of external factors influence both stage lengths andoften frequencies, an airline has some scope to try to reduce or cut out its shortsectors and to try to increase its frequencies by changes in operating pattern orroute structure. Because changes in stage lengths or frequencies tend to bepiecemeal and gradual, it takes time before they have any effect on an airline’soverall costs. Nevertheless there is some scope here for management action.
6.5.4AIRLINE AND FLEET SIZE
Early study of airline economics, particularly in relation to US airlines, hadsuggested that there might be significant economies of scale, particularly at thelower end of the size scale (Wheatcroft, 1956). Such economies were expected toarise through the ability of larger carriers to gain the benefits of bulk buying andof spreading contingency provisions over more units of output. Large carrierswould also benefit from their ability themselves to undertake discrete activitiessuch as certain maintenance checks or computerized reservation systems forwhich a minimum scale of operations was necessary. Increasingly the view thatthere are economies of scale in airline operations began to be questioned. In 1969the Edwards Committee (HMSO, 1969) concluded that an analysis of USdomestic airline results suggested that the advantages of scale as such might beexaggerated. Quality of management, the Committee believed, might be moresignificant in determining airline costs than factors related to size of output. AnAmerican study by Straszheim (1969) came broadly to the same conclusions. Itfound that direct operating costs declined sharply as airline size increased butthis was not due to any scale effect. Smaller firms reported higher direct costsbecause they flew thinner routes using smaller aircraft over short stage lengths.Subsequent studies both in the United States (for example, White 1979) andelsewhere have also failed to establish any economies of scale in airlineoperations. These findings were confirmed in practice following US domesticderegulation and liberalization on the North Atlantic. From 1978 onwards manysmall carriers entered new markets and were able to be price competitive againstvery much larger and well-established airlines.
The airline industry appears to be characterized by constant returns to scale. Inother words, there are no marked cost economies of scale. Such a conclusion hasimportant implications for regulatory policy. It means that, in the absence ofentry or capacity controls, new small carriers should be in a position to enterexisting markets and to be cost competitive with established carriers. Theeconomics of the airline industry indicate a natural tendency towards competition
150 DETERMINANTS OF AIRLINE COSTS
rather than monopoly. In practice in international air transport, that tendency isdistorted by bilateral agreements, by state involvement in aviation and by otherconstraints discussed in earlier chapters on regulation. Moreover, post-deregulation experience in the United States and the emergence of so-calledmega carriers suggest that, while there may be no cost advantages of larger size,the larger airlines with a wide marketing spread enjoy distinct scale benefits interms of marketing (see section 4.4.1). Thus new smaller entrants into anestablished market may be competitive in terms of costs but may not becompetitive in their marketing because of the small scale of their operations.This reinforces the tendency towards oligopolistic rather than perfectcompetition.
If there are no economies of scale, what about the related question of fleetsize? The Edwards Committee was impressed by the evidence that there areeconomies from increasing the scale of operations of a standard fleet of the sameaircraft type. The Committee estimated that the hourly direct operating costs ofoperating five aircraft of one type would be about 5 per cent higher than those ofan airline operating 15 of the same aircraft type (HMSO, 1969). Varied stagelengths and differing traffic densities impose the need on many airlines to havequite mixed fleets. This in turn means that some airlines, especially smaller ThirdWorld airlines like Zambia Airways or Air Tanzania, may operate only two orthree aircraft of one type. When the number of aircraft in a fleet of one type is sosmall there are likely to be higher costs. The cost of spares holding will be highersince the spares holding expressed as a proportion of the purchase price of theaircraft goes up as the number of aircraft purchased drops below a certain level.Flight crew training and engineering training costs have to be spread over feweraircraft and are therefore higher. Maintenance costs would be particularly highfor small fleets if engines or aircraft have to be sent elsewhere for majoroverhauls. The small numbers may preclude the installation of more advancedlocal maintenance facilities. Sets of flight crews per aircraft may be higher for verysmall mixed fleets because of the inability in emergencies to switch crewsbetween aircraft if they are of different types. Pilots are certificated for only oneaircraft type at a time. All these considerations mean that an airline, such asKenya Airways, with a small but mixed fleet, has a cost disadvantage. In 1988,Kenya Airways operated 12 aircraft of seven different types. In contrast, Qantasoperated 36 aircraft of two types, Boeing 767s and Boeing 747s. Though theywere different variants, in some cases with different engines, the degree ofcommonality of spare parts, maintenance procedures and flight crews must haveproduced significant economies.
FLYING OFF COURSE 151

6.6Marketing policy
6.6.1PRODUCT QUALITY
Airlines have to decide on the nature and quality of the product they are going tooffer in the various freight and passenger markets that they serve. They do nothave an entirely free hand. For commercial and competitive reasons they mayhave to conform to certain minimum standards of product quality. This isparticularly so if they are IATA members and operating on routes where IATAconditions of service still apply, though such routes are now few in number.They must also conform to a variety of international or national safety andtechnical regulations. These affect many aspects of the cabin layout such as theseat pitch next to emergency exits, or the minimum number of cabin staff, and soon. Within these constraints, airlines enjoy considerable freedom to decide on thequality of the product they are going to offer and on the costs they are preparedto incur. The product standards may be different for the various markets servedby the airline and will be related to the stage length, to the timings of the servicesand above all to the degree and nature of competition from other carriers. Onroutes operated in a revenue pool with a high transfer limit, product competitionwill inevitably be less acute than on routes where airlines are involved in head-oncompetition.
Three aspects of cabin service standards are particularly important forpassenger services. Cabin layout and seating density are frequently the mostsignificant in terms of their impact on unit costs. Each aircraft type has amaximum design seating capacity based on an all-economy layout at a givenminimum seat pitch. The actual number of seats that an airline has in its ownaircraft of a particular type depends on several key decisions which the airlineitself takes. The distribution of space between fare classes, if there is more thanone, the seat pitch adopted for each class and the number of seats abreast are themore crucial determinants of seating capacity. The distribution of cabin spacebetween seating areas, galleys, toilets and storage is another factor. In certainwide-bodied aircraft extra space for seating can be provided by positioning one ormore of the galleys in the freight hold, though this is at the expense of freightcapacity. The fewer the number of seats on offer, the higher will be the cost perseat-kilometre, since the aircraft’s trip costs need to be divided among the fewerseat-kilometres generated.
The range of seating densities used by international airlines in two aircrafttypes is illustrated in Table 6.6. Some scheduled airlines as part of a superiorproduct strategy choose seating configurations which may result in a reduction inthe number of seats by a quarter or more compared with the seating capacityoffered by other carriers. The airline’s product may be improved but the costimplications are serious. For example, in 1988 the seat-kilometre costs of
152 DETERMINANTS OF AIRLINE COSTS

Swissair with only 221 seats in its DC-10–30 aircraft were 41 per cent higherthan they would have been if it had adopted Korean’s 312-seat layout. Theimpact of different scheduled seating densities on costs is normally less markedthan that and involves unit cost variations of up to 15 per
Table 6.6 Impact of seating densities, 1988
Airbus A300 B DC-10–30
Airline No. of seats Cost perseata
Airline No. of seats Cost perseata
Scheduled airlines:Air France 281–291 100 Korean 312 100Iran Air 270 108 Malaysian 291 107Olympic 262 111 United 285 109Iberia 251 116 Aeromexico 280 111PAL 246 118 KLM 248 126Air India 238 122 Zambian 236 132Varig 234 124 Swissair 221 141Charter airlines:Hapag Lloyd 315 92 Balair 345 90Orion 328 89 Martinair 376 83Dan Air 336 87 World 380 82Note:a Indexed to 100 for airline having most seats and assuming airlines have similar
operating costs for each aircraft type. Index shows impact of higher seatingdensities.
Source: Compiled by author from ICAO data.
cent. The economics of charter operations, as discussed in the following chapter,require high seating densities. It is for this reason that the charter airlines shownin Table 6.6 push their seating densities way above those found acceptable forscheduled services, with a concomitant reduction of seat-kilometre costs.
A second aspect of cabin service standards which has important costimplications is the number of cabin crew used. Safety regulations impose aminimum number for each aircraft type. It is up to each airline to decide howmany more than the minimum it wishes to use. On short- to medium-haul sectorswhere there is less time for meals and other in-flight services, cabin crewnumbers may be close to the minimum. On long-haul sectors, airlines have morescope to try to differentiate their product through their in-flight services, and oneaspect of this may be more cabin staff. In 1989 Singapore Airlines was flying itsBoeing 747s with 19 cabin crew when the minimum required was 11. OtherSouth East Asian airlines had fewer cabin crew on their 747s—Cathay Pacifichad 18, while Thai International and Malaysian had 17; Philippine Airlines had
FLYING OFF COURSE 153

fewer, at only 15. When cabin crew wages are low by international standards,then the cost of improving the in-flight product by having more cabin staff is nothigh. This is the case with these Asian carriers (Table 6.2 above). Conversely itis costly for high-wage airlines to compete in terms of cabin staff numbers.
The third key element of cabin service standards is that of catering. As duringthe 1980s more and more airlines abandoned the IATA conditions of servicepertaining to particular routes and fare classes, so the scope for managementinitiative increased. Competitive pressures, however, have pushed most carriersmore or less to match what their competitors are doing. For this reason, whilecatering costs may vary between airlines, they are unlikely to be important inexplaining differences in total unit costs between those airlines. The same is alsotrue of the minor elements of cabin service such as newspapers and journals,give-aways, head sets, the showing of films, and so on.
There is also scope for product differentiation on the ground. Airlines canoperate and pay for more check-in desks to speed up check-in and they may alsodecide to provide more ground staff for passenger handling and assistance ingeneral. Some international airlines go further and provide sometimes quiteluxurious and costly first-or even business-class lounges at airports, while theircompetitors may provide neither. An example is Singapore Airlines, which hasdecided, as a matter of product policy, to provide its own exclusive first/business-class lounges at all the airports it serves irrespective of the frequency of itsservices or the number of first- or business-class passengers handled. In this wayit imprints its own brand and product style on the lounges. To save costs someother carriers share executive lounges with one or more different airlines.
It is difficult to assess the impact of product quality decisions of differentairlines on their comparative costs because of the paucity of reliable data. Oneway of doing this, however, is to establish the expenditure on passenger servicesper 100 passenger-kilometres of traffic carried. Passenger services expenditure,according to the ICAO statistics, covers the costs of cabin crews and passengerservice personnel as well as passenger-related costs such as in-flight catering andhotel accommodation. By expressing such expenditure per 100 passenger-kilometres rather than per passenger, one can partially adjust for the fact thatthere will be quite different passenger hauls on the airlines selected. The relativepassenger services expenditure levels for our selected carriers are shown inTable 6.7. The implication of Table 6.7 is that European airlines spend more onproduct quality than their North American or Asian counterparts, in many casestwo or three times more; yet many Asian carriers, because of their lower wagerates, may be providing more cabin crew and ultimately a better cabin service.
6.6.2SALES AND PROMOTION ACTIVITY
Airlines enjoy considerable discretion in the way they organize and run theirsales and promotion activities. They decide on the extent to which they should sell
154 DETERMINANTS OF AIRLINE COSTS

their services through their own sales outlets rather than through other airlines oragents. Such decisions have cost implications. Although setting up and operatingits own sales outlets cost money, the airline saves the commissions it wouldotherwise have to pay agents. An important decision in this respect is whether aninternational airline should set up off-line sales outlets, that is, outlets in cities orcountries to which it does not fly. Equally crucial may be the decision onwhether it should itself staff and operate sales offices at some of its less importantoverseas destinations or whether to appoint a general sales agent, who may ormay not be another airline.
Table 6.7 Passenger services expenditure, 1988 (US¢ per 100 scheduled passenger-km)
Rank North AmericanAirline
US¢ European Airline US¢ Asian/AustralasianAirline
US¢
1 Swissair 2672 Lufthansa (1987) 2023 JAL 1664 British Airways 1665 Air France 1626 Alitalia 1507 Air Canada 1218 KLM 1159 Qantas 10110 SIA 9911 Pan Am 9712 Air India 9313 American 8714 Cathay Pacific 8415 United 8216 TWA 7917 Northwest 7618 Thai International 73Source: Compiled by author from ICAO data.
Having taken these decisions on whether to provide its own sales outlets, anairline has to decide on their location and size within each city. If opening a salesoutlet in London, does it insist on its being with many of the other airlines in asmall area bordered by Bond Street, Piccadilly or Regent Street, one of the mostexpensive shop locations in the world, or does it follow Philippine Airlines andAir Algerie and choose a less expensive location in central London butsomewhat away from the other airlines?
It is open to airlines to decide themselves how much to spend on advertisingand promoting their services and how to spend it. Numerous promotion channels
FLYING OFF COURSE 155

are open to them from television, radio or national press advertising aimed atlarge numbers of potential customers at one end to promotional activities or tradepress advertising involving relatively small numbers of freight and travel agentsor travel journalists at the other. Many airlines target an advertising andpromotional budget equivalent to about 2 per cent of their revenue, but they mayspend much more than this in particular markets, especially when they arelaunching a new service.
Different management attitudes towards advertising can be seen in Table 6.8,which shows advertising expenditure in the UK press, radio and television of allthe East Asian airlines in the year to March 1990. All Nippon Airways was thebiggest spender by far, as it had launched its London service only in 1989 andwas trying to establish its name in the UK market. Of the established carriers,Cathay Pacific and SIA spent much more per flight than any of the others,though Malaysian was not far behind. Because of their high advertising spendingand excellent in-flight service, Cathay and SIA were getting particularly highloads in first and business class. Other airlines, such as Thai International,Philippine Airlines, Korean and Japan Airlines, spent very little in relation to thenumber of weekly services they operated. This was purely a managementdecision.
Table 6.8 Advertising expenditure of East Asian airlines in the UK, year to 31 March1990
Airline Total advertisingexpenditure £’000
UK flights per week Annual expenditureper flight £’000
Cathay Pacific 2,870 14 205All Nippon Airways 1,715 4 429SIA 1,370 9 152Qantas 1,055 14 75Malaysia Airlines 630 6 105JAL 370 13 28Thai International 300 6 50Garuda 250 3 84PAL 145 3 48Korean 65 2 33Source: Compiled by author from various sources.
Ticketing, sales and promotion represent almost 18 per cent of total operatingcosts of scheduled airlines of ICAO number states (ICAO, 1990). As such, it isclearly a major item of expenditure, yet one which very much depends on thepolicies adopted by individual airlines. While most of the major internationalairlines spend around 17–18 per cent of their total expenditure on ticketing, salesand promotion, some spend much more (Table 6.9). SIA and Qantas both spend
156 DETERMINANTS OF AIRLINE COSTS

over 25 per cent of their expenditure in this area. While some North Americanairlines also have relatively high expenditures on sales and promotion, Europeancarriers as a group appear to spend less. In the case of Northwest, United orAmerican, high sales costs may well be due to the fact that a large part of theiroperations are domestic and in recent years, as a result of US deregulation, travelagents’ commission rates in the United States have reached very high levels. Attimes and in certain areas US travel agents can command up to 20 per centcommission. This then becomes a major externally determined cost. In general,however, both product quality and sales and promotion activity are key elementsof airline marketing policy where management decisions have a direct impact oncosts.
Table 6.9 Ticketing, sales and promotion expenditure as a percentage of total operatingcosts, 1988
Rank North AmericanAirline
% European Airline % Asian/PacificAirline
%
1 Qantas 30.62 SIA 24.53 Northwest 24.44 United 21.95 American 20.26 Swissair 19.57 Thai International 19.18 KLM 18.69 TWA 18.410 Air Canada 18.411 British Airways 18.312 Lufthansa 17.913 Air India 17.814 JAL 17.815 Air France 17.116 Alitalia 17.117 Pan Am 15.718 Cathay n.a.Source: ICAO (1988a).
FLYING OFF COURSE 157

6.7Financial policies
6.7.1DEPRECIATION POLICY
The hourly depreciation cost of an aircraft at a given price depends on the lengthof the depreciation period, the residual value of the aircraft at the end of thatperiod and the annual utilization of the aircraft. The annual utilization (that is,the block hours flown during the year) is dependent on the pattern of operations,on the stage lengths flown and on the scheduling efficiency of an airline’smanagement. The depreciation period adopted and the residual value assumedare determined by an airline’s financial policy. In many countries, legislation oraccounting convention may require the adoption of a particular depreciationpolicy or may impose certain minimum requirements. Most internationalairlines, however, have some flexibility in deciding on the effective commerciallife of their aircraft and their residual value at the end of that life. This flexibilityis important. If an airline can adopt the practice of depreciating its new wide-bodied aircraft over 16 years to a zero residual value, its hourly depreciationcosts (assuming the same annual utilization) will be less than half what theywould have been had it used a seven-year life for the aircraft with a 10 per centresidual value.
Both these depreciation policies are currently in use by different airlines andthey show the significant variations in depreciation costs that can result from theadoption of different policies. Since, on average, depreciation charges representaround 8 per cent of airlines’ total operating costs, then the depreciation policyadopted can influence total costs by as much as 3–4 per cent.
Having adopted a particular depreciation policy, airlines may subsequentlychange it in order to increase or reduce their costs. For many years SingaporeAirlines (SIA) had adopted a policy of using depreciation periods which wereexceptionally short by international airline standards. They estimated the life oftheir aircraft to be between five and six years with zero residual value. Thepurpose appears to have been to build up reserves from the depreciation chargesto finance the rapid renewal of the fleet and also to mask the large operatingprofits that were being made. When in 1979 the fortunes of the airline industrywere hit by the rise in the price of fuel, SIA promptly lengthened the life of itsaircraft to reduce its costs and thereby still managed to show a profit. Theprocess is clearly documented in Singapore Airlines’ annual report for 1979/80.It shows that in that year the airline made a profit on its airline operations of S$15.7 million. But the operational life of the airline’s aircraft was estimated to befive to eight years with appropriate residual values. In the previous years aircraftlives had been five to six years with nil residual values. The report states: ‘As aresult of the change in the estimated useful lives of the aircraft fleet thedepreciation charge for the year is reduced by Singapore $44.37 million.’ In
158 DETERMINANTS OF AIRLINE COSTS

other words, had the airline continued to use the depreciation policy adopted inprevious years, its costs would have been S$44.37 million higher and the airlineprofit of S$15.7 million would have been converted into a loss of S$28.7million! During the 1980s Singapore Airlines continued to use an eight-year lifefor its aircraft with appropriate residual values. This was still very shortcompared with most international airlines. It explains why SIA’s depreciationcosts per tonne-kilometre available were amongst the highest when comparedwith international airlines with roughly similar average stage lengths. Then inApril 1989 SIA again lengthened its depreciation period to 10 years with 20 percent residual value so as to be more in line with industry practice.
Other airlines have also changed their depreciation policies from time to time.Cathay Pacific, which had been depreciating its Boeing 747 aircraft over eightyears, switched to a 15-year period after 1980 and almost halved its depreciationcosts. In its 1981/2 accounts, British Airways threw in a massive provision of£208 million for accelerated depreciation of some of its aircraft and other assets.The result was substantially lower depreciation costs in subsequent years and amarked improvement in profitability.
6.7.2CURRENT OR HISTORIC COST ACCOUNTING
The theoretical justification for depreciation is that money set aside each year asdepreciation charges should be used to build up a reserve fund, from which newaircraft or equipment can be bought to replace existing aircraft when they areretired or sold off. A failure to cover depreciation charges out of revenue meansthat an airline is not generating enough revenue to renew its assets. Inevitably,however, new aircraft cost more than the aircraft being replaced, so there isnormally a shortfall between the funds set aside through depreciation based onthe historic cost of the aircraft and the capital required to finance the newpurchases. At times of relatively low inflation this shortfall was of manageableproportions and could be covered by raising loans. But the annual rates ofinflation in many industrialized countries began to accelerate in the early 1970sand reached abnormally high levels in the second half of the decade. As a result,the difference between the historic cost of aircraft and their replacement costbecame excessively large. A number of airlines began to consider whether theyshould depreciate their aircraft and other assets on the basis of their current costrather than on the basis of their historic cost.
Different methods can be used to calculate the current replacement cost of anasset or aircraft purchased some years ago, but they all involve inflating the historiccost through some price index such as the index of manufacturing costs oraircraft prices. By inflating the cost of assets to be used for depreciationpurposes, one of the effects of current or replacement cost accounting is toincrease depreciation charges and thereby an airline’s operating costs. In thefinancial year 1982/3 British Airways’ depreciation costs went up from £126
FLYING OFF COURSE 159

million on a historic cost basis to £209 million in current cost terms. In the early1980s a few airlines embraced current cost accounting, but the practice was thenlargely abandoned as inflation rates declined. The adoption or otherwise ofcurrent cost accounting is another aspect of financial policy which influencesairline costs.
Some airlines have adopted a compromise position of charging extradepreciation in addition to historic cost depreciation without formally adoptingcurrent cost accounting. This is done on an ad hoc and arbitrary basis. Forinstance, Swissair has often charged increased depreciation in years when profitsare high. It could also be argued that using relatively short asset lives, asSingapore Airlines does, has the same result as current cost accounting. Itaccelerates the accumulation of reserves needed to finance new aircraftpurchases.
An additional problem when considering depreciation costs is how to treataircraft which have been leased rather than purchased, since legally the airline isnot the owner. One approach is to differentiate between lease agreements thatgive the airline rights approximating to ownership, often involving the transfer ofownership at the end of the lease period (finance leases), and so-called operatingleases, which do not give such rights and are usually of shorter duration. In thecase of finance leases, the aircraft can be depreciated in the normal way so thatits depreciation cost appears under the airline’s direct operating costs in theprofit and loss account. While interest element in the lease payment is added tothe other interest payments in the airline’s accounts, the capital repaymentelement is not charged to the profit and loss account but is shown only as aliability. Conversely, annual lease payments on operating leases would appear asa flight operating cost and there would be no separate depreciation charge. Thisis the approach adopted by Singapore Airlines. It follows that the type of aircraftleases that an airline negotiates will affect the absolute and relative level of itsdepreciation costs.
6.7.3METHODS OF FINANCE
Interest charges on loans are considered within the airline industry as a non-operating item. As such they do not affect operating costs or the operatingresults. However, they do affect each airline’s overall profit or loss afterinclusion of interest and other non-operating items. The bulk of interest chargesrelates to loans raised to finance aircraft acquisitions, though some airlines mayalso be paying interest on bank overdrafts arising from cash flow problems orfrom the need to finance losses incurred in previous years. An airline can reduceor avoid interest charges by financing part or all of its aircraft purchasesinternally from self-generated funds. Self-financing is clearly cheaper thanborrowing, especially at a time when interest charges are high.
160 DETERMINANTS OF AIRLINE COSTS
High rates of interest, which in recent years have averaged around 7–9 percent but have been well over 10 per cent, have pushed annual interest charges tovery high levels. This is so even for airlines that have been able to self-financepart of their capital expenditure. Carriers such as Singapore Airlines which, as aresult of a policy of rapid depreciation previously referred to and high profits,built up sufficient reserves to be more than 70 per cent self-financing in mostyears, are relatively few.
Most airlines would prefer to be self-financing but may be unable to generatesufficient reserves from their depreciation charges and retained profits to do soexcept to a limited extent. Their remaining capital requirements can be met inone of two ways. First, there may be an injection of equity capital into theairline. The advantage of equity finance is that airlines pay interest on it only inthe form of dividends if they make a profit. Most international airlines outsidethe United States are government owned, but governments have been loath to putin more capital to finance aircraft purchases, especially as the sums involved arevery large. Private shareholders have also been hesitant because of the poorfinancial performance of the airline industry. If equity finance is unavailable,airlines must borrow in one form or another from commercial or governmentbanks. Several different forms of loan finance are available, but either directly orindirectly they all involve interest charges. This is true even of finance oroperating leases.
The growing reliance of national airlines on external finance rather than self-financing or equity capital, has pushed them into having very high debt/equityratios. In other words, too much of their capital is financed by loan capital andtoo little by equity. Many airlines have been under-capitalized and have neededan injection of capital if the interest burden was to be kept within manageableproportions and if they were to be in a position to order new aircraft withoutbankrupting themselves. Even Singapore Airlines, which had been able to self-finance so much of its investment, had a major injection of equity capital in 1981/2 of S$404 million (US$190m) from its then shareholders, the Singaporegovernment. As a result, in 1982/3 SIA’s debt/equity ratio was 46:54. It isgenerally believed that a debt/equity ratio of 25:75 is desirable and that a ratio ofup to 50:50 is acceptable. Given the very high cost of new aircraft, airlines canstay within acceptable limits only by injections of new capital. Mostgovernments have been loath to follow the example of Singapore and put moreequity capital into their airlines. Their airlines’ debt/equity ratios haveconsequently deteriorated. Many airlines around the world, especially indeveloping countries, have needed an injection of equity capital in order toreduce their interest charges and to be able to finance new aircraft.
Early in 1984 Malaysia Airlines was finalizing its five-year development plan.This required substantial investment in new aircraft. In the absence of additionalequity capital from the Malaysian government, the airlines would have to raisecommercial loans. But it was already heavily in debt and interest charges werelikely to be high, so it had to try and self-finance part of its capital needs. The
FLYING OFF COURSE 161

management estimated that to do this it needed to generate a profit of about US$30 million per annum. In 1982/3 its profit was only $3.4 million and, though in1982/4 it was about $40 million, the $30 million target could not be met everyyear. Without it, the airline’s development programme would be in jeopardy.This was why in 1984 it was decided to inject capital by privatizing the airline. Thisis the main reason why many other governments in the latter 1980s decided tosell off a major part of their state-owned airlines. However, it was difficult toattract private capital unless the airlines in question had a good profit record andwere not heavily indebted already. Companies like Philippine Airlines, which in1989 had large debts and minimal profits, could not easily be privatized.
As previously mentioned, an alternative solution for airlines with inadequatefinancial resources is to lease aircraft from specialist aircraft-leasing companies,like Guinness Peat Aviation, or bank consortia that provide the same service.This solution is particularly attractive for airlines that are too small to obtain thebest prices from the manufacturers or that are not themselves in a position to getany tax advantages from direct purchase. The leasing companies by doing bothcan provide aircraft which may be cheaper in real terms.
6.8The quality of management
The analysis so far indicates that the most important variables affecting airlinecosts are the level of input prices, the type and size of aircraft used and the stagelengths operated. In so far as the last two of these variables are themselvesinfluenced by the pattern and levels of demand that an airline is trying to satisfy,then demand may also be considered an important variable. Other, though lessimpor-tant, variables have been discussed. Many of these are particularly proneto management decision and choice. There is a further dimension ofmanagement whose importance may be absolutely crucial in establishing anairline’s unit cost levels, but may be difficult to define or measure. One mightbroadly define it as the quality of management and it permeates through to mostareas of an airline’s activities.
The quality of management affects the efficiency with which the managementof an airline brings together the various factors of production at its disposal inorder to meet different levels and types of demand in different markets. In theoryit is management ability or the lack of it which should explain cost differencesbetween airlines which cannot be attributed to variations in input costs, aircrafttypes operated, stage lengths or any of the other cost variables. Northwest bestillustrates the importance of management. Northwest is one of the lowest-costoperators of the airlines sampled, and its unit costs are lower than those of otherNorth American airlines (Table 6.1). Yet it appears to have no apparentadvantage in terms of the key cost variables. Its input costs are broadly similar tothose of other North American carriers, though its fuel costs are likely to belower than those of non-US airlines (Table 6.3). The wages it pays are similar to
162 DETERMINANTS OF AIRLINE COSTS

those of other US airlines and much higher than those of most Asian airlines. Itsaverage aircraft size in 1988 was less than half that of Cathay or SIA and smallerthan that of several other carriers. Its average stage length at 1,163 km wasshorter than that of most of the European and Asian carriers. Yet Northwestappears to be very efficient in its use of labour. Its output per employee is veryhigh and in terms of ATKs per $1,000 of labour cost it is among the highest ofthe non-Asian carriers (Figures 6.1 and 6.2). This efficiency in the use ofresources probably permeates other areas of activity too. North-west has alsomade marketing policy decisions which ensure that its passenger service costs per100 passenger-kilometres are among the lowest (Table 6.7), though it spends ahigh proportion of its total costs on ticketing, sales and promotion (Table 6.9). Itis policy decisions in this and other areas, together with the quality of itsmanagement, which enable Northwest to produce at lower unit costs than mostof the other airlines sampled.
In practice, no airline management is likely to be equally efficient orinefficient in all areas of management. It may well be efficient in one area, suchas flight crew scheduling, but relatively inefficient in the organization ofmaintenance procedures. Thus the total unit cost of an airline may mask widevariations of performance in discrete areas of activity such as flight operations ormaintenance management. Ideally, inter-airline comparisons should be on adisaggregate basis, looking at such discrete areas separately.
FLYING OFF COURSE 163

7The Economics of Passenger Charters
7.1The nature of non-scheduled passenger services
One of the enigmas of international air transport is the ability of charter airlinesto sell seats at one-half or even one-third of the price charged by their scheduledairline competitors and still make a profit. The fare advantage offered by charterscan be gauged by examining the London-Athens route during the peak summermonths of 1990 (Table 7.1). The cost of a charter round trip per passenger wasonly one-third of the scheduled excursion fare and around half of the advancedpurchase fare. The charter fare advantage was much less when compared withthe consolidation or group fares on scheduled services, which could be bought bytravel agents. However, it should be borne in mind that the number of seats onany scheduled flight available for consolidation or group fares is limited,especially during periods of peak demand when scheduled carriers have littledifficulty in filling seats at the higher fares. It is the charter airlines’ ability tooffer such low seat costs which has enabled them to capture around 45 per cent ofthe international passengers within the Europe-Mediterranean area and well overhalf the traffic in terms of passenger-kilometres (ICAO, 1990). Their penetrationof the North Atlantic market is lower, at around 7–8 per cent, but it was as highas 29 per cent in 1977 (Table 1.4 above). Passenger charters are important inthese two major international markets. Their impact in other markets has beenmore limited, though charters are significant on a few individual but smallerroutes such as Canada to the Caribbean.
The regulatory constraints on charter services, their early history andsubsequent development have been described earlier (sections 1.4, 2.7 and 3.2).This chapter examines how passenger charter airlines can achieve such low costsand fares while continuing to operate profitably. But first one needs to considerthe nature of non-scheduled operations.
The Chicago Convention in 1944 had asserted that non-scheduled flights werethose ‘not engaged in scheduled international air services’. But no attempt wasmade to define ‘scheduled’ until 1962 when

Table 7.1 Scheduled fares and charter costs London-Athens, summer 1990 (July–September)
Return fare£
Fare indexExcursion=100
Scheduled—publicly available:Club/Business class 560 155Eurobudget 442 123Excursion 360 100Advanced purchase (APEX)
Weekend 270 75Weekday 254 71
Super APEXWeekend 235 65Weekday 219 61
Scheduled—available to agents:Individual inclusive tour orconsolidation: British Airways 186 52
Olympic 179 50Charter—cost per passenger:Friday day flight 143 40Tuesday day flight 126 35Tuesday night flight 112 31Note: Charter cost assumes 85 per cent load factor on Boeing 737–300 and includes
airport taxes.Source: Author.
the Council of the International Civil Aviation Organization (ICAO) agreedthat a scheduled international air service is one ‘operated so as to serve trafficbetween the same two or more points either: (i) in accordance with a publishedtimetable, or (ii) with flights so regular or frequent that they constitute arecognisable systematic series’. Within a few years of this definition beingdrafted it was meaningless as the basis for any real distinction between scheduledand non-scheduled services. Many inclusive tour and affinity group charterswere being operated as a ‘recognisable systematic series’ of flights and, thoughthe timetables were not published by the charter airlines themselves, they were toall intents and purposes published by the tour operators and travel agents. Theformal distinction between the two types of services became increasingly blurred.
Two types of charter flights have emerged, namely ad hoc charters, that is,one-off flights where aircraft are chartered for a specific event such as a sportsfixture or a sales promotion, and ‘series charters’. The latter are chartersinvolving several flights which may be on behalf of tour operators, oilcompanies, the military or others requiring regular transfer of people. As
FLYING OFF COURSE 165
previously mentioned they normally have a set timetable and are operated as aregular series. In many European holiday markets they operate on routes wherethere are frequently no direct scheduled flights at all.
Traditionally, within the Europe-Mediterranean area, the vast majority ofpassenger charter flights are inclusive tour charters (ITCs.) These are where thewhole of an aircraft is chartered by one or more tour operators who combine theround-trip seats with hotel or other accommodation into ‘package’ holidays. Thepassenger buys the holiday package from a travel agent or tour operator at asingle price and is unaware of the cost of travel within that total price. Somecharter packages may involve minimal accommodation or may include car hire,boat hire or something else in addition to or instead of accommodation. Apartfrom ITCs there are some affinity group and student charters within Europe, andin one or two markets, such as UK-Switzerland, advanced booking charters areoperated. But these other forms of charters have been relatively limitedcompared with ITCs, which have dominated the market.
In recent years, however, the European charter market has been undergoingchange. First, there has been strong growth of self-catering inclusive tours, wherethe package does not include a hotel and meals but provides only foraccommodation in houses or apartments. By 1989 nearly one-third of the UKinclusive tour market went on self-catering packages. Secondly, tour operatorshave increasingly been selling seats on their chartered flights on a seat-onlybasis. It is logical for tour operators or airlines with empty seats on their hands totry to sell them at virtually any price. Seat-only tickets on charter flights aretherefore particularly cheap. In 1989 about 13 per cent of UK charter seat saleswere on a seat-only basis, though for some individual charter airlines seat-onlysales represented around 20 per cent of their capacity. As a result of the rapidgrowth of self-catering ITCs and seat-only sales, the traditional hotel-based ITCmarket had by 1989 declined to around 55 per cent of the UK charter business.
Advanced booking charters (ABCs) are relatively more important on NorthAtlantic routes, though their market share varies from route to route. ABC rulesrequire the prepurchase of tickets a minimum number of days prior to departureand that such tickets must be bought from licensed travel agents, not the airlinesthemselves. Following deregulation, the United States had espoused the conceptof ‘public charters’ with such minimal controls on seat access for charterspassengers that such charters would be difficult to differentiate from scheduledservices. Most European countries have not wished to go so far. Apart fromABCs, most of the remaining charters on the North Atlantic are inclusive tourcharters that operate very much as they do in Europe. Charter flows in othersmaller markets such as Europe to East Africa, to the Caribbean or to Thailandand from Canada to the Caribbean generally involve inclusive tours.
While a few charter airlines such as Martinair or LTU have always servedlong-haul markets, from the late 1970s onwards long-haul charters generallystagnated or declined in many markets, not just on the North Atlantic. Therewere several reasons for this. The relatively thin and highly seasonal demand
166 THE ECONOMICS OF PASSENGER CHARTERS

could not support the large wide-bodied aircraft which the charter airlines neededto operate once the older narrow-bodied Boeing 707s or DC-8s were no longercompetitive. Moreover, the scheduled airlines operating to tourist destinationsdeveloped group fares or individual advance purchase fares that were chartercompetitive. This made it difficult for charter airlines to get established on routeswhere there were scheduled services already. They did better in markets, such asthe Maldives or parts of the Caribbean, poorly serviced by scheduled flights.Lastly, many potential markets were closed to charter services because nationalgovernments were not keen to see their scheduled airlines undermined. Then inthe late 1980s the picture began to change. The introduction of smaller longer-haul twin-jets with low operating costs, such as the A310–300 or Boeing 767-ER,made long-haul charters more viable. Charter airlines operating long-haul flightscould ensure maximum utilization of the smaller aircraft by flying them onshorter sectors as well if needed. At the same time, there was renewed interestamong European leisure travellers in particular in long-haul destinations in SouthEast Asia, the Caribbean and North America. As a result of these paralleldevelopments, long-haul charters expanded rapidly from about 1987 onwards. Inthe United Kingdom, the largest single charter market, charter traffic declinedmarginally in 1988 and 1989 and more substantially in 1990. But in all threeyears long-haul charter traffic from the UK actually increased, notably toAustralasia, the Caribbean and North America. This strong growth trend in long-haul charter markets was expected to continue during the 1990s.
Inclusive tour charters are distinctive in that a passenger cannot, in theory, buyonly a seat on the flight but must buy a holiday package of some kind. But onecan also buy inclusive tours using scheduled services. The only major featurewhich distinguishes ITCs and other forms of charter services from scheduledflights is that the passenger cannot buy a seat or a package holiday directly fromthe airline as scheduled passengers can, but must do so through an intermediarysuch as a tour operator, travel agent, student union, and so on. This distinction,too, may be cosmetic rather than real, since in some cases the intermediaryselling agent may be a subsidiary company of the charter airline or even its parentcompany.
7.2The charter airlines
While many scheduled airlines operate charters, the international passengercharter market is dominated by specialist charter carriers which are either privatelyowned non-scheduled airlines or charter subsidiaries of scheduled airlines(Table 1.5 above). In 1988 these specialist charter carriers generated about 65per cent of the total international non-scheduled passenger-kilometres, with thebalance of 35 per cent being carried by the charter flights of scheduled carriers(ICAO, 1990). Several of the charter carriers are relatively large, with trafficlevels exceeding those of many national scheduled airlines. Their size and
FLYING OFF COURSE 167

importance can be gauged by the fact that the largest of them, Britannia Airways(UK), generates more passenger-kilometres on international services than any ofthe scheduled airlines of South America or Africa, more even than SAS or AirCanada. The non-scheduled carriers are equipped with large and modern fleets ofaircraft, usually bought new. By the beginning of 1990 Britannia Airwaysoperated a fleet of 40 Boeing 737 and Boeing 767 aircraft with an average age of9 years. Other charter airlines had even younger fleets. In the spring of 1990, AirEurope’s fleet had an average age of 2 years while the figure for Monarch was 2.3 years. By comparison many scheduled fleets were clearly middle-aged or old.The average age of British Airways’ fleet was 11.3 years, Air France’s was 12.6years and TWA’s 16.1 years (Burnell, 1990).
A particular feature of the European inclusive tour industry is the strongtendency towards vertical integration between tour operators and charter airlinesand in some cases with hotel groups as well. The largest non-scheduled carrier inthe world, Britannia Airways, is part of the Thomson organization, which alsoowns Thomson Travel, Britain’s largest tour operator, which also has interests ina number of hotels. Sterling, another of the larger charter airlines, is ownedwholly by Tjaereborg International Holdings, a leading Scandinavian travelagency and tour organizer. Many more instances of vertical integration can befound in the UK and elsewhere in Europe.
Another feature of non-scheduled airlines is that, as a group, their financialperformance has been better than that of scheduled carriers. They managed tocontinue making profits in the early 1980s at a time when many scheduledairlines were nosediving into deficit. In 1981, losses amongst the world’sscheduled airlines reached their peak. Member airlines of the International AirTransport Association (IATA) made a loss (after interest) of $1,900 million ontheir international services. In the United Kingdom all the larger scheduledairlines made losses too, even those operating charters in addition to theirscheduled services. Yet in that year all the British passenger charter airlinesshowed a profit except Dan Air.
In 1988, a relatively good year for scheduled airlines, the profitability of someof the larger European charter airlines (in terms of profit as a percentage ofrevenue) was better than or comparable to that of the more successful of the largeEuropean scheduled carriers and significantly better than the profit performanceof Alitalia or Lufthansa (Table 7.2). However, in recent years, the performanceof the charter industry has not been uniformly good. Two sectors of the industryhave faced serious problems. The first is the sector based in destination countries,notably Spain, which has by far the largest volume of incoming charter traffic.Many Spanish charter airlines have been set up, often with the participation orhelp of north European airlines or leisure companies, to try to capture some ofthis market. The proliferation of such carriers, which has pushed down charterrates, their relatively small size compared with their northern competitors and theabsence of a sufficiently large winter market have undermined the financialviability of many of them. Several, such as Hispania in 1989, have gone out of
168 THE ECONOMICS OF PASSENGER CHARTERS

business. More are certain to follow. The other problem area is that of some ofthe smaller charter airlines in the large charter markets such as Germany, Franceand more especially the United Kingdom. In the late 1980s, within a climate ofliberalization, many new charter airlines were established. The over-capacity in
Table 7.2 Profitability of selected European scheduled and non-scheduled airlines,financial year 1988
Airline Profit or loss (after interest etc.)a as % of revenue
Largest scheduled airlines:Air France +6.6British Airways +6.6KLM +6.0Swissair +0.4Alitalia −0.2Lufthansa −0.9Large non-scheduled airlines:Martinair +12.2Britannia +7.5Monarch +7.4Condor +3.8LTU +3.5Note:a Before taxes and excluding profits from sale of assets.Source: CAA (1990b); ICAO (1988a).
the market squeezed charter rates, and when charter traffic growth faltered in1988 and subsequent years the smaller charter airlines were particularly badlyaffected. In a 12-month period in 1988–9, three British charter airlines collapsedor went into receivership—the long-established British Island Airways, Novairand Paramount. Even Britannia, the largest and one of the most successful of thecharter carriers, was affected by the downturn in the market and in the spring of1990 announced a cutback in staff numbers.
Nevertheless, the larger non-scheduled airlines have generally shownthemselves more adept than many scheduled airlines at matching supply anddemand in a way which both generates profits for the producers and meetsconsumer needs. A key element in this matching process is the ability of charterairlines to produce at low unit costs.
FLYING OFF COURSE 169

7.3Non-scheduled cost advantages
7.3.1DIRECT OPERATING COSTS
In order to appreciate how non-scheduled operators can produce such relativelylow unit costs, one must examine separately each element of costs for a charterservice and compare it with the costs of a comparable scheduled service. Toeliminate the effect of differing aircraft types and stage lengths, any costcomparison must assume the use of similar aircraft on the same route. TheLondon-Greece route would be a suitable example, since Boeing 757 aircrafthave been used by both sectors of the industry on this route.
Flight operations are the largest single element of direct costs. Here, charteroperators may enjoy some limited advantages. While in the early days of charterservices flight crew salaries were lower than those in scheduled airlines, this isno longer the case amongst most airlines in the UK and other European countries.The pilots’ unions, helped by the worldwide shortage of pilots in the late 1980s,have ensured that salaries within each country are broadly comparable for pilotsflying the same aircraft type. Fuel costs are likely to be similar for both charterand scheduled carriers if flying the same aircraft on the same route and payingthe same price for fuel. The larger charter airlines should be able to negotiateequally favourable fuel prices at their home base because their uplift will be veryhigh. If, however, they have only a limited number of charter flights to aparticular destination, their fuel uplift at that destination may be rather limitedand they may be unable to negotiate as good a price as the scheduled carriers. Inthis case they may have a cost disadvantage. Insurance costs will be broadlysimilar for both types of operators, as will en route navigation charges. Charteroperators may, on the other hand, pay lower landing fees by using cheaper airports,especially in their home country. Scheduled services between London andGreece fly from Heathrow, but charter flights might use either Gatwick or Luton,which are also in the London area. In the summer of 1990 a scheduled Boeing757 flight at Heathrow with 150 passengers on board would have paid the airport£2,398, whereas the same aircraft with the same number of passengers on acharter flight from Luton would have paid £1,718 and at Gatwick £2,003. If thecharter flight flew from Gatwick after 1600 hours, which was an off-peak time,the airport charge dropped to only £342.
Maintenance costs for both charter and scheduled operations would be broadlysimilar if using the same aircraft on the same routes. Depreciation costs per hourwould also be the same if both charter and scheduled airlines achieved the sameutilization. In practice this is unlikely. First, aircraft used by the scheduledairlines will be used on different routes, many of which are, as previouslyexplained, relatively short. The need to use the London-Greece aircraft on othermuch shorter scheduled sectors inevitably reduces the annual utilization which
170 THE ECONOMICS OF PASSENGER CHARTERS
that aircraft could have achieved flying only on longer sectors such as London-Greece or London-Palma, which is what charter aircraft will be doing. Secondly,during the peak summer months the charter airlines will be flying their aircraftnight and day. Aircraft on scheduled short- to medium-haul routes have a limited14–16-hour operating day since scheduled passengers do not like departing muchbefore 0800 hours or arriving after 2200 hours. Scheduled short-haul aircraftfrequently spend the night hours on the ground. Not so charter aircraft. Charterpassengers seem prepared to put up with considerable inconvenience in order tofly cheaply. They will accept departures or arrivals at any time of the night, or atleast some of them will. As a result, except where constrained by night bans orlimits, charter airlines programme their aircraft to fly during night hours. Theyhave an effective 24-hour operating day during the peak months. They canusually get three daily rotations, that is, round trips, of the aircraft on a 2-hour orlonger sector, whereas a scheduled airline would plan for only two rotations. Onthe other hand, charter services have much more marked seasonal peaks andtroughs, so that in the off-peak winter months daily utilization of aircraft maydrop below that of scheduled aircraft. This is more than compensated for by thevery high peak utilization achieved by using the night hours. In addition, somecharter airlines are able to lease out aircraft during their own off-peak periods toairlines in other parts of the world that face peak demand at that time. ThusMonarch in the UK has often leased some of its aircraft in the past to Canadianairlines, which used them for winter charters to the Caribbean. Air Europe inBritain has leased some of its aircraft to its sister companies in Europe for wintercharter work. The net result is that European charter airlines achieve significantlyhigher aircraft utilization than their scheduled counterparts (Table 7.3).Monarch, for example, in 1989 got more than twice as many flying hours out ofits Boeing 757s than British Airways did. Higher aircraft utilization might alsoenable the charter airlines to achieve more flying hours per flight crew member.On long-haul air services, scheduled airlines are not so restricted by thecommercial need to avoid the night hours. Time zone changes make this difficultanyway. Consequently, on long-haul services, charter airlines rarely achievesignificantly higher aircraft utilization than scheduled airlines.
In terms of direct operating costs, a charter operator flying London-Greecemay obtain some cost advantage by paying lower airport charges and, byachieving higher daily utilization for its aircraft, it may also be able to reduce itshourly depreciation costs. Since airport charges and depreciation together mayaccount for 10–15 per cent of total costs, savings in this area would have only alimited effect on a charter airline’s total operating costs. Flight crew might alsobe more productive. Conversely, the charter airline may have to pay higherprices for fuel at airports where their total uplift is not very high. Overall acharter operator is likely to achieve only marginally lower direct operating costswhen competing with a scheduled carrier on a particular route and flying the sameaircraft. The differences in direct costs are likely to be no greater than mightexist between two scheduled airlines flying on that route.
FLYING OFF COURSE 171

7.3.2INDIRECT OPERATING COSTS
It is in the area of indirect operating costs that the costs of charter
Table 7.3 Aircraft utilization rates: UK scheduled and charter services, 1989
Airline Average daily utilization (hrs)
Boeing 737–200 Boeing 757
Mainly scheduled:British Airways 6.7 6.8Charter only:Air 2000 14.6Air Europe 10.7Britannia 10.1Monarch 12.2Source: CAA (1990b).
and scheduled services begin to diverge markedly. Charter airlines flying toGreece or elsewhere save money by subcontracting out most of the aircraft,passenger and baggage handling activities at their destination airports. This maybe expensive on a per flight basis, but it means that they avoid a heavy year-round commitment. The seasonal nature of their operations means that they haveno need for permanent staff or offices or other facilities at most of the outstationsthey serve. Even where they do need staff dedicated to their operations, they maybe in a better position to use seasonal staff. In contrast, British Airways or anyother scheduled airline with daily or more frequent flights to Greece will almostcertainly do most of its own handling. It will employ a station manager inAthens, together with assorted other station and handling staff. It will haveoffices at the airport and perhaps off the airport as well, with associated rents andother costs. It will have vehicles and perhaps aircraft steps, baggage trolleys andother equipment. While it might employ some seasonal staff, a scheduled airlinewould have high year-round costs in Athens. Charter carriers are thus likely tohave lower station and ground costs.
Charter airlines will also have lower expenditure on passenger services. Theywill try to have fewer cabin staff than a scheduled airline would have in the sameaircraft type, while providing the statutory minimum required for safety. Forexample, a British charter airline would normally have one cabin crew memberper 32 passengers on a Boeing 737–200 aircraft, compared with British Airwayswhich carries one cabin crew for every 21 passengers on the same aircraft.Moreover, a higher proportion of the cabin staff will be seasonally employed andwill not be a cost burden for the rest of the year. Some charter airlines employ asmuch as 50–60 per cent of their staff for a six-month peak season only. Byproviding relatively poorer and simpler in-flight meals they will reduce the costs
172 THE ECONOMICS OF PASSENGER CHARTERS

of in-flight catering. On long-haul charters, airlines will not normally haveinterlining passengers or passengers catching connecting flights the followingday for whom they have responsibility. They thereby escape the hotel, food,transport and other costs associated with such passengers which scheduledairlines have to meet.
The largest savings obtained by charter airlines arise in ticketing, sales andpromotion. Charter operations do not require large reservations computers orother expensive ticketing facilities, since the whole plane is chartered to one orperhaps a handful of agents or clubs, which then become responsible fordistributing the tickets and allocating the seats. The airline merely prints ticketsand hands over to the charterer a book for each flight chartered and has nofurther ticketing or reservation costs. Charterers then allocate the tickets as theyfeel best. In some cases the charterers print their own stock of tickets. A charterairline has minimal sales costs. Since it does not sell direct to the public, it has noretail sales offices or staff, nor does it pay commission to others for selling itstickets. Yet agents’ commission is an important cost for scheduled airlines. In thefinancial year 1988/9, commission paid (net of commission received) represented9.3 per cent of British Airways’ operating costs and 5.5 per cent of BritishMidland’s costs. A charter airline sells its services not to passengers but to travelagents, tour organizers, or other charterers. In the UK there are a small numberof very large tour operators and a somewhat larger number of medium-sizedones. Perhaps fewer than 50 tour operators purchase up to about 90 per cent ofthe charter flights operated each year out of the UK. Thus a charter airline’sannual selling and promotion costs may be no more than the cost of 50 or solunches with the key buyers of charter capacity. The charter airline’s managingdirector, with a handful of back-up sales staff to do the detailed costings andnegotiations, is probably all that is required. There is no need to sell or promoteits services to the travelling public, so a charter airline is unlikely to have apromotion or advertising budget. Alan Snudden, the then managing director ofBritain’s second largest charter airline, Monarch, claimed that in 1987 it‘achieved a turnover of £111 million based on the selling activities of one SalesDirector, three Salesmen and two typists with an advertising budget of £10,000which I have to say was underspent’.
Enormous cost savings accrue to charter airlines from the virtual absence ofticketing, sales and promotion expenditure. In 1988 British Airways, Britain’smajor international scheduled airline, spent more than £28 per passenger onticketing sales and promotion (Table 7.4). For the smaller scheduled airlines suchas British Midland, concentrating on domestic services, the per passenger figurewas lower at between £4 and £8. The contrast with the UK charter airlines isquite stark. The latter, if engaged exclusively with charter services, generallyspent only a few pence each per passenger on ticketing and sales.
Charter airlines tend to have very much lower general and administrative costsbecause they require fewer administrative and accounting staff. Many functionswhich are crucial to scheduled airlines and absorb significant resources either do
FLYING OFF COURSE 173

not exist within a charter airline at all or because of the different nature ofcharter operations, require relatively few staff. A charter airline, for example,does not need a large planning department or forecasting staff or large numbersof accountants to sort out revenue and sales accounts and inter-airline ticketingdebts.
A charter airline can make economies in virtually all areas of indirect costs. Itcan thereby reduce its total operating costs to levels well below those that can beachieved by a scheduled airline flying the same aircraft on the same routes.Because most of the savings in
Table 7.4 Marketing costs per passenger: UK airlines, financial year 1988
Charter passengers as apercentage of total passengers
Ticketing, sales (inc.commissions) and promotioncosts per passenger£
Mainly scheduled:British Airways 2 28.33British Midland 4 6.09Mainly charter:Air Europe 79 3.42Dan Air 79 2.37Britannia 98 0.14Novair 100 0.88Monarch 100 0.18Source: CAA (1990b).
charter operations arise in indirect costs, while direct costs are broadlycomparable for both charter and scheduled operations, indirect costs are a muchlower proportion of the total costs of charter airlines than of scheduled airlines.In 1989, among UK scheduled airlines, indirect costs accounted for around 50 percent of total costs. Among charter airlines, in contrast, indirect costs werebetween 20 and 35 per cent.
Major savings in indirect costs, together with marginally lower direct costs,suggest that if flying similar aircraft a non-scheduled operator may have totalround-trip costs between 20 and 30 per cent lower than those of a scheduledoperator on the same route. This is clearly insufficient to explain the widedifferentials in charter and scheduled passenger fares which exist in the Europeanmarket and which were illustrated earlier by reference to the London-Athensroute in summer 1990 (Table 7.1). However, the initial 20–30 per cent operatingcost advantage is magnified by two key elements in the economics of non-scheduled air services: high seating densities and very high load factors.
174 THE ECONOMICS OF PASSENGER CHARTERS

7.3.3HIGH SEATING DENSITY
Hapag-Lloyd, a large German airline, has in the past operated Airbus A300s oncharter flights from Germany to Greece, Spain or elsewhere in the Mediterraneanin a 315-seat configuration. Dan Air has used similar aircraft with 336 seats onMediterranean charters. Scheduled airlines such as Lufthansa, Iberia or Olympicflying on the same routes have generally operated this aircraft type with around250 seats (Table 6.6 above). By putting in 15–25 per cent more seats than theirscheduled competitors, the charter airlines would have been able to reduce theirseat-kilometre costs by nearly the same proportion. The scope for higher seatingdensities and therefore for even lower seat-kilometre costs is sometimes greateron wide-bodied aircraft. Non-scheduled airlines operating DC-10–30 aircraftwould normally expect to have close to 380 seats in a charter configuration. Yetthe same aircraft flown on scheduled services is more likely to have 235–285 seats(Table 6.6). In this case, the charter configuration increases the seating capacityby well over a third.
Several factors explain the ability of charter operators to push up the seatingcapacities on their aircraft. Non-scheduled aircraft are invariably in a single-classlayout and at a constant seat pitch (the distance between each row of seats). Nospace is lost accommodating first- or business-class passengers in separatecabins with greater leg room and low seat densities. The trend towards a three-class cabin on medium- and long-haul scheduled flights has in many casesreduced the total seating capacity on aircraft that had previously had only twocabins for first- and economy-class passengers. Conversely, in Europe, airlinessuch as British Airways, which discontinued first class and adopted a business-class concept but with economy-class seating and seat pitch, were able to pushup their seating capacity. Whatever the cabin layout, the charter configurationwill also have lower seat pitch, that is, less distance between each row of seats,so that more seat rows can be installed within the length of the cabin. A 29-inchseat pitch would be acceptable in a short-haul charter layout, whereas 31–34inches would be more normal for economy-class seating on a scheduled flight.Charter airlines also tend to increase the floor area on the main deck of theiraircraft available for seating by reducing the number of toilets and galley spaceand by eliminating other space uses such as coat cupboards and so on. Galleyspace can be reduced because in-flight catering tends to be less lavish than onscheduled flights. The absence of first- or business-class passengers helps in this.In wide-bodied aircraft, such as DC-10s, the galleys may be placed on the lowerdeck with an internal lift providing access. This is possible because aircraft onnon-scheduled flights do not have traffic rights for the carriage of freight so theaircraft hold is relatively empty.
FLYING OFF COURSE 175

7.3.4HIGH LOAD FACTORS
Not only do non-scheduled airlines put more seats into their aircraft but they alsofill substantially more of them. Whereas scheduled airlines would be pleased toachieve year-round passenger load factors on their international services of 65–70 per cent, charter airlines would be aiming for around 85 per cent. The starkcontrast in the seat factors of the two sectors of the industry is illustrated inTable 7.5. While in 1988 or 1989 one or two of the scheduled airlines achievedinternational seat factors of 70 per cent or more (considered very high byscheduled standards), the majority had seat factors in the middle sixties and somewere less than 60 per cent. In contrast, over half the non-scheduled operatorsshown achieved very high seat factors of over 85 per cent while none had a seatfactor below 80 per cent. One can conclude that, in general, passenger seatfactors are at least 20 per cent higher on non-scheduled than on comparablescheduled services. Finnair is the extreme case with a seat factor of only 67 percent on its scheduled flights but achieving a very high 92 per cent on its non-scheduled operations.
The achievement of such high load factors is due not to the non-scheduledoperators themselves but to the efforts of the charterers,
Table 7.5 Passenger load factors on international services, 1988 or 1989
Scheduled services Seat factor % Non-scheduled services Seat factor %
United Kingdom airlines 1989:Virgin Atlantic 79 Air 2000 90British Airways 72 Air Europe 89Air Europe 69 Britannia 89Dan Air 60 Dan Air 88Air UK 52 Novair 87British Midland 51 Caledonian 86
Monarch 84Other European airlines 1988:Iberia 70 Finnair 92KLM 69SAS 67 Hapag-Lloyd 88Lufthansa 67 Condor 85Finnair 67 Transavia 83North American airlines 1988:Air Canada 73 Air Canada 81TWA 66 Pan Am 80Pan Am 64 World 90Source: CAA (1989b); IATA and ICAO.
176 THE ECONOMICS OF PASSENGER CHARTERS
for it is they who have the responsibility for retailing the seats they have boughtwholesale. By careful programming and scheduling of flights and othercomponents of the total package such as hotel beds, self-catering apartments,ground transport, and so on, the tour operators can achieve very high seat factorson the aircraft and high occupancy factors for the beds and other facilities theyhave booked. Vertical integration between tour organizers, which may be hotelowners too, and charter airlines facilitates the process of closely matching andprogramming the supply of and demand for hotel beds and aircraft seats. Loadfactors must be kept high to ensure low and competitive prices.
Several features of the charter market help in achieving this. Charterpassengers are given limited flexibility in terms of choice of departure days andalmost none on the choice of the return days. Particularly with inclusive tours,passengers can stay for only a fixed period at their destination—usually 7 or 14days on intra-European charters, or perhaps 12 nights on long-haul charters toEast Africa. Most of the travellers on an outward flight will come back togetheron the same return flight and on the same day of the week that they flew out on.Aircraft loads are not subject, as in scheduled operations, to the whims ofdifferent individual travellers who want to be away for different periods of timeand travel on different days of the week. Moreover, once made and paid for,charter bookings are difficult to change and cancel except at a considerable costto the passenger concerned. Ticket brokers are also used by aircraft charterers tofill up spare capacity on inclusive tour or advanced booking charters. The ticketbrokers try to sell spare seats to other travel agents or at a discount to the public.If things go really badly, a tour operator with a large number of unsold seats on aflight it has chartered may cancel the flight (though it will pay a large penalty ifit does that late in the day), and ‘consolidate’ its passengers onto someone else’sflight where seats may be available. Both tour operators benefit from such anarrangement. Loads on individual flights are carefully monitored to ensure highload factors. A finely tuned and highly differentiated price structure for chartertours is used to induce a potential customer to travel on less popular days ortimes or seasons of the year. Such incentives include lower holiday prices, twoweeks for the price of one, free car hire, no charge for a child, and so on.
Higher load factors substantially reduce the passenger-kilometre costs ofcharter as against scheduled services. The twin impact of higher seating densitiesand very much higher seat factors on the unit costs of charters can be illustratedby reference to two British airlines, British Airways and Monarch, both of whichhave been flying Boeing 757 aircraft on European routes such as London-Athens.Monarch operated this aircraft in a charter configuration with 224 seats. Itsaverage load factor in 1989 was 84 per cent. Assuming it achieved this on itsBoeing 757 flights, this would have resulted in a load of 188 passengers. BritishAirways’ scheduled Boeing 757s had 180 seats and its average load factor on itsEuropean scheduled services was around 66 per cent in 1989. On Boeing 757this would have been 119 passengers. Even if on a particular route the operatingcosts of the two airlines were the same, and we have seen that they are not, the
FLYING OFF COURSE 177

costs per passenger round trip or per passenger-kilometre for Monarch would beabout 37 per cent lower than for British Airways, purely because it was carrying188 passengers instead of 119. In other words, by spreading the total round-tripoperating costs over many more passengers, the non-scheduled operator cansignificantly reduce the trip cost per passenger. The above example shows thatthe higher charter seating densities and load factors together have a greaterimpact on reducing the charter costs per passenger than do the savings inoperating costs.
7.4The Cascade and Reverse Cascade studies
The preceding analysis indicates that non-scheduled operators start with aninitial round-trip cost advantage of 20–30 per cent. This arises largely because oftheir lower indirect operating costs. By putting more seats into their aircraft theymagnify this into an even greater cost advantage per seat-kilometre. Then, byfilling 80–85 per cent of a larger number of seats, the costs per passenger-kilometre become even less vis-à-vis those of scheduled operators. The net effectmay be to convert the round-trip cost advantage of only 20–30 per cent into apassenger cost advantage which may range from 50 to 65 per cent.
It is impossible to obtain operating cost data for comparable routes for bothscheduled and non-scheduled services, so inevitably there is some uncertaintyabout the precise level of the initial operating cost advantage enjoyed by charteroperators. One of the very few published studies of non-scheduled costs was theso-called ‘Cascade’ study in 1977. This was a joint study carried out by the UKCivil Aviation Authority and British Airways (CAA, 1977c, Appendix 6). Itcovered the same ground as the above analysis, but it looked at the comparativecosts of the two sectors of the industry from a different viewpoint. Commencingwith British Airways’ scheduled cost per passenger on three sample intra-European routes, systematic adjustments were made for the known differencesbetween charter and scheduled operations, so as to arrive at a derived chartercost per passenger. This was expressed as a percentage of the initialscheduled cost per passenger, and on all three routes it was found to be around36–39 per cent. The derived charter cost obtained was then compared with theactual charter rates in that year (1975/6), and was found to be quite close.
The British Cascade study found that on London-Athens both the derived andactual charter cost per passenger were around 35–37 per cent of the scheduled cost(Table 7.6). This corresponds very closely to the 1990 differential between thecharter cost and the excursion
178 THE ECONOMICS OF PASSENGER CHARTERS

Table 7.6 Scheduled and charter costs per passenger on London-Athens route
Charter adjustment to scheduledcost
Cost index
Total scheduled cost per paxAssuming 55% load factor 100
1 Charter cost savings:No sales comission −8 92Higher aircraft and crew utilization(assumed 25% higher)
−3 89
Lower charter ‘standards’ (i.e.lower landing fees, fewer cabincrew, lower handling and in-flightstandards)
−6 83
Cost not applicable (i.e. no sales,reservations or advertising; lowoverheads; higher bar sales)
–15 68
Higher charter peak/trough ratio (–increases fixed element of aircraftoperating and station costs)
+4 72
2 Higher charter seating density:Elimination of first class −6 66Higher seating density −9 57
3 Higher load factor:Assumed 85% on charters −21 36Derived charter costs as % ofscheduled
36
Actual charter costs 1975/6 as %of scheduled
34–37
Source: Based on UK Civil Aviation Authority Cascade Study 1977.
fare (Table 7.1 above). If one examines the different adjustments that weremade to scheduled costs to arrive at a charter cost which was 64 per cent lower,two elements stand out. Straightforward cost savings, after adjustment for thehigher costs of meeting charter peaks, accounted for about 28 per cent of the 64per cent cost reduction. The remaining 36 per cent was due to the increasedseating capacity and higher load factors on charter flights. These figurescorrespond broadly to the cost savings suggested by the analysis earlier in thischapter.
The UK Civil Aviation Authority carried out a similar study three years laterusing March 1978 costs and adopting a different approach. This second studyconsidered the costs which a charter airline would incur if it were to offer ascheduled product. Unlike the earlier Cascade study, it defined charter ratherthan scheduled cost per passenger as its index base and instead of cascadingdown to a charter product it cascaded up to the scheduled cost. Hence it became
FLYING OFF COURSE 179

known as the ‘Reverse Cascade’ (CEC, 1981, Annexe 6). Starting with a chartercost per passenger, at an assumed 85 per cent load factor, adjustments were madeto allow for the intrinsic differences which a scheduled operation would impose.In the Reverse Cascade, the charter cost represents 46 per cent of the derivedscheduled cost, whereas in the original Cascade study the derived charter cost forthe same route represented 39 per cent of the scheduled cost. The implication isthat a charter airline using scheduled seating densities and load factors mightwell be able to operate a scheduled service at a lower unit cost than a scheduledairline would do. It seems that this lower estimated cost came about because thecharter airline’s estimates of what it would cost to retail the scheduled productwere considerably lower than those actually incurred by scheduled airlines.
Both the Cascade and Reverse Cascade studies include some cost adjustmentswhich are controversial. For instance, the assumption that charter costs areadversely affected by their higher peak/trough ratio might be questioned in viewof the fact that, despite this alleged handicap, charters achieve much higheraircraft and crew utilization. The highly peaked nature of charter services alsoallows much greater use of seasonal labour, which may reduce overall labourcosts. Thus cost adjustments given in the various studies should be considered asindicative rather than precise. None the less, all the studies do indicate that thecharter cost per passenger will normally be less than half the scheduled cost andmay be as low as a third. The precise relationship between the two will vary oneach route and will clearly be affected by the cost efficiency of the scheduled andnon-scheduled airlines competing on that route.
On many European routes the charter-scheduled passenger cost differentialhas tended to decline since the Cascade and Reverse Cascade studies were costedout because there have also been two significant changes in scheduled operationssince then. Many scheduled airlines replaced first class by a business class ontheir intra-European scheduled services. In the process the number of seats in theiraircraft was increased. At the same time, there has been a determined effort to pushup scheduled seat factors, especially since 1980. As a result, by 1990 averagescheduled passenger load factors in Europe had risen to around 62 per cent,though they were actually higher on many Mediterranean holiday routes. Thiscontrasts with the 55 per cent load factors assumed in the studies discussedearlier. These changes will have reduced the scheduled-charter cost differentialon some routes.
The discussion so far has been concerned with short-to medium-haul charteroperations within the Europe-Mediterranean area. Much of the analysis is equallyrelevant to long-haul charters across the North Atlantic or on other routes.Certainly such charters enjoy similar large savings in indirect costs which aremagnified by higher seating densities and high load factors. However, it isunlikely that long-haul charters obtain any savings in direct costs. What evidencethere is does not indicate that charter airlines on long-haul routes achieve higheraircraft or aircrew utilization, while the relatively low frequency of long-haulcharters may result in higher prices being paid for fuel at outstations. The only
180 THE ECONOMICS OF PASSENGER CHARTERS
direct cost saving may be in airport landing fees through the use of airports withlower charges in the country of departure.
7.5Planning and financial advantages
Apart from a straightforward operating cost advantage, charter airlines enjoyother planning and financial advantages which are inherent in the workings ofthe charter market, particularly for inclusive tour charters. The peak period forITC holidays is during the European summer from mid-June to mid-September.The retailing of those holidays begins the previous November or December, withpeak sales generally during January to March; though, as a result of theeconomic recession in recent years, the proportion of late sales in early summerhas increased. Because of early sales, the tour operators have to publish theirsummer brochures with full details of their various package holidays at the verylatest by October of the previous year. For competitive reasons the very large touroperators try to produce their brochures even earlier. To do this they must planand schedule their flights and ‘buy’ the hotel beds they need some monthsearlier. Hotel beds and flights for the summer season of 1992 would have beencontracted for at the very latest by May or June 1991. The same pattern ofcharter contracts finalized up to a year in advance exists for winter ITCs. Themarkets for advanced booking and other forms of series charters basicallyfunction in the same way as the ITC market, though the charter contracts maynot be closed so long in advance.
The commercial pressure on tour operators and travel agents to plan and selltheir holiday packages so far in advance works to the benefit of the non-scheduled operators. By May or early June of one year a charter operator wouldexpect to negotiate several contracts for a 24–25-week summer season startingaround the following April or Easter. Each contract may require several returnflights per week and may involve hundreds or thousands of hours of flying. Theroutes to be flown, aircraft types, frequencies, days of the week and departuretimes will all have been specified. Staggered but high cancellation fees wouldalso have been agreed. Usually up to about 10 per cent of flights may becancelled if this is done well in advance and before January or February whenthe agreed flying programme is finally firmed up. After that, cancellation fees arevery high. Thus, if a charter cancels a summer flight after February, thecancellation fee might well be the full cost of the flight minus the out-of-pocketexpenses that would be saved, that is for fuel, meals, en route navigation chargesand airport fees. Charter operators are in an enviable position. Having negotiatedcontracts with their various customers they are in a position to know almost ayear in advance the routes and frequencies they will be operating and the aircraftand crews they will need. They can plan their productive resources so as toensure that supply precisely matches demand and that it does so as efficiently aspossible. Even if demand falls below expectations and a charterer cancels some
FLYING OFF COURSE 181
flights, the charter airline is safeguarded against loss by the high cancellationfees. Knowing their total revenue in advance, charter airlines can adjust andreorganize their costs to ensure that costs do not exceed revenues. In contrast tothis, scheduled airlines normally do not know their revenues until the costs havebeen incurred and it is too late to make any significant adjustments.
The charter airline has further safeguards. The negotiated price for the charteris normally per round trip or per block hour for a minimum number of trips orblock hours per season. If this minimum number is exceeded, the trip or hourlycost may decline. But the price is based on the airline’s input costs at a datumpoint and will include actual or forecast fuel prices, airport fees and navigationcharges and assumed exchange rates for relevant currencies, especially thesterling to dollar rate. The airline is obliged to advise the charterer of any netchange of costs in relation to the datum costs a certain number of days before aflight. If costs have gone up there will be a surcharge to pay. If they have gonedown the charterer may be entitled to a rebate. A minimum notice period of 90days is often used so the charterer has time to pass on any surcharge to thepassenger. This system of surcharges on the negotiated charter price insulatescharter airlines against any sudden and adverse variations in their input costs.They cannot lose.
Once the contracts with the various tour operators and other charterers havebeen negotiated, the airline receives a series of advance payments. The size andtiming of these advances will vary with each contract. It would not be unusualfor an airline to receive 5 per cent of the total contract sum either on signing thecontract or when the flying programme is finalized. Another 5 per cent may bepaid a month later. Very large or good customers may try to avoid paying thisdeposit, but smaller and newer tour operators will normally have paid about 10per cent of the total contract price by January or February. Once flyingcommences, the balance due on each flight has to be paid the month before theflight takes off. Thus charterers have to pay in full for all July flights they havecontracted by the 15th of the previous month, namely June. The purpose of theseadvance payments is to help the airlines’ cash flow through the relatively slackwinter months and to provide some security against cancellations by thecharterers. The net result is that a charter operator gets paid in full before a flighteven takes off, whereas a scheduled carrier may wait for months after aparticular flight to collect all the revenues due from ticket agents, credit cardcompanies and other airlines.
These advance payments often produce a very positive cash flow during thespring and early summer. If this happens they can be banked so as to earn bankinterest. In the financial year 1986/7 British Airtours, the then charter subsidiaryof British Airways, generated just over a third of its profit from interest receivedon funds deposited in the bank.
The charter operator’s cash flow is also helped by the high volume of on-boardsales of spirits, cigarettes, perfumes, watches, and so on. For some reason on-board sales per passenger in Europe are much higher for charter than for
182 THE ECONOMICS OF PASSENGER CHARTERS

scheduled passengers. This may be due partly to the fact that many charterflights are from secondary airports with poor duty-free facilities of their own andpartly to the high proportion of regular travellers on scheduled flights, who maybe less inclined to spend money on board. Britannia, the largest charter airline,estimated that in 1988 its 6.1 million passengers spent around £4.10 ($7.30) perhead on in-flight sales, including drinks and tobacco consumed on-board. Thisproduced a total sales revenue of £25 million, of which about half was profit.This represented a third of the airline’s total pre-tax profit in that year. Other UKcharter airlines at that time confirmed that in-flight sales contributed between aquarter and a third of their profits. For these UK carriers in-flight sales in 1988were £2–4 per passenger, which was the highest among European airlines exceptfor the Scandinavian charter carriers such as Sterling, Scanair and Conair.Because of the very high taxes on tobacco and alcohol in much of Scandinavia,duty- and tax-free sales on flights are very high and passengers are encouraged tomail order their in-flight requirements well in advance. As a result, Scandinaviancharter airlines’ in-flight sales per passenger are between three and five times ashigh of those of the best UK airlines.
Whereas some scheduled airlines are tending to reduce their in-flight range ofgoods on intra-European services or have done away with them altogether, non-scheduled operators are carrying more high-value goods such as expensivewatches and perfumes. While in-flight sales are a positive element for non-scheduled operations, the absence of freight revenue clearly reduces the potentialrevenue from any one flight. Authorizations for passenger charter flights fromdestination countries normally exclude the right to carry any freight. Wherecharters are allowed to carry freight, they have no distribution system so shippersmust bring their own shipments to the airport. Generally, however, charteroperators cannot top up their passenger revenue with freight revenue as theirscheduled competitors can. The price at which they charter out their aircraft musttherefore reflect this.
The charter airlines’ planning and financial advantages described above arealso the cause of their major headache, which is the constant fear of over-capacity in the market. Signed contracts to provide many hours of flying a year orso later can be used to facilitate the raising of loans to purchase aircraft to meetthe charter contract. The ease with which finance can be raised once a contracthas been signed may well induce new entrants into the market or existing airlinesto expand their capacity too quickly. If too much capacity is available there is astrong downward pressure on charter rates. This happened in the UK chartermarket in 1981 and again in 1989–90. In 1981, Laker Airways started offering itsnew Airbuses on charters for the 1982 summer season at charter rates per seatabout 8 per cent below the 1981 rates. It forced the 1982 market rates down by 8per cent, yet Laker Airways itself collapsed early in 1982 before the summerseason had started. An additional problem during the 1980s in the UK was themove by a few large tour operators into charter airline operations. This was partof the trend towards vertical integration previously mentioned. The Intasun
FLYING OFF COURSE 183

leisure group set up Air Europe in 1979 and a year later Orion Airways waslaunched by Horizon Travel. In 1987 the Owners Abroad Group, a major Britishtour operator, set up Air 2000. This was done in some cases because the touroperators were able to offset investment allowances on their newlypurchased aircraft against their large profits and thereby reduce their taxliabilities. There were tax advantages to be gained by diversifying from touroperating into flying. The result was to increase the overall charter capacity inthe market. The fear that more new charter airlines will be set up reinforces thepressure towards vertical integration. As more tour operators become financiallylinked with particular charter airlines, the scope for new airline entrantsdiminishes. Yet new and ever-hopeful charter airlines are regularly being set up,notably in the UK, Spain, Germany and France. In September 1990, after a poorsummer for charter airlines, Airtours, the UK’s fourth largest tour operator,announced that it was launching a new charter airline to carry 60 per cent of thecompany’s summer 1991 charter traffic.
The early negotiation of charter contracts, the ability to adjust charter rates inresponse to changes in input costs and the high cancellation fees paid by chartererswho cancel flights provide non-scheduled operators with a level of certainty andfinancial security that is unique in air transport. They can sell their product inadvance, at a price which will be adjusted if their costs go up. They can then goout and procure the resources necessary to provide the capacity they have sold.Scheduled airlines are handicapped because they have to do the exact opposite.They first decide to provide a level of scheduled capacity which they judgenecessary to meet the demand, they then allocate resources to it and subsequentlytry to sell it. Scheduled operators must plan their output in advance, withoutknowing for certain how much of it they will sell. As a result, they face muchgreater problems in trying to match supply and demand than do the charterairlines.
7.6Charter versus scheduled competition
There can be little doubt that non-scheduled operators enjoy several cost andother advantages when competing with scheduled air services. These advantagesare particularly marked in the short-haul leisure markets within the Europe-Mediterranean area. When faced with head-on competition with charters,European scheduled airlines have had difficulty in maintaining their marketshare. Some, such as Olympic Airways or in the mid-1980s the Portuguesecarrier TAP, have tried to fight back by entering the charter market themselves.This is rarely a financial success, since scheduled airlines can match theprevailing charter rates only at a loss. This is because they have to carry andrecoup the high indirect and overhead costs of a scheduled airline. At the sametime they lack the flexibility of a specialist charter operator. If their aircraft arebeing used on both scheduled and charter flights, they may be unable to use
184 THE ECONOMICS OF PASSENGER CHARTERS

charter seating densities. They may also be unable to tender for all sectors of thecharter market if aircraft have to be used for scheduled services for much of theday.
The difficulties involved in competing directly in the charter markets havepushed European scheduled carriers in two directions. Many have set up separatebut subsidiary charter companies with their own dedicated aircraft and crews.Subsidiaries such as Condor (Lufthansa), Air Charter (Air France and Air Inter),and Scanair (SAS) are now large and successful charter airlines in their ownright. The second tendency has been the growth of so-called ‘part-charters’ orother charter-competitive fares on scheduled services within Europe. Under part-charter rules, scheduled carriers can sell off blocks of seats to travel agents ortour operators, which package the seats into inclusive tour holidays. Firstintroduced between Britain and Spain in 1971, they quickly spread to severalother routes where both governments approved. In some cases controls wereintroduced on the number of seats in scheduled aircraft that could be part-chartered. In many cases there may not be a separate part-charter fare but theairlines may give tour agents a discount on the group inclusive tour (GIT) orconsolidation fare. For example, on London-Athens in summer 1990 someagents were able to buy consolidation seats at up to 20 per cent discount on the£179–186 round-trip IT fare (Table 7.1). This produced an effective part-charterrate of around £143–148, which compared favourably with charter passenger costsof £112–143.
The concept of part-charter on scheduled services is not merely a competitiveresponse to low-cost charters; it also offers scheduled carriers other advantages.By mixing normal traffic and charter traffic, scheduled carriers can fill upotherwise empty seats and improve load factors. In the process they may also beable to switch to larger aircraft sooner and thereby get the benefit of lower seat-kilometre costs. By mixing traffic in this way it may also be possible to sustainscheduled services on routes where the scheduled traffic would otherwise beinsufficient to maintain adequate scheduled frequencies.
There is, however, an inherent danger in scheduled airlines trying to matchcharter fares. Scheduled costs are much higher than charter costs. If theproportion of part-charter or other very low-fare passengers is controlled andmixed with an adequate proportion of high-yield passengers, the total revenue onthe scheduled service may be pushed up. On the other hand, too many very low-fare passengers are a recipe for financial disaster since scheduled costs are notlow enough. Yet during the 1980s, some European scheduled airlines, in theirdesperation to head off charter competition, ended up with too high a proportionof part-charter and low-fare passengers on some of their intra-European holidayroutes. As a result, they frequently lost money on such routes without effectivelystemming charter penetration. These very low charter-competitive fares shouldbe introduced by scheduled airlines only as part of an effective yield managementprogramme (section 11.7 below).
FLYING OFF COURSE 185

In Europe, the charter airlines’ response to part-charters on scheduled serviceshas been, as mentioned earlier, to try to introduce seat-only sales on charterflights. The first step in this direction was the ‘throw-away’ inclusive tours or‘cheapies’ introduced in 1975 when the UK Civil Aviation Authority authorizeda small number of tour operators to offer ITC holidays which included only verysimple ground arrangements. In time, such holiday packages, where theaccommodation content was derisory and where the passengers were discouragedfrom using it, spread—despite attempts by governments at both ends of the routeto control it. Such ‘throw-aways’ in effect enable passengers to buy a seat onlyon a charter flight while remaining technically within the regulations. In recentyears, Britain’s Civil Aviation Authority has turned a blind eye to this, as do someother aviation authorities. The logical next step is formal authorization for seat-only sales on charter flights, but tourist destination countries are loath toformalize this currently ‘illegal’ practice because they fear the repercussions ontheir own scheduled carriers. Some such as Greece have tried to stop the practiceby checking that incoming charter passengers have hotel or otheraccommodation vouchers. Yet there seems to be so much public pressure toallow seat-only sales that in the end the destination countries may have to giveway if they want to maintain their tourism levels. If not, travel agents and touroperators will continue to bend the rules to meet public demand for seat-onlytravel on charter flights. In some cases, charter airlines themselves have set upsubsidiary travel agencies to sell off to the public unsold seats or seats theagencies have actually bought from the parent charter airline. On the NorthAtlantic, the advance booking charters are in effect seat-only sales.
Another development bridging the gap between traditional scheduled andcharter operations has been the introduction by charter operators of a two-classcabin. This began in a small way in 1989 when several charter airlines offeredtheir passengers on some longer routes the option of paying a premium for a seatin the front part of the cabin where an improved in-flight service was availableand for which preferred seats could be allocated prior to departure. These‘improved’-class charter services were particularly popular on routes with a moreup-market clientele on independent or self-catering inclusive tour packages andwhere there was no scheduled alternative. The two-class charter flights are likelyto spread as charter passengers become more discriminating.
Part-charters, very low charter-competitive fares on scheduled services andseat-only sales on charter flights are further eroding the remaining distinctionsbetween scheduled and charter services in markets where both are allowed tooperate. The two sides of the industry are moving closer together. In Europe, thistendency is being reinforced by the expansion of many charter airlines intoscheduled services (as described in section 4.4.2 above). The real question is towhat extent the key elements of charter economics—such as low indirectoperating costs, higher seating densities and higher passenger load factors—canbe introduced into scheduled services. None of the US ‘supplemental’ or non-scheduled carriers which entered scheduled markets after US deregulation did
186 THE ECONOMICS OF PASSENGER CHARTERS

well. Some new scheduled airlines have tried to adopt charter features into theiroperations with mixed success. Laker Airways and People Express did wellinitially, but failed subsequently. Virgin Atlantic, a relatively small Britishcarrier, appears to have understood the implications of others’ mistakes. It hassurvived successfully as a low-fare long-haul scheduled airline operating atunusually high load factors (Table 7.5), with high seating densities on its Boeing747 aircraft and with minimal indirect operating costs, but offering a superior in-flight service. There may be a lesson here for other scheduled airlines and forcharter airlines launching scheduled services.
FLYING OFF COURSE 187

8Airline Marketing—The Role of Passenger
Demand
8.1The interaction of supply and demand
The discussion so far has concentrated to a great extent on supply aspects ofinternational air transport. There is a tendency among airline managers toconcentrate on supply considerations at the expense of demand factors. Withinmany airlines great emphasis is placed on operational safety and efficiency andon reducing costs of production. A large range of performance indicators areproduced to enable the airlines to monitor various aspects of supply: engineshutdown rates per 1,000 hours, punctuality, annual utilization of aircraft andcrews, maintenance man-hours per aircraft, and unit costs per tonne-kilometreare just a few of the indicators used to monitor supply conditions. By contrast,performance indicators on the demand or revenue side are relatively few andoften less importance is attached to them. Too many airlines, among them smallerinternational carriers, assume that if their supply of services is efficient and lowcost that is enough; profitability should follow. The international regulation offares through the International Air Transport Association (IATA) and widespreaduse of airline pooling agreements may have blunted initiative with regard tounderstanding and stimulating demand. Yet airline management is aboutmatching the supply of air services, which management can largely control, withthe demand for such services, over which management has much less influence.To be successful in this an airline can be a low-cost operator or a high-costoperator. What determines profitability is the airline’s ability to produce unitrevenues which are higher than its unit costs. Low unit costs are no guarantees ofprofit if an airline is unable to generate even the low unit revenues necessary tocover such costs. Pan American, one of the lower-cost international carriers, in1988 was losing $2 million a week before interest, while Wardair, a Canadiancharter airline that had expanded rapidly into scheduled services and was theworld leader in terms of cost, also made a substantial loss (Table 8.1). VARIG,South America’s largest airline, also lost heavily despite its low costs.
Conversely, as the 1988 results for British Airways, Swissair or SAS

Table 8.1 Operating result of select airlines, financial year, 1988
Cost per availablet-km(US¢)
Revenue peravailable t-km(US¢)
Oprating profit orlossa
($m)
Wardair 21.9 21.0 −69SIA 31.0 37.8 +395Cathy Pacific 32.3 42.8 +460Air India 34.2 36.3 +46VARIG 36.1 34.4 −69Northwest 36.4 37.7 +196TWA 37.2 39.6 +259American 39.2 43.3 +801Thai International 39.5 49.0 +275Air Canada 39.5 41.6 +117Mexicana 38.7 42.8 +72Pan Am 40.2 39.0 −103United 41.3 44.7 +669Qantas 42.2 43.8 +85Air France 43.3 46.7 +332KLM 44.3 47.5 +190Kumait Airways 47.5 44.8 −26Japan Air Lines 52.4 57.1 +568Alitalia 53.5 54.9 +52British Airways 56.3 51.7 +598Iberia 66.6 73.9 +278Swissair 76.2 76.6 +11SAS 109.2 117.5 +223British Midland 115.9 123.7 +16Note:a British interest and other non-operating items.Source: ICAO (1988a)
indicate, high unit coats are not necessarily a bar to profit if an airline candevelop its markets in such a way as to insure even higher units revenues. Someairlines do this by setting out to position themselves at the top end of theirmarkets, developing and catering for traffic which will produce high enoughrevenue to compansate for those airlines’ high costs. SAS their and Swissairhave been doing this very successfully in recent year on their international routesand US air has been doing it domestically in the United States.
To achieve this profitable matching of supply and demand it is crucial forairlines managers to have a thorough understanding of the demand they aretrying to satisfy. Such an understanding is fundamental to every aspect of airline
FLYING OFF COURSE 189

planning. Aircraft selection, route development, scheduling, product planningand pricing and advertising are just some of the many decision areas whichultimately are dependent on an analysis of demand for the transport of bothpassengers and freight. As in all industries, supply of and demand for air servicesare not independent of each other. On the contrary, each affects the other.Aircraft types and speeds, departure and arrival times, frequency of service, airfares, in-flight service, the quality of ground handling and other features ofsupply will influence demand for an airline’s services. Conversely, the demandwill itself affect those supply features. The density of passenger demand, itsseasonality, the purpose of travel, the distance to be travelled, the nature of thefreight demand and other demand aspects should influence supply and willimpact on costs. (The impact of demand patterns on costs has been discussedbriefly in section 6.3 above.) Thus airline planning is a dynamic and iterativeprocess. An understanding and evaluation of the demand for air transport leads tothe provision of services which themselves then affect the demand. Newadjustments to the supply then take place to meet changes in the demand and thisinteractive process continues. The more competitive and unregulated the market,the more dynamic the interaction becomes and the greater are the headaches forairline managers. Marketing is concerned with this dynamic and interactiveprocess of matching supply and demand.
8.2The role of airline marketing
There is a widely held misconception that marketing is about selling what isbeing produced. It is much more than that. Marketing is involved in decidingwhat should be produced as well as how it should be sold. As such it is thelinchpin of any industry. The role of airline marketing is to bring together thesupply of air services, which each airline can largely control, with the demand,which it can influence but not control, and to do this in a way which is bothprofitable and meets the airline’s corporate objectives.
The essence of marketing is to identify and satisfy customer needs; to beconsumer or market oriented rather than production or supply oriented. If anairline concentrates on merely selling what is produced before identifying whatcustomers want and are prepared to pay for, it is doomed to failure. A good exampleis supersonic air services. The Concorde aircraft was produced largely because itwas technically feasible, with little reference to whether passengers wouldultimately be prepared to pay the excessively high cost of travelling in theaircraft or whether people were prepared to pay the full cost of super-sonic airtravel to save 2 or 3 hours. British Airways’ and Air France’s Concorde servicessurvived only because they were not expected to cover their full costs since thecapital costs were written off by their respective governments. No moreConcorde aircraft were built after the initial batch of 16.
190 MARKETING—THE ROLE OF PASSENGER DEMAND

The first step in marketing is to identify markets and market segments that canbe served profitably. To do this one uses the whole range of market researchmethods, from desk-based statistical analyses to surveys of current andprospective users of air services. The aim is to gain an understanding of theneeds of different market segments and also the degree to which such needs arenot currently being satisfied. This leads on naturally to the production of trafficforecasts, which should be as detailed and segmented as possible.
The second stage of marketing is to decide, in the light of the preceding marketanalyses, the air services that should be offered in the market and their productfeatures both in the air and on the ground. This is product planning. Price is themost critical of the product features but, as discussed later in Chapter 10, thereare many other aspects of the airline’s product that must also be decided on.Product planning is related to three key factors: the market needs which havebeen identified, the current and expected product features of competing airlinesand the costs of different product features. In assessing the costs of proposedproducts, the supply and demand sides of the industry are brought together, forthere is a trade-off between the two. The product planners must balance desiredproduct features against their costs and what customers are prepared to pay for.
The third stage is to plan and organize the selling of the products on the basisof a marketing plan. This involves setting up and operating sales and distributionoutlets both airline owned, such as sales offices or travelling salespeople, andthrough a range of agents and sub-agents. In order to attract potential customers,the marketing plan will also include a detailed programme of advertising andpromotion activities.
Lastly, marketing is concerned with reviewing and monitoring both the degreeto which the airline has been able consistently to meet the service standards andproduct features planned and customers’ responses to them. Such monitoringthrough weekly sales figures, customer surveys, analyses of complaints and othermarket research techniques should enable airlines to take short-term correctiveaction, where possible, and also to make longer-term changes in their service andproduct features.
It is not the aim of this book to analyse airline marketing in detail but rather toassess its role in the process of matching supply of air services with the demand.Marketing starts with an understanding of demand. This chapter considers certaincharacteristics of the demand for air travel and examines the various factorswhich affect the level and growth of demand in any given market. Thisunderstanding of demand leads on naturally to an examination of the forecastingtechniques most widely used by airlines (Chapter 9). This is followed by a briefassessment of product planning and distribution (Chapter 10), of which a keyelement is pricing (Chapter 11). The cost implications of marketing strategieshave been considered earlier (section 6.6).
FLYING OFF COURSE 191

8.3The pattern of air travel
The bulk of air travel is either for business or for leisure. Business travelinvolves a journey necessitated by one’s employment and paid for by theemployer. The business traveller and the employer may in some cases be the sameperson, but even then business travellers will be paying not directly out of theirown pocket but out of the firm’s. The leisure market is further subdivided intotwo distinct categories, holiday travel and travel whose primary purpose isvisiting friends or relatives (often referred to as VFR). Leisure travellers, unlikethose travelling on business, invariably pay their own fares out of their ownpockets. A number of important differences between the business and leisuremarkets stem from the fact that in the former case business passengers are notpaying for their own travel whereas in the latter they are. These are discussedlater.
There is, finally, a small proportion of air passengers who do not fit into thebusiness, holiday or VFR categories. These include students travelling to or fromtheir place of study, those travelling for medical reasons, and migrants moving toanother country. They are normally grouped together as a miscellaneouscategory.
In the early days of international air transport the majority of passengers weretravelling on business. The remainder were relatively wealthy leisure passengers.As the total air passenger market has expanded following the steady rise inpersonal incomes and the decline in real cost of air fares, the proportion ofbusiness travel has fallen rapidly. In Europe, business now generates about 20per cent or less of international air travel while the proportion for US domestictravel is slightly higher at around 25 per cent (Blake, 1989). In the UK, the figureis well below 20 per cent. In 1988, UK residents took 21 million trips abroad byair. Of these, only 15.3 per cent were business trips. Nearly three-quarters (72.5per cent) were holiday travellers and 10.4 per cent were flying to visit friends andrelatives. The remainder, approximately 1.8 per cent, were travelling for amiscellany of other reasons (Business Monitor, 1989).
Thus leisure travel—for holidays and to visit friends or relatives —accountsfor around 83 per cent of the UK originating air travel market, and its share hasbeen slowly increasing. It is also significant that in 1988 10.3 million trips,representing two-thirds of these leisure visits (67.6 per cent), involved inclusivetours, the majority of which would have been on charter flights. Charters therebyabsorb a large proportion of the total holiday market. Conversely, business travelis almost entirely confined to scheduled flights. As a result, on many scheduledflights the business proportion of the traffic is much higher than the 15.3 per centoverall business share would suggest.
On short-haul scheduled routes out of London, such as Frankfurt, Brussels orParis, business trips may generate as much as two-thirds of the total traffic. Thebusiness share goes down to about one-quarter on long-haul routes, such as
192 MARKETING—THE ROLE OF PASSENGER DEMAND

London to Los Angeles or Singapore, and will be lowest (at around 10–20 percent) on scheduled routes such as those to Australia or Cyprus where the VFRtraffic is particularly high (CAA, 1989b).
While only about one in ten UK travellers going abroad do so to visit friends orrelatives, in some markets such VFR traffic can be more important. On routes toCanada, to the Caribbean or to South East Asia and Australia, as much as one-third of the UK originating traffic may be visiting friends or relatives.
In other regions of the world the split between business, holiday, VFR andother trips will vary. As a general rule, the higher the personal disposable incomeof the population in a country, the greater is the proportion of holiday trips in theinternational air travel generated by that country (unless, of course, travel orforeign exchange restrictions are imposed on its citizens). Low incomes in mostcountries of Africa mean that business trips dominate on international air routeswithin the continent. Conversely, rapidly rising personal incomes in Japan and thenewly industrialized countries of East Asia during the 1970s generated a rapidgrowth of leisure travel, which partly explains the unusually high growth ratesenjoyed by airlines in the region during the last decade (Table 1.2 above). VFRtraffic tends to be significant on air routes joining countries between which therehave been earlier population movements. Apart from the UK examplespreviously cited, there are many other air routes with an important VFRcomponent. These include France to Algeria or Morocco, and United States tothe Philippines.
The air travel market is smaller than the number of passenger trips recordedsince each individual traveller will normally make more than one flight. Therelationship between the number of travellers and the passenger trips recordedvaries on a route-by-route basis. It is greatly influenced by the proportion ofbusiness travellers on the route, since they are the most likely to be frequentusers of air services. On many inclusive tour charter routes, the number oftravellers is probably close to half the number of passengers recorded on theroute since each traveller will make both an outward and a return trip, while it isunlikely that they will make that round trip more than once a year. In scheduledmarkets, the position is more complex, with a small proportion of frequenttravellers generating a high proportion of the total passenger trips recorded. Suchfrequent travellers will usually be flying on business, but some may also be onleisure trips. In the United States in 1989, frequent flyers who took 10 trips ormore in the previous year represented only 6 per cent of air travellers but took 41per cent of all air trips (ATA, 1989). In 1987, the 35 million largely scheduledpassenger movements recorded at London’s Heathrow airport (excluding airsideinterliners) were due to about 8.5 million travellers making an average of fourtrips a year through the airport. The average figure hides the fact that UKbusiness passengers had, on average, each used Heathrow seven times during theyear, while UK leisure passengers had used it 1.6 times each.
Travel motivation has an impact on frequency of travel but also on theduration of the trip. While business travellers fly more frequently, they also take
FLYING OFF COURSE 193

shorter trips. Among leisure passengers, those on inclusive tour holidays havethe longest trips since such holidays normally are of fixed duration, often inmultiples of a week. As the journey distance increases so does the duration of thetrip, whatever its purpose. These two tendencies—longer trip duration for leisuretravellers and longer duration for longer-distance trips by all travellers—wereclearly illustrated in the 1978 survey of Heathrow passengers (CAA, 1980). Thisshowed that, remarkably, 22 per cent of business travellers on European routesout of Heathrow flew back the same day or the next. At the other extreme, two-thirds of leisure passengers to or from North America had trips lasting for morethan two weeks.
8.4Socioeconomic characteristics
One would expect male passengers to make up the bulk of the business market,but the extent to which males still dominate is perhaps surprising. In the UK in1987, only about 15 per cent of business air travellers were women (CAA,1989b), though the figure had been 10 per cent 10 years earlier. The proportionis somewhat lower on UK domestic air services and lower on international longhaul. This pattern is indicative of the situation elsewhere in Europe too. In theUnited States, the proportion of women among business travellers is 20 per cent,though it had been up to 27 per cent in 1983 (ATA, 1990). Traditionally,business travellers have been thought to be primarily middle and seniormanagers and executives and established lawyers, architects, consultants or otherprofessionals. Their seniority inevitably meant that they would be in the middleto upper age group, that is, early thirties to mid-fifties. However, the businessmarket has been undergoing a fundamental change. The internationalization ofthe world’s trade and industry and the fall in the real cost of air travel, together withthe speed advantage offered, have resulted in recent years in a growth ofbusiness travel by more junior staff and skilled workers. A 1987 survey of airpassengers at London’s airports found that about one-third of businesspassengers were supervisory clerical and junior managerial or professional staffor skilled manual workers (CAA, 1989b). Moreover, this proportion has beengrowing steadily. Such passengers would tend to be younger and on lower incomesthan the more traditional business passenger.
The leisure market manifests a more even split of passengers between the twosexes, though in many European and North American leisure markets women ifanything predominate. The 1987 survey of passengers at the London areaairports indicated that close to 53 per cent of leisure passengers were women(CAA, 1989b). The proportion of women is even higher among internationalVFR passengers. In the United States, women are dominant in the leisuremarket, generating well over half the total air trips. Among leisure passengers theage distribution is wider and more evenly spread than among businesspassengers. The propensity to travel by air for all forms of leisure is highest in
194 MARKETING—THE ROLE OF PASSENGER DEMAND
the UK among those aged 30–49 years. It tapers off among those 60 years orolder, though still remaining high. Conversely, the very young, those below 16years of age, who represent a fifth of the UK population, account for less than 10per cent of leisure air travel. The most significant socioeconomic variableaffecting the demand for leisure travel is personal or household income, sinceleisure trips are paid for by the passenger, who may also be paying for a spouseand one or more children. As a result, those with higher incomes generate adisproportionately large share of the leisure market. The 1987 survey ofpassengers using Heathrow airport indicated that the 58 per cent of business tripsby UK passengers and 45 per cent of leisure trips were generated by the 13 percent of the population at the top of the income scale. Since income is closelyrelated to socioeconomic grouping it is not surprising to find that, whereas in1987 18 per cent of UK residents were in the higher or intermediate managerial,administrative or professional classes, they generated 36 per cent of leisuretravel from the London area airports. In many Third World countries with lowaverage disposable incomes, international air travel may be limited entirely to the5–10 per cent of the population with the highest incomes. Elsewhere,international leisure travel may be more widespread but still with apredominance of higher-income earners.
Apart from sex, age and household income, passenger surveys may alsoascertain other socioeconomic features of the passengers on a route. These mayinclude size of family, the number of people travelling together, the social classof passengers, the type of industry or profession that business travellers areengaged in, and so on. An appreciation of the socioeconomic characteristics ofpassenger demand in each market is helpful to airlines in planning theiradvertising, promotion and sales activity. It can help them in deciding where toadvertise and what features of their services to emphasize in their advertisingcampaigns. Such knowledge of the market may assist to a certain extent inproduct planning and in determining tariff policies and possibly even inforecasting. But in the latter areas, knowing the breakdown of one’s passengersby purpose of travel and trip duration and an awareness of their booking patternsmay be more useful than knowing their socioeconomic characteristics.
8.5Market segmentation
Traditionally airlines have segmented their markets on each route by trippurpose. Some airlines do this simply by dividing their passengers into businessand non-business or leisure passengers. Others make a three- or fourfold divisioninto business, leisure, VFR and other. Market segmentation in this way isinvaluable since the different market segments have different growth rates andrespond differently to internal variables such as fare changes or to externalfactors such as exchange rate fluctuations or economic recession in a particularcountry. Understanding the size and the characteristics of each market segment
FLYING OFF COURSE 195

on each route is essential for forecasting demand, for many aspects of productplanning such as scheduling or in-flight service, and especially for pricing.Airlines without such detailed knowledge of their markets are likely to get intodifficulties when trying to match supply and demand.
In recent years there has been a growing awareness among airline managersthat this simple approach to market segmentation based on trip purpose has someshortcomings. First, it tends to place too much emphasis on the demographic andsocioeconomic features of the passengers. Age, sex or social class are perhapsless important than appreciating passenger needs and requirements whentravelling by air. Surely it is more important for an airline to know whether apassenger will cancel their reservation at the last moment or whether they areprepared to pay a lower fare for an inconvenient departure than it is to knowtheir sex or age? Secondly, air trips may increasingly be multipurpose. Abusiness trip is combined with a holiday, or a wife accompanies a husband on abusiness trip, while many visits to friends and relatives are considered asholidays. Thirdly, traditional market segmentation oversimplifies themotivational factors involved in travel decisions. All business air travellerscannot be grouped together and assumed to have similar demand characteristicsand needs, any more than can all holiday passengers. A senior manager orengineer requiring to go to another country immediately because of anunexpected crisis has different transport requirements and demands from asalesman who plans his regular overseas sales trips months in advance. Equally,the family holidaymaker buying their annual two-week inclusive tour packageholiday at a sunshine resort places different demands on the air services from theholidaymaker going independently and making their own accommodationarrangements or the couple going for a weekend break to Paris from London orto Hong Kong from Manila.
Many airline planners now believe that market segmentation should be basednot on a straightforward fourfold division categorized by journey purpose but ona more complex division related partly to journey purpose but partly also topassenger needs. Thus the business segment may be further subdivided intoroutine business and emergency business. The holiday segment of the leisuremarket could be split into an inclusive tour segment, a multi-destination touringsegment and a weekender segment. Other ways of segmenting the market canalso be used depending on each airline’s appreciation of what are the keysegments of its market. The point about more complex market segmentation is thateach segment should have distinctive needs and expectations, such as the need orotherwise to change reservations or routeings, the need to make stop-overs, theability to pay particular fare levels, expectations in terms of in-flight service andcomfort, and so on. Variations in needs are shown in Figure 8.1 for four of themany possible market segments on a medium-haul route such as London-Athensor Singapore-Hong Kong. It can be seen by comparing weekend and two-weekholidaymakers that even in the leisure market there may be distinct segmentswith their own needs and expectations. The significance of this more
196 MARKETING—THE ROLE OF PASSENGER DEMAND

sophisticated approach to market segmentation is that it can help airlines in theirforecasting, but it can be especially helpful in product planning and pricing. Itcan help them in relating fares more closely to the costs imposed by the differentsegments and also in working out the various conditions attached to differentfares to prevent slippage of passengers from high- to low-fare categories.
Another approach is to segment markets both in terms of motivation andrequirements but also in terms of psychological make-up of passengers. ThusEastern Airlines in the United States identifies eight different groups ofpassengers, including the ‘demanding’, the ‘self-reliant’, the ‘naive’ or the ‘fussyplanner’, each of which have different requirements. Interestingly, the‘demanding’ group were estimated to account for only 9 per cent of fliers butgenerated 21 per cent of trips and 27 per cent of revenue (Blake, 1989).‘Demanding’ passengers are, according to Eastern Airlines, creatures of comfort.
Figure 8.1 Market segmentation by trip purpose and passenger needs
Note: Only a sample of possible market segments is shown here
Source: Compiled by author.
FLYING OFF COURSE 197

They are luxury oriented and will spend extra money to get what they want. Theytake the fastest, easiest route and are very specific about their needs whiletravelling. In the late 1980s British Airways categorized its business passengersas ‘attention seekers’, ‘comfort cravers’ or ‘schedule seekers’, each withdifferent demands and flying behaviour. Leisure travellers were ‘scheduleseekers’, ‘service seekers’ and ‘nervous nellies’, though the latter were unlikelyto be told this! The aim of such market segmentation was to gain a better insightand understanding of passenger needs so as to make the correctmarketing decisions. There is a problem, however. The more complex andsophisticated the market segmentation, the more complex and costly is themarket research which is necessary to establish and monitor the market segmentsand their needs. Smaller airlines will tend to stick to a more traditional approach.
8.6The peak problem
Like many transport industries, particularly those dealing with passengers, theairline industry is characterized by marked daily, weekly and seasonal peaks andtroughs of demand. The pattern and intensity of the peaks and troughs vary byroute and geographical area. Peak flows become a serious problem when theybegin to impose cost penalties on the airlines involved. In meeting demand atpeak periods an airline may have to provide extra capacity not only in terms ofaircraft and flight crews or cabin staff but also in terms of staff and facilities inother areas such as sales or engineering. Such extra capacity may be under-utilized during the off-peak periods. The greater the ratio of peak to troughtraffic, the more difficult it becomes to ensure utilization of peak capacity in off-peak periods. Such peak capacity then becomes very costly to operate since itmust cover all its fixed and overhead costs during the short period that it isactually in use. Expressed another way, one finds costly equipment and staffrequired for the peak sitting around virtually unutilized or, at best, under-utilizedin periods of low demand.
Seasonal peaks in demand for air services to and from each country or onparticular routes arise as a result of either institutional or climatic factors. Thedistribution and length of school holidays, the patterns of annual holidays forfactories and offices, religious festivals such as Christmas, the Chinese NewYear or the Haj pilgrimage, and the distribution of major cultural and sportingevents are the main institutional factors creating seasonal traffic peaks. Climaticfactors are important through their effect on holiday patterns and because theydisrupt surface modes of travel. Where institutional and climatic factors coalescethen seasonal peaks become very marked. In the European area, traditionalsummer holidays for schoolchildren and employees coincide with climaticconditions in the Mediterranean basin which are ideal for seaside holidays andwhich are markedly better than in northern Europe. During the summer monthsthere is an outpouring of people moving southwards from northern Europe. The
198 MARKETING—THE ROLE OF PASSENGER DEMAND

effect on airline peaks is dramatic, particularly for the non-scheduled operatorswho cater for much of this demand. In North America, the Christmas holidayseason coincides with very cold winter weather in Canada and parts of the UnitedStates while Florida and the Caribbean bask in warm sunshine. These conditionscreate a peak of demand for air services to the Caribbean area in late Decemberand early January.
Daily or weekly peaks are related to the pattern of working times and daysduring the week. Business travel creates daily demand peaks usually in the earlymorning and early evening and weekly peaks on Mondays or possibly Tuesdaysand on Fridays. In those Muslim countries which have Thursdays and/or Fridaysas days of rest, the business peaks will be different. Leisure traffic is responsiblefor a peaking of demand at weekends, particularly during the peak season. Thesplit of traffic on any route between business and leisure influences the nature ofthe daily, weekly and seasonal variations in demand.
The daily and weekly peaks in demand generally pose a less severe handicap,since there is enough flexibility in most airlines’ operations to enable them tomake sensible use of spare capacity during particular periods of the day or theweek. Maintenance and training flights can be programmed for such slack periods,or aircraft can be leased out for charter work. Many international airlines findthat, on scheduled routes with a high business component, demand falls off at theweekend and they can reduce their frequencies on Saturdays and Sundays. A few,such as the Portuguese carrier Air Portugal, use this spare weekend capacity oncharter flights to meet the needs of the leisure market, which prefers weekendtravel.
It is the seasonal peaks of demand which create more problems and impose thegreatest costs. Seasonal peaks are especially marked for non-scheduled airlinescatering for the inclusive-tour holiday market. As previously pointed out(Chapter 7), they partly overcome their problem by flying their aircraft andcrews intensively day and night during the peak period, thereby achieving veryhigh annual utilization for both aircraft and crew. Some may also try to leasetheir aircraft during their low season to carriers (scheduled or non-scheduled) inother parts of the world who may have a different seasonal pattern of demand.For scheduled airlines, seasonal peaks, though less marked than for non-scheduled airlines, may be more difficult to cope with.
The peak/trough variations in monthly passenger flows in 1989 for a selectionof routes radiating from London are shown in Table 8.2. On all routes exceptParis, Amsterdam and Johannesburg, peak traffic exceeds off-peak traffic by atleast 50 per cent. As expected, the greatest variations are on European charterservices, where the peak traffic may be many times greater than the lowestmonth’s traffic. In fact, there were no charters at all to Athens and Geneva in atleast one month yet heavy charter flows in several other months. Among
FLYING OFF COURSE 199

Table 8.2 Seasonal variations on London routes, 1989
Routes to/from London No. of passengers (total both ways) Peak as % of lowestmonth*
Lowest month(’000s)
Peak month(’000s)
European scheduled:Athens 22 Feb 57 Aug 232Amsterdam 125 Feb 175 Sept 140Paris 224 Jan 272 Aug 121European charter:Athens 0 Jan 34 AugGeneva 0 Nov 64 MarchMalaga 21 Nov 67 Aug 310North Atlanticscheduled:New York 135 Feb 283 Aug 209Toronto 36 Feb 67 Sept 188Los Angeles 44 Feb 74 Aug 169Africa scheduled:Lagos 10 Feb 22 Sept 216Nairobi 12 May 20 Aug 169Johannesburg 22 May 30 Dec 140Asia/Australasiascheduled:Singapore 20 Feb 35 Aug 176Hong Kong 44 Feb 73 July 164Melbourne 11 Feb 16 July 152Middle East scheduled:Jeddah 6 Nov 20 July 333Kuwait 9 Feb 20 Aug 232Dubai 12 Nov 25 March 213Note:* Percentage calculated before rounding off of monthly traffic.Source: Calculated using CAA, UK Airports (monthly).
scheduled routes, it is the Middle East services followed by those across theNorth Atlantic which have the greatest relative excess of traffic at peak periods.Airlines on the North Atlantic, where traffic is dense, have to provide abouttwice as much capacity to meet peak demand as off-peak. It is also noticeablethat most peak months are in the European summer period, that is, July toSeptember, and the lowest month tends to be February. There are exceptions, themost notable being on charter services to Geneva, which show a winter peak
200 MARKETING—THE ROLE OF PASSENGER DEMAND
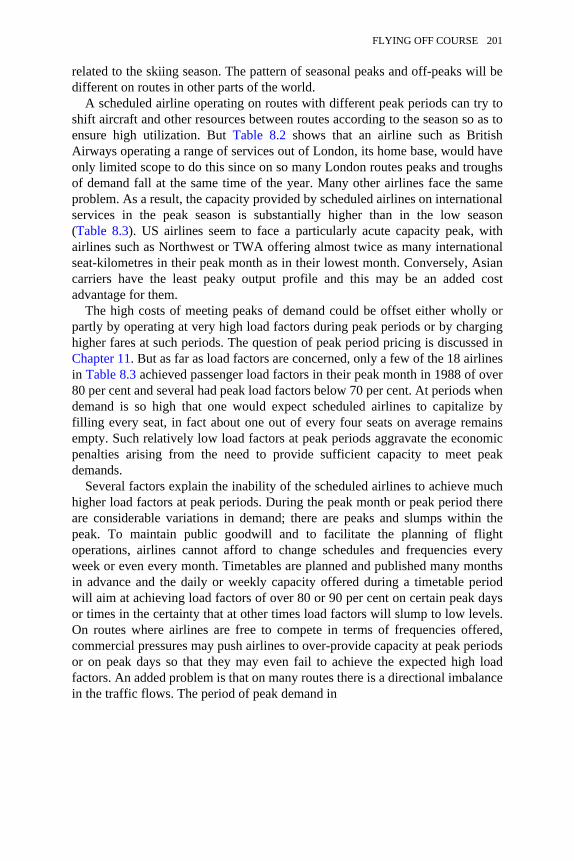
related to the skiing season. The pattern of seasonal peaks and off-peaks will bedifferent on routes in other parts of the world.
A scheduled airline operating on routes with different peak periods can try toshift aircraft and other resources between routes according to the season so as toensure high utilization. But Table 8.2 shows that an airline such as BritishAirways operating a range of services out of London, its home base, would haveonly limited scope to do this since on so many London routes peaks and troughsof demand fall at the same time of the year. Many other airlines face the sameproblem. As a result, the capacity provided by scheduled airlines on internationalservices in the peak season is substantially higher than in the low season(Table 8.3). US airlines seem to face a particularly acute capacity peak, withairlines such as Northwest or TWA offering almost twice as many internationalseat-kilometres in their peak month as in their lowest month. Conversely, Asiancarriers have the least peaky output profile and this may be an added costadvantage for them.
The high costs of meeting peaks of demand could be offset either wholly orpartly by operating at very high load factors during peak periods or by charginghigher fares at such periods. The question of peak period pricing is discussed inChapter 11. But as far as load factors are concerned, only a few of the 18 airlinesin Table 8.3 achieved passenger load factors in their peak month in 1988 of over80 per cent and several had peak load factors below 70 per cent. At periods whendemand is so high that one would expect scheduled airlines to capitalize byfilling every seat, in fact about one out of every four seats on average remainsempty. Such relatively low load factors at peak periods aggravate the economicpenalties arising from the need to provide sufficient capacity to meet peakdemands.
Several factors explain the inability of the scheduled airlines to achieve muchhigher load factors at peak periods. During the peak month or peak period thereare considerable variations in demand; there are peaks and slumps within thepeak. To maintain public goodwill and to facilitate the planning of flightoperations, airlines cannot afford to change schedules and frequencies everyweek or even every month. Timetables are planned and published many monthsin advance and the daily or weekly capacity offered during a timetable periodwill aim at achieving load factors of over 80 or 90 per cent on certain peak daysor times in the certainty that at other times load factors will slump to low levels.On routes where airlines are free to compete in terms of frequencies offered,commercial pressures may push airlines to over-provide capacity at peak periodsor on peak days so that they may even fail to achieve the expected high loadfactors. An added problem is that on many routes there is a directional imbalancein the traffic flows. The period of peak demand in
FLYING OFF COURSE 201

Table 8.3 Peak/trough capacity imbalance on international services, 1988
Rank Seat-km available in peak month as % of lowest month
NorthAmericanAirline
% EuropeanAirline
% Asia/PacificAirline
%
1 SIA 1162 Cathay
Pacific119
3 Swissair 1194 Air India 1215 Thai
International
126
6 KLM 1267 Lufthansa 1288 Qantas 1289 JAL 13010 United 13211 Air France 13412 Air Canada 13913 British
Airways140
14 American 14515 Alitalia 15316 Northwest 17117 Pan Am 17618 TWA 189Source: Compiled from ICAO (1989b).
one direction may correspond with an off-peak level of demand in the oppositedirection. Directional imbalances in traffic levels exist on many routes andusually arise from institutional differences in the markets at each end of the route,such as the timing of annual holidays. Such directional imbalances areparticularly marked on some long-haul routes such as the North Atlantic orEurope to Australia. Lastly, airlines may be unable to match the capacity theyoffer closely enough to the demand to ensure very high load factors at peakperiods. This is because, in trying to reduce the number of aircraft types in thefleet, the aircraft on some routes may be too large in relation to the demand.Aircraft size and frequencies cannot always be tailored precisely to the demandlevels in each market.
Peak problems also exist in the movement of freight by air, but they arefrequently less of a problem than peaks on passenger services. With the
202 MARKETING—THE ROLE OF PASSENGER DEMAND

introduction of the wide-bodied passenger jets which have very considerablefreight capacity in their holds, peaks in the flow of air cargo can be met on manyroutes without the provision of extra peak capacity. A more serious problem inair freighting is the imbalances of flows which arise because freight travels onlyone way, unlike passengers, who generally make a round trip.
Coping with the seasonal variations in demand is a major headache for someairline managements since they affect so many aspects of airline operations.Pricing policies, operating schedules, maintenance and overhaul checks andadvertising campaigns all need to be carefully manipulated in order to minimizethe adverse effect of traffic peaks and slumps on aircraft and crew utilization andon load factors, and through these on unit costs. To mitigate the adverse impactof highly peaked demand, airlines may also lease in aircraft or try to useseasonally employed labour during peak periods. Whatever techniques are usedto diminish its impact, the peak remains a problem to a greater or lesser extentfor all airlines and is an underlying constraint in many aspects of airline planningand marketing.
8.7Factors affecting passenger demand
The demand for passenger services arises from the complex interaction of a largenumber of factors which affect the different market segments differentially.Those factors fall broadly into two groups, which are summarized in Table 8.4:the general economic and supply-related factors that influence demand in allmarkets and the more particular factors that may influence demand on someroutes but may be totally absent on others.
Of the general factors affecting demand, the price of air transport and the leveland distribution of personal income in the markets served are perhaps the mostimportant. Much of the growth of air travel during the last 30 years can beexplained by the falling real price of air transport (as discussed in Chapter 1) andby growth in personal incomes. Accelerated rates of traffic growth in particularmarkets at particular times have usually been due either to rapid growth inpersonal incomes or to falling air fares. The more general economic conditionsalso impact on traffic growth. The world economic climate and the rate ofeconomic growth in particular countries or regions of the world influencedemand in a variety of complex ways. They determine the level of industrial andeconomic activity in each country and more generally the level and nature ofinternational trade. The level of economic activity and trade directly influencesthe growth of demand for business travel. Indirectly, it also influences leisuredemand since it affects the level and growth of personal incomes. Economicfactors such as personal incomes or industrial activity have to be understoodwithin a demographic context. The size and the distribution of the populationsserved by a route impose a major constraint on the level of potential demand.Thus, despite rapidly rising personal incomes in Singapore, the potential demand
FLYING OFF COURSE 203
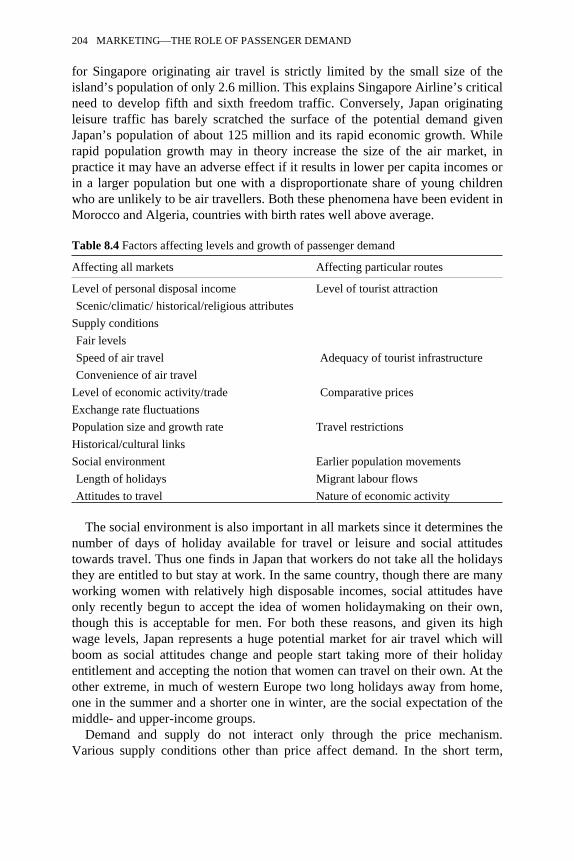
for Singapore originating air travel is strictly limited by the small size of theisland’s population of only 2.6 million. This explains Singapore Airline’s criticalneed to develop fifth and sixth freedom traffic. Conversely, Japan originatingleisure traffic has barely scratched the surface of the potential demand givenJapan’s population of about 125 million and its rapid economic growth. Whilerapid population growth may in theory increase the size of the air market, inpractice it may have an adverse effect if it results in lower per capita incomes orin a larger population but one with a disproportionate share of young childrenwho are unlikely to be air travellers. Both these phenomena have been evident inMorocco and Algeria, countries with birth rates well above average.
Table 8.4 Factors affecting levels and growth of passenger demand
Affecting all markets Affecting particular routes
Level of personal disposal income Level of tourist attractionScenic/climatic/ historical/religious attributes
Supply conditionsFair levelsSpeed of air travel Adequacy of tourist infrastructureConvenience of air travel
Level of economic activity/trade Comparative pricesExchange rate fluctuationsPopulation size and growth rate Travel restrictionsHistorical/cultural linksSocial environment Earlier population movementsLength of holidays Migrant labour flowsAttitudes to travel Nature of economic activity
The social environment is also important in all markets since it determines thenumber of days of holiday available for travel or leisure and social attitudestowards travel. Thus one finds in Japan that workers do not take all the holidaysthey are entitled to but stay at work. In the same country, though there are manyworking women with relatively high disposable incomes, social attitudes haveonly recently begun to accept the idea of women holidaymaking on their own,though this is acceptable for men. For both these reasons, and given its highwage levels, Japan represents a huge potential market for air travel which willboom as social attitudes change and people start taking more of their holidayentitlement and accepting the notion that women can travel on their own. At theother extreme, in much of western Europe two long holidays away from home,one in the summer and a shorter one in winter, are the social expectation of themiddle- and upper-income groups.
Demand and supply do not interact only through the price mechanism.Various supply conditions other than price affect demand. In the short term,
204 MARKETING—THE ROLE OF PASSENGER DEMAND

frequency, seat availability, departure and arrival times, number of en route stopsand other supply features influence the level of demand and the distribution ofthat demand between competing carriers. In the long term, it is the improvementsin the overall speed and convenience of air transport that have had the mostsignificant effect on demand. This is particularly true over medium- and long-haul distances where the speed advantage of air increased so dramatically in the1960s and 1970s that effective surface competition by rail, road or sea haslargely disappeared.
In addition to the above general considerations affecting all markets, severalother factors, which may be particular to individual routes, also influencedemand levels. These are factors which may explain growth on some routes butnot on others. Demand for holiday trips is related to the tourist attractiveness ofparticular destinations. In order to be attractive and have tourist potential, resortareas or towns need two things: they must enjoy certain preferably uniquescenic, climatic, historical or cultural advantages; they must also have the rightinfrastructure to cater for tourist needs such as sufficient hotel beds of the rightstandard, adequate ground transport, restaurants, entertainments, shoppingfacilities, and so on. An attractive tourist location without the necessaryinfrastructure is not enough to generate a significant volume of demand forholiday travel, as many Third World countries have found. The two must gohand in hand. Tourist facilities in themselves may not be enough. They must bepriced correctly for the market they hope to attract and in relation to competingdestinations. Changes in the relative price levels of hotels and other facilities in atourist resort area may accelerate or retard traffic growth on particular air routes.Changes in the relative costs of holidays in a country may come about as a resultof internal economic conditions or even government decisions. But they mayalso be generated by fluctuations in the exchange rates. Often switching oftourist demand from one destination to another or a sudden acceleration ofoutward-bound tourists from a particular country can be related to changes in therelevant exchange rates. When in 1986 the value of the US dollar collapsedagainst most European currencies and the yen, falling from DM2.91 to DM2.17and then DM1.80 in 1987, Europe became less attractive for American tourists.Conversely, because of the fall in the value of the dollar, travel from Europe tothe United States was stimulated in the late 1980s. Exchange rate fluctuations oreven political factors may induce governments to impose travel restrictions ontheir own citizens. These may take the form of bans on external travel, theimposition of travel taxes for outgoing travellers or restrictions on the amount offoreign exchange which can be taken out for travel purposes. During the 1980s,Taiwan, South Korea, the Philippines, Indonesia and Thailand all restrictedtravel for some time by one or more of these measures. When in 1989 Taiwanallowed its citizens to travel to mainland China there was a sudden boom in airtraffic between Taipei and Hong Kong. Equally the democratization of easternEurope in 1990 and the easing of travel restrictions would lead to a surge ofdemand on air routes that were previously rather thin.
FLYING OFF COURSE 205

Ultimately, of course, leisure travel is also related to taste. Tourist destinationscan inexplicably fall into or out of favour. In 1988, when air travel from the UKto most Mediterranean destinations remained more or less static, the number ofpassengers flying to Turkey shot up by 84 per cent, much of it on charter flights.This surge was attributed largely to a switch of demand from other destinations,notably Greece whose traffic actually declined by 5 per cent in 1988.Comparative inclusive holiday prices may have favoured Turkey, but it was alsoa question of changing tastes.
The visiting friends and relatives demand is clearly affected by earlierpopulation movements and migrations, which are very specific to particularroutes. The heavy volume of demand on routes between France and Morocco,Algeria or Tunisia is related to the large number of immigrants from thesecountries living and working in France. There is little VFR traffic on routesbetween North Africa and the UK. On the other hand traffic demand between theUK and Canada, the West Indies, Pakistan and Australia or from Singapore tosouthern India or Sri Lanka can be explained only by earlier populationmovements. The same is true of the demand between the United States and Israelor the United States and Ireland. Many earlier migrations of population wererelated to the colonial period of history. Colonial ties have also resulted inlinguistic and cultural links between particular pairs of countries which generatecertain types of leisure travel but also considerable student travel. Large numbersof Singaporean, Malaysian or Hong Kong students go to the English-speakingcountries, such as Australia, the UK or the United States to study. Students are animportant component of demand on the air routes between their home countriesand their place of study. The cultural and linguistic ties also generate travel forcultural events, for conferences, and so on. Such ties affect trading patterns andthereby they may also influence business travel. Population migrations for workor settlement are still going on. The United States, Canada and Australia are stillattracting and allowing immigrants from certain other countries and these swellthe number of air passengers on the respective routes. In other parts of the worldduring the 1980s relatively dense traffic flows were generated by movements ofmigrant labour, such as those from the Philippines, South Korea or Pakistan toSaudi Arabia and other Middle East states.
The demand for business travel is related to several factors, not just the level oftrade and commercial interaction between two city pairs. It would seem that thenature of industrial, commercial and other activities in an airport’s hinterland isan important determinant of the level of business travel demand. Certainactivities appear to generate more business trips than others. In Britain,manufacturing industry generates a disproportionately high level (close to 40 percent) of business travel but accounts for only 27 per cent of employment (CAA,1989b). Administrative capitals obviously generate a great deal of government-related travel. Equally there is some evidence that major international portsgenerate a disproportionate amount of business air travel. Then there are veryspecific industrial situations which may stimulate, often for a short term, a rapid
206 MARKETING—THE ROLE OF PASSENGER DEMAND

growth in demand for air services. The exploration and development of a newoilfield or the construction and commissioning of a new industrial complexwould be two such examples.
The pattern and growth of demand on any route can be understood only byreference to the economic and demographic characteristics of the markets ateither end of the route and to the supply features of the air services provided, ofwhich price is the most important. However, when examining traffic growth onan individual route one must also consider any particular or localizedcircumstances affecting demand on that route, such as the tourist attractivenessof one or both ends of the route, the historical and cultural ties between the twomarkets served, the impact of exchange rate fluctuations, earlier or currentpopulation movements, and so on. These various factors provide an explanationof the growth and current level of demand on a route. Changes in any of themwill affect the growth of demand in the future. None the less, the overall demandfor air travel, like that for most goods or services, seems ultimately to be mostclosely related to its price and to the income levels of its consumer. The impact ofprice and income on demand are therefore worthy of more detailed consideration.
8.8Income and price elasticities of demand
Historically, leisure travel has shown a marked responsiveness to personal incomelevels. Early surveys of air passengers, such as those done at the University ofMichigan (Lansing and Blood, 1964), established that two things happen aspeople’s personal incomes rise. First, they spend more on all non-essentials. Thisincludes greater expenditure on travel by all modes. Second, air transport, whichis the high-cost but more comfortable and convenient mode for longer journeys,becomes more competitive with surface travel and there is a shift of demand fromsurface modes to air. In other words, higher incomes result in greater expenditureon longer-distance holiday and VFR travel, and at the same time a higherproportion of that expenditure goes on travel by air rather than surface. Therelationship between income changes and demand for air travel can be measuredby an income elasticity. This is arrived at quite simply by dividing the percentagechange in demand generated by an income change by the percentage change inpersonal income which brought about that shift in demand:
Thus, if a 3 per cent increase in personal income results in a 6 per cent growth indemand for air travel, then the income elasticity is 6 per cent divided by 3 percent, which is +2.0. This means that every 1 per cent variation in income willinduce a 2 per cent change in demand.
FLYING OFF COURSE 207

In examining traffic development on a route or group of routes over time inorder to establish what the impact of income changes has been, a number ofproblems arise. The first is how to isolate or exclude the impact of othervariables, such as fare changes, on demand. This is done by using multipleregression techniques, which in turn pose certain methodological problemsdiscussed in the next chapter. Secondly, there is the question of how to measurepersonal income. Ideally one would like to use a measure of the personaldisposable income (after adjustment for inflation) of the population in a market orof the populations served at either end of a route. But disposable income data arenot always available and countries tend to calculate it differently. Proxymeasures have to be used for disposable income. Gross national product (GNP)or gross domestic product (GDP) are frequently used but may be converted intoper capita gross domestic product. The latter is itself problematical in that itassumes a fairly even distribution of income among a country’s population,which frequently is not the case. Both the British Airports Authority (BAA plc)and the UK’s Civil Aviation Authority in their forecasts use an index ofconsumer expenditure as a readily accessible measure of the income available toconsumers in different countries. Thirdly, since air travel for leisure is arelatively new form of expenditure, one can assume a higher rate of growth inthe early stages of increasing incomes and then a gradual saturation as people onhigh incomes get to the stage where they cannot easily consume more leisuretravel (see Table 8.5 below). If income elasticities are changing over time, it maybe misleading to base forecasts on elasticities derived from past data. Lastly,there may be difficulties in establishing different income elasticities for thedifferent segments of the leisure market, such as inclusive tours or independentholidays, or for VFR travel.
One would not expect the demand for business travel to be closely related toper capita income since business travellers’ expenditure patterns are related notto their own personal incomes but to the needs of their employers. On the otherhand, several studies have found that gross domestic product or some othermeasure of a country’s national income or wealth does correlate with the volumeof business traffic generated. It is not difficult to accept that business activity andtravel will increase as a nation’s total wealth grows. Thus it has proved possibleto establish income elasticities for business travel but based on changes innational rather than in per capita income.
Most demand studies in recent years have produced results indicating incomeelasticities for various categories of passengers which are usually between 1.5and 2.5. In 1976 the then British Airports Authority carried out a forecastingstudy of traffic for 12 major west European airport authorities (BAA, 1978).Using data for the period 1965–75, it produced aggregated income elasticitieswhich were as follows:
208 MARKETING—THE ROLE OF PASSENGER DEMAND

Income elasticityShort-haul leisure 2.3Long-haul leisure 2.0Short-haul business 1.6Long-haul business 1.2
These figures indicate the lower income elasticities for business travel which area feature of most studies (e.g. DoT, 1978, 1981; and CAA 1989a). Subsequently,in 1989 using more recent data and on a more disaggregate basis, BAA plccalculated income elasticities which it could use for forecasting traffic demandthrough London’s airport. The predicted income elasticities for the internationalleisure segments are shown in Table 8.5. The BAA no longer calculates incomeelasticities for business demand since it finds that trade is a more significantvariable for business travel than income. Amsterdam airport does the same(Veldhuis, 1988). Yet, even when using trade as an income-related variable, onefinds that business travel is relatively trade inelastic. Amsterdam airport hasfound that the trade elasticity of business travel is between 0.8 and 1.0.
The responsiveness of demand to price or fare changes can also be measuredin terms of an elasticity coefficient:
Unlike income elasticity, price elasticity is always negative since price anddemand must move in opposite directions. If the fare goes up, demand isexpected to fall and vice versa. So there is invariably a negative sign in theequation. If fares go up 3 per cent and demand drops 6 per cent, then the priceelasticity is (−6%)÷(+3%)=−2.0.
Most of the problems previously mentioned which have to be faced whenestimating income elasticities also arise in price elasticity studies, but there aresome additional ones too. In examining traffic and fare data, for a route or severalroutes over a period of time, which fare should one choose to indicate pricechanges? Not only will there be several fares on each route, but the number offares and their relative levels may have changed over time. Problems multiplywhen fares vary by season of the year. Some analysts might use the basiceconomy fare or the most widely used fare or, if it is available, the average yieldobtained by the airline. Alternatively, some have overcome this problem byestablishing different price elasticities for different fare groups (Straszheim,1978). It is the real level of the fare in constant value terms that is significant,not the current level. Therefore fares have to be adjusted for price inflation so asto establish the real cost of air travel in relation to the cost of other goods and
FLYING OFF COURSE 209

Table 8.5 Predicted income elasticities for international leisure trips to and fromLondon’s airports
Leisure segment 1989–93 1994–8 1999–2005
Short haul:UK resident 2.0 1.8 1.7Non-UK resident 1.8 1.8 1.7
North Atlantic:UK resident 2.0 2.0 2.0Non-UK resident 1.6 1.8 1.5
Middle East:UK resident 2.0 2.0 2.0Non-UK resident 2.0 2.0 2.0
Long haul (excluding N. America and Middle East):UK resident 2.0 2.0 2.0Non-UK resident 2.2 2.2 2.2
Source: BAA plc (unpublished).
services. On international routes this means making different adjustments ateach end of the route. An additional problem in establishing fare elasticities isposed by the inclusive tour (IT) passengers, who have no knowledge of the costof the fare within their total holiday package price. Moreover, IT fare changeswill have a disproportionately small impact on the total holiday price paid by theprospective IT consumer.
In so far as business travellers do not pay for their own travel, one wouldexpect them to be relatively insensitive to fare changes. This should be reflectedin lower price elasticities for business travellers or for high-fare traffic categorieswhich are composed primarily of business travellers. An examination of priceelasticities in some studies shows this to be true. Whereas non-business traveltends to have price elasticities greater than −1.0, the price elasticity of businesstravel is less than −1.0 and in the case of first-class travel on the North Atlantic itwas as low as −0.65 (Straszheim, 1978). This was before the days of separatebusiness-class cabins. Conversely, the most price sensitive market segments arethose at the lower end of the market, that is, the high-discount fare groups and, inEurope, the inclusive tour segment of the market. The same study of North Atlantictraffic mentioned above (Straszheim, 1978) found that the price elasticity for fulleconomy passengers was −1.5 while for the high-discount market it was as highas −2.7.
Economic textbooks deal at length with the concept and the mathematics ofelasticity. It is not opportune to discuss the complexities of the concept here.Suffice it to say that, in order to make pricing and other marketing decisions,airline managers need to have a feel for the price elasticity of the various marketsegments on the route or routes they are dealing with. Without such a feel, they
210 MARKETING—THE ROLE OF PASSENGER DEMAND

may make major planning and pricing errors. They basically need to knowwhether their markets are price elastic or inelastic. If the price elasticity ofdemand in a particular market is greater than −1.0, that is, if it is −1.1, −1.2 ormore, the market is considered to be elastic. This means that a change in theprice or fare has a more than proportional impact on demand. If the fare isreduced, demand will grow more than in proportion. Though each passenger willbe paying less than before, many more passengers will be travelling, with theresult that the total revenue generated will go up. Conversely, a fare increase inan elastic market has such an adverse effect on demand that total revenue willdecline despite the fare increase. When the price elasticity is less than −1.0, as inthe case of the first-class market on the North Atlantic where it may be around−0.65, demand is inelastic. Fare changes have a proportionally smaller impact ondemand levels. In such market conditions, fare increases will generate greatertotal revenue because demand will not fall off very much. On the other hand, farereductions will stimulate some traffic growth, but it will be proportionally lessthan the drop in fare, so total revenue will decline.
The easiest way of appreciating the pricing and revenue implications ofdifferent price elasticities is to consider a simple example. Let us assume that ona short-haul international route an airline is flying a daily return service with a200-seater aircraft. It is the only operator and the fare is $100 one way. The dailytraffic and revenue on the route can be summarized thus:
Total seats offered per day (200 each way) =400Business passengers (approx. 50 each way) =100Leisure passengers (approx. 50 each way) =100Daily seat factor 50%Revenue from business market (100×$100) =$10,000Revenue from leisure market (100×$100) =$10,000Total revenue per day =$20,000
Because of an increase in fuel costs, the airline needs to increase revenue on theroute by about 4 per cent. In the short term, costs cannot be reduced in otherareas, so the marketing manager is required to generate the additional revenuethrough tariff changes. The instinctive reaction would be to increase fares by 6per cent or so. However, earlier market research had established that, whilebusiness demand is relatively inelastic to fare changes, with an elasticity of −0.8,the leisure market is price elastic with an elasticity of −2.0. Using these priceelasticities the marketing manager estimates the traffic and revenue impact of a10 per cent increase in the fare from $100 to $110.
The business price elasticity of −0.8 tells him that, for every 1 per centincrease in the fare, the airline will lose 0.8 per cent of its market. Thus a 10 percent fare rise results in an 8 per cent loss of business travellers (i.e. change indemand =+10%×−0.8 =−8.0%). So their daily number will decline from 100 to92. Leisure traffic, being more elastic to price changes, will drop more, by 20 per
FLYING OFF COURSE 211

cent (or −2.0 per cent for each 1 per cent increase in fare), to 80 passengers onaverage each day. The revenue implications of a 10 per cent fare increase aresurprising:
Impact of $110 single fare92 business passengers at $ 110 = $10,12080 leisure passengers at $110 = $8,800172 passengers Total revenue $18,920
Seat factor = 43%
Revenue from business travellers would go up because, though fewer wouldtravel, the drop in traffic is more than compensated for by the higher fare theyare all paying. But leisure passengers react in larger numbers to the higher fareand total revenue from this segment of the market would go down markedly. Thenet result is that, if the airline followed an instinctive reaction and increased thefare by, say, 10 per cent, it would end up with a significant fall in traffic, and acollapse of the seat factor from 50 per cent to 43 per cent. This in turn wouldlead to a drop in total revenue. Too often airlines fail to appreciate that increasingfares may reduce rather than increase their total revenues.
What would be the effect of reducing the fare by 10 per cent to $90? Bothbusiness and leisure demand would increase—the former by 8 per cent (i.e. −10%×−0.8=+8%) and the latter by 20 per cent. Using the price elasticities as before,the traffic and revenue implications can be calculated:
Impact of $90 single fare108 business passengers at $90 = $9,720120 leisure passengers at $90 = $10,800228 passengers Total revenue $20,250
Seat factor = 57%
The lower fare would generate 28 more passengers each day and the seat factorwould jump to 57 per cent, a creditable improvement from the current 50 per cent.Most of the additional passengers would be leisure passengers, who are moreprice elastic, and revenue from this sector of the market would increase. Whilethere would also be more business travellers, business revenue would declinebecause the 8 per cent increase in passenger numbers would not be sufficient tocompensate for the 10 per cent drop in the fare paid. Total revenue wouldincrease by $520, which might do little more than cover any additional costssuch as in-flight catering imposed by the extra 28 passengers. Cutting fareswould produce a better revenue result than increasing the fares, but it still fails togenerate the additional revenue required.
Examination of the above figures suggests that revenue could be maximizedby a two-fare price structure. The airline should charge the business travellers
212 MARKETING—THE ROLE OF PASSENGER DEMAND

more because their demand is relatively inelastic to price. But it should chargeless to the price-elastic leisure market, knowing that lower fares will generateproportionally more demand and thereby increase total revenue from this marketsegment.
Impact of two-fare price structure92 business passengers at $110 = $10,120120 leisure passengers at $90 = $10,800212 passengers Total revenue $20,920
Seat factor = 53%
By introducing separate fares for each market segment, the airline can increaseits total revenue by 4.6 per cent and its seat factor by three points to 53 per cent.The net revenue gain might be less because there may be some extra costsinvolved in carrying 12 more passengers. This solution also presupposes that theairline can create effective tariff ‘fences’ to prevent slippage of businesspassengers into the low-fare market. Simply put, the above example illustratesthe principle that, in price-elastic markets, low fares may increase total revenueand that conversely, where demand is inelastic, higher fares will generate highertotal revenue.
It must be emphasized that even on a simple route the best pricing solution isdependent on two variables, the price elasticities of the different marketsegments and the market mix that is the proportion of the total marketrepresented by each segment. In the above example, the pricing policy adoptedmight be different if business travellers represented 90 per cent of the market orif the price elasticity of leisure demand was −2.4 instead of −2.0.
In order to produce medium-term forecasts of European scheduled passengertraffic, the Association of European Airlines (AEA, 1989) has estimated priceand income elasticities of demand for air travel between each country in Europeand the rest of Europe (Table 8.6). These show that scheduled air travel withinEurope is generally not very price sensitive, though the highest price elasticitiesare found among poorer countries. Conversely, intra-European travel demand isrelatively sensitive to income changes (measured in terms of GDP), withparticularly high income elasticities among the countries with lower per capitaincomes.
The concept of demand elasticity can be taken further to establish the reactionof passenger demand to changes in other variables. For instance, it is possible tocalculate a journey time elasticity of demand. This would show that businesstravel is the most responsive to reductions in journey time and VFR demandprobably least responsive. There is also the concept of cross-elasticity. Thismeasures the impact on the demand for air travel of changes in the price ofcompeting goods or services. One study has established the cross-elasticity of
FLYING OFF COURSE 213

demand for international leisure air travel from Australia with respect to changesin domestic air fares or domestic hotel rates
Table 8.6 Price and income elasticities of demand for scheduled air travel within Europe
Country Price elasticitya Income elasticityb
High-income countries:Scandinavia −0.31 +2.41France −0.50 +1.90Switzerland −0.54 +1.86Germany −0.75 +2.64Low-income countries:Portugal −0.19 +3.04Turkey −0.62 +3.11Ireland −0.92 +1.52Greece −1.21 +5.59Notes:a Price is measured in terms of average yield per passenger on intra-European routes.b Income is the real gross domestic product of each country (i.e. adjusted for inflation).Source: AEA (1989).
(Taplin, 1980). Changes in fare structure and levels on the North Atlantic haveresulted not only in changes in the total demand but also in significant shifts ofdemand between fare types, between scheduled and charter and also to someextent between seasons, since fares vary by season. One or two studies haveattempted to establish cross-elasticities within the air market (Kanafani et al.,1974). Others have established an exchange rate elasticity of demand (CAA,1989a).
Different studies even of the same markets seem to produce different incomeand price elasticities. Airlines may have difficulties in choosing between them.Larger ones may carry out their own studies to establish elasticities on the routesthey are most interested in. If they can overcome the data and methodologicalproblems, they must still face up to the fact that the elasticities are based onhistorical traffic data, which may be influenced by particular variables other thanfare or income which have not been included in their analysis. There is theadditional problem that price, income or other elasticities are changing overtime. This is inherent and inevitable. Since elasticities are based on proportionalchanges in demand, such proportions change as the total demand changes. In theexample used above, once the fares have changed from the $100 starting level toa new fare generating a different level of demand, then the price elasticities atthat new demand level will have changed too. The change may be a relatively smallone, but it will result in a different price elasticity of demand.
The pragmatic and methodological problems involved in establishingelasticities should not induce airlines to abandon the concept. Some
214 MARKETING—THE ROLE OF PASSENGER DEMAND

understanding of elasticities is so crucial for pricing, marketing and forecastingthat they cannot be ignored. Even an approximate appreciation of price andincome elasticities for the major market segments will help airlines make moresoundly based decisions.
FLYING OFF COURSE 215

9Forecasting Demand
9.1The need for forecasts
Forecasting is the most critical area of airline management. An airline forecastsdemand in order to plan the supply of services required to meet that demand.Broadly speaking, tactical or operational decisions stem from short-term trafficforecasts covering the next 6–18 months or so, and are included in the airline’soperating plan and budget for the current and the coming financial year. Aircraftscheduling decisions, maintenance planning, advertising and sales campaigns,the opening of new sales offices are among the many decisions which ultimatelyare dependent on these shorter-term forecasts. There are in addition a range ofstrategic decisions, many related to an airline’s corporate plan and objectives,which stem from long-term forecasts. Decisions on aircraft procurement, theopening-up of new routes or markets, the training of new flight crews, investmentin new maintenance facilities and similar strategic decisions all stem fromlonger-term forecasts of up to five years or longer. Almost every tactical orstrategic decision taken within an airline stems ultimately from a forecast. At thesame time, forecasting is the area in which mistakes are most frequently madeand the one about which there is least certainty. There is no absolute truth inforecasting, no optimum method that can guarantee accuracy. Instead, airlineforecasters use any one of a range of forecasting techniques, of varyingmathematical complexity, each of which has advantages and disadvantages, noneof which can ensure consistent accuracy. Yet forecasts have to be made since somany decisions flow from them.
The annual budgets and the longer-term plans on which so many supplydecisions hinge start with forecasts of passenger and freight traffic. Forecastinginvolves different type of forecasts, each of which poses different methodologicalproblems. In the first instance, airlines need to forecast traffic growth assuming acontinuation of current operating conditions with no dramatic changes in fares orin other supply factors. They will forecast the global growth of passenger and/orfreight traffic on a route, group of routes or geographical region. Such forecastsrepresent the total demand, from which the airline then has to predict its own

share and its own traffic. Such forecasts essentially involve an assumption thattraffic growth will continue in the future very much as it has done in the past.
Airlines must also be able to forecast the response of demand to a change in theconditions of supply. Such changes may include an increase or reduction in thereal level of fares, a change from narrow-to wide-bodied aircraft, a markedincrease in frequencies or a change in departure times. A significant change insupply conditions may be under consideration by the airline itself or change maybe imposed by one or more of its competitors. In either case, an airline must bein a position to forecast traffic reaction to such change.
A somewhat different forecasting problem exists when an airline is trying toforecast demand on a new route which is under evaluation. This may frequentlybe a route on which there have been no direct air services at all previously, or itmay be a route on which the airline concerned is a new entrant. In either case theairline has no experience and little or no historical traffic data on which to baseits forecasts. This is particularly so if the route has had no previous air servicesat all. Forecasting in such circumstances is clearly very difficult, with a high riskof error, and may require different forecasting techniques from those normallyused.
Lastly, there is the question of segmental forecasting. Passenger traffic on aroute is composed of identifiable market segments related partly to purpose oftravel and partly to service requirements. Such segments may be furthercategorized by point of origin. The earlier analysis of demand factors indicatedthat each market segment is likely to have differing demand elasticities and to begrowing at different rates. It should therefore be possible to produce more accurateforecasts by forecasting the growth in each market segment separately and thenaggregating them, rather than by forecasting the total traffic from the start. Someairlines already do forecasts using two market segments, business and non-business, or possibly three based on fare type. Only a handful of airlines have theresources to carry out more extensive segmental forecasting. In the future,however, planning requirements and the need to improve the accuracy offorecasts may push more airlines to consider this disaggregate forecasting.
The aim of this chapter is not to suggest the best way of forecasting but toreview some of the problems of forecasting and the alternative techniques whichare most commonly used in the international airline industry, without going toodeeply into their mathematics. As a result, this is not an exhaustive review, sincesome forecasting tools, little used by airlines, are not examined. The forecastingmethods more widely used by airlines, often in combination, fall broadly intothree groups of growing complexity: qualitative methods, time-series projectionsand causal methods.
FLYING OFF COURSE 217
9.2Qualitative methods
9.2.1EXECUTIVE JUDGEMENT
Of the numerous forecasting techniques available to airlines, executivejudgement is one of the most widely used, usually to modify and adapt othermore mathematical forecasts. Such judgement is based on the insight andassessment of a person, who often may not be a forecaster, but who has specialknowledge of the route or market in question. For instance, the country or areamanagers of an airline are frequently asked to predict traffic growth on theirroutes. Their knowledge will include an understanding of recent and currenttraffic growth and of economic and other developments likely to affect futuredemand. They weigh up the factors involved and therefore their judgement andtheir predictions may be quite soundly based, but the approach is basically crudeand unscientific. The more detailed and the more long-term the forecast, themore likely it is that executive judgement will prove inadequate. On the otherhand, executive judgement as a forecasting tool has two distinct advantages. It isquick. Forecasts can be made almost instantaneously and do not require anydetailed assessment or working out of data. In addition, the person making theforecast may be aware of extraneous and particular factors which may affect futuredemand on a route, which the more data-based techniques would not pick up. Itis for this reason that many airlines subject their data-based forecasts toassessment and possible modification by certain key managers and executives.
9.2.2MARKET RESEARCH
A wide range of market research techniques can be used by airlines in order toanalyse the characteristics of demand for both passengers and freight. Thesetechniques will include attitudinal and behavioural surveys of passengers and, itis hoped, those not travelling by air. They will also involve studies of hotel andtourism facilities, surveys of travel agents and business houses, analyses of tradeflows and other business interaction, and so on. Such studies might becommissioned from specialist market research companies or they might becarried out by the airlines themselves. Many larger airlines in any case carry outregular and systematic surveys of their own passengers so as to build up a profileof their needs and characteristics. Others carry out such surveys on an ad hoc basiswhen a specific question needs to be resolved. The aim of all this is to deriveempirically an understanding of how demand for air transport varies betweendifferent sectors of the population or, in the case of air freight, between differentindustrial sectors. This knowledge can then be used in combination with
218 FORECASTING DEMAND

forecasts by others of sociological, demographic or economic change to predictfuture levels of demand.
In many circumstances such an empirical approach to forecasting may bemore appropriate than the more econometric methods. On an air route where thedemand for air travel is suppressed by the inadequate number of hotel beds at thedestination, a study of hotel and tourism infrastructure projects at that destinationmay produce a better indication of future travel flows than would an analysis ofpast traffic trends. Equally the forecasting of air freight demand often lends itselfto the use of market research studies, especially on routes where freight flows arerelatively thin. On many routes the erratic and irregular growth of air freightmakes time-series analyses or other econometric techniques difficult to use. Airfreight forecasting models have generally been less successful than models forforecasting passenger demand. On most air routes, the goods freighted by air fallinto a limited number of clearly defined commodities. Exports by air from manydeveloping countries are usually confined to one or two commodities, whileimports are quite different and cover a wider, though still limited range of goods.As a result, air freight forecasts may often fruitfully be based on market researchanalysis of trade developments in a few key commodities.
Market studies are particularly useful as a forecasting tool when past trafficdata are inadequate or non-existent, thereby prohibiting the use of time-seriesand possibly of econometric forecasts too. This happens on many routes fromdeveloping countries and is obviously the case on entirely new routes. In thesecircumstances market research may be the only way of evaluating future demand.Market research also helps airlines to forecast demand reaction to changes insupply conditions and to gain an appreciation of their different market segmentsif they wish to get involved in segmental forecasting.
9.2.3DELPHI TECHNIQUES
The Delphi approach requires the building up of a consensus forecast based onthe views of individuals who are considered to have sufficient expertise to beable to anticipate future trends. The process is an iterative one, possiblyinvolving several rounds of consultation. In simple terms, a group of experts maybe asked to give their forecasts of growth in a region or market. These forecastsare used to build up a composite forecast. This is then communicated to eachexpert who may wish to revise their own original forecast in the light of whatother experts are predicting. The individual forecasts from this second round ofconsultations can be used to arrive at an agreed or consensus forecast. This is theprinciple of the Delphi method. In practice, the consultative process can be moreor less complex depending on the amount of information exchanged between theexperts.
The Delphi technique is more suitable for aggregate forecasts of growth inmajor markets or regions than for individual route forecasts. As a result it is little
FLYING OFF COURSE 219

used internally by airlines, but it was the basis for the industry-wide forecastsproduced annually by the International Air Transport Association (IATA). Theseare regional forecasts for nearly 20 route areas such as Europe-Middle East orMiddle East-Far East. Forecasts by direction are produced for freight traffic too.The forecasts cover the current year and a five-year period ahead and are revisedeach June, sometimes with interim revisions during the winter. Up to 1986 theseIATA forecasts were Delphi forecasts based on a consensus of expert opinionand were arrived at in a series of steps.
The first step involved the development of explicit forecasting assumptions ata meeting of airline forecasters and key experts from outside the airline industry.The purpose of this meeting was to develop the best possible backgroundscenarios and explicit regional assumptions for the changes in the real level oftariffs and in the major economic indicators affecting demand. The assumptionsand data bases were communicated to the airlines participating in the forecastingexercise. The airlines were then requested to submit their own forecasts for theindustry as a whole and for each route area or market on which they operated.Airlines were free to use whatever forecasting method they preferred in arrivingat their own forecasts and could even make alternative key assumptions if theywished to. The results of this first round were distributed to all participatingairlines for review before the finalization meeting. This took place in early June.The experts reviewed the consolidated regional forecasts, made adjustments inthe light of more recent developments and may also have consideredeconometric forecasts made by some member airlines.
The IATA forecasts were then finalized and widely distributed throughout theworld. These forecasts represented a consensus of expertise within the airlineindustry. However, this Delphi approach was very time consuming and in recentyears IATA has reverted to a simpler approach based on a compilation ofindividual airline forecasts. The IATA annual forecasts are used by smallerairlines as inputs into their own forecasting processes and by larger airlines as acounter-check to their own internal forecasts. Airport authorities, aircraftmanufacturers and governments also refer to the IATA forecasts.
9.3Time-series projections
Time-series or trend projections represent the forecasting technique most widelyused by international airlines. Many smaller airlines do little else. Essentially thetechnique involves a projection into the future of what has happened in the past.It assumes that whatever factors affected air traffic in the past will continue tooperate in the same manner in the future. The only independent variable affectingtraffic is time, and as time progresses so will traffic.
To establish the relationship between traffic (the dependent variable) and time(the independent variable), it is essential to have accurate and detailed trafficstatistics for the route in question. Without such data, trend projections cannot be
220 FORECASTING DEMAND

used. The first step in the forecasting process is to plot the time-series data on agraph so as to show monthly or annual traffic totals against the appropriatemonth or year. Drawing a freehand curve through the points should indicatewhether the traffic trend on the route is exponential or linear (Figure 9.1). Anexponential trend is one where traffic seems to grow by a constant percentagewith each unit change in time. This means that the absolute increase in each timeperiod in passenger numbers or freight tonnes is greater than in the previousperiod. This is because each successive growth is a constant percentage but of alarger preceding total. The equation of the exponential curve is given by
where a is constant and b is the rate of growth and t is time. A linear or straight-line trend is one where the traffic increases by a constant absolute amount witheach unit of time. It is expressed in the form
where a and b are constants and t is again time. Because changes for each unit oftime are by a constant amount and the total traffic is growing, the percentagegrowth is gradually declining. There is therefore a fundamental differencebetween the impact of exponential as opposed to a linear growth trend onforecasts of traffic growth. Exponential growth means ever greater annual ormonthly traffic increments, though the percentage change may be more or lessconstant. Linear growth would indicate constant increments and decliningpercentage changes. Deciding which trend best represents developments of aroute will therefore have a major impact on forecasts, especially longer-termones. There is also the possibility that growth on a route may be linear in itsearly stages and then become exponential or vice versa. An added problem isthat at times it might be difficult to decide whether an exponential or linear trendfits the data best, yet choosing between them will produce quite differentforecasts.
It has been observed that some air routes or markets, after achieving very rapidgrowth for a number of years, reach a plateau where traffic growth flattens off. Itis frequently assumed that this plateau level is reached when the market is in somesense saturated. If this has happened or is happening on a route, the trend of pasttraffic data may best be described by growth curves which asymptoticallyapproach an upper limit such as a logistic curve or a Gompertz curve. Both ofthese are S-shaped and indicate declining absolute and relative growth asmarkets reach maturity. In practice, international airlines tend not to use logisticor Gompertz trend curves for forecasting. Most time-series forecasting is eitherexponential or linear. Of these, the former is probably more widely used bothbecause of its simplicity and also because past air traffic trends do often appearto be exponential.
FLYING OFF COURSE 221
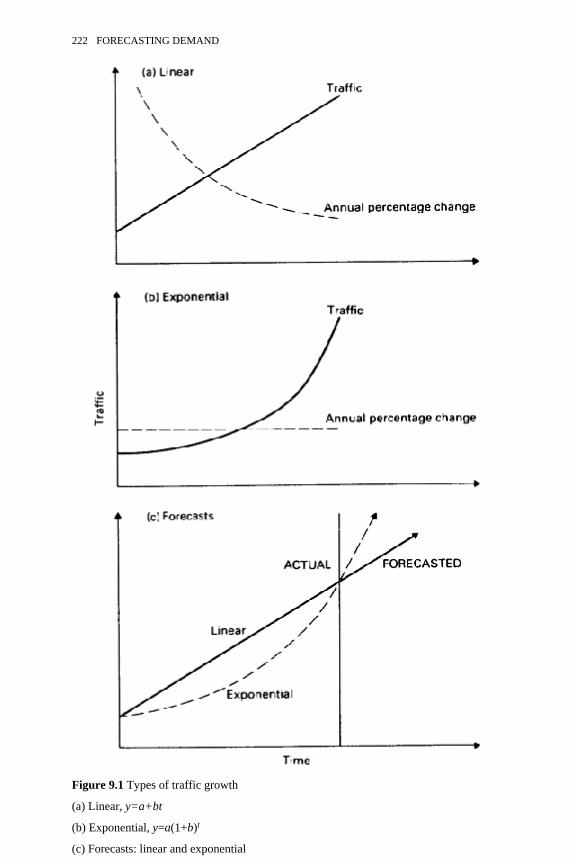
Figure 9.1 Types of traffic growth
(a) Linear, y=a+bt
(b) Exponential, y=a(1+b)t
(c) Forecasts: linear and exponential
222 FORECASTING DEMAND

The workings and implications of different time-series techniques can best beappreciated by using them to make forecasts for an actual route. The case studychosen is London to Nice, a short-haul scheduled route with, until recently,relatively little charter traffic and little indirect traffic transiting via Paris orelsewhere. The case study assumes that one is now in 1984 and wishing toforecast the traffic on the route for 1988, five years hence. For reasons of simplicitythe forecasts for individual years prior to 1988 are not discussed.
To make time-series forecasts, a minimum of 7–10 years of past traffic dataare required and some forecasters suggest that one should not forecast for alonger period ahead than about half the number of past years for which statisticsare available. For the London-Nice route, traffic data for 12 years to 1983 wereexamined (Table 9.1). This indicated that, though passenger movements almostdoubled between 1972 and 1983, growth was at times erratic, with two years,1974 and 1977, in which traffic actually declined. In practice, many largerairlines would hesitate to forecast so far ahead on the basis of time-seriesprojections alone. Nevertheless, a five-year forecast does enable one to seeclearly the impact of different techniques. While the analysis which followsrelates to annual traffic volumes and forecasts the annual traffic for 1988, thesame forecasting methods could be used with monthly or weekly traffic data.Problems of seasonal traffic fluctuations might arise, but these could be adjustedfor.
The London-Nice data underline some of the difficulties faced in forecasting.To start with, examination and plotting of the traffic data do not make it easy todecide whether past growth is linear or
Table 9.1 Total passenger traffic, London-Nice (both ways), 1972–83
Year Terminal passengers Annual change Three-year movingaverage passengers
Annual change
’000 % ’000 %
1 2 3 4
1972 140.61973 148.5 +5.6 143.81974 142.4 −4.1 151.6 +5.41975 163.8 +15.0 158.6 +4.61976 169.6 +3.5 166.9 +5.21977 167.4 −1.3 174.0 +4.31978 185.0 10.5 187.4 +7.71979 209.9 +13.5 206.7 +10.31980 225.1 +7.2 225.4 +9.01981 241.2 +7.2 245.0 +8.71982 268.8 +11.4 259.3 +5.81983 268.0 −0.3
FLYING OFF COURSE 223

Year Terminal passengers Annual change Three-year movingaverage passengers
Annual change
’000 % ’000 %
1 2 3 4
Source: CAA UK Airports: Annual Statements of Movements, Passengers and Cargo(for years 1972 to 1985).
exponential. As a result, both exponential and linear forecasts will be made in theanalysis which follows. Another major problem facing forecasters using time-series analysis is how far back they should go in examining past traffic data. Inthe case of London-Nice, 10-year data to 1983 meant 1974 would be the firstyear. This was known to be a year in which traffic slumped because of the firstoil crisis. There was subsequently a very large jump in traffic in 1975. Using amaverick low year as the starting point might produce less accurate forecasts. Soforecasters may decide, as has been done here, to go back and extend the timeseries by two years to 1972. This then raises a different question. Are data andtraffic so far in the past a good reflection of what will happen five years in thefuture? Would it not be logical to take a shorter time series? Is the recent past abetter indicator of the future than the more distant past? There is no absoluteanswer to this enigma. Forecasters must choose the time series which they feel ineach case will best allow them to make a realistic forecast. To do this they mustensure that their stream of data embodies the underlying trends and encompassescomplete cyclical variations if any exist.
9.3.1EXPONENTIAL FORECASTS
Average rate of growth
Many airlines, especially the smaller ones and those that have relatively newroutes with only a short stream of data, base their fore-casts on the average of thepast rates of growth. This approach has the advantage of simplicity. In theLondon-Nice case, adding up the annual percentage change each year from 1972to 1983 and dividing by eleven, which is the number of observations, producesan average annual growth of +6.2 per cent. Using the formula
where a is the actual traffic in 1983, b is the growth rate and t is the number ofyears forecast, then
224 FORECASTING DEMAND

In this and subsequent equations, traffic volumes are thousands.In the London-Nice case, the number of observations is relatively small, only
12; and this is so with many airline forecasts. But it does raise some doubt aboutwhether +6.2 per cent is the true average growth rate. It is possible to estimatemathematically what the possible range of values for the true growth rate mightbe. The true growth rate at a 95 per cent level of confidence would be 6.2±4.2. Ifone were to adjust the 1988 forecast accordingly, the range would be very wide.It is for this reason that most airline forecasters would ignore the implications ofhaving a relatively small number of observations.
Moving average growth
The use of annual average growth rates should be based, in theory, on dataseries which are long enough to show what are the random variations and whatare shifts in underlying trends. Where the time series is not very long and wherethere are very marked fluctuations in traffic growth from year to year, as in thecase of the London-Nice data (Table 9.1), some forecasters will use movingaverages as a way of flattening out wild traffic variations so as to understand theunderlying trends. In order to do this, normally three (or more) observations areadded together and the average calculated. This is then given as the actualobservation for the middle of the three years (or months if one is using monthlydata). For London-Nice the actual traffics for 1972, 1973 and 1974 were addedtogether and divided by three. This produced a three-year moving average of 143,800, which was the traffic attributed to 1973, the middle year (column 3 ofTable 9.1). Then 1972 was dropped and the average for 1973, 1974 and 1975calculated and attributed to 1974 and so on, the final moving average being for1982. The choice of the number of observations for the moving average is up tothe forecaster, whose aim is to eliminate sudden short-term traffic variationswithout losing sight of longer-term changes. But moving averages cannot beused with small data sets since one effectively loses data at each end.Examination of the moving average data for London-Nice in Table 9.1 (columns3 and 4) shows a flattening out effect. Traffic does not decline in any single yearand the growth in the good years is not as high as the unadjusted annual figureswould suggest. The highest growth was 10.3 per cent in 1979, following whichthere seems to have been a downward trend in the underlying growth rate.
The annual average rate of growth can be calculated from the annual changesin the moving average figures (column 4 in Table 9.1). In this case it was 6.8 percent. Using this to forecast 1988 traffic, then
The use of a moving average here seems to have identified a faster underlyinggrowth than was evident previously.
Exponential smoothing
FLYING OFF COURSE 225

Some forecasters believe that the recent past is a better pointer to the futurethan the more distant past. It follows that, in projecting past traffic growth intothe future, greater weight should be given to the more recent observations.Mathematically, the technique for doing this is similar to the moving average butadjusted to give a particular weighting to recent as opposed to more distantobservations. In a simple form,
where α is a smoothing factor (0<α<1), y is the number of passengers in year y,and y+1 is the first-year forecast. The greater the value given to α, the greaterwill be the weight given to the more recent observations. The forecaster candecide the value of α. The above formulation is relatively simple but somesmoothing techniques can be quite complex. The best known is the Box-Jenkinsmodel. This is a sophisticated and complex model requiring a large number ofobservations. Though airline forecasters make reference to Box-Jenkins (NguyenDai, 1982), few if any actually use it. Simpler formulations are available. One ofthese is Brown’s double exponential smoothing model and another the Holt-Winters model. Both use a smoothing technique to deal with time-series datacontaining a trend variation. Since the London-Nice traffic data showed a cleartrend pattern, the Holt-Winters model was used. The 1988 forecast produced onthis basis was 326,200 passengers. This is much lower than the other exponentialforecasts because the effect of the smoothing technique is to give much greaterweight to the fact that in 1983 traffic declined marginally. While exponentialsmoothing techniques have been widely used in some other industries, their useis still fairly limited within the airline industry. There is, however, a growingawareness that, by giving greater weight to the more recent observations,forecasters may be in a position to improve the accuracy of time-seriesprojections.
9.3.2LINEAR TREND PROJECTIONS
Simple trend
The underlying assumption is that a straight line best represents the trend ofthe traffic over time and that traffic increases by a constant amount with eachunit of time. The technique involves drawing a straight line through the timeseries so as to produce a best fit. This is normally done by the least squaresmethod, though other mathematical techniques are also available. The leastsquares criterion requires that the line fitted to the data should be the one whichminimizes the sum of the squares of the vertical deviations of the data pointsfrom the line. Some of the points are likely to be above the line, and thereforepositive, and some below the line, and so negative. These would cancel each
226 FORECASTING DEMAND
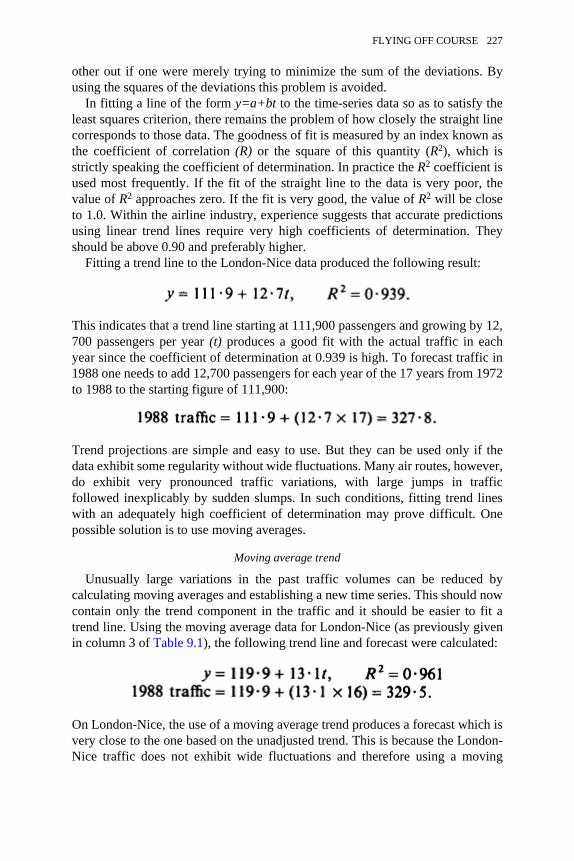
other out if one were merely trying to minimize the sum of the deviations. Byusing the squares of the deviations this problem is avoided.
In fitting a line of the form y=a+bt to the time-series data so as to satisfy theleast squares criterion, there remains the problem of how closely the straight linecorresponds to those data. The goodness of fit is measured by an index known asthe coefficient of correlation (R) or the square of this quantity (R2), which isstrictly speaking the coefficient of determination. In practice the R2 coefficient isused most frequently. If the fit of the straight line to the data is very poor, thevalue of R2 approaches zero. If the fit is very good, the value of R2 will be closeto 1.0. Within the airline industry, experience suggests that accurate predictionsusing linear trend lines require very high coefficients of determination. Theyshould be above 0.90 and preferably higher.
Fitting a trend line to the London-Nice data produced the following result:
This indicates that a trend line starting at 111,900 passengers and growing by 12,700 passengers per year (t) produces a good fit with the actual traffic in eachyear since the coefficient of determination at 0.939 is high. To forecast traffic in1988 one needs to add 12,700 passengers for each year of the 17 years from 1972to 1988 to the starting figure of 111,900:
Trend projections are simple and easy to use. But they can be used only if thedata exhibit some regularity without wide fluctuations. Many air routes, however,do exhibit very pronounced traffic variations, with large jumps in trafficfollowed inexplicably by sudden slumps. In such conditions, fitting trend lineswith an adequately high coefficient of determination may prove difficult. Onepossible solution is to use moving averages.
Moving average trend
Unusually large variations in the past traffic volumes can be reduced bycalculating moving averages and establishing a new time series. This should nowcontain only the trend component in the traffic and it should be easier to fit atrend line. Using the moving average data for London-Nice (as previously givenin column 3 of Table 9.1), the following trend line and forecast were calculated:
On London-Nice, the use of a moving average trend produces a forecast which isvery close to the one based on the unadjusted trend. This is because the London-Nice traffic does not exhibit wide fluctuations and therefore using a moving
FLYING OFF COURSE 227

average trend has relatively little impact. It has been done here only forillustrative purposes.
As a result of using alternative time-series techniques, five different forecastsof the London-Nice passenger traffic in 1988 have been produced. They aresummarized in Table 9.2. The difference between the highest and the lowestforecast is around 58,000 passengers a year, equivalent to five round-trip flightsa week with an Airbus A320 at about a 65 per cent seat factor. The range is verywide and could play havoc with any airline’s strategic fleet planning decisions.Which forecast should the forecasters and planners go for? As a group, theexponential techniques in this particular case produce higher forecasts than thelinear trends. This seems to be frequently so in airline forecasts and may be anadditional reason why airlines prefer working with exponential rather than linearprojections. They prefer to be optimistic in their forecasts.
What did happen on the London-Nice market by 1988? The year-by-year growthafter 1983 seems to have been relatively rapid (Table 9.3). Only in 1986, theyear of Chernobyl and a poor year in many markets, did traffic growth slowdown. By 1988, 392,800 passengers
Table 9.2 Alternative time-series forecasts of London-Nice traffic in 1988
Forecasting method Number of passengers forecast
Exponential forecasts:Average annual rate of growth 362,000Moving average 384,800Exponential smoothing (Holt-Winters) 326,200
Linear trend projections:Simple trend 327,800Moving average trend 329,500
Difference between highest and lowest forecast 58,600
Table 9.3 London-Nice traffic, 1983–8
Year Terminating passengers’000
Annual change%
1983 268.01984 278.1 +3.81985 305.6 +9.91986 308.7 +1.01987 341.4 +10.61988 392.8 +15.0Source: UK Airports: Annual Statements of Movements, Passengers and Cargo (for
years 1983–8).
228 FORECASTING DEMAND

were travelling on the route. Comparison with the summary of forecasts(Table 9.2) suggests that growth in this market is clearly exponential rather thanlinear. The linear forecasts were much too low, while two of the exponentialforecasts, based on the annual or the three-year moving annual rates of growth,were relatively close to the 1988 outcome. The exponential smoothing forecastwas not very accurate, but this was no doubt due to the fact that 1983 had been ayear of slight decline. Had one used 1982 as the final year, when traffic grew 11.4 per cent, then an exponentially smoothed forecast, which places greater weighton the most recent years, would have produced a much higher forecast. Thissuggests that exponential smoothing may be too dependent on what hashappened most recently and may distort the longer-term trend. Moreover, thistechnique, though called exponential smoothing, is mathematically more akin tolinear forecasting. This may explain its low 1988 forecast.
The London-Nice case study supports the view of many airlines that trafficgrowth is more likely to be exponential than linear. But there will be routeswhere linear trend projections may produce more reliable forecasts. In practice,every airline’s forecasting group has developed in the light of its own experiencea preference for a particular approach to forecasting involving only one or two ofthe methods proposed above. Few airlines would bother to calculate more than acouple of time-series forecasts.
Throughout the world the majority of airlines use time-series projections asthe starting point for their forecasting exercises. They are simple to use providedthat adequate statistical information on past traffic flows is available. Theyrequire little else. They are also likely to be reasonably accurate for shorter-termforecasts. It is relatively easy to forecast tomorrow’s traffic if you know today’s,or to forecast next week’s traffic if you know the average traffic handled in recentweeks. Beyond 18 months or so, the risk of error with time-series forecastsincreases as various external factors begin to impact on demand. Time-seriesprojections allow airlines to make individual forecasts for each route. Annualforecasts can be disaggregated into monthly forecasts reflecting seasonalvariations without too much difficulty. Alternatively, time-series forecasts can bebuilt up using monthly rather than annual data.
Although they are widely used, time-series forecasting methods do have afundamental underlying weakness. They are based on the assumption that trafficgrowth and development are merely functions of time. As time changes, so doesdemand. Yet our earlier analysis of demand showed that many factors affect thelevel of demand, such as the level of trade or of personal income, and that thesefactors are themselves changing over time. Even if these did not do so, there arenumerous supply factors, of which the most critical is the tariff level, which areinvariably changing and affecting demand in the process. It is clearly anoversimplification to relate demand purely to changes in time. Time can be onlya very poor proxy for a host of other critical variables. The longer ahead the time-series projection, the less likely it is to be accurate, as there is more time and
FLYING OFF COURSE 229

scope for demand to have been influenced by changes in one or more of themany independent variables.
There are two ways in which airline forecasters can try to overcome thisunderlying weakness. Most airlines start by making time-series projections. Theythen modify these projections on the basis of market research findings andexecutive judgement and turn them into forecasts. In this way they can allow forthe impact of the expected changes in demand factors and of planned changes insupply which they themselves control. As an alternative, a few airlines, usuallylarger ones, may try to use causal forecasting techniques, which relate trafficgrowth not to time but to a series of assumed causal factors.
9.4Causal models
The underlying principle of all such models is that the demand for passengertransport or for air freight services is related to and affected by one or moreeconomic, social or supply factors. Therefore, the starting point must be toidentify and select the factors, known as the independent variables, which mustbe assessed in order to forecast the dependent variable, which is the level ofpassenger or possibly freight traffic. The second step is to determine the functionalrelationship between the dependent variables and the independent variablesselected. This means specifying the form of the model to be used. Normally forairline forecasting it will be a regression model. Other model forms such asgravity-type models are used in other areas of transport but less frequently in airtransport. The third step in the forecasting process involves the calibration of themodel and the testing of the mathematical expression for the relationshipbetween the dependent and the independent variables. Should the tests show thatthe relationship established through the model is significant and statistically robustthen one can move on to the final step. This involves forecasting the independentvariables or using other people’s forecasts in order to derive from them theforecasts of air traffic.
9.4.1REGRESSION MODELS
Most econometric forecasts of air traffic tend to be based on simple or multipleregression models, where traffic is a function of one or more independentvariables. The two variables most frequently used are the air fare and somemeasure of per capita income. Thus, for a route such as London to Nice, onemight consider a model of the form:
(9.1)
230 FORECASTING DEMAND
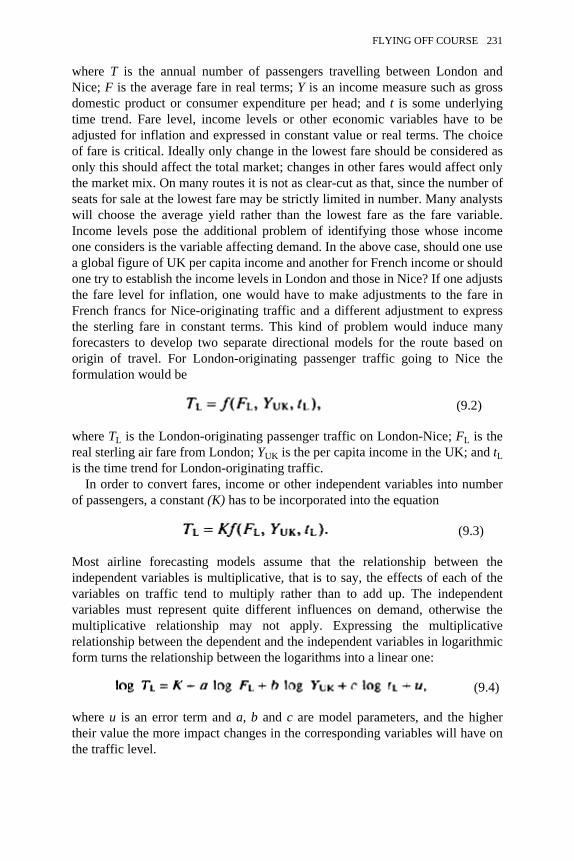
where T is the annual number of passengers travelling between London andNice; F is the average fare in real terms; Y is an income measure such as grossdomestic product or consumer expenditure per head; and t is some underlyingtime trend. Fare level, income levels or other economic variables have to beadjusted for inflation and expressed in constant value or real terms. The choiceof fare is critical. Ideally only change in the lowest fare should be considered asonly this should affect the total market; changes in other fares would affect onlythe market mix. On many routes it is not as clear-cut as that, since the number ofseats for sale at the lowest fare may be strictly limited in number. Many analystswill choose the average yield rather than the lowest fare as the fare variable.Income levels pose the additional problem of identifying those whose incomeone considers is the variable affecting demand. In the above case, should one usea global figure of UK per capita income and another for French income or shouldone try to establish the income levels in London and those in Nice? If one adjuststhe fare level for inflation, one would have to make adjustments to the fare inFrench francs for Nice-originating traffic and a different adjustment to expressthe sterling fare in constant terms. This kind of problem would induce manyforecasters to develop two separate directional models for the route based onorigin of travel. For London-originating passenger traffic going to Nice theformulation would be
(9.2)
where TL is the London-originating passenger traffic on London-Nice; FL is thereal sterling air fare from London; YUK is the per capita income in the UK; and tLis the time trend for London-originating traffic.
In order to convert fares, income or other independent variables into numberof passengers, a constant (K) has to be incorporated into the equation
(9.3)
Most airline forecasting models assume that the relationship between theindependent variables is multiplicative, that is to say, the effects of each of thevariables on traffic tend to multiply rather than to add up. The independentvariables must represent quite different influences on demand, otherwise themultiplicative relationship may not apply. Expressing the multiplicativerelationship between the dependent and the independent variables in logarithmicform turns the relationship between the logarithms into a linear one:
(9.4)
where u is an error term and a, b and c are model parameters, and the highertheir value the more impact changes in the corresponding variables will have onthe traffic level.
FLYING OFF COURSE 231
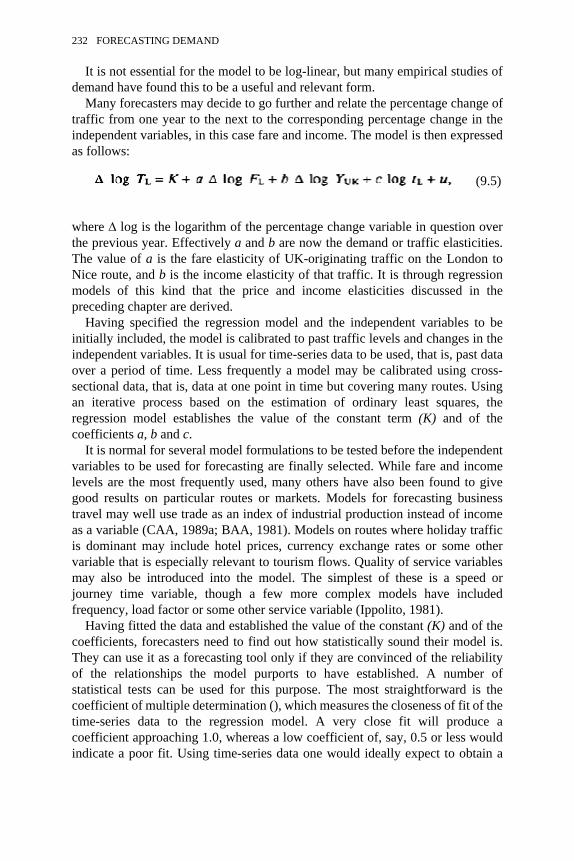
It is not essential for the model to be log-linear, but many empirical studies ofdemand have found this to be a useful and relevant form.
Many forecasters may decide to go further and relate the percentage change oftraffic from one year to the next to the corresponding percentage change in theindependent variables, in this case fare and income. The model is then expressedas follows:
(9.5)
where ∆ log is the logarithm of the percentage change variable in question overthe previous year. Effectively a and b are now the demand or traffic elasticities.The value of a is the fare elasticity of UK-originating traffic on the London toNice route, and b is the income elasticity of that traffic. It is through regressionmodels of this kind that the price and income elasticities discussed in thepreceding chapter are derived.
Having specified the regression model and the independent variables to beinitially included, the model is calibrated to past traffic levels and changes in theindependent variables. It is usual for time-series data to be used, that is, past dataover a period of time. Less frequently a model may be calibrated using cross-sectional data, that is, data at one point in time but covering many routes. Usingan iterative process based on the estimation of ordinary least squares, theregression model establishes the value of the constant term (K) and of thecoefficients a, b and c.
It is normal for several model formulations to be tested before the independentvariables to be used for forecasting are finally selected. While fare and incomelevels are the most frequently used, many others have also been found to givegood results on particular routes or markets. Models for forecasting businesstravel may well use trade as an index of industrial production instead of incomeas a variable (CAA, 1989a; BAA, 1981). Models on routes where holiday trafficis dominant may include hotel prices, currency exchange rates or some othervariable that is especially relevant to tourism flows. Quality of service variablesmay also be introduced into the model. The simplest of these is a speed orjourney time variable, though a few more complex models have includedfrequency, load factor or some other service variable (Ippolito, 1981).
Having fitted the data and established the value of the constant (K) and of thecoefficients, forecasters need to find out how statistically sound their model is.They can use it as a forecasting tool only if they are convinced of the reliabilityof the relationships the model purports to have established. A number ofstatistical tests can be used for this purpose. The most straightforward is thecoefficient of multiple determination (), which measures the closeness of fit of thetime-series data to the regression model. A very close fit will produce acoefficient approaching 1.0, whereas a low coefficient of, say, 0.5 or less wouldindicate a poor fit. Using time-series data one would ideally expect to obtain a
232 FORECASTING DEMAND

coefficient of 0.9 or more if one wanted to use the model for forecasting withsome degree of confidence. The coefficient may also be used to choose betweenmodels with different combinations of independent variables.
While the value tells forecasters how well traffic variations fit variations in theindependent variable, it does not tell them how traffic is related statistically toeach of the independent variables separately. This is done by partial correlationcoefficients. These measure how closely traffic is related to any one of theindependent variables when all other variables are held constant.
Other tests to establish the validity of the model and the significance of therelationships it purports to measure include Student’s t test and the F statistic.The latter is an alternative to the coefficient of multiple determination and isfound by comparing the explained variance of the data with the unexplainedvariance. It is not the aim of the present book to deal in detail with the conductand significance of the various statistical tests which can be carried out. Theseare covered adequately in many statistics textbooks and in one or two specialist airtransport texts (Taneja, 1978).
While academic economists have developed quite sophisticated and apparentlyrobust econometric models for forecasting air traffic, airlines tend to use fairlysimple models, which often may not be as statistically sound as, in theory, onemight wish. One such model was developed in 1977 for forecasting Air Algerie’straffic between Algeria and France. The model took the form
(9.6)
where T is the number of passengers carried by Air Algerie between Algiers andParis; GNP is a measure of the combined real GNP of France and Algeriaweighted in proportion to the share of Algerians in the total traffic; F is theaverage yield per passenger-kilometre on all Algeria-France routes; S is theaverage speed of all Algeria-France air services.
Effectively the independent variables were income, price and a quality ofservice variable which was speed. The time series on which the model was basedwas for the eight years 1968–75. This was rather short, though a similar modelfor total air traffic between the two countries had a 10-year data base. Using theordinary least squares method, the coefficient worked out as follows:
(9.7)
where the respective Student t-values are given in parentheses below the mainequation, =0.9732, the standard error is 0.0381, F(3.5)=60.60 and the value ofthe Durbin-Watson statistic is 3.24.
The model established a price elasticity of −1.4 on the Algiers-Paris route andan income elasticity of +1.4. Since the high t-test values validated the
FLYING OFF COURSE 233

significance of the coefficients, the model was used to carry out 10-yearforecasts to be used for fleet planning purposes.
Whereas the Air Algerie model was used for specific route forecasts,econometric models are used to forecast traffic development in wider markets.For example, the UK Civil Aviation Authority has divided the traffic at theLondon airports into 11 discrete market segments based on purpose of travel,place of residence of passengers and type of route. Each market segment has itsown causal model and its traffic is forecast separately. For instance, leisuretraffic by UK residents on the North Atlantic is a function of UK consumerexpenditure, North Atlantic fares and tourist ground costs, which are affected bythe sterling-dollar exchange rate (CAA, 1989a). The model formulation was:
(9.8)
where UK-NA LS is leisure passengers between the UK and North America, CEis UK consumer expenditure, TC is tourist ground costs (as affected by exchangerates, etc.) and AF are the air fares. The model suggests that this market is muchmore elastic to changes in tourist costs, other than transport, (elasticity of −1.03)than to changes in the air fare (elasticity of −0.2). A separate model forecastsleisure traffic from North America to the UK. The model formulation is similar,but US gross national product replaces UK consumer expenditure as the income-related variable. The BAA plc (British Airports Authority) breaks the Londonairports’ markets into more than 30 distinct segments and has developed adifferent regression model for each (BAA, 1981).
Another example is the Association of European Airlines (AEA), which hasdeveloped a series of regression models to forecast air passenger flows betweenindividual countries. After trying alternative formulations using historical dataover 20 years, the AEA concluded that airline traffic was best forecast by amultiplicative relationship between the combined gross domestic product of thetwo countries concerned and the average revenue of the carriers on the route(weighted by the proportion of sales in each country). Both GDP (the proxy forincome) and average revenue (the proxy for air fares) are deflated by the privateconsumption deflators in each country to arrive at real changes in income orfares expressed in constant terms (AEA, 1987).
Very high coefficients of multiple determination are not in themselves aguarantee of causality or even of a close relationship between the independentand the dependent variables. A high coefficient of determination may beproduced if the error terms produced by the regression equation fall into apattern. This is called autocorrelation, and may occur either when a significantindependent variable has been left out or when there is a marked cyclicalvariation in the dependent variable. One can test for autocorrelation using theDurbin-Watson d statistic. The values of d which will enable one to assess
234 FORECASTING DEMAND
whether autocorrelation is present are related to the number of observations andthe number of independent variables. As a general rule, if the Durbin-Watsonstatistics are below 1.5 or above 2.5 the forecaster will be concerned with thepossibility of autocorrelation. The high Durbin-Watson statistic of 3.24 on theAlgiers-Paris model (equation 9.7 above) would suggest the existence ofnegative serial correlation. Another problem which might exist despite highcoefficients of determination is that of multicollinearity. This occurs if theindependent variables are not statistically independent of each other. Forexample, air fares and fuel prices may move more or less in unison. Thereforeincluding both as independent variables would result in multicollinearity andwould pose difficulties in interpreting the regression coefficients. In particular,they could no longer be strictly considered as elasticities. One can test formulticollinearity by using a matrix showing the correlation between theindependent variables. Variables showing a high correlation, say 0.85 or higher,should not really be included in the same model. The possibility ofautocorrelation and multicollinearity are two key problems for the airlineforecaster using econometric models. There are other more obscure ones, such asheteroscedasticity, which are dealt with in detail in the specialist texts (Taneja,1978).
Having developed and tested models such as those described above, an airlineneeds to obtain forecasts of the independent variables used in order to be able toderive from them forecasts of future air traffic. In doing this, particularly forlonger-term forecasts, one should not necessarily assume that the elasticitiesremain constant over time. It is inherent in the way that elasticity is measured thatit must change over time as total traffic grows. Because of this, many forecastersbuild changing elasticities into their predictive processes. Changes in elasticityvalues can be derived mathematically or they can be assumed. The BAA, forexample, in its own forecasts assumes a decline in the income elasticities of mostmarket groups (see Table 8.5).
It is while forecasting the independent variables that some form of sensitivitytest may be introduced into the forecasting process. Airlines might consider whatwould happen to the economy of a particular country and its per capita income ifindustrial growth did not turn out to be as fast as predicted by the governmentconcerned. Alternatively, they might evaluate the impact of a disruption of oilproduction in the Middle East on the price of fuel and ultimately on economicgrowth or on the future level of air fares. These sensitivity tests may produceband forecasts suggesting a range of possible traffic outcomes rather than pointforecasts.
For decisions dependent on forecasts over a two-year time span or less, airlinemanagers tend to prefer point rather than band forecasts. Decisions have to betaken and giving a range of forecasts is no help to the decision makers. Theywant precise traffic estimates. They expect the forecasters to have assessed therisks and the sensitivity of the forecasts to external variables and to have madethe point forecasts in the light of such assessment. When it comes to strategic
FLYING OFF COURSE 235

decisions stemming from the airline’s corporate plan, band forecasts becomeuseful. They should force the airline to maintain flexibility in its long-termplanning decisions. An airline must avoid taking decisions which lock it into asize and level of production which it cannot easily vary. This is particularly trueof aircraft purchase or other major investments. Band forecasts emphasize theuncertainty inherent in forecasting.
9.4.2AIR FREIGHT MODELS
The factors affecting the growth of air freight are complex and often fickle. Thetonnage of freight moving on any route is subject to sudden and unexplainedvariations. There is the added complication that, unlike passengers, who tend toreturn to their point of origin, freight movements are unidirectional. There is amultitude of commodity freight rates on any route and such rates have alsotended to be less stable then passenger fares. Much freight capacity is producedas a byproduct of passenger capacity, and as a consequence there is frequently anoverprovision of freight capacity with a strong downward pressure on freightrates. Tariffs charged often bear little relationship to the published tariff, so thateven establishing tariff levels is difficult. As a result of all these complexities, ithas often been found difficult to relate past freight growth to one or moreindependent variables, particularly in relation to individual routes, though one ofthe early studies did develop a model relating freight tonne-kilometres to freightrates, an index of US industriai production and a time trend (Sletmo, 1972).
The few causal freight models which have been developed have tended to beused for forecasting global air freight demand or demand in large markets ratherthan on individual routes. For example, aircraft manufacturer McDonnellDouglas has produced directional inter-regional air freight forecasts using simpleregression models. For instance, in a North Atlantic westbound model, freighttonne-kilometres were found to be positively related to the German mark-USdollar exchange rate and to US real gross domestic product, and negativelyrelated to the real cargo yield (Douglas, 1989).
The International Civil Aviation Organization (ICAO) uses econometricmodels for its long-term forecasts of the world’s scheduled air traffic (ICAO,1990). Using data for the period 1960–88, ICAO has developed two separatemodels, one for passenger traffic and one for air freight. The freight model takesthe form:
(9.9)
where FTK is freight (18.7) tonne-kilometres, EXP (6.6) is world exports in realterms, FYIELD is freight revenue per freight tonne-kilometre in real terms, andfigures in brackets are the t-statistics and the R2=0.995.
236 FORECASTING DEMAND

Most route-by-route forecasts for freight are based on a combination ofexecutive judgement, market research and, where appropriate, time-seriesprojections. Frequently such forecasts are on a commodity-by-commodity basissince the number of separate commodities being freighted by air on any route isusually fairly limited. A few airlines, such as the US cargo carrier Flying Tiger,have tentatively tried to use both time-series projections and regression models,but with uncertain results (Garcia-Fuertes, 1980). In the late 1970s, BritishAirways also experimented with econometric models for freight flows, but withlittle success, and subsequently has placed greater emphasis on time-seriesanalysis and on assessing the factors affecting particular commodity flows. Thedevelopment of causal models of individual commodity flows may ultimatelyprove more rewarding than attempts to model total freight flows on particularroutes.
9.4.3GRAVITY MODELS
Time-series analyses or regression models are of little use when trying toforecast traffic on new routes, where there are no historic traffic data, or onroutes where traffic records are inadequate or non-existent. Traditionally, thisproblem has been overcome by using a combination of market research orexecutive judgement. Another possible approach is to use a gravity model. Thiswas the earliest of the causal models developed for traffic forecasting. It has beenrelatively little used in aviation, even though gravity formulations have played acrucial part in many road traffic forecasting and assignment models.
The gravity model concept has a long history. It was in 1858 that Henry Careyfirst formulated what has become known as the ‘gravity concept of humaninteraction’. He suggested that social phenomena are based on the samefundamental law as physical phenomena and that ‘gravitation is here, aseverywhere else in the material world, in the direct ratio of the mass and in theinverse one of the distance’ (Carey, 1858). One of the first applications totransport was by Lill (1889), studying movements on the Austrian state railwaysin 1889. Subsequently the concept was taken over by highway engineers whodeveloped gravity models for forecasting road traffic. The first recorded use foraviation was in 1951, when D’Arcy Harvey, working for the US CivilAeronautics Administration, developed the gravity concept to evaluate the airtraffic flow between two communities (D’Arcy Harvey, 1951).
Translating the concept into aviation terms, one starts with the simpleformulation that the air traffic between two points is proportional to the productof their populations and inversely proportional to the distance between them; sothat:
FLYING OFF COURSE 237

(9.10)
where Tij is the traffic between two towns i and j, K is a constant, Pi and Pj arethe populations of the two towns, and Dij is the distance between them.
The top half of the equation, namely the populations, contains the generativevariables while the bottom half contains the impedance variables, in this casedistance. This is a simple causal model with population size and distance as theindependent variables affecting traffic flow. As the concept has been developed,both generative and impedance factors have been modified and the model hasbecome more complex. For instance, the level of air fares has often beenconsidered a better measure of impedance than distance. It has also been thoughtnecessary to modify crude population numbers to take account of purchasingpower, nature of economic activity of that population, and so on.
An early study in 1966 involved replacing the population in the interactiveformula by the product of the total air traffic of each of the cities concerned(Doganis, 1966). Total airport traffic was thought to provide a good measure of aregion’s income levels, of the type of economic activities within it and of theeffective catchment area of its airport. Using airport traffic obviated the need toincorporate other economic variables into the model. It was also found thatraising the distance term to a power other than unity improved the correlation ofthe model when tested against actual traffic levels. This model took the form:
(9.11)
where Tij, K and Dij are as before, but Ai and Aj are the total passenger traffics ofthe two airports at either end of the route and P is distance raised to a power ofbetween 1 and .
Subsequent studies using gravity models to predict traffic on new or potentialroutes include one in 1981 by the Economist Intelligence Unit for the EuropeanCommission. This used such a model to predict air traffic on intra-regional airservices in Europe (EIU, 1981). A more recent study, also carried out for theEuropean Commission, involved forecasts of air traffic between airports in thesouthern regions of the European Community, some of which did not alreadyhave direct air links (PCL, 1989). Various model formulations were calibrated on47 existing air services for 1987. The one which produced the highest correlationof 0.97 took the following form:
(9.12)
238 FORECASTING DEMAND

where K is a constant, Ai and Aj are the scheduled passenger traffics at each ofthe two airports, Q¾ is a service quality variable raised to the power of three-quarters, and F½ is the normal economy fare raised to the power of half. Thequality of service variable (Q) was a measure of equivalent weekly frequencieswhich makes allowance for intermediate stops and type of aircraft. Whereas aweekly nonstop jet service is given a Q value of 1.0, a one-stop service is valuedat 0.5 and a turbo-prop service at 0.7. Services involving two or more en routestops are ignored.
The value of a gravity model approach is its ability to forecast demand on newroutes. Thus, using the model just described, it was possible to forecast thepassenger demand between two cities such as Venice and Madrid which did nothave air services in 1989 by feeding into the equation the projected forecasts oftotal air traffic for each of these airports in that year, the current economy air fareand the likely types of air services that could be viably provided. The latter is thequality of service variable and involved some iteration to arrive at the optimumcombination of traffic and service level. While using airport traffics as one of thegenerative factors in a gravity model appears to improve the robustness of themodel, it has a major disadvantage in that the model cannot be used where thereis no existing airport traffic at one or both ends of the route. In suchcircumstances one has to revert to using population size perhaps weighted byincome levels.
9.4.4ASSESSMENT OF CAUSAL MODELS
The strength of causal forecasting models is that they are logical. They relatedemand to changes in factors which one would expect to have an impact ondemand. The models chosen must therefore be logical too, despite the findings ofany statistical tests. A model with a high coefficient of determination should notbe used if the independent variables are intuitively wrong. The forecaster’s directexperience of market conditions and knowledge gained through market researchcan provide an insight into demand behaviour which may ultimately be moreuseful than that obtained through statistical analysis and mathematicalcorrelation. The models used must be logically consistent. If they are, it followsthat, if one can forecast the independent variables for three or more years, thenone should be able to derive longer-term traffic forecasts with a lower risk oferror than if one were using time-series projections where demand is related purelyto changes in time. Herein lies the strength of causal forecasting but also itsweakness. For, by using a causal model in the interests of logical consistency andgreater accuracy, airline forecasters transpose their problem. Instead of having toforecast air traffic, they must now use someone else’s forecasts of theindependent variables and, if these are not available, they must make their own.Many governments, central banks and other institutions do make forecasts ofgross domestic product, consumer expenditure, trade and other economic
FLYING OFF COURSE 239
indicators which might be used as independent variables. Such economicforecasts are not always reliable, nor are they necessarily long term. Where morethan one institution is forecasting a particular variable, the forecasts do notalways agree. If the air fare is one of the independent variables used, then thisshould in theory be easy for an airline to forecast since it is under airline control.In practice it is difficult for the airlines to predict fare levels more than two orthree years hence, without getting embroiled in forecasting oil prices or changesin other factors that may affect future fare levels.
Causal techniques pose some further problems too. Like time-series analysesthey also depend on the availability of historical data. Clearly, to calibrateregression models in particular one needs not only good air traffic data but alsoadequate and accurate statistics going back many years of independent variablesbeing used in the model. In most developed countries these should be available.In many Third World countries, adequate data are either unavailable or possiblyunreliable. Where data are available, the complexity of the modelling work isdaunting and time consuming, especially if an airline wishes to develop separateforecasts for key markets or major routes, each requiring separate models.
It should be borne in mind that econometric forecasting, despite its inherentlogic and mathematical complexity, is not a mechanistic exercise. Judgement isinvolved at all stages, from the model specification to the choice of independentvariables, and more especially in the choice between alternative forecasts ofthose independent variables.
9.5Choice of forecasting technique
It is clear from the preceding analysis that there is no certainty in forecasting; noforecasting tool that can guarantee the accuracy of its predictions. Even verysimilar forecasting methods may produce widely diverging forecasts. Whateverthe uncertainties, however, airlines cannot avoid making forecasts because somany other decisions stem from them. Their forecasters must make a choicebetween the numerous forecasting techniques open to them. Several factors willdetermine that choice.
The starting point is to determine the prime objective of the forecast. Is it toforecast traffic growth; is it to predict the reaction of demand to some newdevelopment such as a fare increase or frequency change; or it it to forecast thetraffic on a new route? While all techniques enable one to make a forecast oftraffic growth under normal conditions, only a few are suitable for forecastingtraffic reaction or demand on a new route (Table 9.4). If an airline is planning toopen up an entirely new route, it has little choice but to use a qualitativetechnique or a gravity model.
Having determined the forecasting techniques suitable for the type of forecastbeing undertaken, then speed and data availability become important criteria. Aquick forecast means either executive judgement or a straightforward time-series
240 FORECASTING DEMAND

projection. Data availability is crucial for certain of the techniques. Time-seriesprojections need accurate and detailed traffic data over a reasonable period oftime. Regression models need all that but also adequate data on the independentvariables included in the model. If either traffic data or data on the varioussocioeconomic variables are unavailable and unobtainable, then the forecaster isobliged to turn to qualitative methods. Cost may be an important considerationtoo. Smaller international airlines may not be prepared to meet the high costs ofmarket research, while sophisticated causal forecasting for them would meanusing consultants, and consultants do not come cheaply. In fact, many smallerairlines are dependent on aircraft manufacturers for their long-term forecasts.
If speed, data availability and cost are not a constraint, then airlines mightchoose between the forecasting techniques open to them on the basis of theirpredictive accuracy. This is a difficult judgement to make. The varioustechniques are listed in Table 9.4 and their accuracy for short-, medium- andlong-term forecasts is indicated on a three-point grading of poor, fair and good.However, the gradings are to a certain extent subjective and influenced by one’spersonal experience and judgement. Different forecasters would use differentgradings. Inevitably most techniques are fairly accurate for
Table 9.4 Attributes of airline passenger forecasting techniques
Qualitative methods Time-series projections Causal models
Executivejudgement
Marketresearch
Delphi Annualaveragegrowth
Exponentialsmoothing
Lineartrend
Lineartrendonmovingaverage
Regressionanalysis
Gravitymodel
Accuracy:0–6months
Good Good Fair/good
Fair/good
Good Fair/good
Good Good Good
6–24months
Fair Good Fair/good
Poor/fair
Fair/good
Poor/fair
Fair Fair/good
Fair/good
5years
Poor Poor/fair
Fair Poor Poor/fair
Poor Poor/fair
Poor/fair
Poor/fair
Suitabilityforforecasting:
Trafficgrowth
Good Good Good Good Good Good Good Good Good
FLYING OFF COURSE 241

Qualitative methods Time-series projections Causal models
Executivejudgement
Marketresearch
Delphi Annualaveragegrowth
Exponentialsmoothing
Lineartrend
Lineartrendonmovingaverage
Regressionanalysis
Gravitymodel
Trafficreaction
Fair Good Fair n.a. n.a. n.a. n.a. Good Poor
Traffic newroutes
Poor Fair Poor n.a. n.a n.a. n.a. Fair Good
Ability toidentifyturningpoints
Poor/fair
Fair/good
Fair/good
Poor Fair Poor Poor/fair
Good Poor
Readyavailability of inputdata
Good Poor/fair
Poor Good Good Good Good Poor/fair
Fair
Daysrequired toproduceforecast
1–2 90+ 30–180
1–2 1–2 1–2 1–2 30–90
20–60
Cost Verylow
Veryhigh
Moderate
Low Low Low Low High High
Note: n.a.=not applicable.
short-term forecasts and some are also reasonable for two-year forecasts. Beyondthat time span there is some doubt, but it is likely that qualitative or causaltechniques will produce the more accurate forecasts. These techniques are alsothe most likely to be able to identify and predict turning points in the underlyinggrowth trends. In theory, causal models should produce the better results, butsome aviation experts suggest that there is no compelling evidence thateconometric techniques produce more accurate air traffic forecasts than do thesimpler and more straightforward approaches (de Neufville, 1976).
Within most international airlines a range of forecasting techniques is used.Faced with differing planning requirements, airlines carry out both short- tomedium- and longer-term forecasts. The former tend to be based on time-seriesprojections, frequently modified by executive judgement and by market researchfindings. The precise time-series technique or techniques used by each airlinewill depend on its experience and the judgement of its forecasters. Where new
242 FORECASTING DEMAND

routes are being evaluated, the airline’s preference may well be to use marketresearch methods to forecast potential demand. For longer-term forecasts beyonda year or two, many smaller airlines continue to use time-series projections,despite doubts about the accuracy of such methods for longer time spans, whilesome of the larger airlines switch to causal models. Ultimately, so manyexogenous and unpredictable factors may affect air transport demand thatforecasts beyond 3–5 years ahead must be thought of as being very tentative.
FLYING OFF COURSE 243

10Product Planning
10.1Key product features
As international regulation of air fares, of capacity and of in-flight service hasbeen increasingly relaxed or, in some markets, abandoned altogether, the airlineindustry has become progressively more competitive. That competition focuseson the products that different airlines offer to their customers. As regulationsdiminish, then the opportunities for product differentiation widen and airlineshave a much greater range of choices open to them. Product planning is decidingwhat product features to offer in each market segment in which an airline ishoping to sell its services or products. For each airline, product planning iscrucial in two respects. First, it provides the key link in matching potentialdemand for air services with the actual supply of services which it offers in themarket it serves. Each airline controls its own supply of services but caninfluence the demand only through its product planning. Much, therefore,depends on product planning. Secondly, as previously mentioned, productplanning has a direct impact on operating costs (sections 6.4–6.6 above).
In deciding what products to offer in the different markets it has entered, anairline has to bear in mind a number of objectives. It must consider its overallmarketing strategy, which will have emerged as a result of its demand analysesand forecasts (Chapters 8 and 9 above). It must set out to attract and satisfypotential customers in the different market segments that it has identified. Thismeans using its understanding of the needs and requirements of these differentmarket segments. Such understanding will have been acquired through a range ofmarket research activities, including passenger and other surveys, the monitoringof its own and its competitors’ past performance, and so on. Lastly, an airlinewill want to maximize its revenues and profits, not always in the short term butcertainly in the long run. In brief, the ultimate aim of product planning is toattract and hold customers from the market segments that an airline is targetingand to do this profitably.

An airline’s potential customers will be influenced by five key productfeatures in making travel decisions and, more importantly, in choosing betweenairlines:
(1) the costs to them of different airline services, in other words, the fares andfare conditions;
(2) the schedule-based features of the services being offered;(3) aspects of comfort;(4) the ease and convenience of gaining access to an airline’s services, and(5) the image which is associated with different airlines or airline products.
An airline must therefore decide how to combine these various product featuresto meet customer needs in different markets. This is a complex process becausecustomer requirements will vary not only between different market segments onthe same route but also between neighbouring routes and geographical areas. Forany particular airline product in a given market, different combinations of thesefive product features can be offered. To a certain extent there may even be atrade-off between them. Greater comfort can be offered, for instance, byreducing the number of seats in an aircraft, but this may necessitate selling athigher fares.
It would seem that the fare level is the most critical product feature for manymarket segments, especially in many price-sensitive leisure or VFR markets. Itmay be less important for business markets which are price inelastic, thougheven here marked fare differentials between airlines may have an impact. Fares arealso the most dynamic product feature in that they can be changed almost daily,at least in deregulated markets. Thus the whole question of pricing and revenuegeneration merits the more detailed examination provided in Chapter 11. Ifmarkets are price inelastic or where fares of different carriers are very similar,because of either regulation or competitive pressures, then the other productfeatures become relatively more important in determining the market penetrationof different airlines.
10.2Schedule-based features
From a consumer viewpoint, the critical schedule-based features in any marketare the number of frequencies operated, their departure and arrival times, theroutings taken and in particular whether flights are direct or involve one or morestops en route. Conversely, aircraft type is not seen as important, though on someshort-haul routes a jet may be preferred to a turbo-prop. Different marketsegments will have differing schedule requirements. Short-haul business marketsgenerally require at least a morning and an early evening flight in each directionon weekdays so as to allow business trips to be completed in a day. Weekendflights may be less important for business travellers but crucial for short-stay
PRODUCT PLANNING 245
weekend holiday markets. Frequency requirements will also vary depending onthe type of market, the length of haul and the level of competition. For instance,offering a once-daily service when a competitor has 10 flights a day is unlikelyto make much impact on the market.
In the early 1980s, the Scandinavian airline SAS asked its passengers whatwere the most important factors for them in choosing a flight when making theirreservations. More than two-thirds of those surveyed said that departure/arrivaltimes were very important and two-thirds claimed that non-stop direct serviceswere also very important. Other factors were relatively unimportant in travellers’choices. Interestingly, only 3 per cent claimed aircraft type as an important factorin their decision. It was in response to such surveys that SAS effectivelygrounded their four new A300 Airbuses in 1982 and concentrated on using theirsmaller DC-9s and later MD 81s and MD 82s with fewer than half the seats ofthe Airbuses. The smaller aircraft enabled SAS to offer higher frequencies and tooperate direct on thinner routes for which the Airbuses would have been toolarge. Such a marketing strategy led inevitably to very high unit costs (Table 8.1above). However, by concentrating on schedule-based product features, SAS wasable to attract business traffic which was prepared to pay the higher fares thatsuch a strategy necessitated. In fact, SAS claimed that, in 1989, 50 per cent oftheir intra-European traffic was in business class.
Other surveys all reinforce the importance of schedule-related features. Suchfeatures appear to be the core element of the scheduled airline product on short-haul routes and arc probably the most important factor for all business travellers.A 1987 survey by the International Foundation of Airline Passenger Associationsof more than 25,000 passengers, most of whom were likely to be businesstravellers, shows this clearly (Table 10.1). Respondents were asked to identifythe three most important features when choosing an airline. Punctuality,convenient schedules and frequency stand out as being by far the most frequentlymentioned for shorter sectors of less than 2 hours, with around half ofrespondents putting it among their list of three. Comfort-based features are muchless important on these short sectors. Generally speaking, schedule-basedfeatures were more important than comfort for short or medium-haul flights.However, for the longer sectors, comfort-based features, particularly seatingcomfort and the quality of in-flight service, increase in relative importance andfrequency becomes less important. Low fares were also perceived as being oflimited importance, reflecting the business nature of much of the travelundertaken by the respondents.
According to this survey, there is no simple worldwide pattern of needs.Passengers’ priorities differ from one region of residence to another. NorthAmerican residents attach unusual importance to pricing, including low fares(moderately important elsewhere), and frequent flyer programmes, which are oflittle importance in other regions. For European residents the overwhelmingimportance of schedules, frequency and punctuality for short European flightscontrasts with low interest in seating comfort and in-flight service.
246 FLYING OFF COURSE

The survey summarized in Table 10.1 also highlights the importance ofpunctuality. Numerous surveys, especially in the United States, have emphasizedgrowing passenger concern with poor on-time performance. It was this which in1987 induced the then US Transportation Secretary, Elizabeth Dole, to introducea ruling requiring airlines to submit on-time performance records to operators ofcomputerized reservation systems and travel agents so that they could be seen, ifrequired, by passengers when booking flights. The second leading cause ofconsumer complaints in the United States was
Table 10.1 Importance of product features in airline choice: survey of 25,000 respondents,1987
Feature The three features identified as most important when choosing anairline
Under 2-hour flight 2–5 hour flight
% Rank % Rank
Schedule-basedfeatures:Punctuality 54 1 36 4Convenientschedules
48 2 42 1=
Frequency 45 3 21 6Aircraft type 9 11= 12 8
Comfort-basedfeatures:Seating comfort 18 5= 42 1=Check-in &boarding
15 7 9 9=
In-flight service 12 8= 33 5Carry-onbaggage space
12 8= 6 12
Reassignedseats
9 11= 9 9=
Others:Safety andsecurity
33 4 39 3
Low fares 18 5= 15 7Efficientreservations
12 8= 9 9=
Source: Compiled from IFAPA (1988).
lost or delayed baggage. Here, too, airlines were required to provide comparativestatistics on how often they lose, delay or damage baggage. The UK CivilAviation Authority (CAA) followed the US lead on punctuality but not on
PRODUCT PLANNING 247

baggage, which is less of a problem in European markets. Since 1989, UKairlines have had to submit punctuality data to the CAA on a route-by-route basisfor major domestic and international routes. These are then published with somemonths’ delay and, unfortunately, in a form which makes them virtuallyinaccessible to passengers or travel agents. Analysis of the CAA data up to 1990showed that punctuality was significantly better on European routes with a highbusiness component, such as LondonZurich, than on neighbouring leisure-dominated routes. Clearly the airlines concerned, notably British Airways, wereas a matter of policy giving higher priority to maintaining timetables in businessmarkets.
The main reason why schedule-based features together with the fare aregenerally the most important product components is that they can be seen andquantified objectively. They are explicit and precise: one can compare onescheduled departure time with another, or the total journey time of a direct asopposed to a one-stop service. By comparison, assessment of comfort,convenience or image-based product features, such as the quality of an airline’sin-flight service or of its distribution system, is subjective. Customer perceptionof these product features will vary for each trip and between different customerson the same trip. They cannot easily be quantified or compared between differentairlines.
10.3The hub-and-spoke concept
As a result of deregulation in the United States, ‘hubbing’ has been developed byall the major companies as a crucial schedule-based product feature. It has majorimplications both for airline economics and for competition policy and thusmerits more detailed examination.
The concept of hubbing is that flights from different airports which are thespokes of a network arrive at the hub at approximately the same time. Theaircraft are then on the ground simultaneously, thereby facilitating interchange ofpassengers and baggage between aircraft in a short period of time before theydepart in quick succession back out along the spokes. This process, whichinvolves a wave or ‘bank’ of arrivals followed shortly after by a wave ofdepartures, can be described as a complex. The transfer time between flights inthe same complex should be close to the best attainable. A US airline with amajor hub will operate several complexes during the day. American Airlinesschedules about eight complexes daily at Dallas-Fort Worth.
An airline able to develop and operate a hub-and-spoke system with a series ofcomplexes enjoys numerous potential advantages. The increase in city-paircoverage that can be obtained as a result of hubbing is much more dramatic thanis often realized. If three point-to-point direct links from cities A to B, C to Dand E to F are replaced by six direct services from each of these six airports to ahub at X, the number of city-pair markets that can be served jumps from three to
248 FLYING OFF COURSE

21. This advantage increases in proportion to the square of the number of routesor spokes operated from the hub. Thus, if a hub has n spokes, the number ofdirect links is n to which must be added n(n−1)÷2 connecting links. Theprogressively greater impact of adding more links through a hub can be seen inTable 10.2. It is because of this relationship that British Airways was able toclaim in 1990 that by taking a 20 per cent stake in Sabena World Airlines, whichwould serve 75 European regional cities through a Brussels hub, more than 2,000city pairs would be linked (BA, 1990). As the table shows, this was anunderestimate! The ability to reach a large number of destinations gives theairline operating the hub system considerable market appeal.
A number of further marketing advantages flow from the increase in city pairsserved. By channelling what may be a large number of separate but thin city-pairflows onto a service going into the hub, the density of traffic on that particularspoke may be built up sufficiently to allow high-frequency operations. In otherwords, the additional traffic generated by the connections may allow an airline tooperate
Table 10.2 Impact of hubbing on the number of city pairs served
Number of spokesfrom the hub
Number of marketsconnected via thehub
Number of directmarkets terminatingat the hub
Total city pairsserved
n n
2 1 2 36 15 6 2110 45 10 5550 1,225 50 1,27575 2,775 75 2,850100 4,950 100 5,050
a larger number of flights. As this will happen on many spokes, the frequenciesof possible connecting services via the hub joining two distant spokes, with lowtraffic between them, increase. Not only does this stimulate traffic but it alsoinhibits potential competitors from starting a direct service between the twospokes, since they may be unable to compete in terms of frequencies or departuretimes. The hub operator may also drop its fares on connecting services toundermine any direct competition. It can do this easily by cross-subsidizing thisservice from other routes where it faces no direct competition. Moreover, wheretwo airports at the periphery of a hub-and-spoke system warrant direct servicebetween them, the hub airline may offer that service to pre-empt a new entrant.
One of the most important benefits to arise from complexed hub-and-spokeoperations is the extent to which individual airline networks can become self-sufficient in meeting demand, enabling operators to keep passengers on theirown services rather than lose them to interline connections. This has been
PRODUCT PLANNING 249

illustrated clearly since deregulation in the US. Although the proportion ofpassengers using a transfer connection to accomplish their journey increasedonly marginally, from 48 per cent in 1978 to 53 per cent in 1984, the proportionof all passengers making an on-line connection with the same carrier rose from25 per cent to 45 per cent. Conversely, by 1984 the proportion of passengersinterlining or changing airlines en route had dropped from 23 per cent to only 8per cent.
Complexing of flight schedules ensures that the probability of the firstoutgoing service to any particular destination being by the same airline as thedelivering flight is disproportionately high. Interlineable fares therefore nolonger become necessary, and, even if a parallel journey from a competitor existson one leg of a connecting journey, there will now usually be a severe financialpenalty for using it. In other words, the hub carrier will offer a lower throughfare on its own services than can be obtained by using two separate carriers. Thepassenger also gains in terms of convenience and reliability from single airlineservice. The four largest US computer reservation systems (CRS) have supportedthis trend by giving listing priority to on-line connections over interline ones.Frequent-travel incentive programmes further encourage the use of on-lineconnections with the same airline rather than interlining onto a different carrier.
The result of all this is to ensure that an important airline at a particular hub interms of routes and frequencies will become even more dominant in its share oftransfer passengers.
Certain pairs of links created by hubbing will generate substantially moretraffic than others. Such demand can be stimulated by offering through services.Unlike traditional scheduling methods, whereby aircraft return on the same routefrom which they originated, they can now proceed on through the hub to thelocation with which there is most market potential. This is something Europeanairlines rarely do.
While hubbing can be an effective marketing tool it imposes certain costpenalties on the operating airlines. These are largely associated with the extrapassenger handling that is involved compared with direct flights. Each passengermaking a connection is involved in two boardings and disembarkations, atransfer of baggage at the hub and the use of two or three departure or arrivallounges. The costs of handling must be high. Moreover, the complexing offlights at the hub and the need to transfer passengers and baggage in the shortestpossible time create tremendous peak pressure on staff and facilities comparedwith a normal operation where demand is spread through the day. To meet suchpeaks of demand, extra staff will be needed and not only additional but also moresophisticated baggage- and passenger-handling equipment and facilities. Hub-and-spoke networks will tend to reduce the average sector distance flown by anairline’s aircraft and this will push up the unit costs (section 6.5 above). All directoperating costs will be higher, including airport landing charges since landings willbe more frequent. In a European context, where airport charges are especiallyhigh, this may be a severe cost penalty. Each passenger has to be transported
250 FLYING OFF COURSE

much further than if they were being flown direct. So this must also push up thecosts for connecting passengers. To set against these higher costs, theconsolidation of several thin traffic flows into a denser flow along a spoke to ahub offers scope for cost reduction—first, through the use of larger aircraft withlower unit costs, and secondly through the ability to push up the annualutilization, that is the flying hours, of each aircraft. In theory, consolidation offlows should allow airlines to achieve higher seat factors, but there is littleevidence of this in the United States.
Consumers clearly benefit from hub-and-spoke systems in that they can fly tomany more points with higher frequencies and, where necessary, shorterconnecting times than was the case before hubbing became so finely developed.On the other hand, passengers who as a result of hubbing are deprived of directservices which might otherwise be operated are clearly worse off. Their journeytimes may be longer and their fares higher. There may be other disadvantagestoo. Hubbing is very dependent on excellent punctuality, and delays anywherecan throw whole ‘complexes’ into disarray, with serious knock-on effects. Theshort transit time between arriving and departing flights can create havoc intrying to handle large volumes of connecting baggage. It is not surprising thatpassenger awareness of and concern with punctuality and misdirected baggagehas increased significantly in the United States as hubbing has spread.
Once airlines have established dominance at a hub through control of adisproportionate share of the flights offered and traffic uplifted, it is verydifficult for another airline to set up a rival hub at the same airport, because it isunlikely to get enough runway slots to offer a similar range of destinations. Thehub operator will also control most of the terminal gates. If the new entrantchooses to compete on just a few direct routes from the hub airport, it will face acompetitive disadvantage vis-à-vis the hub airline in terms of ensuring adequatefeed for its own services. The alternative may be to set up an entirely new hub ata relatively underdeveloped airport, as American Airlines did at Raleigh-Durhamin Virginia. Hub dominance, which is becoming more widespread, raises the riskfor passengers of abuse of such oligopoly power, particularly in relation to fares.
Significantly, the average fare per mile in 1988 at the eight most concentratedhubs in the United States was higher than the national average. Adjusting for theaverage trip distance and the size of the market serviced at these eight hubs(where one airline boarded 70 per cent or more of the passengers), fares were onaverage 18.7 per cent higher than similar markets for other airports. This findingby a US Department of Transportation Task Force supports the conclusion thathigh hub concentration and market dominance leads to higher fares forpassengers travelling to and from such cities on hub-and-spoke networks (Dept.of Transportation, 1990). Control of a hub has increasingly been seen in the UScongress as being potentially if not actually anti-competitive. The criteria whichhave been suggested for assessing monopolistic influence are 40 per cent ofemplanements at an airport by a single airline and 60 per cent for two airlines(Avmark, 1989).
PRODUCT PLANNING 251

The US airlines have appreciated the operational and marketing benefits ofhubs and have begun to develop overseas hubs in Europe and Tokyo(section 3.10.5 and Figure 3.1 above). Most European airlines have failed to usetheir hubs as marketing tools. They have always operated a hub-and-spokesystem, because of constraints imposed by bilateral air services agreements, butthey have generally not built up a pattern of arriving and departing complexes totake advantage of that system. They have paid lip-service to the concept but havefailed to learn from US experience. This can be seen by the lack of effectivetimetable coordination at their hubs.
On-line schedule coordination can be measured using a connectivity ratio,which shows the degree to which linkages are more than just purely random. Itallows for varying volumes of flights operated and different minimum connecttimes at each of the hubs. A ratio of 1.0 suggests connections are no better thanwould be expected with a random pattern of schedules. A ratio of 2.0 suggeststwice as many connections as would be achieved on this random basis. Amongthe European majors, Austrian at Vienna, Swissair at Zurich and KLM atAmsterdam stand out as having integrated schedules, with a connectivity ratioaround 2.0 (Table 10.3). Conversely, British Airways and Alitalia offer on-lineconnections that are little more than random overall, while Air France’s andOlympic’s connections are even worse. These are the airlines that have thegreatest need to use their hubs more effectively and to learn from US experience.
US experience shows that an effective future hub must possess three features:a central geographical position in relation to the markets it is to serve; amplerunway capacity; and a single terminal building for the hub airline. Strong localdemand, although helpful, is less necessary. Complexing of schedules forconnection purposes is essential, as it is only by this means that a quality servicecan be provided in a large number of target markets.
As European air transport is progressively liberalized, will European airlinesdevelop more effective hub-and spoke systems, perhaps using relatively lessdeveloped airports such as Brussels or Lyons in France? Two problems maylimit the effective spread of hubbing. First, most of scheduled air transport inwestern Europe involves short sectors of less than 2 hours where having to makean en route connection significantly lengthens the journey time. Moreover,unlike the United States, on many of these sectors high-speed trains will makenon-stop air services a competitive requirement. Secondly, the EuropeanCommission is likely to be increasingly critical of the potential abuse ofdominant airlines at hub airports.
10.4Comfort-based product features
The schedule-related features of an air service appear to be more important inmost markets than comfort-based features, but they cannot be adjusted rapidly. Inmany cases they cannot be changed at all, either because an airline already has a
252 FLYING OFF COURSE

network and schedules which meet market needs or because of externalconstraints such as the bilateral air services agreements or an absence ofavailable runway slots. Yet, as markets have become more competitive, the needfor product innovation has intensified. Since schedules, in most cases, can bechanged only in the medium term, if at all, airline product development has oftenconcentrated on improving comfort-based features, which can be changed morereadily and quickly. Three aspects of the airline product are important indetermining passenger perceptions of comfort.
Table 10.3 European hub performance, 1989
Airport Hub airline Connectivity ratioa
Vienna Austrian 2.2Amsterdam KLM 1.9Zurich Swissair 1.9Frankfurt Lufthansa 1.6Brussels Sabena 1.6Copenhagen SAS 1.4Rome Alitalia 1.2London-Heathrow British Airways 1.1London-Gatwick British Airways 1.1Madrid Iberia 1.0Paris CDG Air France 0.9Athens Olympic 0.9Note:a The connectivity ratio is the good connections actually achieved as a ratio of
connections possible if all schedules were purely random.Source: Dennis (1990).
The first is the interior layout and configuration of the aircraft, which affectsthe width and pitch of each seat and thereby determines the space available foreach passenger. Space seems to be the key comfort variable. There is a trade-offbetween seating density and unit costs in that the more seats that can be put intothe aircraft the lower are the operating costs per seat. Thus deciding on seatingdensity has major cost implications (see Table 6.6 above). Other aspects of theinterior lay-out which an airline must decide on, since they affect the nature of theproduct it is offering, include the number of separate classes of cabin andservice, the number of toilets, the types of seats installed, interior design andcolours used, and so on.
The second important area where decisions have to be made is that of in-flightservice and catering standards. This covers the nature and quality of food andbeverages provided, the number of cabin staff, the availability and range ofnewspapers and magazines, in-flight film entertainment, give-aways for first- and
PRODUCT PLANNING 253

business-class passengers as well as for children, and so on. A great deal ofeffort goes into planning airline meals and meeting target catering standards.Again there are cost implications and as a result the composition of meals isplanned down to the precise weight of a pat of butter or the weight of the saucegoing on a meat dish. While airlines place much emphasis in their advertising onthe quality of their food and wines, there is little evidence that gastronomicpreferences determine choice of airline for a journey. However, cateringstandards together with the quality and attentiveness of the cabin staff may createa certain image for a particular airline which may be important in marketing terms.
Lastly, the services offered to passengers on the ground are a key componentof the product. An airline has to consider whether to provide its own check-inand handling staff or to use another airline or handling agent. It must decidewhat is an acceptable average waiting time for check-in for its passengers, sincethis will determine how many check-in desks it needs for each flight. More deskscost more money. Then the airline must determine the nature of any specialground facilities for first- and business-class passengers, such as special lounges,office services, car parking valets, or the provision of limousine service tocollect and deliver passengers from their homes or offices. Surveys suggest thatmany business travellers are primarily concerned with speed through theterminal rather than comfort as such. To speed up the check-in process,particularly when baggage is involved, airlines have been experimenting withautomated check-in and the ATB (automated ticket and boarding pass) as well asoff-airport check-in at hotels (SAS) or railway stations (Lufthansa, BritishAirways). The ground environment and quality of service provided can have animportant influence on a passenger’s perception of an airline, but they areinevitably affected by the actions and efficiency of the airport authority. This iswhy more and more airlines are wanting to operate and possibly own the terminalsthey use. This is fairly common in the United States but rare elsewhere.
It is primarily in the comfort-based aspects of the airline product thatdistinctions between the products offered to different classes of service by thesame airline become most apparent to passengers. This means that airlineproduct planners have a complex task. They must specify differing comfort-based product features for the different market segments they are trying toattract. Not only may product features have to be varied by class of cabin andtype of ticket but the same cabin class may require different product features ondifferent routes or geographical areas. Thus business class in Europe does nothave the same product specification as business class on Europe to Asia services.The range of business-class product features found on the London-Far East routein 1989 can be seen in Table 10.4.
Because they can be more easily changed and more readily advertised,comfort-based product features are continuously being monitored and revised.There is a constant requirement to respond to product changes introduced bycompetitors and an even greater need for an airline to be the first to introduceinnovative changes. As international regulations have been relaxed, allowing
254 FLYING OFF COURSE
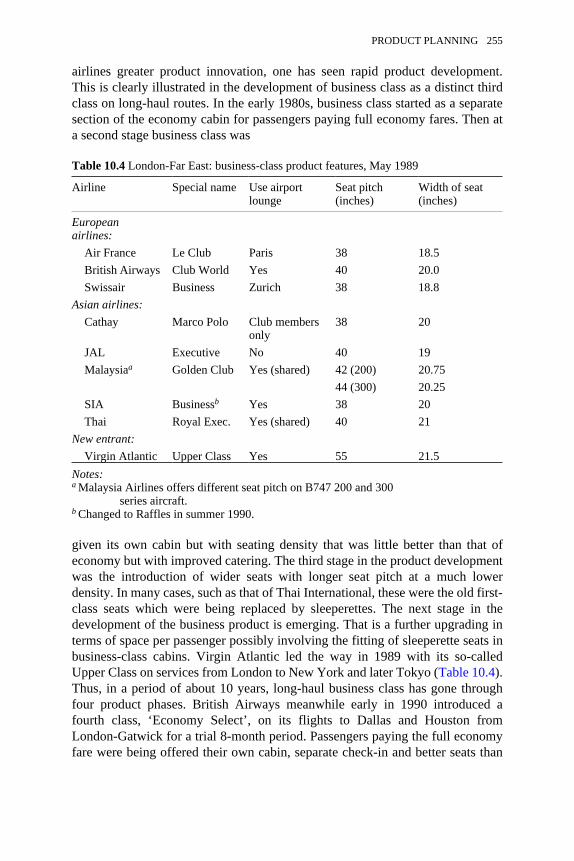
airlines greater product innovation, one has seen rapid product development.This is clearly illustrated in the development of business class as a distinct thirdclass on long-haul routes. In the early 1980s, business class started as a separatesection of the economy cabin for passengers paying full economy fares. Then ata second stage business class was
Table 10.4 London-Far East: business-class product features, May 1989
Airline Special name Use airportlounge
Seat pitch(inches)
Width of seat(inches)
Europeanairlines:
Air France Le Club Paris 38 18.5British Airways Club World Yes 40 20.0Swissair Business Zurich 38 18.8
Asian airlines:Cathay Marco Polo Club members
only38 20
JAL Executive No 40 19Malaysiaa Golden Club Yes (shared) 42 (200) 20.75
44 (300) 20.25SIA Businessb Yes 38 20Thai Royal Exec. Yes (shared) 40 21
New entrant:Virgin Atlantic Upper Class Yes 55 21.5
Notes:a Malaysia Airlines offers different seat pitch on B747 200 and 300
series aircraft.b Changed to Raffles in summer 1990.
given its own cabin but with seating density that was little better than that ofeconomy but with improved catering. The third stage in the product developmentwas the introduction of wider seats with longer seat pitch at a much lowerdensity. In many cases, such as that of Thai International, these were the old first-class seats which were being replaced by sleeperettes. The next stage in thedevelopment of the business product is emerging. That is a further upgrading interms of space per passenger possibly involving the fitting of sleeperette seats inbusiness-class cabins. Virgin Atlantic led the way in 1989 with its so-calledUpper Class on services from London to New York and later Tokyo (Table 10.4).Thus, in a period of about 10 years, long-haul business class has gone throughfour product phases. British Airways meanwhile early in 1990 introduced afourth class, ‘Economy Select’, on its flights to Dallas and Houston fromLondon-Gatwick for a trial 8-month period. Passengers paying the full economyfare were being offered their own cabin, separate check-in and better seats than
PRODUCT PLANNING 255
other economy passengers. Would this product innovation succeed and heraldthe reconfiguration of long-haul aircraft into four distinct cabins?
10.5Convenience features and the role of CRS
Convenience, as a product feature, is concerned with the ease of customer accessto airline reservation and ticketing services and the quality of such services. Akey decision area in any airline’s marketing is how to distribute and sell itsproducts and, in particular, how far it should use its own shops and sales outletsin addition to independent travel agents. Since airlines must pay commission onsales through agents, they have a vested interest in trying to sell through their ownsales outlets or directly over the phone, provided the costs of such sales outletsare less than the commissions they would otherwise have to pay. On the otherhand, the major benefit of agents is that they are very numerous and widelyscattered giving airlines a much wider distribution network at relatively lowercost than they could achieve themselves.
Part of an airline’s product planning is to assess the number, location andnature of its sales outlets as well as other distribution methods, from travellingsalesmen, to telephone reservations or automatic self-ticketing. Making a flightenquiry or a reservation and buying a ticket all normally involve personalizedcontact between the passenger or his representative and the airline. The ease andquality of that interaction, which may involve several contacts for just one airjourney, is an important product feature which can directly affect a passenger’sperception of an airline. The layout and spaciousness of the sales office, thespeed with which people are seen, the availability of open lines to the telephonereservations system, the helpfulness of counter or telephone staff, are some of theconvenience-based features which must be carefully planned and for whichservice targets must be set. As with other product features, there is a service-costtrade-off. As the service level improves, so the costs go up. An airline must findthe right balance to meet market requirements and expectations. British Airways,for instance, has 1,000 telephone sales agents in Britain alone, of whom 300 dealexclusively with travel agents while the rest deal with calls from both the publicand agents.
Most airline ticket sales are through travel agents. British Airways provides agood example of the importance of agents. In 1990 in the United Kingdom, itshome market, British Airways had over 40 travel shops and sales outlets of itsown but was dependent on 8,700 travel agents who were either approved by theInternational Air Transport Association (IATA) or members of the Associationof British Travel Agents. These travel agents generated around 70 per cent of theairline’s UK sales by revenue, while 25 per cent came from the airline’s ownoutlets and the remaining 5 per cent from sales by other airlines. World wide, closeto 80 per cent of British Airways’ sales are through travel agents or wholesale
256 FLYING OFF COURSE

tour operators. In the United States, according to the Department ofTransportation, 80 per cent of ticket sales for all airlines are by travel agencies.
There can be no doubt that the role of the travel agent in airline distribution iscritical. Despite the fact that they have no direct control over travel agents ortheir staff, airline marketing managers need to ensure two things: first, thatagency staff provide an efficient, speedy and reliable service to any potentialcustomer; secondly, that, where alternative airline products are available, agents’sale staff give preference to their own particular airline. They have tried toachieve both these objectives through equipping agents with direct links to theirown airline’s computer reservation system and through paying commissions tobuy agent loyalty. In the United States and a few other markets, airlines havealso tried to ensure passenger loyalty through ‘frequent-flyer’ incentiveprogrammes. Under such schemes passengers are awarded points for each flighton a particular airline. As their points total builds up they are entitled toincreasingly attractive free flights or other travel benefits. Free flights willnormally be offered only on low load factor services, so the airlines can claimthat the cost of their schemes is low. Frequent flyer programmes have beenaimed at the full-fare business travellers who generate relatively more airlinerevenue. Many businesses, however, have begun to appreciate that such schemeshave led to higher fares and unnecessary journeys and are beginning to controltheir employees’ travel more tightly.
Deregulation and increasing competition has meant that airlines have had toincrease their commission payments to agents to ensure that their tickets werebeing sold. This is most evident in the US domestic market. In 1978, beforederegulation became effective, most of the US domestic trunk carriers werepaying out 4–5 per cent of their revenue as commission. By 1988 the averagefigure was 8–10 per cent, and one or two carriers such as Pan Am were paying wellover 10 per cent of their revenue. In some US markets by 1990, airlines werehaving to pay 20 per cent or more of the ticket price to agents. This wasparticularly the case for the smaller airlines and for foreign carriers with only alimited marketing base in the United States such as Thai International orMalaysia Airlines. Outside the United States, attempts by IATA and individualairlines to hold commission rates at low and fixed levels were gradually beingeroded in many markets. The higher commission rates arise from the incentivesoffered by airlines to agents to book passengers on their flights rather than thecompetitors’. A major incentive is the override commission. This enables anagency to claim a higher commission rate than the normal when it gives anairline a higher share of its ticket sales or surpasses certain agreed sales targets.Through their extra override commissions, airlines try to tie agents into sellingprimarily or exclusively their tickets.
The other way of tying agents in is by offering to install the airline’s owncomputer reservation system (CRS) in the agents’ outlets and shops. Each airlineowning a CRS encourages agencies, through free installation and otherincentives, to install its system since its share of tickets sold is normally higher
PRODUCT PLANNING 257
when an agent is using its CRS. Numerous studies show a strong associationbetween agents’ CRS affiliation and the share of bookings on the airline owningthe system (Dept. of Transportation, 1990). There are several reasons for this‘halo’ effect. Travel agents often have more confidence in the accuracy ofinformation on the airline owning the CRS than in the information on otherairlines also shown on the same computer. Some agents also claim that allreservation and ticketing functions can be completed more rapidly for flights ofthe CRS vendor airline than for other airlines. In addition, the on-going businessrelationship between the agent and the vendor airline itself creates loyalty. Sincemost agents are reluctant to have several computer systems installed, the airlinewhich gets its CRS into an agent first clearly enjoys a privileged position. The haloeffect can be seen in the fact that between 1980 and 1986 the domestic passengerload factors on both American Airlines and United, which own the two largestCRSs, were consistently above the industry average in the United States. Thiscannot have been due just to superior marketing and service.
The advantage enjoyed by the airline offering the CRS has been reinforced inthe past by bias in the way airline schedules were displayed. US experiencesuggested that 80 per cent of bookings were made from flights shown on the firstpage of the computer screen and 50 per cent from the first two lines. Hostairlines therefore manipulated their listing criteria so as to ensure that their ownflights appeared at the top of the first computer page. For instance, a Galileoexecutive complained at the end of 1987 that British Airways’ Los Angeles-London flights appeared on page 11 of the Sabre CRS display of direct servicesbetween the two cities (Gallacher, 1988). The way that bias was introduced intodata presentation has been documented elsewhere (e.g. AAE, 1987; Lyle, 1988;Whitaker, 1988). In the United States, rules to eliminate anti-competitive bias inscreen displays, introduced in 1984 by the Department of Transportation, werenot wholly successful. They were due to expire at the end of 1990 and werebeing reviewed. In Europe in 1989 both the European Civil AviationConference, covering 23 states, and the European Commission introducedtougher codes of conduct for any CRS operating within their member states (seesection 4.3.6). The Commission also took action under Article 86 of the Treatyof Rome to ensure that Sabena and later KLM listed smaller airlines, previouslyrefused access, in their reservation systems.
Through government intervention and self-restraint, the issues of display biasand of ensuring equal and fair access to any CRS by all airlines are beingresolved. Other problem areas remain, however. One is how to deal with the‘halo’ effect; that is, how to avoid the unfair advantage in bookings throughtravel agents enjoyed by the airlines which own the CRS used by the agents.Another is the high fees charged by CRS owners for bookings made on otherairlines’ flights.
Profits earned by CRS owners have been excessively high. In 1986, AmericanAirline’s Sabre CRS produced a profit of $178 million out of a total revenue of$372 million, while United’s Apollo system generated $136 million profit from
258 FLYING OFF COURSE

revenues of $318 million. The smaller systems, apart from Datas II, were alsohighly profitable. In most cases, airlines owning a CRS made relatively higherprofits from their investments in these systems than from their airlineinvestments. Moreover, control of a CRS enabled their owners to survive theperiod of mergers and consolidations which beset US airlines in the second halfof the 1980s. Airlines in the United States without their own CRS were in animpossible situation. To gain access to the markets and the agents they had tojoin the existing CRS, but in doing so they merely generated additional CRSprofits for their competitors. Smaller airlines could not afford to set up their ownsystems both because of the cost, running into several hundred million dollars,and because of the difficulty of getting any new system installed in travelagencies that already had one of the existing CRSs.
Certainly in the United States, airline bookings were dominated by two majorsystems, Sabre and Apollo (Table 10.5). The dominance of these systemsappeared to be creating a CRS oligopoly. This was highlighted early in 1989when Delta Airlines announced a merger between its own Datas II computerreservation system and the Sabre system. The new system would have controlledclose to 50 per cent of the market (Table 10.5). This was too much for theDepartment of Justice, which threatened to try to block such a deal on anti-trustgrounds. The deal collapsed, but a year later in 1990 a merger between the twosmallest US reservation systems, Datas II and Pars, created a new system calledWorldspan. This time there was no opposition from the Justice Department.
The marketing power of the larger CRSs can be gauged not only by theirmarket share in the United States but also by the number of outlets linked intotheir systems. In 1990 Sabre had 13,000 United States outlets and 1,900international outlets. Covia’s corresponding figures were 9,750 and 1,125;Worldspan’s 11,000 and 1,350, and SystemOne’s 6,900 and 790. The Europeanand Asian CRS, which began to come on line in 1990, had many fewer totaloutlets by comparison, though their international outlets were more comparable.
The huge marketing power of the super CRSs, the undue sales benefits theyappear to bestow on their airline owners through the ‘halo’ effect, their highprofits and the potential risk of bias in their schedule displays led to mountingcalls for airlines to disinvest themselves from their CRS. For instance, in the UKthe House of Commons Select Committee on Transport published a report in1988 claiming that airline ownership of CRSs was against the public interest andwas open to abuse (HMSO, 1988). It recommended that a long-term solutionthrough airline divestiture of CRS should be explored, that in the meantimeownership of each individual CRS should be spread among more airlines andthat CRSs should be restructured as separate companies with shares available forsale. Since 1988 two parallel developments have gone some way to meeting theSelect Committee’s recommendations and in the process have reduced the risksof abuse of dominant power by airlines’ CRSs. The first is the trend towardsmultiple ownership. The second is the loosening of links between CRSs and theirairline owners.
PRODUCT PLANNING 259

Table 10.5 Market share of US computer reservation systems, 1988
CRS Airline owners (1989) Share of bookings in US (1988)%
Sabre American 43.1Apollo United (50%) 27.9(Covia) US Air
BAKLMSwissairAlitalia
SystemOne Texas Air 13.9Pars TWA 9.4
NorthwestDatas II Delta 5.7
100.0Source: US Department of Transportation.
Multiple ownership has come about because the very high investment costs ofsetting up a new large CRS in the late 1980s could not be financed by individualairlines. They had to group together both to share the costs and to share theirexisting sales outlets in order to get the sufficiently wide distribution systemneeded to justify the initial investment. European airlines set out to create asingle CRS but failed, and two parallel systems, Amadeus and Galileo, were setup in 1987, owned by two groups of airlines. Subsequently other multi-carriergroupings emerged in other parts of the world, such as Abacus in South EastAsia. To develop rapidly and catch up with the five US systems these new CRSsneeded partnership deals and technological knowhow from the Americans. Manylinkages emerged. By the end of 1987, Galileo, owned by nine Europeanairlines, granted Covia, United Airlines’ CRS, an equity stake. Subsequently, thefour major Galileo partners—British Airways, KLM, Swissair and Alitalia—bought a 38.7 per cent share in Covia, while US Air took 11.3 per cent and AirCanada 1 per cent. In turn by 1990 Covia became a 30 per cent partner inGemini, the CRS being developed by the two Canadian airlines, while Galileowas involved in setting up a CRS for Arab airlines. Amadeus, the other EuropeanCRS owned by four major carriers but with nearly 15 other partners, has beenhaving its software developed by Texas Air’s SystemOne and had a partnershipagreement with the Abacus CRS, which is owned by five East Asian airlines.Abacus in turn is a partner in Infini, All Nippon Airways’ own reservationsystem. As previously mentioned, the merging of Datas II and Pars intoWorldspan in 1990 created a CRS jointly owned by three airlines—Delta (40 per
260 FLYING OFF COURSE

cent), Northwest (33.3 per cent) and TWA (26.7 per cent). Abacus was expectedto take a 5 per cent share in Worldspan too. During the 1990s such linkages andcross-shareholdings will multiply. This will make bias towards one airlineincreasingly difficult, especially as the major CRSs will all be listing eachother’s airlines as well as their own.
A new technical development has also helped in the elimination of bias. TheDatas II-Pars merger into Worldspan in 1990 was allowed by the US JusticeDepartment because the partners involved planned to develop an entirely newand independent ‘no host’ CRS, the first in the United States. This is a CRSwhich is separate from an owner airline’s own internal reservation system anddoes not give the owner airline any preferential treatment. As a result, an agentusing the system can be assured of the same level of reliability and accuracy forall participating airlines and equal treatment by them all, since the CRS in noway favours the owner airline. This should remove the causes of the ‘halo’ effect(Simpson, 1990). The ‘no host’ technology had already been adopted by bothGalileo and Amadeus. Other CRSs were likely to follow suit.
Their size and multiple ownership, together with complex agreements tosupply technology to each other, have all tended to push CRS companies tobecome increasingly independent of their airline owners and to operate asbusinesses in their own right. Early in 1990, Texas Air sold 50 per cent ofSystemOne to Electronic Data Systems of General Motors, the first major non-airline involvement in CRS. The high rates of return and their excellent long-termprospects will inevitably attract further external investment into airline CRSs.
Airline marketing managers must appreciate that CRSs are much more than aworldwide distribution system through which they can give travel agents andpotential customers access to flight information, instant reservation andticketing. The systems enable airlines to monitor and control sales in real time soas to improve passenger and freight yields. They provide subscribers withinformation and booking facilities for hotels, car hire, theatres, restaurants andother entertainments, as well as details of passport, visa and health requirementsin different countries. In addition, for the airline partners they provide aninvaluable database on their customers—when and where they bought theirtickets, the fare they paid, where they live, their credit cards, smoking habits,seat preferences, travel patterns, and so on. All these data, broken down andanalysed by market segments and route, can provide a crucial input into anairline’s marketing and product planning. No international airline can afford toremain aloof from a large CRS serving its markets unless possibly it is a smallniche carrier.
It is going to be critical for airlines not only to join global or regionalcomputer reservation systems but also to make optimum use of the database CRScan provide in order to maximize their revenues and improve their marketing.Airlines that fail to do this in the years ahead will find themselves losing thecompetitive battle.
PRODUCT PLANNING 261

10.6Airline image
The final group of product features are those associated with the image that anairline wishes to create, both among its own customers and among the public atlarge. This is done in a variety of ways: through the nature of its advertising andpromotions, through the airline’s logo, its colour schemes, and the design of itsaircraft interiors, sales offices and airport lounges, and through the quality ofservice provided by its staff in the air and on the ground. The success of SIA’s‘Singapore Girl’ advertising campaigns during the 1980s created the image notonly of helpful, smiling, attentive cabin staff but also of an airline that took careof its passengers. This image was an important factor in enabling SIA tomaintain unusually high passenger load factors throughout the period. A keyelement in image building is to ensure that what is promised before the flightactually materializes and meets passenger expectations when the flight takesplace. This is why marketing and product planning must be all-embracing,covering what is produced and how it is produced as well as how it is sold.
As markets have become more competitive, a number of airlines haveintroduced the concept of ‘branding’ to try to differentiate their products fromother airlines’ products selling at the same fares. The first step in this process oninternational flights was seen in the mid-1980s when airlines began to give theirbusiness class distinctive names, even though the product offered in terms ofspace and comfort was broadly similar. Some examples are shown in Table 10.4above. Then in 1988 British Airways set up brand teams to develop and launchtwo distinct products, Club Europe and Club World for the European and long-haul business traveller. The aim was to plan and produce two separate products,each of which would have the same distinctive British Airways product featuresand quality on whichever route or geographical area they were being offered.These product features would differentiate Club Europe and Club World fromother airlines’ business class by creating a distinct image and product. BritishAirways claimed this policy was highly successful. Passenger numbers in ClubWorld increased by 27 per cent in the first two years after its introduction. On anumber of routes, notably on the North Atlantic, where Club World passengerload factors regularly exceeded 80 per cent, British Airways was forced to increasecapacity in response to demand. In some markets the airline was able to charge apremium over the normal business-class fare for its own distinctive product. Asinternational regulations on fares and capacity decrease further, then brandingwill increasingly become an important competitive tool affecting an airline’smarket image.
262 FLYING OFF COURSE

11Pricing Policies and Fare Structures
11.1Objectives of airline pricing policy
Pricing is a crucial element in airline management. It is the mechanism wherebythe demand for air services is matched with the supply. The airline’s primary aimmust be to sell the capacity it is prepared and able to offer at prices which willgenerate sufficient demand to ensure an adequate level of profit. A great dealhinges on what each airline considers an adequate profit. For some state-ownedairlines, it may mean little more than breaking even. For others, it may bemeasured in terms of an adequate rate of return to shareholders or a target rate ofreturn on the value of the assets employed. Some airlines may go further and setout not only to produce a target rate of return on their current assets but also togenerate an adequate reserve fund to self-finance, as far as possible, theacquisition of new assets. Singapore Airlines appears in recent years to havefollowed this last objective. Thus even the profit objective in airline pricing mayhave different implications for different airlines. There is also a temporaldimension to the profit objective. While some airlines may be concerned morewith current profits, others may place the emphasis on longer-term profitability.They may be prepared to forgo profits in the short term to ensure their longer-term objective.
International airlines will normally have a clear profit objective, but it will beonly one of a number of corporate objectives. These other objectives may alsoimpinge on pricing policy. Expansion into new routes and new markets figureslarge in many airlines’ corporate objectives. Expansion may be an objective in itsown right or the ultimate aim may be rapid growth or the attainment of aparticular size of operation. Many airlines want to be big! There may be costadvantages from growth, but ultimately the purpose of growth seems to be moreakin to a revenue-maximizing objective. If development of new markets or rapidgrowth are objectives of an airline’s pricing policy, then the pricing strategies itadopts must be coloured by this fact. We have already seen in discussing the impactof deregulation (section 3.10.2 and Table 3.1 above) how new entrants, such as

Braniff, moving into markets with established carriers, have tried to capturemarket share by offering lower tariffs.
The adverse cost impact of large seasonal or even daily variations in demandmay induce airlines to use the pricing mechanism as a way of evening out thosefluctuations. This might be done by using high tariffs to restrain peak demandand lower tariffs to stimulate off-peak traffic. Such a policy may adversely affectthe total revenue generated compared with a policy of expanding the supply ofservices at the peak periods. However, revenue maximization may be lessimportant in the short term than reducing unit costs through a reduction in thepeakiness of demand and hence of supply.
Pricing has a further role. It should in theory be a guide to new investment.Where the number of consumers who are prepared to pay the full cost, includinga reasonable profit, of the goods or services they consume exceeds the supply,then the producers have a clear indication that, if they can supply more at thesame or a lower price, demand will be sufficient to generate further profits.Conversely, if consumers in total do not generate sufficient revenue to cover thefull costs of particular services, then it would be foolhardy to invest in theexpansion of such services. If pricing is to be used as a guide to furtherinvestment, then the prices of different services should reflect their costs ofproduction. If not, demand may be artificially high or it may be suppressed. Ontwo or three occasions very low tariffs on the North Atlantic, as in 1978–9,generated a surge in demand which pushed up load factors to high levels. Manyairlines misread the signs and increased the capacity on offer. This was a recipefor financial suicide. The low tariffs were feasible only if mixed with a certainproportion of high-fare business and first-class traffic. Putting on extra servicesto cater exclusively for the low-yield traffic was ruinous since the revenuegenerated was insufficient to cover the costs. The pricing mechanism as a guideto further investment must be used with care.
In short, few international airlines have a single overriding objective in theirpricing policy, though the attainment of profitability looms large, especially forprivately owned airlines. Most want their pricing policy to achieve a number ofinternal objectives. But they may also have externally imposed objectives. Somenational airlines are required by their governments to stimulate incoming tourism.This may well require a low-fare policy irrespective of its repercussions on thefinancial fortunes of the airline itself. The attempt to attain different pricingobjectives simultaneously may produce conflicts and contradictions in pricingpolicy. Such conflicts and complexities in pricing are further increased becausethe same airline may be pursuing different objectives on different parts of itsnetwork. It may be trying to maximize profits on some routes, especially those inwhich there is little or no tariff competition, while on other routes its primeobjective may be increasing its market share or its rate of growth. Inevitablywithin any airline different pricing objectives will prevail at different times andin different parts of their operations.
264 PRICING POLICIES AND FARE STRUCTURES

11.2The inherent instability of airline tariffs
Profitability, which appears to be an important objective for most airlines,depends on the interplay of three variables: the unit costs, the unit revenues oryields, and the load factors achieved. Airline managers must juggle with all threeto produce a profitable combination. This is a dynamic and interactive processmade more difficult by the pricing instability inherent in the airline industry. Theindustry is characterized by short-run marginal costs which are close to zero. Themarginal cost of carrying an extra passenger on a flight which is due to leavewith empty seats is no more than the cost of an additional meal, an airportpassenger charge and a few pounds of fuel burnt as a result of the extra weight.The problem is that, even when operating with high load factors of 70 per cent ormore, there will be many empty seats. These cannot be stored or sold later. Ifthey are not sold at the moment of production, the seats and the seat-kilometresgenerated are lost forever. The same considerations apply to unsold freightcapacity. An airline committed to operate a published schedule of services for aparticular season or a tour operator committed to a series of charter flights findthat their short-run total costs are fixed and cannot be varied. Therefore it makesbusiness sense to try to maximize revenues. Having sold as much capacity aspossible at normal tariffs, the airline or tour operator is tempted to sell anyremaining empty seats at virtually any price above the very low marginal cost ofcarrying the additional passengers.
The problem is to prevent slippage or diversion of traffic prepared to pay thenormal tariffs into the low tariffs. If that happens then the total revenue generatedmay decline. In markets where tariffs are regulated and enforced, diversion isprevented or minimized by the conditions (the so-called ‘fences’) whichcircumscribe the availability of the very low tariffs (see section 11.6 below). Inmarkets where tariffs are not regulated or, if regulated, are not enforced, the lowmarginal cost of carrying an additional passenger (or freight consignment) has astrong downward pressure on all tariffs, including the normal economy, businessor first-class fares. The inherent instability in such markets is made much worseif there are no controls on capacity or if the entry of new carriers is easy. It is inconditions of over-capacity that airlines are most likely to resort to marginal costpricing. After the total deregulation of the US domestic system, the relationshipbetween costs and tariffs in the early 1980s largely disap-peared. Tariffs weredetermined by competitive factors, and on many routes tariffs approached long-run marginal costs while on others only short-run marginal costs had anyrelevance to pricing. Since short-run marginal costs were close to zero and long-run marginal costs were below average costs, losses and airline collapses andmergers ensued until a more oligopolistic and less competitive market structureemerged.
In less regulated international markets, the price instability is aggravated by anumber of additional factors. One of these has already been mentioned and that
FLYING OFF COURSE 265

is the tendency of new entrants in established markets to try to capture marketshare by undercutting existing tariffs. For instance, when All Nippon Airwayslaunched its transpacific services in July 1986 it cut the minimum selling pricefor Tokyo-Los Angeles by $100 from $550 to $450. The most significant factorand the most widespread, even affecting regulated markets, is the availability ofsixth freedom capacity. While the point-to-point, third and fourth freedomcarriers on a route may be trying to maintain an adequate mix and level ofdifferent tariffs, sixth freedom carriers operating via their own home base may beprepared to charge almost anything to fill empty seats with traffic that theywould otherwise not have had. The sixth freedom operators’ tariffs will beparticularly low if they want to compensate passengers for having to stop over fora night en route to their destination. In 1990, the lowest fares between the UKand South East Asia were with Aeroflot via Moscow or JAT via Belgrade, while,between London and Bangkok Biman Bangladesh Airlines was the cheapest. Ifsuch sixth freedom carriers begin to capture significant market shares, the directcarriers must react by reducing their own fares. When the sixth freedom operatoris also a new entrant into that market anxious to capture some market share, thenfares are likely to plummet. In 1987, Malaysia Airlines started its services acrossthe Pacific to Los Angeles. A few months later in February 1988 it was the priceleader on the Pacific as it struggled to establish itself. It offered travel agents returntickets Los Angeles-Bangkok via Kuala Lumpur at a net selling price of only$520. Korean, another sixth freedom operator on the same route, had a minimumprice of $650–750, while Thai International, the established third/fourth freedomoperator, was selling at no less than $800. In most long-haul internationalmarkets a great amount of spare sixth freedom and sometimes fifth freedomcapacity is slushing around and depressing tariffs. On some routes there may bethe additional problem of the marginal carrier, that is the airline for which theroute is marginal to its total operation. It may therefore be unconcerned by lowfares on the route, particularly if it sees them as a way of attracting traffic ontothe rest of its network. This has certainly happened with new entrants on theNorth Atlantic or the transpacific routes.
On other routes, price instability may be increased by the actions of financiallyweak or subsidized carriers. Surprisingly it is the weak or loss-making airlineswhich drop their prices most in competitive markets in order to generatesufficient cash flow to meet their day-to-day payments. During the 1980s,Garuda, Indonesian and Philippine Airlines offered the biggest discounts onservices to South East Asia as they were losing money and became desperate toimprove their cash flow. In 1986, People Express, as it struggled to survive,slashed its fares, offering the first 30 seats sold on its London-New York servicesfor $99 and the next 70 seats for $149. Despite these efforts, it virtually collapsedlater in the year. Some national airlines may continue operating on certain routesat yields and load factors which are uneconomic because of their ability to relyon subsidies to cover their losses. In the process, however, they depress themarket for other carriers. Lastly, the tendency for airlines to sell seats en bloc or
266 PRICING POLICIES AND FARE STRUCTURES

on a part-charter basis to tour operators or travel agents reduces the airlines’ability to control the tariffs at which those seats will ultimately be sold to the public.
The low marginal cost of carrying additional traffic, together with the otherfactors discussed which undermine price stability, mean that internationalairlines often have a strong incentive to reduce tariffs or introduce illegaldiscounts. The characteristics of international airline operations are such thattariffs are not enforceable unless the airlines themselves decide to enforce them.Even government controls are ineffective without airline acquiescence, sinceairlines can find countless ways in which to circumvent regulatory tariffrestrictions. Without airline self-control and enforcement of tariffs and tariffconditions, the inherent instability of air transport markets may well push tariffsto levels at which no operator can make a profit except for short periods. It is thisfear above all else that pushes airlines to try to reach agreement betweenthemselves on tariffs and on enforcement. A striking example has been the yieldimprovement programmes instituted by the Orient Airlines Association, severalof whose member airlines have been standard-bearers of deregulation and criticsof the International Air Transport Association (IATA). Yet they continue tocome together periodically to establish minimum selling prices or maximumdiscounts on air services between their countries.
11.3Alternative pricing strategies
In developing their pricing strategies, international airlines must bear in mindboth their pricing objectives and the inherent instability of airline tariffs. Broadlyspeaking, two alternative strategies are open to them. The first is to relate eachtariff to the costs incurred in providing the services used by those paying thattariff. This is ‘cost of service’ pricing, more frequently referred to as cost-relatedpricing. The alternative is to base tariffs for different categories of service not oncosts but on what consumers are able and willing to pay. This is market pricing ordemand-related pricing, though in more traditional textbooks the concept hasbeen called ‘charging what the traffic will bear’.
During the last decade several regulatory authorities and European governments(CEC, 1981) or the Commission of the European Communities (CEC, 1984)argued most strongly in favour of cost-related pricing. The UK Civil AviationAuthority as long ago as 1977 outlined the fundamental principles to be pursuedin developing airline pricing policies (CAA, 1977c). It suggested that ‘charges…should be at the lowest level which will cover the costs of efficient operators,including an adequate return on capital; each charge should be related to costs,and that tariff provisions should be rational, simple and enforceable…’.
The arguments in favour of cost-related pricing hinge on the twin issues ofequity and economic efficiency. It is considered inequitable that some consumersof air services should be charged more than the cost of providing those serviceseither to generate excess profits or in order to cross-subsidize consumers who are
FLYING OFF COURSE 267

paying less than the full cost of the services they consume. From this point ofview, the 50 per cent discount for children under the age of 12 is clearlyinequitable. It does not cost less to carry a child than an adult and, by chargingchildren only 50 per cent of the fare, other adults have to pay more tocompensate for the revenue loss. If tariffs are not cost related then they may wellbe discriminatory. That means that certain consumers will be discriminatedagainst not on the basis of costs they impose but on the basis of their age, or theirmarital status, or for instance, because they want to spend fewer than six nightsat their destination.
There are efficiency implications as well. If prices are above cost for someservices, then demand for those services will be suppressed even though it wouldbe profitable to supply that demand at prices that were cost related. Conversely,prices below cost may generate excess demand for particular services and induceairlines to expand such services even though consumers are not meeting theirfull costs. This would clearly be a misallocation of resources. Unless tariffs arecost related, inefficient, high-cost airlines will continue to operate, protected byhigh tariffs. Consumers are thereby denied access to lower-cost facilities. Inreasonably competitive markets where there are several existing airlines orpotential new entrants, tariffs for different services will tend to the level of themost efficient operator, as happens in the European charter market. In marketswhere there is no price competition or ease of entry for new carriers, there are nocompetitive forces to push tariffs to the level of the lowest-cost operator. Tariffswill be agreed bilaterally or through IATA and will represent a compromisebetween the pricing strategies of the carriers on the route, each with differentcost levels. There may also be a tendency to charge what are effectivelymonopoly prices for certain inelastic market segments. Market forces cannotensure that tariffs reflect the costs of the most efficient suppliers. Regulatoryauthorities and other bodies, such as consumer associations, have argued that it isprimarily in regulated markets that cost-related pricing is needed to ensure equityand that tariffs reflect the costs of efficient suppliers. Cost-related pricing issupported both on social grounds in order to reduce discrimination betweenconsumers and on economic grounds in the belief that it creates pressures towardsimproved airline efficiency and a sounder allocation of productive resources.
On the other hand, several arguments can be put forward against the principleof cost pricing. The first of these is that there is no satisfactory way for transportindustries to allocate costs to particular users because of the incidence of jointcosts and of the high proportion of fixed costs that have to be allocatedarbitrarily. Joint costs arise when in producing one service another isinadvertently provided. A daily scheduled flight aimed at a business marketproduces freight capacity whether or not there is a demand for freight services.Its operations will also inevitably result in vacant seats which might be sold offto meet tourism demand. How is one to allocate the costs of that flight betweenbusiness passengers who were the prime objective in setting up the flight, andfreight or holiday travellers? Any allocation of joint costs must have an element
268 PRICING POLICIES AND FARE STRUCTURES

of arbitrariness in it. The same applies to certain fixed direct operating costs andto indirect costs. In practice, many but not all of the problems of airline costallocation can be overcome, as shown earlier (section 5.5). But somearbitrariness remains and it is argued that many airlines end up calculating whatis more akin to an average cost for all users rather than a separate cost specific todifferent categories of users.
Another argument against cost-related pricing is that on some routes such apricing strategy would not generate sufficient revenue to cover costs and wouldtherefore fail to ensure the continued operation of services. On a simple routewith one fare and one class of service, a cost-related fare may not generatesufficient demand to ensure profitability. On the other hand, if two marketsegments with different price elasticities can be identified, then the airlineconcerned may generate higher revenue by charging two separate fares to thetwo market groups even though there may be no difference in the cost oftransporting them. Without discriminatory but market-related tariffs the servicesmight be abandoned and all consumers would be worse off. Such a case wasillustrated in section 8.8 when discussing the concept of price elasticity.
Lastly, attempting to improve efficiency by setting tariffs at the levels of thelowest-cost operator may be meaningless in international air transport. Most airroutes are dominated by the third and fourth freedom carriers of the twocountries at either end of the route. These airlines may have quite different costsfor reasons quite unconnected with questions of efficiency. The prevailing wagelevels in each country may be different, as may the price of fuel or other factorinputs. Exchange rate movements may also have an adverse impact on oneairline’s costs. Cost-related pricing would produce a different set of tariffs foreach airline, yet the lower tariffs may not necessarily be those of the mostefficient carrier in terms of the resources used.
From an airline viewpoint, demand-related pricing strategies make much moresense. A scheduled airline that is committed to a published timetable of flightsand has brought together the productive resources to operate that timetable findsthat its short-run total costs are more or less fixed. In those circumstances itneeds the freedom to price its services in such a way as to be able to generatesufficient revenues to cover its costs. This may mean charging more than cost toprice-inelastic segments of the market and less than cost to elastic marketsegments. In competitive conditions, competition between carriers will ensurethat market-related pricing is not abused to produce excessive profit for theairline. Where effective competition does not exist, then there may well be adanger of excessive profits being made through discriminatory pricing with orwithout some capacity control. Government intervention to monitor costs, tariffsand airline profits may be necessary to prevent this happening, though there mustbe some doubt about how effective government intervention can be. Somederegulation of tariffs and capacity controls would be the most effective way ofminimizing the likelihood of excessive profits. Meanwhile, airlines can argue thatthey should have the freedom to offer a range of services at a range of prices
FLYING OFF COURSE 269

which meet some or all segments of demand in a way which ensures thecontinued supply of such services whether or not individual prices are costrelated.
While in the short term a strategy of market-oriented tariffs makes sense as away of maximizing revenues, it does not in itself guarantee profitability,especially in price competitive markets. Because of the inherent instability inairline tariffs owing to very low short-run marginal costs, market-related tariffsmay reach such low levels that the total revenue generated is insufficient tocover total costs. This is particularly so if extra capacity is provided to cater forthe demand generated by the low tariffs. While revenue maximizing might be ashort-term pricing objective, in the longer term airlines are likely to adopt aprofit-generating or loss-minimizing objective.
In order to achieve such objectives through their pricing strategies, airlines mustbe in a position to do three things. First, they must, in each of their markets, havea fundamental understanding of the different market segments and of theirrequirements as discussed earlier in Chapter 8 (section 8.5). Secondly, they mustensure that each separate category of traffic they carry, whether passengers orfreight, covers where possible the costs which it imposes on the airline. This,together with the need to evaluate the feasibility of aircraft investments, of newroutes and of different products, pushes airlines to consider carefully the costs ofthe different services they provide. Whatever pricing strategy they are forced toadopt by the market conditions on each route, the starting point for their pricingprocedures should be and normally is an evaluation of the costs of the differentservices they provide. Understanding the relationship between pricing and costsis fundamental to effective airline management and this is discussed in the nextsection. Lastly, because in many markets airlines will decide or will be forced tointroduce fares which are market related rather than cost based, they mustintroduce effective yield management in order to ensure that they maximize theirrevenues. In brief, the key to successful revenue generation is marketknowledge, cost awareness and yield management.
11.4Setting passenger tariffs
The starting point for any price-setting exercise is the costing of a particularroute or flight. In allocating costs to routes, airlines have to make some arbitrarydecisions, particularly with regard to the allocation of certain overhead and fixedcosts. Studies of European and other international airlines have indicated thatthere tends to be considerable uniformity in the allocation methods used andthese have been discussed in section 5.5. Where there are marked divergences inthe allocative process they tend to be in smaller cost items which have arelatively minor impact on the total route costs. Three major cost categories needto be identified. The first are the costs which are directly attributable to eachroute, that is, those costs which were previously described in Table 5.3 as the
270 PRICING POLICIES AND FARE STRUCTURES

variable direct operating costs. They are the costs which would be escaped if aparticular service or route was not operated at all. They include fuel costs,variable flight and cabin crew costs, landing and en route charges, and so on. Mostof these are easy to identify and cost specifically for each route. The one difficultarea is that of direct maintenance. This is allocated on the basis of either blockhours flown on each route or a combination of block hours and number oflandings. If a station at an airport on a route is used only for the services beingcosted, then all the staff and other ground expenses associated with that stationshould be attributed to the service. The second cost category is that of the fixed orstanding direct costs. These comprise aircraft standing charges, that is,depreciation and insurance, the fixed annual flight and cabin crew costs, andengineering overhead costs. Most airlines convert these costs into a cost perblock hour for each aircraft type. They then allocate them to each route on thebasis of the block hours generated on that route. The third category of costs thatneeds to be allocated is that of indirect operating costs. These include: the stationand ground costs that are not route specific; passenger service costs on theground, including passenger insurance; ticketing, sales and promotion costs; andthe general and administrative overheads. These tend to be allocated on the basisof some output measure.
In allocating costs to specific routes for pricing purposes one may wishinitially to exclude certain of the above costs which are passenger or freightspecific so that they can be allocated to particular categories of traffic later on.On the passenger side, these include the costs of in-flight services such as meals,free drinks, papers and give-aways, as well as the costs of cabin staff orpassenger sales and ticketing. The costs of particular ground facilities such asfirst- or business-class lounges should also be identified. Having established thejoint costs of a particular route or flight, but excluding the freight- or passenger-specific elements, these joint costs have to be split between passengers andfreight. This might be done on the basis of the capacity payload or usable volumeavailable for the two types of traffic (IATA, 1988) or on the basis of the tonne-kilometres expected to be generated by each, or even on the forecast revenuesplit (see section 12.5 below). On routes primarily intended for the carriage ofpassengers, some airlines might allocate virtually all the costs to the passengerside. This is a grey area in which it is difficult to argue that any solution isoptimal. Once a proportion of the joint route costs have been allocated to thepassenger side, the passenger-specific costs need to be added to these. The nextstep is to calculate the cost per category or class of passenger.
To understand the process whereby one arrives at a cost per passenger it iseasiest to examine an example. To do this one might consider the case of aDC-10 on a long-haul flight with three cabins, each with a different seatingconfiguration and seat pitch producing 24 first, 31 business and 168 economyseats. If the route cost per economy seat is assumed to be 100, then it is possibleto establish what the cost of the first- and business-class seats should be afterallowing for the extra space they require because there are fewer seats abreast
FLYING OFF COURSE 271

and a longer seat pitch. Such an analysis (line 5 of Table 11.1) indicates that,purely on the basis of their space needs, the ratio of fares in the three classesshould be 243:144:100. IATA analyses of costs based on space required indifferent classes come broadly to the same conclusion with ratios of 250:150:100,though they vary between airlines, aircraft types and routes (IATA, 1988). In ourexample, an adjustment might also be made for the greater proportion of spaceallocated to toilets and galleys, though this has not been done here. What if theplanned load factors of the three classes were different too? Airlines often plan toachieve average year-round load factors of no more than 50 per cent or 60 percent on first- and business-class traffic so as not to turn any high-yieldingdemand away. On the other hand, they will use various pricing mechanisms totry to ensure load factors well above 70 per cent in the economy cabin.Differences in planned load factor can be used to convert the cost index per seatinto an index of cost per passenger (lines 6 and 7 of Table 11.1).
Lastly, the passenger-specific costs need to be added in to the costingexercise. These include the cost per passenger of the different in-flight servicessuch as meals, drinks, films, headsets and newspapers and of any exclusiveground facilities. The higher ratio of cabin staff to passengers in first andbusiness should also be adjusted for. In broad terms, passenger-specific costs inbusiness class on a
Table 11.1 Unit costs of different classes on long-haul DC-10
First(F)
Business(J)
Economy(Y)
1 Cost per economy seat 1002 Seat pitch (inches) 55 38 343 Seat cost index allowing for seat pitch 162 112 1004 No. of seats abreast 6 7 95 Seat cost index allowing for pitch plus seats abreast 243 144 1006 Planning load factor 50% 60% 80%7 Cost per passenger adjusted for load factor 486 240 1258 Cost per passenger including passenger-specific costs 506 250 1309 Cost per passenger if Y=100 389 192 100
long-haul flight are likely to be about twice as high and for first-class passengersabout four times as high as those in economy class.
Typical passenger-specific costs have been added to the passenger cost indicesin Table 11.1, producing a final index of relative costs per passenger of 389:192:100. The significance of these indices is that, having earlier calculated to totalcost per flight of operating a DC-10 on the route in question, the relative tariffswhich need to be charged for each fare class can be derived. If purely cost based,the business fare should be twice as high as the normal economy fare, and the
272 PRICING POLICIES AND FARE STRUCTURES

first-class fare four times as high. A study of IATA airlines’ actual costs hasshown similar relationships (IATA, 1984).
The analysis so far has indicated that it is possible to identify the costs oftransporting passengers in three separate cabins each offering different productsin terms of seat density, comfort and in-flight service. If basing fares purely oncost, this would result in a simple structure of three separate fares, or twoseparate fares if aircraft are configurated in a two-cabin layout. A simple tariffstructure such as this may be adequate on routes where capacity and fares areclosely controlled and regulated and where competition from charters or indirectsixth freedom carriers is minimal. In more competitive market conditions or insituations where total demand at the cost-related fares is insufficient to covercosts, airlines may need to introduce some market-related fares. These willinevitably be various categories of low promotional fares aimed at generatingnew segments of demand or at diverting demand from other airlines or otherroutings. In economic terms the aim would be to take advantage of the high priceelasticity of demand of the low-fare market segments.
In this context, airlines may introduce off-peak fares at less than cost togenerate off-peak demand and, it is hoped, an increase in total revenue. However,they may well need to do more than that. Airlines will try to identify the needsand demand characteristics of particular market segments on a route (an examplewas given in Figure 8.1). They must assess whether existing tariffs and tariffconditions are attractive to each particular market segment and are generatingsufficient demand from that segment. If particular market segments are notadequately catered for, the airlines may need to examine their costs and fares tosee whether either can be adjusted to meet the needs of those market segments.In doing this airlines are conscious of the low marginal cost of carryingadditional passengers and of the short-term need to maximize revenue. Thisawareness has led to the development of a number of different pricing strategies.
Some of the current tariff strategies can be understood by reference toFigure 11.1. This shows the demand on a long-haul route for a daily DC-10flight with a three-cabin configuration similar to the one previously analysedfrom the cost point of view. The figure shows the demand expected in aparticular week, say six months from now, and is based on the airline’s forecastof traffic and its knowledge of the distribution of traffic during the week. At thefront of the aircraft, 24 first-class seats are blocked off and sold at first-classfares and 31 seats are sold at business-class fares. There will be daily variationsin demand for these two classes, but the airline has based the two tariffs onachieving relatively low average load factors of 50 per cent in first and 60 percent in business (as in Table 11.1). These give enough scope for meeting weeklypeaks. In the economy-class cabin, where there are 168 seats, projected demandat economy or similar fares peaks on Saturdays and Mondays but is relativelylow on other days, especially mid-week. The airline expects to find itself with agreat deal of spare capacity in the economy cabin on all days of the week exceptSaturday. At existing fares, which are cost based, it cannot generate more
FLYING OFF COURSE 273

demand. So the fares must be reduced in order to stimulate new market segments.This might be done in a number of ways. One partial solution would be to sell ablock of seats to one or more tour operators or travel agents on a part-charterbasis or some other basis which enables them to package the seats into inclusiveholidays or to sell them in some other way. Ideally these seats should be sold atlow prices and well in advance and the tour operators should be committed topay for the seats contracted whether or not they are eventually resold by them.No part-charter or tour-based seats would be contracted for on Saturdays, sincenormal demand is sufficiently high.
Having sold some seats en bloc, the airline can also introduce the concept ofdirected demand to sell the remaining seats which it expects to remain unsold atthe normal economy tariffs. Directed demand means pushing passengers intoflights or days of the week which are of the airline’s choosing. In the caseillustrated in Figure 11.1, directed demand fares would not be available onMondays days or Saturdays. Such fares normally take two forms: they are eitherfares requiring advance purchase, perhaps a minimum of 15 or 30 days beforedeparture, such as APEX or budget fares. This enables airlines to ensure thatsuch demand is directed to particular flights or days of the week. Passengershave a reduced choice but pay a price below the normal economy fare. The
Figure 11.1 Projected demand for daily DC-10 with three-cabin configuration: forecastdemand for one week in six months’ time
Note: Directed demand fares—in advance (e.g. APEX and Super APEX) and last minute(e.g. stand-by, instant and late purchase).
274 PRICING POLICIES AND FARE STRUCTURES

second type of directed demand fares are those that can be purchased only at thelast moment or within 24 hours or so of departure. Passengers paying stand-by,late purchase or instant fares can travel only if seats are empty at the time ofdeparture. These tend to be the cheapest fares.
Other types of fares are used to sell off spare seats, but block sales to touragents and various categories of directed demand fares are the most common. Itcould be argued that such fares are cost related in the sense that they reflect thevery low short-run marginal cost of selling an additional seat. Alternatively, itcould be said that, by insisting that certain of these fares can be bought onlydirectly from the airline, the commission paid to travel agents is saved. Othercost savings may include the absence of stop-over or interlining rights. So thesefares should be priced lower than normal economy. In practice, the pricing of thesevarious promotional fares tends to be market related. It is influenced bycompetition from charters or other scheduled carriers and by the price elasticityof demand at the lower end of the market. A major problem with these lowmarket-oriented fares is how to prevent passengers prepared to pay higher faresfrom switching to the lower tariffs. ‘Fences’ of various kinds have to beintroduced to prevent slippage. These are discussed later. Another aspect of thissame problem is how to prevent large numbers of bookings at low fares fromreducing the capacity available for selling at the normal economy or excursionfares and thereby reducing the total revenue per flight. This is the role of yieldmanagement.
The practical application of these different pricing strategies can be seen byexamining British Airways’ passenger tariffs on the London-Hong Kong route inthe summer of 1989 (Table 11.2). It is evident from Table 11.2 that the ratio offirst and business to economy fares was 274:149:100. Though British Airwaysoperated Boeing 747 aircraft on this route, the fare structure had emerged in theearly to mid 1980s under the innovative influence of British Caledonian, whichhad been flying DC-10 aircraft. Thus, our earlier analysis of DC-10 seats costs isvery relevant. It suggests that, on space grounds alone, the cost ratio for the threeclasses should be 243:144:100 (line 5 of Table 11.1). This indicates that thepricing strategy on the London-Hong Kong route was cost related but did notallow fully for different load factors or levels of in-flight service in the threeclasses. The group inclusive tour fares corresponded to the concept of part-charter or tour fares, and there was a range of directed fares involving bothadvanced and late purchase. Some of these were half or less of the normaleconomy fare. Given that the majority of passengers in the economy cabin willhave been travelling on these lower fares, it is likely that the average passengerfare in that cabin would have been around 60–70 per cent of the full economyfare. In that case, the ratio of first, business and economy fares would have been274:149:70. If indexed to 100 this would give 391:212:100, which is very closeto the cost-based relationship of the different fare groups shown in Table 11.1(bottom line). The Hong Kong example shows that airlines may well use cost-related and market-related pricing in combination, adapting their pricing
FLYING OFF COURSE 275

strategies to market and competitive conditions as British Airways obviouslydoes.
Table 11.2 London-Hong Kong fares, 1989
Tariffa British Airways’ one-way fareb
£IndexY=100
First class 1,436 274Executive/club/business 846 161Executive point-to-point 764 149Economy—point-to-point 524 100Excursion (90-day) 982 (return) 94Advance purchase – basic 271 52
shoulder 309 59peak 371 71
Late/instant purchase – basic 260 50shoulder 288 55peak 348 66
Group inclusive tour – normal 857 (return) 82– point-to-point 612 (return) 58
Notes:a Student. ships’ crew and government fares also available.b Cathay Pacific fares were similar with minor exceptions.Source: Air Tariff (monthly) (Hounslow: Air Tariff Ltd).
11.5Choice of price and product strategies
The fare charged is only one aspect of the product or service provided by anairline to different classes of passenger. Other product features include frequency,timings, the quality and nature of ground and in-flight services, and so on. Thesehave been analysed in Chapter 10 though price is often the most important. Inplanning the supply of services on each route it serves, an airline must alsodecide on the various price and product mixes which it feels will generate thelevel of demand it requires. In markets which are less regulated and where thereis a high degree of price competition, the pricing options available are muchwider but the choice between them more difficult to make.
The starting point for deciding on a pricing strategy—that is, the structure andlevel of tariffs and the product features associated with them—must be anassessment of demand and of the airline’s pricing objectives. Is an airline settingout to meet a particular profit target, to expand rapidly, to capture market share,or does it have some other objective it wishes to achieve? Given the objectives ofits pricing policy, an airline must examine the costs of the different products it
276 PRICING POLICIES AND FARE STRUCTURES
can put into the market in relation to its assessment of what potential consumerswant and are prepared to pay for. It must also consider its own positioning withineach market. Is it setting out to meet the needs of all market segments, or is ittrying to attract only certain segments? It could concentrate on only the high fareand high product quality end of the market, as Swissair and SAS have done inrecent years. By going for the top end of the market, such airlines aim for high-yield traffic and accept that this may mean lower load factors (Table 8.1 above).Some airlines choose a single-product, single-fare strategy. This usually involvesa very low fare, requiring very high load factors to break even. This was thePeople Express strategy and until recently the strategy adopted by VirginAtlantic. A pricing strategy must also be acceptable to the airline’s owngovernment and to the government at the other end of the route, unless the routeis one where tariffs are effectively deregulated. The other government’s responsewill be dependent on the interests of its own airline and in particular on therelationship of the tariffs proposed to its own airline’s costs and objectives.
In more price-competitive markets the pricing strategy may need to bedynamic and change in response to price or product changes introduced bycompeting airlines. Airlines have many difficult decisions to make. Should theymatch a competitor’s lower fares when they know the competitor has lower unitcosts or is heavily subsidized by its government? What proportion of its capacityshould an airline offer at price-competitive fares? Is there any point inundercutting a competitor’s tariff if it is going to match those lower tariffs?These and other considerations will affect the pricing strategy and tariff levelsthat airlines adopt in each of their markets. The ultimate aim must not beforgotten, however: that is, to bring supply and demand together in such a waythat the airline achieves its corporate objectives.
11.6Passenger fare structures
11.6.1FIRST-, BUSINESS-, AND ECONOMY-CLASS FARES
Partial or total deregulation of airline tariffs on many routes, together withdifferences in the pricing strategies of major international airlines, have made itincreasingly difficult to identify what one might call normal fares. Up to the late1970s, most international air routes had two basic fares, a first-class and aneconomy fare. The first-class fare was generally 30–40 per cent higher than theeconomy fare. On a handful of routes there was also a supersonic fare forConcorde services, which involved a 15–20 per cent surcharge on the first-classtariff. Under the IATA tariff agreements which prevailed on the majority ofinternational air routes, the conditions of service that went with each of thosefares was also specified. These included the maximum permitted seat pitch, the
FLYING OFF COURSE 277

contents of meals, minimum bar prices, and so on. During the 1980s suchcontrols of conditions of service have been abandoned in many major internationalmarkets, even on routes where IATA tariffs still prevail.
That simple pattern of two basic fares also changed. Deregulation of tariffs onair routes to and from the United States, the introduction of three-class cabinlayouts on many long-haul services and a generally more flexible attitude topricing among many governments and airlines resulted in a more variegated andcomplex pattern of basic fares. In addition to the first-class and economy fares,there is now also a business- or executive-class fare, which is sold under variousnames, but which in price terms is positioned between first and economy. Eventhat three-tier structure of normal fares is complicated on some routes by theavailability of a premium level of first-class or business fares which givespassengers access to a particular part of the cabin or to a quality of service notavailable at the normal fares. On many European and East Asian routes theremay be a published first-class fare but no first-class capacity available sincemany European and South East Asian carriers abandoned first class altogether onshort- and medium-haul routes and now offer only business and economy cabins.It should also be borne in mind that, as a result of the introduction of country oforigin rules or the double disapproval concept into many United States bilateralagreements and in one or two elsewhere, there are routes where each airline’sthree basic fares may differ from those of its competitors.
Point-to-point tariffs have an agreed IATA mileage attached to them. This isnormally the great circle distance between the two points. In travelling from onepoint to the other, passengers can deviate from the IATA distance by up to 20per cent in mileage terms (15 per cent on some longer routes) without anyincrease in the normal fares. This freedom may not apply to some of thepromotional fares. The free 20 per cent add-on to the permitted distance allowspassengers to take quite circuitous routes to reach their ultimate destination,often with stop-overs en route at no extra cost. This is particularly so on ticketsto distant destinations, where a 20 per cent deviation on a distance of severalthousand kilometres can give passengers considerable scope for round-aboutrouteings. On a few very long-haul routes there may be several sets of normalfares depending on the routeing taken. This is done partly to avoid misuse of the20 per cent add-on. Thus, between London and Sydney there is one set of faresfor services via the eastern hemisphere or the trans-Siberian route, and higherfares for travel via the Atlantic or the polar routes.
11.6.2PREFERENTIAL FARES
Preferential fares are those which are available only to passengers who meetcertain requirements in terms of age, family kinship or occupation. They areusually expressed as a percentage discount on the normal fares and are generallyapplicable over large geographical areas. The most widely accepted and used are
278 PRICING POLICIES AND FARE STRUCTURES
the 50 per cent discount on the economy or more expensive fares for childrenunder 12 years of age and the 90 per cent discount for infants under 2, butwithout the right to a seat. Child discounts on promotional fares, if available, arefrequently lower. In Europe the discount is only 25 per cent, while on Pacific routesit is generally 33 per cent. In particular traffic conference areas, there may bediscounts for students travelling to or from their place of study, there may bespouse discounts for husbands and wives accompanying their partners onbusiness trips or publicly available group discounts. There may also be discountsfor military personnel or ships’ crews. Seamen fares, involving a 25 per centdiscount on the economy fare, are particularly widespread. Traditionally, the aimof preferential fares has been partly developmental, to encourage demand fromparticular groups within the community, and partly social, through the choice ofgroups to be encouraged, that is families with young children orstudents. Interestingly, child discounts are not normally available on charterflights.
11.6.3PROMOTIONAL FARES
Promotional fares are various low fares, usually with one or more restrictions ontheir availability, which offer passengers significant savings on the normaleconomy fares. Though sometimes referred to as discount or deep discount fares,they are not of general application, as most preferential fares tend to be, but areseparately negotiated and agreed for each point-to-point link. Promotional fareshave tended to be most widely used on routes where there is charter competition,such as within the Europe-Mediterranean region or on the North Atlantic, and onroutes where there is considerable overcapacity arising from the operating offifth freedom or indirect sixth freedom carriers. They have been least developedon routes where the airlines concerned have wanted to maintain high fares orhave believed that demand was likely to be inelastic to fare reductions. The latteris the case on many international routes to and within Africa.
The early development of promotional fares was aimed at stimulatingparticular market segments, such as off-peak demand or the demand for inclusivetours, while taking advantage of the low marginal cost of scheduled air servicesonce airlines were committed to a published timetable. Off-peak fares, nightfares and group (GTX) or individual inclusive tour (ITX) fares were of this kind.Subsequently a wide range of promotional fares has been developed. Theeconomic rationale for some, such as advanced or late purchase fares, has beenexamined earlier. Fundamentally there can be only one justification for them.They must increase an airline’s net revenue and, it is hoped, its profits too. Theycan do this only by increasing traffic by a greater amount than is needed toovercome both the revenue loss (arising from the lower fares and the possiblediversion of higher fare traffic) and the cost increase caused by the highervolume of traffic. Promotional fares involve considerable risk. There is the risk
FLYING OFF COURSE 279

that newly generated traffic will not come up to expectations or alternatively thatit might be so heavy that it will displace higher-fare traffic. Tight reservationsspace control is necessary to ensure that this does not happen. The other risk isthat too many passengers will be diverted from full fares or other high fares andwill travel at the promotional fares, thereby deflating total revenue. To minimizethis risk, ‘fences’ or conditions are attached to each promotional fare. Suchfences will not last very long unless they are seen by the public to be reasonableor ‘fair’. Each promotional fare tends to have one or more of the followingfences.
Duration limits
Most promotional fares have a minimum and maximum stay limitation. WithinEurope, several categories of promotional fares include a requirement that thepassenger must stay at least one Saturday night at the destination and no morethan one month or, in some cases, three months. On the North Atlantic, a 7- or14-day minimum stay with a two-month maximum is common. Inevitablyduration limits mean that passengers must buy return tickets. The primary aim ofmost duration limits is to prevent usage of these fares by normal businesstravellers who, as previously pointed out (section 8.3), prefer short trips to avoidweekends away from home.
Departure time limitations
It is also common to limit the availability of many promotional fares to particulartimes of the day, or days of the week or seasons. The aim here is to generate off-peak demand or to try to fill up seats that would otherwise be expected to remainempty because of the timing or day of particular flights.
Purchase time restrictions
In order to be able to direct demand more effectively than can be done withdeparture time limitations, restrictions on the timing of purchase have beenintroduced for many promotional fares. These require either advance reservationand simultaneous full payment a minimum number of days before departure orlate purchase, normally within 24 hours before the flight or actually at the timeof departure. Advance payment also reduces airline costs by improving its cashflow.
Routeing conditions
Many promotional fares can be bought only as round-trip fares. In some cases,the return trip must be booked at the time of reservation and neither the outwardnor the return booking can subsequently be changed except by forfeiting asubstantial part of the fare. The aim is to reduce passenger flexibility, therebymaking the fares unattractive to business passengers or independentholidaymakers, while at the same time ensuring high load factors by cutting out
280 PRICING POLICIES AND FARE STRUCTURES

last-minute changes and no-shows. Higher load factors, by reducing unit costs,justify the lower fares. A number of additional routeing restrictions might also beused as a way of reducing the costs of handling low-fare traffic. These include:reduced or no stop-overs between the origin and ultimate destination; a point-to-point restriction which prevents both stop-overs and use of the 15 per centdistance add-on rule; and a no ‘open jaw’ rule to force passengers to start theirreturn trip from the original destination point. Some very low fares may precludeinterlining; that is, they cannot be used by the passenger except on the airlinewhich issued the ticket. This prevents any revenue loss by the airline from pro-rating (see below) of the ticket with other carriers. In a few cases, restrictionsaimed at reducing costs may be combined with normal fares. For instance, on theLondon-Hong Kong route there is a low point-to-point business fare(Table 11.2).
Inclusive tour requirements
There is, lastly, a range of promotional fares which are not publicly availablebut which can be purchased by travel agents or tour operators and used topackage into inclusive tours. Such packaged holidays normally includeaccommodation but might involve some other element such as car hire or ticketsfor a cultural or sports event instead of or in addition to the accommodation. Onsome routes there is a single inclusive tour fare, while on others there maybe aseparate IT fare for individuals and a lower fare for groups. IT fares have beenaimed at meeting the needs of the independent holidaymaker. At the same time,on some routes they may allow scheduled airlines to compete with charters in thepackage holiday market. As such they are a defensive response.
Most promotional fares, whose names tend to differ by region, will haveconditions attached to them involving several of the above limitations. On certainroutes the complexities of the numerous fares available and the conditionsattached to them have posed administrative problems for both airline staff andtravel agents and have become counter-productive in marketing terms. Airlinesare under both internal and external pressure to simplify tariffs. In this process ofsimplification the concept of ‘unbundled’ fares has gained ground. More andmore low, unbundled fares now give the passenger none of the traditionalflexibility or rights, which were costly for the airline. They provide nothing morethan direct, uninterrupted carriage from origin to destination and back at the timesand on the flights originally booked for.
On some routes with well-developed promotional fares, a high proportion ofthe total traffic may be travelling on such fares. IATA estimates that at leastthree out of every four passengers on the North Atlantic are travelling onpromotional fares of various kinds. In other very competitive markets, too,airlines have found themselves selling virtually their entire economy cabin atpromotional fares. On London to South East Asia routes, APEX fares have
FLYING OFF COURSE 281

become in effect the standard economy fare, with hardly anyone paying the fulleconomy tariff.
A study by the International Civil Aviation Organization (ICAO) of theSeptember 1987 tariffs on a large sample of city pairs around the world foundthat advance purchase excursion (APEX) and other similar low promotionalfares (e.g. European PEX and Eurobudget) had become increasingly prevalentand were available on about half of all city pairs. They predominated on routesbetween Canada, Mexico and the United States, across the North and SouthAtlantic and across the Pacific. Often referred to as deep discount fares, these werefound to be on average 45 per cent lower than the normal economy fares (ICAO,1988b).
11.6.4CONCEPT OF FARE ZONES
An innovation in pricing strategy was introduced in May 1982 with the signingby the United States and 10 member states of the European Civil AviationConference of a memorandum of understanding setting up agreed fare zones onthe North Atlantic. Reference ‘fares’ were established in each direction on theNorth Atlantic based on an agreed cost formula. In practice the reference farewas based on the Standard Foreign Fare Levels (SFFL) which had beenestablished in 1980 by the Civil Aeronautics Board on the basis of US airline costs.Five pricing zones, or bands, each covering one fare type, were then establishedin relation to the reference fare. For example, the economy-class fare zone wasfrom 20 per cent below to 20 per cent above the reference fare. Any airlineoffering an economy fare at any level within the agreed zone would have itautomatically approved by both governments on that route. It could also set aparticular fare outside its zone, but in that case specific approval would beneeded from the governments concerned. If airline costs, such as the price offuel, rise or fall, the reference fare or the SFFL can be adjusted through theagreed cost formula or through arbitration. Since the fare zones are expressed aspercentages of the reference fare, they move up or down automatically with thatfare.
The 1982 memorandum of understanding has been renewed regularly sincethen. The advantage for North Atlantic carriers is that if IATA or bilateral faresfall within the bands or zones they are automatically approved by the UnitedStates and other governments. Some IATA tariff agreements have alsointroduced fare bands but with a somewhat different objective. The IATA-agreedbusiness-class fare on London to New York may be expressed as a zone to allowairlines to offer different elements of service. For instance, while the normalbusiness class may be eight abreast on a Boeing 747, an airline with a premiumsix-abreast business class might charge 25 per cent more and still be within thebusiness fare band. Fare zones are an attractive innovation in that they can beused to introduce a more competitive pricing environment while maintaining
282 PRICING POLICIES AND FARE STRUCTURES

some regulatory controls over the level of the reference fare and the width andrelative level of the different zones. This is a compromise position whichgovernments or airlines hostile to total deregulation of pricing might accept. Forthis reason the concept of fare zones is likely to be more widely adopted. Early in1984 the European Commission espoused the concept of what it called ‘zones offlexibility’. The December 1987 package of measures liberalizing air transportcontained provisions for the introduction of such tariff zones for discount fareswithin Europe (section 4.3.3. above).
11.7The role of yield management
For a long time it was thought that the ‘fences’ or booking conditions attached todifferent fares were a sufficient safeguard to ensure that yields or revenues werenot diluted by high-fare passengers switching to low fares. However, they failedto ensure that revenues on each flight were being maximized. In many cases theopposite happened. The introduction of new low fares as a result of tariffliberalization created a surge of demand at these lower fares. Airlines foundthemselves putting on extra capacity to meet this demand, but with so much low-yield traffic on each flight they often failed to cover their costs even though loadfactors increased. This happened in the United States following deregulation,especially with low-fare airlines such as Braniff or People Express, and on theNorth Atlantic in the early 1980s. Even as late as 1989 Philippine Airlines’ faresbetween Manila and the United States were so low that it was capturing 70 percent of the market, operating at very high load factors and yet was losing moneyon the route. Yield management became an essential marketing tool as a result ofUS deregulation and the complexity of fares and fare types that emerged within avery competitive and rapidly changing market. It involves the manipulation of anairline’s reservations control system in order to maximize passenger revenue.This is done by trying to sell each seat on each flight at the highest possible priceso as to get the most income from that flight.
Yield management is based on the simple economic concept of utility asexpressed through the demand curve. There is a maximum price which eachconsumer is willing to pay for a good or service. That price is equivalent to theutility or benefit they get from consuming it. They will happily pay less for it,but will not pay more. Different consumers gain varying levels of utility from aparticular good or service and therefore each will buy it only if the price is nogreater than that utility or benefit. For air services as for most products, the lowerthe price the greater the demand. By summing up the demand for a service atdifferent price levels we can draw a demand curve. On a simple diagramshowing air fare on the vertical axis and seats demanded on the horizontal axis,one could draw the demand curve for an air service between two cities. This hasbeen done for a hypothetical route in Figure 11.2a. It shows a downward-sloping
FLYING OFF COURSE 283

demand curve, indicating the number of seats which would be bought at differentfares.
An airline wishing to provide this service with a 100-seater aircraft hasestimated a one-way total operating cost of $3,500. It sets a target seat factor of70 per cent, which means carrying 70 passengers. If pricing was purely costbased, then the airline would charge a $50 one-way economy fare. At that farethe demand curve tells us that the airline would get only 50 passengers, therebygenerating an income of only $2,500, which would result in a substantial loss(Figure 11.2a). The load factor achieved would be 50 per cent not 70.
The demand curve also tells us that many passengers who paid $50 wouldhave been willing to pay more. They are getting a good deal. The utility orbenefit they get from using the service is greater than the price paid. Thedifference between the $50 fare and the utility they enjoy is called the ‘consumersurplus’ and is measured by the shaded area in Figure 11.2a. One aim of yieldmanagement is to maximize revenue by transferring some of the consumersurplus to producers, that is, the airlines.
The demand curve also shows us one more important fact: half the seats areempty if the fare is $50, but there are people who would fly at fares below $50.
The airline, aware both of the consumer surplus issue and the need to fill upempty seats, now decides to introduce a three-part tariff: a full economy fare of$70, an excursion fare of $50 and an advance purchase APEX fare of $20. Thereare various conditions attached, notably that the APEX fare must be bought inadvance. In practice, because of the ability to buy cheap seats in advance, manypassengers opt for the APEX fare and sales boom. However, in the end too manyseats (40) are sold at this cheap fare, leaving insufficient seats, only 40, forpassengers prepared to pay more, who generally book later. The outcome isshown in Figure 11.2b. The seat factor has shot up to 80 per cent, but thoughrevenue has also increased to $3,200 it is still inadequate to cover costs.Moreover, since many passengers are still paying less than they would beprepared to pay, the airline is still failing to capture for itself an adequate shareof the consumer surplus.
In theory, to maximize revenues and capture the consumer surplus the airlineshould sell each seat at the maximum that each passenger is prepared to pay,from $100 down to $1 for the 100th passenger. But to try and maximize revenuemore realistically, it might introduce four separate fares: a full economy fare of$80, an excursion fare of $60, an APEX fare of $40 and a Super APEX fare of$20. If it could sell 20 seats at each of these fares, its total revenue would be $4,000 per flight producing a profit of $500 with a seat factor of 80 per cent(Figure 11.2c).
The fundamental problem is how to ensure that 20 seats are sold at each fareand more especially how to avoid the earlier situation where too many seats werebeing sold at the lowest $20 fare. This is the function of yield management. It isthe day-to-day monitoring and control of seat availability in each fare group oneach flight to ensure that revenue is maximized. This is done by highly trained
284 PRICING POLICIES AND FARE STRUCTURES

staff using the constantly updated information on sales and other key data in thereservations computer. Booking conditions attached to different fares and seatavailability are the tools used to channel seats to the passengers paying thehigher fares. The tariff conditions or ‘fences’ should separate the demand forparticular fare types into discrete segments, which have different bookingcharacteristics. The control of seats available for sale should then direct thatdemand onto flights where it is needed to maximize revenues.
The need for yield management arises because, whereas one would like to fillthe aircraft early with high-fare passengers, such passengers tend to book at thelast minute, while many low-fare passengers do not mind booking early. Inpractice, all fare types are being sold simultaneously in many locations at the
Figure 11.2 Interplay of demand curve and pricing strategies
(a) Cost-based fare
(b) Market-based fares, no yield management
(c) Market-based fares with yield management
Note: Fare types—Y=full economy; E=excursion; A=APEX; S=Super APEX
FLYING OFF COURSE 285

same time. So the danger of an airline losing control of the total sales in eachfare group is very real.
To overcome this, fares on each route are allocated to different reservation orbooking classes. This is crucial, since some routes, such as London-New York,may have up to 60 fare types. Most large airlines will work with 10–12 bookingclasses, and could go up to 20–25, but many airlines can still only cope withthree classes. Assuming that flights come onto the reservations system a yearbefore the departure date, 12-month forecasts of demand for different bookingclasses are used to allocate the number of seats available to each booking classon each flight. When the seats allocated to a particular class are sold out, thenthat booking class is withdrawn from sale, even though seats may be available inother classes. If, later on, sales in these other classes fail to come up to the forecasts,the previously closed booking class may be reopened for sale.
The forecasts of sales by class are reviewed periodically up to one monthbefore departure, and booking classes may be closed or opened accordingly.However, it is during the last month that most of the critical decisions andchanges are made by the yield managers or controllers. A large airline mayemploy up to 100 of these working in groups controlling particular parts of itsnetwork. Using data from the reservations computer on sales to date and pastbooking trends, they must make rapid and critical decisions closing, opening orwait listing particular booking classes on each individual flight scheduled duringthe coming month. The aim is always to maximize revenue per flight. If sales aregoing badly as the departure date approaches, it may mean allocating more seatsto lower fare types. Conversely, if demand is high, low-fare booking classes maybe closed very early on and before they are sold out. It is a complex and criticaltask that could not be done without a sophisticated computer reservation system.In British Airways, the European yield manager will have around 2,500European flights at any one time on which decisions are pending on whether tochange the number of seats allocated to any particular booking class. The yieldcontroller’s task is made particularly difficult by a number of factors.
In the first place, accurate forecasting of demand by booking class is the key tosuccess, but demand is influenced by many external variables. The closer to thedeparture date, the more accurate forecasting becomes. The yield controller mustmonitor not only current sales but also external developments which may affectfuture sales. Secondly, the same fare type sold in one country may be worth morewhen sold in another because of fare and currency variations. Thus the cheapestKuala Lumpur to London return fare in 1989 was only $845 if sold in JohorBahru in Malaysia, and $1,060 if sold across the causeway in Singapore. If thesame seat was sold in London it would have generated about $1,400 revenue. Ifsold in Australia as part of a Sydney-London trip, the revenue would have beengreater still. It becomes particularly difficult trying to control and manage salesin different markets, but it is not impossible. There is a risk, however, ofupsetting local sales staff who can sell at the published fares but are stopped fromdoing so by the yield managers at head office. A third problem area is how to
286 PRICING POLICIES AND FARE STRUCTURES

deal with interline passengers on multi-sector routes. The pro-rating or allocationof the through fare to the separate sectors flown usually means that an airlinemay get very low yields from carrying interline passengers on some of its sectors.Some US yield management schemes reject such traffic even if seats areavailable. An alternative might be to insist on a full fare for that sector. Thismeans publishing in advance the pro-rate provision one is prepared to accept.Group traffic provides an important volume of business but poses yet anotherproblem. Group bookings are made long in advance when they are easy to acceptbut are usually firmed up only 3–4 weeks before departure, and the take-up rate(that is, the number of passengers compared with the number of seats originallybooked) may be verv low. Requests for advance deposits may help to alleviate thisproblem. In addition, agents offering groups may be vetted on the basis of theirpast performance before bookings are accepted Then there is the problem of no-shows. They average 15–20 per cent for most airlines, but may be well over 50per cent on some flights. Overbooking can compensate, but one can still end upwith offloading passengers or having empty seats. Getting the overbooking rightfor each flight means more revenue and more satisfied passengers. To do this onemust develop models to predict no-show rates, introduce booking conditionswhich discourage no-shows or even penalize passengers who fail to turn up bycancelling their onward bookings. Yield management must also tackle thequestion of cheating. This is done by agents or the airlines’ own sales staff who,to meet their sales target, book passengers in one booking class which is openbut actually sell them a fare which is in another class which has been closed.Checks have to be introduced to control this. Lastly, in markets where fares arenot strictly regulated, yield managers must constantly monitor the fares beingoffered by competitors. While they must maximize revenues, they must alsohave an eye to market share. Losing market share may mean higher unit costs.
It has been estimated that US airlines have been able to increase their revenuesby 5–10 per cent as a result of effective yield management (Cross andSchemerhorn, 1989). Thus it is crucial in ensuring profitability, especially forthose airlines that do not have much scope for further reduction in their costlevels. The wider, more complex and more competitive an airline’s networkbecomes, the greater is the need to introduce yield management. It is an essentialconcomitant of market-related pricing. While some consumers end up paying morethan would otherwise be the case or travelling in more congested aircraft,consumers as a whole should be better off. By mixing high- and low-farepassengers to generate higher revenues, flights are operated that would otherwisenot be viable. A wider range of fare types can be made available, whileprotecting last-minute access to seats for those who must travel at short notice. Itis hoped that the frequency of offloading overbooked passengers should bereduced.
FLYING OFF COURSE 287

11.8Geographical differences in fare levels
Annual analyses by ICAO of the normal economy fares on international routesaround the world show considerable variation in fare levels between geographicalareas (Table 11.3). Economy fares per kilometre on international routes inEurope are the highest in the world and they are more than twice as high asinternational fares within the Asia/Pacific region where regional fares are thelowest. On long-haul intra-regional routes the divergence between unit farelevels is lower but still quite marked, with the lowest fares being found on theNorth Atlantic and across the North Pacific. Wide differences between routegroups in the unit level of economy fares can be caused
Table 11.3 Differences in average normal economy fares by distance and internationalroute group, September 1987
Route group US cents per passenger-km by distance (km)
250 500 1,000 2,000 4,000 8,000 12,000
Regional routes:Europe 54.8 41.1 30.8 23.1 17.3Middle East 31.9 25.8 20.8 16.8North America 26.4 19.9 15.0 11.2 8.5Africa 25.6 21.8 18.5 15.8 13.4South America 20.2 17.6 15.3 13.2 11.5Asia/Pacific 18.7 17.0 15.4 13.9 12.6 11.4 10.8
Intra-regional routes:South Atlantic 12.5 13.4 13.9Europe-Asia/ Pacific 15.8 14.7 13.7 12.7 12.2North Atlantic 14.4 13.2 12.5North-Mid Pacifica 16.5 11.2 8.9
World average 36.6 29.4 23.6 19.0 15.2 12.2 10.8Note:a 1986 fares.Source: ICAO (1988b).
by any one of several factors. The most important is likely to be the differencesin the unit costs of operating in different geographical areas as a result ofvariations in the costs of inputs such as fuel or labour or in the pattern of demand.The degree of price competition also appears to have pushed down the economyfares, particularly in markets where there is also considerable frequency andcapacity competition. There may in addition be an element of cross-subsidization,with above-average fare levels on some routes compensating for fares that areperhaps too low on others. However, the level of economy fares might not initself be a sufficient indicator of the prevailing fare levels on any route if there
288 PRICING POLICIES AND FARE STRUCTURES

are a large number of promotional fares on that route. European fares are a casein point. While economy fares within Europe are particularly high, Europeanscheduled routes which face charter competition tend to have a wide range of lowpromotional fares as on the London-Athens route discussed earlier (Table 7.1).
A better measure of regional variations in fares actually paid is a comparisonof unit revenues per passenger-kilometres, since this reflects both the variationsin basic fare levels and differences in the range and availability of promotionalfares. A 1989 ICAO study identified the unit revenues (yields) and costs perpassenger-kilometre for 17 route groups (ICAO, 1989). Yields and costs for twogroups of regional and long-haul routes are shown in Table 11.4. This confirmsthat, on regional services, fares and yields are highest in Europe and lowest onroutes in the Asia-Pacific region. In long-haul markets, the lowest yields, as wasthe case with fares, are found across the Pacific and on the North Atlantic. Theclose correlation which exists, in most cases, between the relative levels of unitcosts and unit revenues is clearly apparent when these are indexed (columns 2and 4 of Table 11.4). In a few markets, notably Africa and South America, yieldsare too low in relation to costs and many airlines operating in these regions havebeen unprofitable.
Our earlier analysis of airline operating costs showed that unit costs declinedas sector distance increased. It is not surprising, therefore, to find that unit faresalso decline with distance, as shown in Table 11.3 and as is evident fromcomparing the unit passenger yields on long-haul routes and shorter regionalroutes in Table 11.4. In fact, ICAO analyses show a close correlation betweenincreasing route distance and falling unit fares in most major markets (ICAO,1988b). It is important to recognize that, even if there is a consistent relationshipbetween fare level and distance, that relationship may not be entirely cost based.There are strong indications, at least within Europe, that the taper in fares withdistance is less than the taper in costs (ECAC, 1981). This is true of both economyand promotional fares. As a result, the break-even passenger load factor tends tobe much lower on longer routes than on shorter ones.
Other cost variables appear to have even less impact on fare levels. Fares showno close relationship to the traffic density on a route, even though thick routeslead to cost economies. The differentials between the first-class, business andeconomy fares do not always reflect the cost differences which arise as a resultof the different space and service features of the three classes. Traditionally, first-class fares have been under-priced in relation to the costs imposed by first-classpassengers. This was one reason why first class was progressively abandoned bymany European airlines from 1980 onwards. While fare differentials betweendifferent classes have increased in recent years as a result of improved costing(on the lines of the exercise carried out on a long-haul DC-10 earlier in thischapter), there are numerous routes where the differentials do not adequatelyreflect cost differences.
FLYING OFF COURSE 289

Table 11.4 Differences in unit passenger revenues and costs by international route group,1987
Revenue per passenger-km Costs per passenger-km
Route group US¢ Indexa US¢ Indexa
(1) (2) (3) (4)
Regional withinEurope 17.6 215 16.0 219Middle East 13.4 163 12.0 164Africa 10.9 133 12.9 177South America 9.3 113 10.0 137Asia Pacific 8.2 100 7.3 100
Intra-regionalNorth to South America 7.7 131 7.5 123South Atlantic 7.5 127 8.0 131Europe to Asia/Pacific 6.4 108 6.4 105North and Mid Pacific 6.2 105 6.1 100North Atlantic 5.9 100 6.1 100
Note:a Lowest within each grouping indexed at 100.Source: Compiled by author from ICAO (1989a).
11.9Determinants of airline passenger yields
For an airline, the level of passenger fares is less important than the yield it actuallyobtains. Yield is the average revenue per passenger, passenger-kilometre orpassenger tonne-kilometre performed. These all measure the average revenue perunit of output sold. The projected yield per passenger on a route will indicate toairline planners the break-even seat factor; that is, the percentage of available seatsthat they need to fill in order to cover the passenger-related costs. The higher theyield, the lower will be the break-even seat factor.
The range of passenger yields achieved by different airlines, some of thembased in the same geographical area, is surprisingly wide, even though manyfactors such as average sector distance, strength of home currency, and so on,will affect the yields (Table 11.5). European carriers have exceptionally highpassenger yields, while the lowest passenger yields are generally achieved byAsian carriers other than JAL. Yet, by combining low passenger yields with lowcosts and relatively high load factors, one can achieve profitability, though ofcourse overall performance depends on the combined passenger and freight yields.The outstanding example is Singapore’s SIA, whose
290 PRICING POLICIES AND FARE STRUCTURES

Table 11.5 Passenger yields on scheduled services, 1988 (US cents per passenger t-kmperformed)
Rank North AmericanAirline
US¢ European Airline US¢ Asia/PacificAirline
US¢
1 Swissair 129.82 Alitalia 125.33 Lufthansa 125.04 Air France 114.75 British Airways 114.56 JAL 113.37 Air Canada 92.88 Northwest 82.49 KLM 82.310 American 80.011 Thai
International76.3
12 United 76.113 Cathay Pacific 75. 714 TWA 73.215 Pan Am 72.216 Qantas 72.117 Air India 67.318 SIA 60.2Source: ICAO (1988a).
passenger yield is exceptionally low—only about half that of some Europeanairlines. But SIA’s passenger load factor in 1988 was 78 per cent, 8 percentagepoints or more higher than that of all the European and North American carriersin Table 11.5 except Air Canada (71 per cent). This, together with SIA’s lowcosts, ensured high profits. SIA’s low yield and high load factor are clearlyinterrelated. Its low pricing strategy was used to increase its market share onmany routes and to push up its load factors. The low comparative costs of SIAand other Asian carriers have enabled them to pursue low-fare strategies.
The passenger yields indicated in Table 11.5 are global figures for each airline’stotal operations including its domestic services. Direct comparisons maytherefore be somewhat misleading. Yet, even when operating on the same orneighbouring routes, airlines end up achieving markedly different yields asevidenced by European carriers on their intra-European services in 1989(Table 11.6). Lufthansa earns more than twice as much per passenger-kilometreas Air Portugal or Olympic. Why do yields vary so widely between carriers? Thediscussion so far has tacitly assumed that an airline can determine its revenue levelsand its yields through the pricing strategies it
FLYING OFF COURSE 291
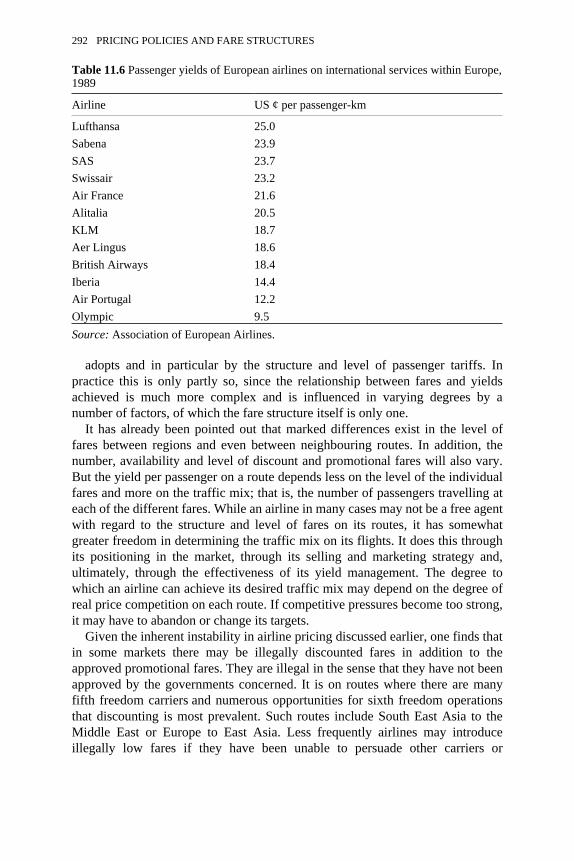
Table 11.6 Passenger yields of European airlines on international services within Europe,1989
Airline US ¢ per passenger-km
Lufthansa 25.0Sabena 23.9SAS 23.7Swissair 23.2Air France 21.6Alitalia 20.5KLM 18.7Aer Lingus 18.6British Airways 18.4Iberia 14.4Air Portugal 12.2Olympic 9.5Source: Association of European Airlines.
adopts and in particular by the structure and level of passenger tariffs. Inpractice this is only partly so, since the relationship between fares and yieldsachieved is much more complex and is influenced in varying degrees by anumber of factors, of which the fare structure itself is only one.
It has already been pointed out that marked differences exist in the level offares between regions and even between neighbouring routes. In addition, thenumber, availability and level of discount and promotional fares will also vary.But the yield per passenger on a route depends less on the level of the individualfares and more on the traffic mix; that is, the number of passengers travelling ateach of the different fares. While an airline in many cases may not be a free agentwith regard to the structure and level of fares on its routes, it has somewhatgreater freedom in determining the traffic mix on its flights. It does this throughits positioning in the market, through its selling and marketing strategy and,ultimately, through the effectiveness of its yield management. The degree towhich an airline can achieve its desired traffic mix may depend on the degree ofreal price competition on each route. If competitive pressures become too strong,it may have to abandon or change its targets.
Given the inherent instability in airline pricing discussed earlier, one finds thatin some markets there may be illegally discounted fares in addition to theapproved promotional fares. They are illegal in the sense that they have not beenapproved by the governments concerned. It is on routes where there are manyfifth freedom carriers and numerous opportunities for sixth freedom operationsthat discounting is most prevalent. Such routes include South East Asia to theMiddle East or Europe to East Asia. Less frequently airlines may introduceillegally low fares if they have been unable to persuade other carriers or
292 PRICING POLICIES AND FARE STRUCTURES
governments that the approved fares are just not low enough. They may wantlower fares as a means of stimulating the total market. Thwarted by theregulatory system, they may go it alone. Airlines set on discounting tend toconform to tariff regulations in their own countries and to ignore the rules abroad.There are numerous tricks of the trade that airlines use. One is to sell a ticket atan illegal discount but show a legal fare on the ticket while marking the ticket asnon-endorsable. This means the passenger cannot use it for carriage with anyother airline. As a result the ticket will not go through interairline clearing andthe discrepancy between the fare paid and the fare shown on the ticket will notbecome apparent. A secret coding on the ticket will tell the airline’s ownaccountants the actual ticket price paid. Illegal discounting of normal orpromotional fares, either out of choice or as a result of competitive pressures,further dilutes the average yield.
Another major source of revenue dilution arises from the prorating of revenuefrom interlining passengers. An interline passenger travelling with a single ticketon two or more sectors is charged the end-to-end fare, not the sum of the separatefares on each sector. Because of the taper of fares with distance, the end-to-endfare to be charged is normally less than the sum of the separate fares. Pro-ratingis the method used to share the revenue earned between the different sectorsflown. Since 1989 the basic principle used is to share the revenue in proportionto the distance of each sector. But shorter distances are given greater weight toallow for higher costs. The method of pro-rating using weighted distance isillustrated in Table 11.7. For a club-class ticket used to fly London to Athens viaHamburg the revenue dilution is considerable. The airline carrying the passengeron the London to Hamburg leg receives 42 per cent less than the full club farefor that sector. On the Hamburg to Athens leg the revenue short-fall is 66 per cent,or almost two-thirds. The same basic method is used to pro-rate cheaper fares aswell, if such fares allow interlining. Pro-rate calculations based on distance havebecome increasingly complex in some markets, especially where airlines on thesame routes offer different fares.
Pro-rate dilution is greatest when passengers take advantage of the 20 per centadditional mileage rule to travel on a circuitous route between their origin andtheir destination, particularly if travelling long haul. The end-to-end fare has thento be split over several sectors. Pro-rate dilution will also increase if a domesticsector is included in the ticket and the domestic airline insists on receiving the
FLYING OFF COURSE 293

Table 11.7 Pro-ration of London-Athens club ticket used LondonHamburg-Athens,summer 1990
Separate clubfare
Distancea
(miles)Pro-ratecalculationbased onweighteddistancefactorsb
Revenuedilution
London-Athens £280London-Hamburg
£157 450 −42%
Hamburg-Athens
£566 1,270 −66%
Total 1,720 £280.00Notes:a London-Athens distance is 1,494 miles, but permitted mileage is 1,791, or 20% higher.
Therefore routeing via Hamburg is permitted.b Weighted distance factors (found in IATA’s Pro Rate Factor Manual) are London-
Hamburg 1,167 and Hamburg-Athens 2,416. Adding them together gives 3,583.
full fare or a high proportion of it, leaving even less revenue to be sharedbetween the international sectors. Pro-rated interline traffic may represent asmuch as one-third or more of an airline’s total traffic and it is particularlyprevalent on routes serving geographical gateway airports such as Heathrow,Amsterdam or Singapore, which are major interlining centres.
The impact of pro-rate dilution is frequently distorted by exchange ratefluctuations which produce gains or losses when converting revenues earnedaboard into the national currency of the airline concerned. The greater volatilityof exchange rates since the early 1970s has increased the risks of revenuedilution from sudden movements in exchange rates.
The final source of revenue dilution is that arising from long-haul passengerseven where there is no interlining involved. This is because of the taper of unitfares with distance. An airline carrying its own passengers on a 6,000 km sectorwith two stops en route will earn less than if it had carried three separate short-haul passengers, each of whom flew on only one of the three sectors on theroute. Thus Qantas, each of whose passengers travels on average around 6,650km has a distinct revenue disadvantage, while the shortness of many Europeansectors is one explanation of why European airline yields are so high(Table 11.5).
The yields which an airline achieves on each of its routes will depend partlyon the level of the normal fares, on the availability and level of promotionalfares, and on the degree of illegal discounting, if any. Within that framework offares it is the traffic mix which ultimately determines the total revenue earnedand thereby the unit yield. That is why effective yield management is so
294 PRICING POLICIES AND FARE STRUCTURES

important. But revenue will be diluted by pro-rating of interline tickets andpossibly by exchange rate fluctuations. The proportion of interline traffic istherefore a further important determinant of the yield. The final yield will bearlittle relationship to any single published fare. This further complicates the issuesof airline pricing. In deciding on its pricing strategy and in working out thetariffs for different market segments, airlines must balance and juggle with allthese factors which transform the various fares into an average yield. It is theyield in conjunction with the achieved load factor and the unit costs which willdetermine whether an airline’s financial targets can be met.
FLYING OFF COURSE 295

12The Economics of Air Freight
12.1Air freight trends
Many of the concepts and principles of airline economics discussed so far applyequally to the cargo side of the industry. At the same time, particular issues anddifficulties arise in the carriage of air freight which require separate analysis andtreatment. The importance of freight is too often underestimated, yet just overone-third of the output of the international airline industry is generated by freightrather than passengers and for some airlines it is considerably more than this(Table 1.6). The contribution of freight to total revenue, however, is only one-eighth, but it makes a significant contribution to the profitability of many airservices. In order for it to continue to do so, airline managers need to have aclear understanding of the air freight industry and of the particular problemsfacing it.
During the 1960s the annual rate of growth of international air freight hadbeen very high, averaging close to 20 per cent and outpacing passenger growthby several percentage points. In the decade that followed, annual growth rateswere halved, falling to an average of around 10 per cent. In the 1980s, growthrates declined further to around 9 per cent, though they were higher than this inthe last two to three years of the decade. Though air freight continues to growfaster than passenger traffic, the gap between the growth rates of the two sides ofthe industry has recently been much smaller.
Until the mid-1970s European and North American airlines were dominant inthe carriage of international air freight, attracting between them close to three-quarters of the freight traffic (Table 12.1). Since then their dominant position hasbeen eroded by the exceptionally rapid penetration into the freight markets byEast Asian and Pacific region airlines. Over the last 15 years or so these airlineshave expanded their international freight traffic particularly rapidly, growing atannual rates well above the world average and significantly higher than thosebeing achieved by European or North American airlines. As a result, there hasbeen a fundamental restructuring of the international air freight industry, with thecentre of gravity shifting towards East Asia and the Pacific. As a group the Asian

and Pacific carriers overtook North American airlines in the carriage ofinternational freight by the end of the 1970s and they are now in the
Table 12.1 Regional distribution of international air freight
Region of airlineregistration
Regional share of international freight/km Average annualgrowth in freight/km
1972 1988 1978–88
% % %
Europe 44.8 37.0 +7.7Asia and Pacific 12.3 31.4 +13.8North America 29.0 18.5 +8.6Latin America/Caribbean
5.8 5.0 +6.4
Middle East 5.0 5.4 +7.4Africa 3.1 2.7 +7.1World 100 100 +9.3Source: ICAO (1990).
process of rapidly overtaking their European counterparts as well. Forecasts bythe International Civil Aviation Organization (ICAO) suggest that by the year2000 Asian/Pacific airlines will dominate the air freight markets, carrying around43.5 per cent of the world’s international freight (ICAO, 1990). Already by 1988four of the Asian carriers—JAL, SIA, Cathay Pacific and Korean—rankedamong the world’s 10 largest international freight carriers, with JAL ranked thesecond largest overall.
Three-quarters (76 per cent) of the world’s air freight is international and aboutone-quarter is domestic. But much of the domestic freight—in fact well over halfof it—is carried within North America. A noticeable characteristic ofinternational air freight is the degree to which it is dominated by three majorroute groups, namely the North Atlantic, the Europe to the Far East/Australasiaroute and the north and mid-Pacific routes. These three route groups togethergenerate around two-thirds of the total freight tonne-kilometres performed oninternational air services, with the North Atlantic and transpacific routes beingrelatively larger than the Europe-Far East routes. Interestingly, the very largestfreight carriers such as Lufthansa, JAL, Air France, Flying Tiger or BritishAirways are all heavily engaged in at least two of these three route groups. Thisseems to be a prerequisite if an airline aims to be really big in air freight.
While in the early days air freight was considered essentially as a way offilling up spare capacity on passenger aircraft, its very high rate of growth in the1960s induced many airlines to introduce scheduled all-cargo services. Thesecould be introduced only where freight traffic was already dense enough tosupport them, but they had a strong stimulatory effect on demand. Narrow-
FLYING OFF COURSE 297

bodied aircraft in a passenger configuration had relatively little capacityavailable for freight and it was in any case unsuitable for large or awkwardshipments. All-cargo aircraft, even narrow-bodied ones, facilitated the carriageof large unit loads and consignments and accelerated the introduction ofspecialized handling and sorting equipment, which speeded up the movement offreight. Improved handling and the flexibility to ship freight independently ofpassenger aircraft, which, among other things, permitted the use of night hours,allowed airlines flying all-cargo aircraft to reduce freight transit times whileoffering considerably more capacity.
As a result, scheduled all-cargo operations generated new traffic and captureda growing proportion of it. On most major routes the proportion of freight carriedon scheduled freighter aircraft grew rapidly till the early to mid 1970s and hasdeclined steadily since then to a level of 35 per cent or less. The North Atlanticillustrates this trend clearly. In 1969, as much as 62 per cent of freight on theroutes across the North Atlantic was being carried in freighters. This was thepeak year for freighters. By 1983 their share of the market had declined to 31 percent. Five years later, all-cargo flights carried only 26 per cent of Atlantic freight.Routes across the north and mid Pacific are an exception to this trend. The shareof the freight traffic carried by all-cargo has remained consistently high at around60–75 per cent because passenger aircraft were unable to meet the rapidlygrowing demand for freight space on air routes from East Asia to the UnitedStates. Elsewhere, the relative decline of scheduled freighter services hascontinued. Many airlines, British Airways and TWA among them, have ceased tooperate freighters altogether. Other airlines which are major freight carriers, suchas Lufthansa, have reduced the number of freighters in their fleets, particularlyfor short-to medium-haul routes, or, like KLM, have concentrated on using combiaircraft, where the main deck is split between passengers and cargo.
Within Europe, most regional air freight is trucked by road. It is cheaper andfaster to do it this way, especially as distances are relatively short and mostmajor centres are within an overnight road journey of each other. Even long-haulfreight is trucked by road for the first part of its journey. British Airwaysoperates a European freight interchange facility in Maastricht in south-eastNetherlands. Trucks (generally leased in) collect freight from all over Europe,including Scandinavia and Spain, and deliver it to Maastricht. There it is sortedand packed into separate containers ready for shipment to their final destinationanywhere in the world. The loaded containers are then driven in bond fromMaastricht to be loaded direct and in time onto the right British Airways aircraftat Heathrow or Gatwick. In this way British Airways can compete with SAS inScandinavia for freight destined for the United States or Mexico. But SAS alsocompetes for long-haul freight in the UK market by trucking it by road toCopenhagen. Europe’s motorways are criss-crossed nightly by heavy lorriescarrying ‘air’ freight!
One further aspect of the relative decline of all-cargo services has been theeclipse, especially within Europe, of non-scheduled cargo services. By 1988 less
298 THE ECONOMICS OF AIR FREIGHT

than 10 per cent of international freight tonne-kilometres were carried on non-scheduled charter flights. Their share had been significantly higher in the late1970s when non-scheduled charter airlines had been at their peak. Traffic rightsfor scheduled cargo services are governed by the bilateral air servicesagreements, whereas cargo charters (like passenger charter flights) have beenoutside the regulatory structure and subject only to ad hoc permits from the twocountries at either end of the route. The freedom to operate outside the bilaterals,together with the growing deregulation of freight operations in the United States,the UK and some other European countries, led to a rapid development of cargocharters from the mid-1970s.
Charter airlines such as Cargolux, IAS Cargo (later British Cargo Airlines)and Transmeridian grew rapidly to serve markets such as those of Nigeria, theMiddle East or parts of the Far East where the rapid growth of demand forfreight services could not be adequately met by the scheduled airlines. Thesecharter airlines offered a ‘firefighting’ service, coming in to ease major problemscreated by port congestion or by sudden surges of demand in particularcountries. In addition, their greater pricing flexibility and their low costs basedon operating fully depreciated narrow-bodied aircraft enabled them to undercutthe cargo tariffs of the scheduled airlines.
By 1980, however, many of the cargo charter airlines, of which there weremany in Britain, faced difficulties and one by one they went out of business. Thefuel price increases of 1978–9 hit these airlines particularly badly as they wereoperating older and less fuel efficient narrow-bodied aircraft. Many of theirmarkets also declined as economic recession began to bite. At the same time,scheduled airlines began making serious inroads into these markets by moreflexible and competitive pricing and by offering considerably greater freightcapacity as they introduced wide-bodied passenger aircraft on more and moreroutes. Moreover, Third World countries that had previously welcomed cargocharters decided that their own national airlines should participate in the airfreight market and restricted charter operations. Thus in 1983, when CathayPacific launched its first scheduled Boeing 747 freighter service to Europe, theHong Kong government cut back the freight tonnage uplift previously permittedto charter airlines such as Cargolux. As a result of all these pressures, thespecialist cargo charter airlines have declined in number and relative importance.By 1990 no large cargo charter airline of any significant size survived in Britain,even though several had been in existence a decade before. Two or three smallcargo airlines were still operating, but only by capturing a particular niche market.This was the case with the Channel Express, which carried vegetables andflowers from the Channel Islands to the mainland, and with Heavylift CargoAirlines. Cargolux, Europe’s largest all-cargo airline and a major operator ofcargo charters, managed to survive only through an injection of capital fromLufthansa. Those charter airlines remaining are finding it difficult to surviveunder the pressure of so much belly-hold freight capacity on scheduledpassenger flights. Cargo charters are still needed to meet sudden surges of
FLYING OFF COURSE 299

demand or awkward or bulky shipments, but increasingly they tend to beprovided by airlines such as Air France, El Al or Saudia operating freighters thatare otherwise used on scheduled cargo flights.
12.2The challenge of the integrated carriers
The biggest change in the air freight industry in the last 20 years has been thegrowth of the express parcels sector spearheaded by Federal Express in theUnited States. Launched in 1971, this company realized that the traditionalairlines were ignoring two key needs of a large segment of the potential freightmarket. This was for high-speed carriage and rapid handling of small parcels,many of an emergency or crucial nature such as legal documents. The secondrequirement was for door-to-door service with no other intermediary. With thesetwo product features in mind, Federal Express set up a parcels ‘hub’ inMemphis, Tennessee, and in effect introduced hubbing long before the passengerairlines appreciated its benefits (section 10.3 above). Complexes of aircraftarriving in Memphis from all over the United States within an hour or so of eachother in the middle of the night were able to swap their parcels and leave toreturn to their origins within a couple of hours. Operating in this way, FederalExpress was able to guarantee overnight delivery anywhere in the United Statesand could ensure it by providing its own collection and delivery vans in the citiesit served. The freight product was redefined. Instead of weight and price being thekey product features, convenience, speed and reliability became the criticalaspects of the product. Services were segmented and priced on the basis of speedof delivery. In 1990, Federal Express carried documents or packages notexceeding 68 kg or 3.3 metres in length and width combined. It offered servicesincluding ‘Overnight Letter’, ‘Priority One’ (delivery within the USA by 10.30the next business day) and ‘Standard Air’, which offered delivery no later thanthe second working day. Forwarders and other middlemen were cut out.
The express parcels business in the United States boomed, its growth rateoutstripping that of the more traditional air freight sectors. During the 1980s,courier and parcels companies which had previously used scheduled airlines fortheir courier services and express deliveries, as well as road trucks, followed theFederal Express example and set up their own airline operations. A number ofsuch integrated carriers had emerged by 1990, including Emery Worldwide,Airborne Express, United Parcel Services (UPS) in the United States and DHLAirlines and TNT which were stronger in Europe. Unlike Federal Express, theydid not limit their business to parcels but accepted larger consignments as well.They used their own aircraft but also bought space from the scheduled passengerand freight airlines as appropriate. The essence of such integrated carriers is thatthey provide a total product, including pick-up and delivery, transportation,customs clearance, paperwork processing, computer tracking, and invoicing. A
300 THE ECONOMICS OF AIR FREIGHT
single system can handle all kinds of cargo world wide and guarantee deliverywithin specified time periods.
The success of the integrated carriers in the United States can be gauged bythe fact that in 1978 they had close to 20 per cent of the US domestic cargo market,but by 1989 their share had shot up to 90 per cent of an $11 billion market(Boesch, 1989). It can also be seen in the fact that the last major US cargo airlineto survive, Flying Tiger, was itself taken over by Federal Express in 1989, thuscreating by far the largest air freight carrier in the world. However, FederalExpress had difficulties reducing Flying Tiger’s operating losses after the take-over (Jennings, 1990).
Having captured the major part of the US domestic market by the late 1980s,the integrated carriers then turned to developing their international operations. In1985, Federal Express established its European hub at Brussels airport and inJune of that year began its first transatlantic service. It opened its first routeacross the Pacific to Tokyo three years later. This expansion internationally wasaccompanied by the rapid purchase of courier and road-based freight companiesin many parts of the world, including Lex Wilkinson, a medium-sized Britishdistribution company. Other US integrated carriers followed a similar approachin expanding overseas. In Europe they were helped by the liberalization of airtransport which was gathering pace. A number of non-European integratedfreight carriers, such as the Australian TNT, set up European subsidiarycompanies to take advantage of the opportunities being opened up in Europe.But TNT, like others, also bought up small express parcel and distributioncompanies as well as airlines as a way of expanding its European networks mostrapidly.
A major issue facing the traditional passenger-oriented airlines during the1990s is whether they can successfully meet the challenge of the integratedcarriers or whether they are doomed to lose much of their freight traffic. Tosurvive that challenge they must capitalize on their major assets, which are high-frequency passenger flights to a wide variety of destinations, and combine thesewith a high-speed door-to-door integrated service. Their response to thechallenge has been mixed. Surprisingly, both KLM and SAS, which had beenmoving in this direction by buying into small express parcels operations, bothpulled back. In 1988, SAS sold its Cologne-based company Air de Cologne toTNT. Early the following year, KLM sold its XP parcels business also to TNT.Yet in May 1990 Lufthansa and JAL joined a Japanese trading company NisshoIwai in buying a share in DHL’s two holding companies. This is a major alliancelinking two of the world’s top three freight airlines with a major integrated door-to-door operator. It gives these airlines direct access to the lower-size end of thefreight market, which has seen the most rapid growth and in which thetraditional airlines have been losing market share.
FLYING OFF COURSE 301

12.3The demand for air freight services
Since air freight is much more heterogeneous than passengers there are severalways of categorizing it. One may, for instance, consider the commodities beingshipped, or one can classify freight by the weight of individual consignments orby the speed of delivery required. As with passenger traffic, it is valuable to tryto segment the freight market in terms of the motivation of the shipper, since thishas implications for the type of air freight services which need to be providedand for their pricing.
The most obvious role for air transport is the carriage of emergency freight.This includes urgently required medicines such as vaccines and spare parts formachinery or for equipment of various kinds which may be immobilized until thearrival of the replacement parts. Increasingly during the last two decades suchemergency freight has involved documents of various kinds, such as businesscontracts or other legal papers, medical records, financial papers, articles andreports, as well as films, photographic negatives, artwork and computer tapes ordisks. Many such shipments were best handled by the express parcels operatorsor by the companies providing courier-accompanied services. They provided thebasis for the growth of the integrated air carriers discussed above. However,there is a threat on the horizon. The electronic (facsimile) transmission ofdocuments had already begun to undermine the economics of the traditionalcourier services by 1990. Will it do the same to the express parcels sector or is thelatter’s traffic base sufficiently mixed to withstand a diminution of documenttraffic?
Air is also used in emergency when surface communications becomecongested or are disrupted by natural or other causes or when the national postalservices are slow or inadequate. In all such circumstances speed is of the essenceand cost of shipment is relatively unimportant. Demand to meet emergencies isirregular, intermittent and unpredictable in volume and in the size of individualconsignments. It is therefore difficult for airlines to plan for. The need ofshippers for high frequencies and good last-minute space availability means that,if adequately catered for, emergency freight demand results in low freight loadfactors and high unit costs.
Goods with an ultra-high value in relation to their weight are also normallycarried by air primarily because of the much higher security offered. Speed isimportant not in its own right but because it reduces the time during which thegoods are at risk. Gold, jewellery, diamonds, valuable metals and rare furs orworks of art fall into this category. Security is of overriding importance, whilecost of air freighting, given the value of the goods being shipped, is unimportant.
Both emergency and high-value freight require a high quality of service.Shippers of such consignments normally want to reserve space on specific flightswith a guarantee of on-time arrival. They demand preferential handling and
302 THE ECONOMICS OF AIR FREIGHT

clearance through customs and up-to-date information on the progress of theirshipments. From this point of view, too, such freight is more costly to handle.
The majority of air freight shipments involve what is called routine freight,where the shipper’s decision to use air transport is based on an assessment ofavailable transport options and is not a response to a sudden and unexpectedproblem; nor is it imposed by security considerations. There are many categoriesof routine air freight. A simple and widely used division is into perishable andnon-perishable freight. In the case of perishables, the market for thecommodities being shipped is dependent on air transport. The commercial life ofthe products—fish, out-of-season vegetables, newspapers, newsfilm, highfashion textiles, to name but a few—is short and the gap between producer andconsumer must be bridged before that commercial life expires. Only freightingby air can do that. The freighting costs are quite high in relation to the price ofthe product, but they can be justified if the final consumers are prepared to pay apremium because no local substitutes are available. In the case of foodstuffs, thepremium consumers are willing to pay for unusual or out-of-season produce islimited. As a result, the demand for air freight is fairly price sensitive. For allfoodstuffs being shipped by air there is a tariff level at which the demandvirtually dries up because the final market price of the products is no longerattractive to consumers. Since the initial price of many foodstuffs is quite low,that critical tariff level may itself be quite low. Airline pricing strategy thenbecomes crucial. To develop new flows of perishable freight, airlines may needto offer tariffs well below prevailing levels on the routes in question. The bulk ofperishable freight movements are highly seasonal, with very marked and oftenshort-lived demand peaks followed by long periods when demand dries upcompletely. This happens with the movement of early grapes from Cyprus to theUK, where the period during which air freighting is viable may last only two tofour weeks. The seasonality of much routine perishable freight means that highyear-round load factors are difficult to maintain. On the other hand, the demandpatterns are known in advance and airlines can try to stimulate off-peak demand.
Routine non-perishable freight is shipped by air because the higher transportcosts are more than offset by savings in other elements of distribution costs. Anyone of a variety of costs may be reduced as a result of shipment by air.Documentation and insurance costs will normally be lower, but the biggest directcost savings are to be found in packaging, ground collection, delivery andhandling. These are all transport-related costs. There may also be savings inother areas from reduced stock-holdings and therefore lower warehousing costsand from the lower capital tied up in goods in transit. The high interest ratesprevailing in many countries in recent years have made shippers andmanufacturers very conscious of the high costs of maintaining large inventories.This has pushed them to re-examine their logistics chain with the aim of reducingtheir stock-holding to a minimum. This has led to the concept of ‘just in time’(JIT). Air freighting is particularly suitable for JIT logistics chains because of itsspeed and its dependability. These indirect benefits of air freighting tend to be
FLYING OFF COURSE 303

more marked on long-haul routes where a shipment which may take 20–60 daysor more by sea and land may reach its destination by air in an elapsed time oftwo days or less. Taken together, the total distribution costs by air should belower than or close to those of competing modes for air to be competitive.
Routine non-perishable freight consists largely, of fragile high-value goodssuch as delicate optical and electrical goods, clothing and machinery of variouskinds, as well as semi-manufactured goods needed in various productionprocesses such as micro-chips. These benefit not only from the higher speed butalso from the increased security provided by air transport in terms of reduceddamage and loss. This, together with the high value of these commodities,sometimes means air may be preferred even when its total distribution costs arenot the lowest. For instance, some shippers or manufac-turers may use air freightas a way of breaking into and testing new and distant markets without the need toset up expensive local warehousing and distribution systems. If they aresuccessful, they may then switch to lower-cost surface modes.
Shipments of routine non-perishable freight tend to be regular, known inadvance and often of relatively constant size. Although speed is important, smalldelays of a day or two in collection or delivery can be coped with by theshippers. Non-perishable freight is less price sensitive than perishable freightbecause of its higher value, but it is nevertheless responsive to the totaldistribution costs of air transport, especially in relation to the costs of competingsurface modes.
Most goods being shipped by air have a high value to weight ratio. Since cargorates are generally based on weight, the higher the value of an item in relation toits weight, the smaller will be the transport cost as a proportion of its finalmarket price. Therefore, the greater will be the ability of that good to absorb thehigher air transport tariffs. This tendency for high-value goods to switch to airtransport is reinforced if they are also fragile and liable to damage or loss ifsubject to excessive handling, or if the surface journey times are very long,involving the tying up of considerable capital in transit. Consumer demand inmany industrialized countries is switching more and more towards goods withhigh value to weight ratios such as cameras, video machines, home computers,calculators, expensive shoes, and so on. It is goods such as these that lendthemselves to shipment by air, so the future prospects for air freight must begood. More importantly from the airline’s point of view, it is the countriesmanufacturing such goods that will become the largest generators of air freightdemand. This is one reason why the growth of freight traffic among South EastAsian airlines has in recent years far outstripped that of other regions and whyJAL, Korean, Cathay Pacific and Singapore Airlines are now among the top 10airlines in terms of international freight tonne-kilometres.
While freight can be categorized and split into market segments in terms ofshippers’ motivation, it remains very heterogeneous with a wide range ofdifferent manufactured and semi-manufactured goods, raw materials andagricultural products that may have little in common. The commodity mix will
304 THE ECONOMICS OF AIR FREIGHT

vary from route to route, but some broad generalizations can be made. Worldwide, about one-third of total international air freight is composed ofmanufactured goods (Groups 6 and 8 in the Standard International TradeClassification) and another one-third is machinery and transport equipment(SITC Group 7). The remaining third or so is made up of a variety ofcommodities, among which fresh foodstuffs and other agricultural products,medical and pharmaceutical goods and chemicals are all relatively important.The heterogeneity of goods going by air poses numerous marketing problems forairlines, particularly when trying to identify and develop new markets.
Another aspect of this heterogeneity is that freight comes in all shapes, sizes,densities and weights. There is no standard unit or size for a freight consignmentor any standard unit of space such as a seat. Freight density is crucial to theeconomics of air freight. Cargo payload on an aircraft is limited by weight butalso by volumetric capacity. Since tariffs are based on weight, an airline canmaximize freight revenue on a flight by carrying dense, heavy freight that fullyutilizes its weight payload. Low-density shipments may fill up the cargo spacewith a low total weight and a lower total revenue. Surcharges are frequentlyapplied to shipments having a density below a certain level. An airline must tryto achieve an average density in its freight carryings which makes maximum useof the volumetric capacity and payload of its aircraft. Because of the variety ofgoods being shipped, the risk is that volumetric capacity is used up before thepayload capacity.
The difficulties of handling large numbers of relatively small individualshipments of different size, shape, weight and density created considerablepressures towards unitization of air freight, both as a way of speeding up itshandling and in order to reduce handling costs. As a result, most air freight nowmoves in a variety of unit load devices (ULDs), which fall into four majorgroups. There are various built-up or half-pallets which may be rigid or flexible.Some are no more than a rigid base with netting to cover the goods beingshipped. Secondly, there are IATA-approved lightweight fibreboard or plywoodcontainers or boxes which fit on to full-size or half-pallets. The third group arerigid containers, which come in a number of standard sizes designed to fit intothe holds of wide-bodied aircraft. These rigid airline containers now account forthe larger proportion of total air freight since much of that freight is being movedon wide-bodied passenger aircraft or freighters. Lastly, there are ISO inter-modaltype containers which can be used only on wide-bodied freighters such as theBoeing 747F. These various unit load devices may be used and filled by theshippers or the forwarders and presented for carriage to the airline. On manyroutes the lower costs of handling such ULDs may be passed on to them throughlow tariffs related to particular ULDs. The fact that much of its freight comesforward in ULDs, each perhaps packed with a variety of different goods, perhapsoriginating from different shippers, is an added complexity in the marketing ofair freight services.
FLYING OFF COURSE 305

While passengers generally fly round trips or at least return to their origin,freight clearly does not. As a result, considerable imbalances in freight flows canarise. While freight flows on some major inter-national freight routes such asAmsterdam to New York are more or less balanced in each direction, on mostroutes there is a marked imbalance. On major freight routes it is common to findthat the traffic in the densest direction is twice or almost twice as great as in thereverse direction, as is the case on the Hong Kong to Frankfurt or the Bangkok toHong Kong routes. On secondary but still important freight routes, theimbalances tend to be even more marked, with the dense flows sometimes asmuch as four or five times greater than the return flows, as happens on the HongKong to Los Angeles route.
On many routes the tonnage imbalance is aggravated by pricing policies thattry to stimulate demand on the low-density direction by offering lower tariffs.The result may well be an even more marked revenue imbalance as the lowtonnages in one direction end up paying the lower cargo rates. Where freight isbeing carried largely on passenger aircraft, weight and revenue imbalances areeasier to absorb, though sometimes airlines may find themselves with inadequatebelly-hold capacity in one direction. But large imbalances are particularlydetrimental for the operation of all-cargo services, since they result in lowoverall load factors with no possibility of compensating revenue from passengersales. The absence of assured return loads creates marketing and pricing problemswhich are unique to the cargo side of the industry.
12.4The role of freight forwarders
The process of moving freight is considerably more complex than that of movingpassengers, involving packaging, more extensive and complex documentation,arranging insurance, collection from the shipper, customs clearance at origin anddestination and final delivery. The complexity involved has encouraged the growthof specialist firms which carry out some or all of these tasks on behalf of theshipper and provide an interface between shipper and airline. Such firms may berelatively small IATA-approved or non-IATA agents which feed their shipmentsdirectly to the airlines or to large freight consolidators. The latter will behandling freight directly for their own customers but may also be collecting andconsolidating consignments from smaller agents. There is considerablefragmentation within the industry, with shippers, forwarders, consolidators andairlines all involved to varying degrees with different consignments. Suchfragmentation has made the marketing and product planning of freightparticularly difficult for the airlines. Any one of the chain of activities necessaryto move freight by air may go wrong and undermine the total service beingoffered, yet the airline may have no control over that activity. It is also frequentlytorn between marketing and selling its service direct to the shipper orconcentrating its selling efforts on the forwarders.
306 THE ECONOMICS OF AIR FREIGHT

Large forwarders and consolidators have expanded vertically to develop newmarkets and sources of freight, since they deal directly with the shippers, and toprovide more and more services, such as ground collection and delivery, whichwere previously often undertaken by the airlines themselves. Large forwardersmay publish their own flight schedules and tariffs. In many markets, such as UK-North America, a handful of large consolidators may come to control over halfthe freight being shipped. This gives them considerable market power. Byconsolidating numerous small shipments into large consignments they can obtainsubstantial bulk discounts. In other words, they buy in bulk and sell retail. Oncertain routes they can go even further. If the tonnage they ship is high, they canplay off the airlines against each other and obtain very low special rates,particularly on routes where there is over-capacity. In this process airline yieldsare pushed down but the ultimate shipper may not be given the full benefit of thelower rates the consolidators obtain.
As over-capacity on many major air routes spread, so airlines tried to stimulatetotal demand or to increase their market share by offering special discountedrates to large forwarders or consolidators. Large numbers of small agents couldnot generate sufficient freight to take advantage of these special low rates. Theywere also wary of shipping via large consolidators for fear of losing theircustomers to them. Economic pressures from smaller agents eventually led to theestablishment of a new specialist, the freight wholesaler. They are a relativelyrecent but growing phenomenon. They buy space in bulk at rates comparable tothose of the large consolidator and resell to smaller agents. Unlike consolidators,they provide none of the ancillary services such as surface distribution orpackaging and therefore pose no threat to their customers. They are simplybrokers of freight capacity.
The growing concentration of freight demand in the hands of small numbersof consolidators and wholesalers created two key difficulties for the airlines thatsupply freight services. First, it cut them off from the ultimate customers, withthe result that they were possibly less aware of and less responsive to customerneeds and new opportunities. Some airlines tried to overcome this byestablishing their own freight-forwarding subsidiaries. Second, and potentiallymore damaging, was the downward pressure on cargo yields which resulted fromthe activities of consolidators or wholesalers. The impact on airline yields can begauged from the example of a 500 kg consignment on the London to Nairobiroute illustrated in Table 12.2. The ready availability of low contract rates on thisroute in 1985, well below the lowest specific commodity rates, encouragedconsolidators and wholesalers to buy space at these rates, though these were stilllower than the general or specific commodity rates. The result was that theairlines were often receiving less than half of the monies paid by the shippers forthe transport of their goods; the balance was going to the middlemen. Thedilution of freight revenue in this way clearly undermines the profitibility of airfreight. The growing power of these middlemen, and in particular their ability to
FLYING OFF COURSE 307

force down cargo tariffs when and where there was space capacity, was acontinuing problem for international airlines during the 1980s.
In Europe, the creation of the single internal market by 1993 led to a spate ofmergers and take-overs among freight forwarders and consolidators as theypositioned themselves for the new opportunities ahead. In Germany, two largegroups had emerged by 1990—Kuhne and Nagel, which was British owned, andSchenker, which together were thought to cater for up to one-third of the Germanair freight
Table 12.2 Impact of consolidators and wholesalers on airline revenues: London-Nairobicase, 1985
500 kg low-density consignment,a London-Nairobi
£per kg
Tariff structure:Normal general cargo rate 5.22Quantity general cargo rate for 100 kg plus 4.11Lowest specific commodity rate (motorcycles) 1.67Contract rates 0.90–1.60Selling rates:Airline’s contract rate to consolidator/wholesaler 0.90Consolidator/wholesaler resale rate to forwarder 1.00Forwarder’s rate to shipper 1.20–1.50Revenues earned:Shipper pays forwarder for 700 kg at, say, £1.50/kg 1,050Forwarder ‘splits’ volumetric weight with consolidator/wholesaler. Pays600 kg at £l.00/kg
600
Consolidator/wholesaler consolidates with dense cargo to lose volumetricweight penalty. Pays airline 500kg at £0.90/kg
450
Airline revenue as percentage of shipper’s payment 43%Note:a Volumetric weight for charging=700 kg.Sources: Compiled by author from various sources.
market. In the United Kingdom, a number of companies were merged to createRockwood International Freight in 1988, though one of the merged companieswas sold off two years later. By 1989 Rockwood, Air Express International,MSAS, LEP and Emery Air Freight together controlled just over one-third of theUK air freight market.
Yet, while concentration among consolidators grew, at the end of the 1980stheir market power began to diminish for a number of reasons. In the first place,competition among consolidators to get shippers’ business had gradually forced
308 THE ECONOMICS OF AIR FREIGHT

down the rates charged and reduced consolidators’ profit margins. This was anadded stimulus to mergers. Secondly, many larger shippers became moresophisticated in their approach and negotiated directly with the airlines to get anagreed rate, even if the shipments were ultimately hauled by a forwarder orconsolidator. Moreover, cargo rates offered by airlines were increasinglypublished in the trade press so even small shippers could ascertain easily whattheir shipments should be charged at. Another innovation introduced by AirFrance and subsequently adopted by Lufthansa was to insist that the waybillshowed the cargo rate actually paid and the commission (normally 5 per cent)charged by the forwarder. In this way the forwarder could not exact a largemiddleman’s profit, as in the London-Nairobi case above, without the shipperbecoming aware of it. But perhaps the greatest threat posed to the freightforwarders was the arrival on international markets of the integrated carriers,which could cut the forwarders out altogether.
12.5The economics of supply
12.5.1BELLY-HOLD CAPACITY
Most air freight travels in the belly-holds of the passenger aircraft andtraditionally it has been regarded as a byproduct arising from the supply ofpassenger services. Provided freight revenues covered those costs, such asground handling, sales and marketing, or extra fuel burn, which could be directlyattributed to carriage of freight, then any revenue in excess made a contributiontowards offsetting the costs of passenger services. The significance of thiscontribution can be gauged from the fact that in 1982 British Airways estimatedthat 51 per cent of its freight revenues on passenger aircraft went to cover freight-related costs, while the balance of 49 per cent could be used to cover the othercosts which would be incurred whether or not freight was carried on the aircraft(Table 12.3). On this basis, belly-hold freight appears to make a valuablecontribution to airline profitability.
The byproduct approach to costing, however, leaves open the question ofwhether freight should bear its share of other costs. Should the major costs ofoperating a flight be considered to be joint costs which need to be split andallocated in some way to both passengers and freight? This argument isstrengthened by the fact that the lower freight decks of wide-bodied aircraft havepossible alternative uses as galleys or lounges. Freight must at least cover theopportunity cost of forgoing these alternative uses. However, the allocation ofjoint costs inevitably involves some arbitrariness. The International AirTransport Association Cost Committee recommends that the profitability of
FLYING OFF COURSE 309

cargo carriage on passenger and combi aircraft is assessed after costs have beenfully allocated between cargo and passengers as follows:
Table 12.3 Distribution of revenue from cargo carried on passenger aircraft: BritishAirways, 1982
Revenue needed to cover direct cargo costs: %Cargo handling 21Additional fuel 11Sales and cargo promotion 8Insurance and commission 5Other overseas costs 4Administration 2Sub-total 51Cargo contribution to other costs 49Total cargo revenue 100Source: Bass (1983).
(a) Direct operating costs should be apportioned on the basis of the useablevolume of the aircraft allocated to each.
(b) Cargo-specific or passenger-specific costs, such as ground handling,marketing, and, in the case of passengers, in-flight service costs, should beseparately identified and allocated as appropriate.
(c) Administration and other overhead costs should be split between passengersand cargo in proportion to the sum of all the other costs (i.e. (a)+(b) above).
If costed on this basis, cargo carried on passenger aircraft was, according to theIATA Cost Committee, very marginal throughout the 1980s. In some years, as in1986, it just covered its operating costs including interest but made relativelylittle contribution to profits. In other years, 1987 was one of them, cargo onpassenger aircraft failed to cover its fully allocated costs (IATA, 1988). Thus, ifjoint costs are allocated in this way, then the overall contribution of belly-holdfreight becomes marginal. Nevertheless, the carriage of such freight on someindividual routes, such as Europe to/from East Asia, may still be highlyprofitable. A few airlines, Air France among them, do their cargo costing in thisway. But most prefer to think of belly-hold cargo as a profitable byproduct ratherthan a marginal joint product.
From both the suppliers’ and consumers’ points of view, belly-hold freightoffers numerous advantages. It is certainly low cost if costed on a byproductbasis. The higher frequency of passenger services is attractive to shippers,particularly for emergency-type freight, and they are prepared to pay a premiumfor the better service. This, together with the fact that passenger aircraft tend tocarry a higher proportion of small shipments which do not get bulk or quantitydiscounts, means that average freight yields from belly-hold freight on most
310 THE ECONOMICS OF AIR FREIGHT

routes are markedly higher than average yields on freighters. Narrow-bodiedpassenger aircraft had relatively little capacity for freight and even that wassometime restricted by take-off limitations. The ability to generate an additional10–15 per cent of revenue from freight has been an added incentive for manycarriers to switch to wide-bodied aircraft. Passengers benefit from this switchbecause the seat-kilometres of the larger aircraft are appreciably lower than thoseof the aircraft they replace. In the process, however, there are indications that toomuch belly-hold capacity is now available on many routes, with the result thatthere are strong downward pressures on cargo tariffs.
12.5.2ALL-CARGO AIRCRAFT
In the 1960s the carriage of freight on passenger aircraft, particularly narrow-bodied ones, faced a number of operational problems. Passenger aircraft couldnot handle large or outsize consignments and, since passengers were givenpriority, freight was more likely to be offloaded if take-off weight limits wereexceeded. Moreover, the timings and routeings of passenger services did notalways match the needs of freight shippers. To overcome these problems and tostimulate freight demand, many airlines introduced freighter aircraft. Thepenetration of such aircraft into the freight market and their subsequent declinewere described earlier, but not the causes of that decline.
The major economic advantage of the freighter is that it increases its payloadby half or more compared with the same aircraft in a passenger configuration. Bystripping out unnecessary passenger-related facilities, thereby saving weight, aBoeing 747 freighter may carry a cargo payload of 100–110 tonnes; the sameaircraft with a main passenger deck and belly-hold freight has a typical payloadof around 60–70 tonnes. The greater payload should reduce the tonne-kilometrecosts of freighters by one-third or more. Yet in the past all-cargo services havefrequently been unprofitable and have declined in relative importance becausethe airlines have been unable to maintain the fine balance between costs, yieldsand load factors which is essential to profitability.
In the first instance, the costs of all-cargo services were more adverselyaffected by the fuel price increases of 1973/4 and 1978/9 than those of passengeraircraft. This was because fuel costs for freighters are a higher proportion of totalcosts, particularly if they are narrow-bodied aircraft. On scheduled freighterservices, fuel and other variable operating costs may represent around 50 percent of total costs but may go up to 60 or 70 per cent. Consequently, costs can besignificantly reduced in the short term by cutting the number of services. As fuelprices escalated, airlines found that they could save money by switching theirfreight to passenger aircraft or even to road trucks and reducing their freighterservices. Within two years of the 1973/4 fuel crisis, Lufthansa had cut itsfreighter fleet from 17 to 6 aircraft and all freight travelling less than 600 km was
FLYING OFF COURSE 311

carried by road or in Airbus belly-holds. KLM followed the same policy in 1983when it started phasing out its DC-9 freighters.
The full costs of carrying freight on all-cargo aircraft can be readily identifiedso that, in theory, tariff strategies could be adopted to ensure that revenuesexceeded costs. In practice, the economic recession apparent in many countriesin the early 1980s, together with an excess of belly-hold capacity as airlinesintroduced more wide-bodied passenger aircraft, led to the collapse of cargorates in many important markets such as the North Atlantic. Moreover, yields onall-cargo freight, much of it travelling at bulk discount or contract rates, havebeen appreciably lower than those from freight on passenger aircraft. As ageneral rule, airlines have found that yields from all-cargo services had beenaround 10–15 per cent lower than the yields achieved from the carriage of freighton passenger aircraft (IATA, 1988 and see Table 12.4). As a result, where airlineshave managed to sustain high load factors on freight services, then freighterservices have proved profitable. On many international air routes, all-cargo loadfactors have not been high enough to compensate for the low yields, with theresult that freighter services have tended to be unprofitable.
The dramatic fuel price increases of 1973/4 and 1979, below-average andfalling yields and insufficiently high load factors have over the years underminedthe economic viability of all-cargo services on many routes. The result has beenthe abandonment of freighter services by many airlines and an increase in theproportion of freight travelling in belly-holds.
A surge in demand for cargo space in the late 1980s placed increasedemphasis on freighter operations and improved their viability. In 1987 and 1988the all-cargo operations of IATA member airlines produced a small surplus aftercovering all their operating costs and interest charges (IATA, 1988). But not allfreighter markets are equally profitable. Generally, longer-haul routes areprofitable whereas shorter regional operations tend to be loss-making. Thefactors which appear to be necessary to ensure continued viability of long-haulfreighter services are a high level of demand, preferably from both ends of aroute, an insufficient volume of cargo space on passenger aircraft and somelimitation on the provision of all-cargo services. In many long-haul markets,limitation is being achieved by the third and fourth freedom carriers operatingfreighter services jointly rather than in competition. This is done by SIA andBritish Airways between London and Singapore and by Cathay Pacific andLufthansa on their Hong Kong-Germany services. Such joint operations avoidoverprovision of freighter capacity, which tends to undermine cargo rates. TheNorth Atlantic is one of the least profitable of the long-haul routes, largelybecause there is too much capacity available. Conversely, the more limitedfreighter services between Europe and East Asia have ensured reasonable profitsfor most all-cargo operations in this market.
The danger of over-capacity is present in all markets and as a consequencemany airlines are loath to operate freighter aircraft and prefer to concentrate oncarrying belly-hold cargo. Yet there is still a role for the freighter. Many carriers
312 THE ECONOMICS OF AIR FREIGHT

will continue to operate freighters as a necessary adjunct to their overall freightservice. They need them to provide a better overall service for their customers byusing them to transport the 10 per cent or so of freight that is too large ordangerous for belly-holds as well as the larger consolidations. All-cargoschedules can also be geared to the needs of shippers. On some routes, where thedemand for passengers is thin, belly-hold capacity may in any case be insufficientto meet cargo needs. This may also be so on routes where payload or rangerestrictions reduce the effective cargo capacity on passenger flights. Theintroduction of very long non-stop flights with Boeing 747–400 or other aircrafthas resulted in the loss of cargo capacity on routes where extra fuel needs requirepayload cutbacks to fly the longer sectors. Lastly, carriers may use all-cargoservices, which may not be viable in their own right, to carry cargo on trunkroutes for onward distribution on passenger flights, where the revenue generatedmay make a contribution to overall profitability.
12.5.3COMBI AIRCRAFT
There are routes where the enormous payload of wide-bodied aircraft in all-cargoconfiguration is too large for the potential freight demand, while belly-holdcapacity may be insufficient or unable to cope with bulky consignments. In suchcircumstances, the wide-bodied combi aircraft, on which passengers and freightare carried on the main deck, may prove a commercially attractive proposition.By adjusting the main deck space allocated to passengers or freight in responseto the demand mix and seasonal variations of each route, total revenue can bemaximized. For instance, at times of peak passenger demand the whole cabinmay be used for passengers.
In a combi operation, the allocation of joint costs to the freight side isessential. Freight revenue must be seen to cover its share of capacity costs, sincewithout freight on the main deck the passenger service would use a smalleraircraft or a lower frequency and reduce its total costs. This means that freightpricing must move towards a full cost-recovery basis rather then be based on thebyproduct pricing strategy adopted for beliy-hold freight. Market conditions willdetermine whether this can be done. The method of allocation varies betweenairlines, but a number of airlines—KLM and Air France among them—havedone the exercise and have convinced themselves of the commercial advantagesof combi aircraft. Air France allocates 68 per cent of a Boeing 747 combi’s jointcosts to passengers and 32 per cent to freight. This is based on the fact that acombi 747 has only 32 per cent of the pallet capacity of an all-cargo 747. Thus68 per cent of the aircraft’s freight capacity is lost to passengers, who must coverthat share of the joint costs. In 1988, Air France, one of the largest freightoperators, carried as much as 35 per cent of its total freight traffic in combiaircraft. Another 55 per cent went in freighters and only 10 per cent went on
FLYING OFF COURSE 313

passenger aircraft. It is certain that for many airlines combi aircraft will have acontinuing role to play, particularly on the thinner long-haul routes.
In earlier years much greater use was made of convertible or quick change(QC) aircraft, which were used for passengers for most of the time and were thenre-configured for freight services during the night or at off-peak periods. While atone time they were quite widespread, especially within Europe, QC operationsare now less common. They have been adversely affected by airport night bans,by the high costs of changing the aircraft’s configuration, particularly when donetwice within 24 hours, and the ready availability of so much belly-hold capacity.However, some of the integrated companies, such as TNT, which have movedinto airline operations using freighters primarily for overnight express parcelshipments, would clearly benefit from flying their aircraft in a passengerconfiguration during the day.
12.6Pricing of air freight
12.6.1STRUCTURE OF CARGO TARIFFS
As with passenger fares, international cargo tariffs have traditionally been agreedby the airlines through IATA and subsequently approved by governments. Withliberalization of tariffs, especially on routes to the United States, and with over-capacity in many markets, IATA cargo tariffs have tended to become lesssignificant world wide, though for most countries, especially in the Third World,they provide the basis for the pricing of air freight. Since August 1984, tariffshave been published in the local currency of the point of origin.
The majority of international city pairs involving major and secondary citieshave an IATA general cargo rate. Like all air freight rates, it is expressed as arate per kg, or on US routes per lb, and there may be a minimum charge perconsignment. Originally, general cargo rates were one-eightieth of the passengerfare on the same route on the grounds that a passenger and their baggage wereestimated on average to weigh 80 kg. An examination of general cargo ratesaround the world shows that the rate per kilometre tapers with route distance.But the taper, which in theory is cost related, is neither regular nor always evident.In addition there are significant variations in the general cargo rate for oppositedirections on the same route. Thus the general rates from African points south ofthe Sahara to Europe have traditionally been as low as two-thirds or less of the ratesfor cargo originating in Europe. Similar north-south imbalances in rate levelshave also existed on air routes between North and South America. Such ratevariations have clearly been aimed at reducing the imbalances in freight flowsand more particularly at generating more northbound traffic.
314 THE ECONOMICS OF AIR FREIGHT

On the majority of routes, one or more additional tariffs may be availablewhich will be lower than the normal general cargo rate. First, there may bequantity general cargo rates where the rate per kg or lb decreases as the size ofthe consignment increases beyond certain agreed weight break-points. Whilemost routes may have only one or two quantity rates (45 kg and 100 kg arecommon break-points), routes to and from the United States tend to have manymore breakpoints, with successively lower rates as consignment weightincreases.
While the quantity general cargo rates encourage consolidation into largeconsignments, they fail to stimulate the air freighting of particular goods orcommodities. This is done by specific commodity rates which are individual lowrates for specific and clearly defined commodities. Some routes may have onlyone or two commodity rates, while others may have 40 or more. Such rates willreflect and encourage the types of goods most likely to be shipped by air on eachroute. Many commodity rates also include quantity discounts, with lower rates asshipment size increases. The level of the commodity rates varies widely, but onoccasions they may be as low as 20 per cent or less of the general cargo rate.While the original aim of specific commodity rates was to attract goods whichwould otherwise not travel by air, commodity rates are now frequently agreed toeven for high-value, low-weight goods which could bear the cost of the generalcargo rates.
The third type of discount rates are those related to particular unit load devices,known as ULD rates. Such rates are not available in all markets. There is a fixedminimum charge per ULD, which declines proportionally as the size of the palletor container increases. The minimum charge is for a given weight, known as thepivot weight. If the contents in the ULD weigh more than the pivot weight, thenthey are charged on a per kg basis, but the rates are normally lower than the quantitygeneral rates or most of the specific commodity rates. The tariff structure, basedon a minimum charge and low rates above the pivot weight, encourages shippersand forwarders to pack as much into the ULDs as possible. Moreover, by mixingshipments of different weight and density in a container, they can reduce theaverage cargo rate they pay to the airline. The aim of ULD rates is also toencourage shippers to use containers or other unit load devices which, from anairline viewpoint, are easier and cheaper to handle than disparate consignments.
A somewhat different category of cargo tariffs are the so-called class rates,which involve a rebate (for unaccompanied baggage or newspapers) or asurcharge (for gold or human remains, for example) on the general commodityrate. They have been applied to certain commodities whose carriage calls forspecial treatment. They are expressed as a percentage discount or surcharge onthe general cargo rate, though such discounts and surcharges seem to reflectdemand elasticity rather than the costs of the special treatment these shipmentsrequire. Only a small proportion of freight travels at these class rates.
In recent years, pressure from cargo charters on a few routes, excess cargocapacity on many routes and the trend towards liberalization of airline pricing
FLYING OFF COURSE 315

have together produced significant changes in the structure of tariffs in severalmajor markets. Freight-all-kinds (FAK) rates became widespread on the NorthAtlantic from about 1980 and subsequently spread to some other markets. Theseare low rates based on weight, not the commodity or the type of ULD. Originallythey applied only to large consolidated shipments, but in very competitivemarkets minimum weight limits have often been abandoned. FAK rates arepublished separately, their main purpose being to simplify the profusion ofcommodity and other rates.
Even more significant is the increasing use of contract rates directlynegotiated by airlines with large shippers or forwarders guaranteeing to provide aminimum tonnage over a given period. The growing market power of freightforwarders and the competitive pressure on airlines to sell excess capacity havecreated a situation on the North Atlantic, on the North Pacific and some otherroutes where very low contract rates dominate the market and where freightpricing bears little relation to published IATA tariffs. Contract rates may fall to20 per cent or less of the general cargo rate (Table 12.2 above). In competitivemarkets with considerable spare freight capacity slushing around, it is likely thatonly small and emergency consignments move at published freight rates, whilewell over half the freight tonnage is shipped at contract rates.
12.6.2PRICING STRATEGIES
The review of the structure of cargo tariffs suggests that they bear only a tenuousrelationship to cargo costs. Different commodities on the same route may becharged at widely different rates, with no marked differences apparent in thecosts of handling and freighting them. General cargo rates vary markedlybetween sectors of similar length being operated with similar aircraft. Rates onthe same route differ in opposite directions. The taper of rates per kilometre withdistance is neither consistent nor closely related to costs. While IATA and someairlines have tried to dress up the cargo tariffs as being somehow cost related,there can be little doubt that the underlying philosophy, especially forcommodity rates, is ultimately one of ‘charging what the traffic will bear’, that is,market-oriented pricing. Such a pricing strategy was encouraged by thebyproduct view of air cargo. As a byproduct of passenger services, the carriage offreight appeared to impose low additional costs, and any revenue in excess ofthese low costs made a contribution to the overall profitability of the services.
It could be argued, as the UK Civil Aviation Authority has (CAA, 1977b), thatmarket pricing is discriminatory since it entails charging some shipments morethan the costs they impose and others less. This is undoubtedly the case, but it isdifficult to see how market pricing could be avoided given the nature of the airfreight market. It has two distinctive characteristics which bedevil any attempt toestablish cost-related tariffs. First, the existence of freight consolidators andwholesalers not only cuts off the airlines from their true customers and distorts
316 THE ECONOMICS OF AIR FREIGHT
the pricing mechanism but also gives such large freight agents considerablemarket power. Secondly, the carriage of freight is inherently more competitive,even in regulated markets, than is the carriage of passengers. This is becausemost freight, except for emergency freight, is indifferent to the routeing it isoffered in order to move from its origin to its destination. A shipper is unconcernedif a shipment goes from New York to Lisbon via Amsterdam or Frankfurt orCopenhagen with a six-hour transhipment at one of those airports, provided itgets to Lisbon within the expected time. Few passengers would put up withcircuitous and lengthy journeys. Thus in most cases there are numerous routeings(and airlines) that freight can use to get to its destination. This ensures a degree ofinterairline competition which may be absent for passengers on the same routes.If one superimposes on these market characteristics the availability on most airservices of surplus belly-hold capacity, then any attempts to establish cost-relatedcargo tariffs will inevitably be futile. Airlines have little choice but to pursue astrategy of setting rates aimed at maximizing revenue. In prevailing marketconditions this means on most major routes charging what the traffic will bear.
In an environment of market-oriented pricing where consolidators andwholesalers have had a major influence on what the shippers ultimately pay,current trends indicate that cargo tariffs are moving towards a three-tier pricingstructure related to the speed of delivery. The highest or premium cargo rates arebeing charged for services guaranteeing overnight delivery. In effect this meansthat shipments move on the next available passenger flight. The target market isemergency freight and small parcels. It is this market which is most threatenedby the integrated carriers. The special commodity, FAK or contract rates arebeing used for belly-hold cargo and occasionally all-cargo services offering atwo-four day delivery. The trend here is increasingly towards FAK or contractrates that reflect the market conditions on each route. It is only on routes wherebelly-hold capacity is limited in relation to the demand for freight space andalternative routeings are difficult or costly that the structure of complex andrelatively high specific commodity rates is likely to survive. Thirdly, the lowestcharter-competitive rates are likely to be available for large and regularshipments where delivery may be delayed for up to a week or so. Some of thistraffic may go on scheduled all-cargo services. With all three tariff types, lowerquantity rates may additionally be offered for larger shipments.
The expansion of the integrated courier and express parcels carriers, such asEmery Worldwide or UPS, into the more traditional freight markets hasreinforced this trend towards a tariff structure based on delivery time.
12.6.3FREIGHT YIELDS
The prevailing cargo tariff levels in the major markets served by an airline andthat airline’s traffic mix are clearly the major determinants of an individualairline’s freight yields. Particularly important is the degree to which the general
FLYING OFF COURSE 317
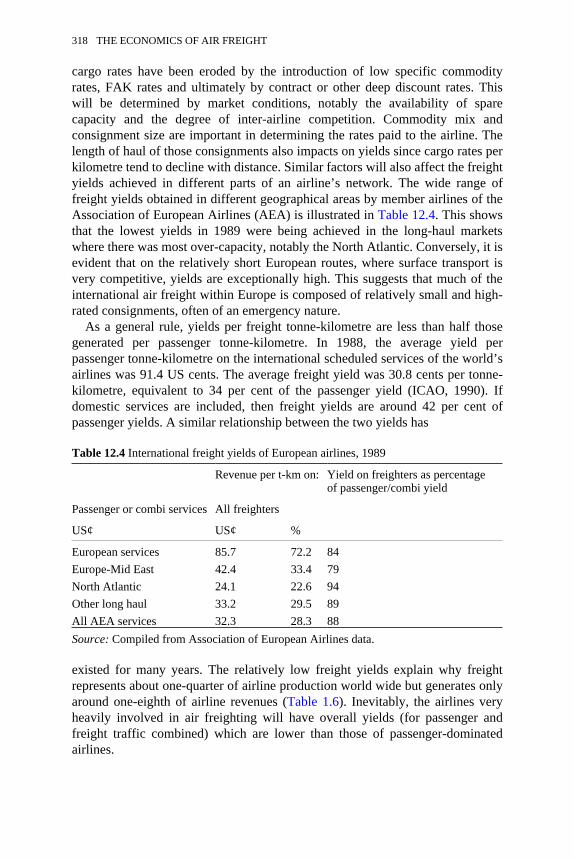
cargo rates have been eroded by the introduction of low specific commodityrates, FAK rates and ultimately by contract or other deep discount rates. Thiswill be determined by market conditions, notably the availability of sparecapacity and the degree of inter-airline competition. Commodity mix andconsignment size are important in determining the rates paid to the airline. Thelength of haul of those consignments also impacts on yields since cargo rates perkilometre tend to decline with distance. Similar factors will also affect the freightyields achieved in different parts of an airline’s network. The wide range offreight yields obtained in different geographical areas by member airlines of theAssociation of European Airlines (AEA) is illustrated in Table 12.4. This showsthat the lowest yields in 1989 were being achieved in the long-haul marketswhere there was most over-capacity, notably the North Atlantic. Conversely, it isevident that on the relatively short European routes, where surface transport isvery competitive, yields are exceptionally high. This suggests that much of theinternational air freight within Europe is composed of relatively small and high-rated consignments, often of an emergency nature.
As a general rule, yields per freight tonne-kilometre are less than half thosegenerated per passenger tonne-kilometre. In 1988, the average yield perpassenger tonne-kilometre on the international scheduled services of the world’sairlines was 91.4 US cents. The average freight yield was 30.8 cents per tonne-kilometre, equivalent to 34 per cent of the passenger yield (ICAO, 1990). Ifdomestic services are included, then freight yields are around 42 per cent ofpassenger yields. A similar relationship between the two yields has
Table 12.4 International freight yields of European airlines, 1989
Revenue per t-km on: Yield on freighters as percentageof passenger/combi yield
Passenger or combi services All freighters
US¢ US¢ %
European services 85.7 72.2 84Europe-Mid East 42.4 33.4 79North Atlantic 24.1 22.6 94Other long haul 33.2 29.5 89All AEA services 32.3 28.3 88Source: Compiled from Association of European Airlines data.
existed for many years. The relatively low freight yields explain why freightrepresents about one-quarter of airline production world wide but generates onlyaround one-eighth of airline revenues (Table 1.6). Inevitably, the airlines veryheavily involved in air freighting will have overall yields (for passenger andfreight traffic combined) which are lower than those of passenger-dominatedairlines.
318 THE ECONOMICS OF AIR FREIGHT

12.7Future prospects
At the end of the 1980s, forecasts of air freight growth during the 1990s were allvery optimistic. The International Civil Aviation Organization forecast an annualrate of growth in international freight tonne-kilometres between 1988 and 2000 of8.5 per cent (ICAO, 1990). Other long-term forecasts, mostly produced byaircraft manufacturers, were around this figure: McDonnell Douglas predictedthat international freight traffic would grow at 10.6 per cent per annum to 1998,while Boeing forecast a growth rate lower than ICAO’s. But all long-termforecasts have one feature in common. They all foresee well-above-averagegrowth rates for freight on air routes to and within the Pacific basin, notably onthe transpacific routes, on Europe-Far East routes and on air services betweencountries in the Far East and Pacific region. These are the freight markets thatwill grow most rapidly during the 1990s.
The prospects look promising but there are two areas of concern for theworld’s international airlines. The first is whether continued over-capacity inmany freight markets will depress freight yields to uneconomic levels. Duringthe first half of the 1980s freight yields declined in some markets but overallstayed fairly constant. In the second half of the decade they began to rise againas freight demand picked up. In constant or real value terms, however, freightyields actually declined quite sharply during the 1980s. In the 1990s many newpassenger aircraft ordered during the boom years of 1987–9 will enterinternational markets. There are going to be significant increases in belly-holdcargo capacity, particularly in the period up to 1993. Will the airlines be able toprevent a collapse in cargo rates? The second problem area is how to respond tothe different market expectations created by the integrated carriers. If thetraditional airlines are to succeed as carriers of freight, they must appreciate thatthere has been a logistics revolution. They must invest heavily in distributionnetworks, in electronic data interchange (EDI) and in other facilities which areneeded to meet shippers’ requirements. Their aim should be not just to transportfreight by air but to add value to the shipper’s products. In doing this they maybe able to charge more for their services and thereby counteract any downwardpressure on rates.
FLYING OFF COURSE 319

13Future Problems and Prospects
The second half of the 1980s was a good period for the airline industry. After thedisastrous years of 1980–3, its fortunes improved. Despite a hiccup in 1986associated with the Chernobyl nuclear disaster and terrorism in Europe, the years1984–9 were among the most successful in the industry’s history. Yet,surprisingly, operating profits as a percentage of revenue were only about 4–6 percent; and they dropped to only 1–2 per cent once interest and other non-operatingitems were included (Figure 1.4). Nevertheless, there had been a markedimprovement compared with the early 1980s.
The reasons for the turn-round are not difficult to find. The first and probablythe most important was undoubtedly the drop in the real price of aviation fuelfrom around 135 US cents per gallon in 1980 to less than 50 cents (at constant1985 values) by 1986 (Figure 5.1). As a result both of this dramatic drop in fuelprice and of lesser drops in maintenance and depreciation costs, overall unitoperating costs also declined. Unit costs had been around 50–55 cents peravailable tonne-kilometre (at 1985 values) during the 1970s, but dropped sharplyafter 1980, bottoming out at around 40–45 cents by 1985 (Figure 1.1).
Secondly, the latter half of the 1980s saw a rapid surge in worldwide demand.Whereas between 1980 and 1985 the annual growth rate averaged 5 per cent,between 1986 and 1989 it shot up to an average of 8–9 per cent. Growth waseven faster in some parts of the world, notably on East Asian routes. There wasinsufficient capacity to meet this upswing, so load factors rose from 58 per centin 1980 to around 60–61 per cent in the second half of the decade (Figure 1.2).For international scheduled airlines the improvement was most impressive interms of passenger load factors. These climbed from 58 per cent in 1980 to 68 percent in 1988, with several scheduled airlines, particularly Asian ones, operatingfor several years at passenger load factors above 70 per cent.
Given these favourable developments it is surprising that the improvedprofitability was still fairly marginal overall. This was because revenue yieldsalso declined during the early 1980s and this partly offset the impact of fallingcosts and higher load factors (Figure 1.3). Also, despite the overall improvementin the industry’s fortunes, many airlines around the world continued to fly offcourse. Several US airlines, notably Pan American, and many others in Africa

and South America failed effectively to match supply and demand and continuedto make losses during most of the decade.
At the beginning of the decade, prospects for continued airline profitsthroughout the 1990s looked good. Most long-term forecasts envisaged annualgrowth rates of 5.5–7 per cent, which means that most of them agreed that trafficwould more or less double by the year 2000; it was expected to more than doublein some high-growth markets as in the Far East. But there were problems ahead.The acceleration of demand in the late 1980s and the resultant rise in load factorshad led to a rash of large aircraft orders. This was facilitated by the activities ofthe leasing companies, which ordered numerous new aircraft on behalf ofairlines that might otherwise have delayed their orders because of internalfinancial constraints. Between 1990 and 1999, around 700 new commercial jetaircraft are being delivered each year, of which at least a quarter will be wide-bodied. The growth in potential airline capacity is enormous. How enormousdepends partly on the rate of retirement of older and noisier aircraft currently inairline fleets. Can such a rapid increase in airlines’ potential supply of airservices be absorbed by the projected increase in demand or will load factors andrevenue yields collapse as supply outpaces demand? Will the economics ofinternational airlines once more fly off course?
By mid-1990 there were the first signs of an impending downturn in airlinefortunes. Several airlines, among them Air Canada, KLM, Air France,Northwest, and SAS, reported significant falls in their profits for the first sixmonths of 1990 compared to a year earlier. This was attributed to a variety offactors. But the underlying cause was that traffic growth in many markets wasbelow expectations and load factors and, in some cases, revenue yields, werebeginning to fall while many airlines’ costs were rising rapidly.
The Iraqi invasion of Kuwait in August 1990 turned what might have been ashort-term decline in airline profitability into a potentially longer term crisis. Fuelprices rose rapidly after August as supplies of petroleum from Iraq and Kuwaitdried up. By October spot prices for jet fuel were around $1.40 per US gallon,more than double the July 1990 price. Any more serious disruption of MiddleEast fuel supplies would clearly aggravate the situation. It was felt, however, thatany further dramatic increase in the price of oil would be shorter lived than wasthe case in the 1970s when alternative sources of oil were more limited. Perhapsof greater concern to the airlines was the adverse effect that higher oil costs mighthave on major world economies and the consequent dampening of demand forair transport which might result. Already by the end of 1990 and before the startof the Gulf War many airlines were in serious trouble because of the downturn inseveral markets. In the United States, Eastern Airlines stopped trading in January1991 following estimated losses in 1990 of $660 million while both PanAmerican and Continental were operating under Chapter 11 bankruptcy rules.Pan American and TWA were desperate to sell their London-Heathrow to UnitedStates services to United and American respectively in order to generatesufficient cash flow to keep going. European airlines, meanwhile, were
FLYING OFF COURSE 321

announcing losses or sharply reduced profits for 1990. Sabena, for instance, wasforecasting a loss of $215 million for the year.
The eruption of the Gulf War on 17 January 1991 blew a large hole in airlinefinances and turned crisis into potential disaster. Fear of terrorism combined withdirectives from many large companies to their personnel to avoid travel by airresulted in an unprecedented drop in passenger traffic levels throughout theworld but more especially on European and North Atlantic routes. In the firstmonth after the outbreak of war, European airlines registered 15–25 per cent fallsin passenger numbers while on transatlantic routes traffic was often 30–40percent down on a year earlier. It was high yield business travel which slumpedparticularly badly so the impact on airline revenues was even greater than thepassenger numbers would suggest. The downturn in demand was very muchworse than in 1986. As airline load factors collapsed the economic crisis facingthe international airline industry deepened.
Drastic action was needed to cut costs and to stimulate demand. Frequencieswere reduced by most airlines and several, such as Air France or British Airways,pulled out of marginal or loss-making routes altogether. British Airwaysabandoned Heathrow-Dublin, a route it had served for over 40 years, becauseincreased competition had made it unprofitable. Aircraft orders were cancelledor delayed. In an effort to reduce further costs widespread staff cuts wereannounced. By early 1991 Iberia had revealed that it was shedding 10 per cent ofits employees and Air Canada 12 per cent. KLM was cutting staff by 3,000, USAir by 3,585 and Qantas by 500. British Airways announced 4,600 job losses andthat 2,000 employees would be stood down on half pay.
To generate revenue many airlines announced fare reductions or illegallydiscounted fares especially on those routes most adversely hit by the downturn indemand. Early in February 1991 both TWA and British Airways announced 33–50 per cent fare reductions on transatlantic services. Domestic fares in Britainand the United States also started coming down.
Such were the problems being faced that in February 1991 the EuropeanCommission agreed to a three-month package of contingency measures, whichflouted its own competition rules, in order to assist European airlines adverselyaffected by cost escalation and falling traffic as a result of the Gulf War. Mostnotably, it was prepared to allow limited financial support by governments fortheir national carriers.
The thesis argued in this book is that airlines must husband their resourcescarefully in matching supply, which they control, with demand which they donot. Whatever happens in the shorter term as a result of the Gulf Crisis,international air transport throughout the 1990s will be characterized by a lessstable market environment as regulatory controls are further loosened, especiallywithin Europe, and as the larger carriers jostle for dominance in particularmarkets. Within a potentially unstable environment, matching supply anddemand will become more difficult. US experience has shown that pushing upload factors and preventing declines in real yields become particularly difficult
322 FUTURE PROBLEMS AND PROSPECTS

during the early years of deregulation. Yet this is exactly what many internationalairlines must do during the 1990s.
International scheduled airlines also have to learn some hard lessons fromtheir South East Asian counterparts and from Europe’s charter airlines. Theformer have shown the need both to increase labour productivity while keepinglabour costs down and to have effective marketing based on product featureswhich meet market expectations—the aim of such marketing being to push upload factors and thereby further reduce unit costs. The charter airlines’ successhas been based on reducing indirect costs to a minimum, on higher seatingdensities and on a very close matching of supply to demand so as to achieve veryhigh passenger load factors.
To ensure their future profitability, international airlines must first of allsignificantly reduce their labour costs to levels that are comparable to those ofthe newer Asian carriers. This means major increases in labour productivity. Formany European and North American airlines, which have not done so already,this may require large cuts in staff numbers and an easing of job demarcationbetween different categories of staff. The staff cuts announced in 1990 and 1991were a step in this direction. But would cuts of this order be enough? The secondarea of concern must be that of indirect operating costs. Considerable costssavings can be achieved, as the charter airlines have shown, through asimplification of reservations and ticketing procedures. Simplification andautomation of ticket sales and of baggage and passenger check-in should be usedto reduce staff numbers and costs and facilitate air travel at the same time.Administrative overheads must also be cut to a minimum. Lastly, scheduledairlines must strive to achieve higher year-round load factors. Currently, averageload factors tend to be in the mid-sixties for the better airlines and low sixties orless for the others. Airlines must aim for year-round load factors in the mid-seventies or higher. To achieve them they will need to introduce effective andsophisticated yield management techniques which ensure that the revenue oneach individual flight is maximized. This may also require increased expenditureon marketing and promotion. This is the one item of indirect costs which mayactually increase, but it should not get out of hand. These lessons may not beeasy to accept but ignoring them will not just mean flying off course. It may wellmean going to the wall.
FLYING OFF COURSE 323

Appendix A:Freedoms of the Air
Negotiated in bilateral air services agreements
First Freedom The right to fly over another country without landing.Second Freedom The right to make a landing for technical reasons (e.g.
refuelling) in another country without picking up/setting down revenue traffic.Third Freedom The right to carry revenue traffic from your own country (A)
to the country (B) of your treaty partner.Fourth Freedom The right to carry traffic from country B back to your own
country A.Fifth Freedom The right of an airline from country A to carry revenue traffic
between country B and other countries such as C or D. (This freedom cannot beused unless countries C or D also agree.)
Supplementary rights
Sixth ‘Freedom’ The use by an airline of country A of two sets of third andfourth freedom rights to carry traffic between two other countries but using itsbase at A as a transit point. For example, Royal Jordanian carries sixth freedomtraffic between London and Middle East points via its base at Amman eventhough it has not been granted fifth freedom rights between these points andLondon.
Sixth freedom rights are not formally recognized in air services agreements,though several Confidential Memoranda of Understanding make implicitreference to them, especially when dealing with capacity issues.
Cabotage Rights The right of airline of country A to carry revenue between twopoints in country B. For example, Air France for many years had cabotage rightsbetween various points within Morocco.
Cabotage rights are very rarely granted. Nevertheless, several countries whosecarriers are currently flying to the United States are pressing the US governmentfor cabotage rights.

Appendix B:Definition of Airline Terms
Payload capacity Total of aircraft capacity available for the carriage ofpassengers, baggage, cargo or mail. Measured in metric tonnes.
Capacity or available tonne-kilometres (ATK) This is a measure of airlineoutput. ATKs are obtained by multiplying the payload capacity on a flight by thestage distance flown.
Revenue tonne-kilometres (RTK) or tonne-kilometres performed/carried Thismeasures the output actually sold. RTKs are obtained by multiplying the numberof tonnes carried on a flight by the stage distance.
Weight load factor Measures the proportion of the output actually sold. It isthe RTKs expressed as a percentage of the ATKs.
Capacity or available seat-kilometres This is obtained by multiplying the seatsavailable on a flight by the stage distance.
Passenger-kilometres The number of passengers on a flight multiplied by thestage distance. Passenger-km are normally converted to revenue or passengertonne-km by assuming that 1 passenger with baggage equals 90kg (i.e.passenger-km divided by 11.111 equal passenger tonne-km).
Seat factor or passenger load factor On a single sector this is obtained byexpressing the passengers carried as a percentage of the seats available for sale.On a network of routes, the seat factor is obtained by expressing the totalpassenger-km as a percentage of the total seat-km available.
Tonne-kilometres per hour This measures an aircraft’s hourly productivity. Itis the payload capacity multiplied by the average speed. The latter may be theaverage block speed or the cruise speed.
Stage or sector distance Ideally this should be the air route distance betweentwo airports. Many airlines and IATA use the great circle distance, which isshorter than the distance actually flown.
Average stage length The weighted average of stage/sector lengths flown byan airline. This is most easily obtained by dividing an airline’s total annual aircraft-km by the number of aircraft departures or flights recorded during the year.
Aircraft-kilometres The distances flown by aircraft. They are derived from thestage lengths and the frequencies operated over each stage.

Length of (passenger) haul The average distance flown by an airline’spassengers. This is obtained by dividing an airline’s total passenger-km by thenumber of passengers carried.
Block time This is the time for each stage between engines being switched onat departure and off on arrival.
Block speed The average speed for each stage calculated from the block time.Flying or airborne time The time from aircraft lift-off to touch-down on the
runway.Aircraft hours The cumulative time that each aircraft is in use, calculated
usually from the block times. Airborne or flying hours might also be calculated.Aircraft utilization The average number of block hours that each aircraft is in
use. Utilization may be measured on a daily or an annual basis.Yield Measures the average revenue obtained per ATK or RTK. It is obtained
by dividing an airline’s total revenue by its total ATKs or RTKs.Passenger yield The average revenue per passenger-km or passenger/tonne-km.
It is obtained by dividing total passenger revenue by the total passenger-km orpassenger tonne-km. Freight yields are obtained in the same way.
Flight crew Refers to the pilot, co-pilot and flight engineer if any.Cabin crew Refers to stewards and stewardesses.Seat pitch This is the standard way of measuring seating density on aircraft. It
is the distance between the back of one seat and the same point on the back ofthe seat in front.
326 APPENDIX B: DEFINITION OF AIRLINE TERMS

Bibliography
AAE (1987), ‘Computer reservation systems’, Avmark Aviation Economist (London),May.
AAE (1989), ‘Who’s where in the States’, Avmark Aviation Economist (London),October.
AEA (1982), Standard File on Civil Aviation in Europe (Brussels: Association ofEuropean Airlines).
AEA (1987), Medium Term Forecasts of European Scheduled Passenger Traffic 1987–1991 (Brussels: Association of European Airlines).
AEA (1989), Medium Term Forecast of European Scheduled Passenger Traffic 1989–1993 (Brussels: Association of European Airlines).
AM (1989), The Airline Monitor. June 1989 (Ponte Vedra Beach, Fla: ESG AviationServices).
ATA (1990), Air Travel Survey 1989 (Washington, DC: Air Transport Association ofAmerica).
Avmark (1990), Quarterly Aircraft Operating Costs and Statistics. Quarter ending 30September 1990 (Arlington, Va: Avmark Inc.).
BA (1990), British Airways Investor (London: British Airways), No. 3, summer.Bass, Tom (1983), ‘Passenger aircraft have competitive edge’, Special Report: Air Cargo
in Transport, vol. 4, no. 4, July-August.BAA (1978), Long Term Airport Traffic Forecasting (London: British Airports
Authority).BA(1981), BAA Traffic Forecasts: Methodology (London: British Airports Authority).Barrett, S. (1989), ‘European airline deregulation’, Proceedings ESRC Seminar on
European Deregulation, Oxford, September.Blake, R. (1989), Meeting the Needs of the Passenger. The Role of Research, Royal
Aeronautical Society Air Transport Course (Oxford, unpublished).Boesch, W.R. (1989), ‘Combination carriers fight back’, Airline Business, December.Burnell, R. (1990), The Economics of Non-Scheduled Operations, Oxford Air Transport
Course (1990) (Royal Aeronautical Society).Business Monitor (1989), MQ6 Overseas Travel and Tourism. Quarterly Statistics
(London: Business Statistics Office, HMSO).Button, Kenneth (1989), ‘The deregulation of US interstate aviation’, Transport Reviews,
vol. 9, no. 2.Button, Kenneth and Swann, Dennis (1989), ‘European Community airlines —
deregulation and its problems’, Journal of Common Market Studies, vol. XXVII, no.4.
CAA(1975), International Air Freight Services. A Consultative Document, CAP 379(London: Civil Aviation Authority).
CAA (1977a), Air Freight Demand. A Survey of UK Shippers, CAP 401 (London: CivilAviation Authority).
CAA (1977b), Freight Policy—A Consultation Document, CAP 405 (London: CivilAviation Authority).
CAA (1977c), European Air Fares: A Discussion Document, CAP 409 (London: CivilAviation Authority).
CAA (1980), Passengers at the London Area Airports in 1978, CAP 430 (London: CivilAviation Authority).
CAA (1981), Air Navigation. The Order and Regulations, CAP 393 (London: CivilAviation Authority).
CAA (1989a), Traffic Distribution Policy for the London Area and Strategic Options forthe Long Term, CAP 548 (London: Civil Aviation Authority).
CAA (1989b), Passengers at the London Area Airports and Manchester Airport in 1987,CAP 560 (London: Civil Aviation Authority).
CAA (1990a), UK Airports. Annual Statement of Movements, Passengers and Cargo.1989, CAP 566 (London: Civil Aviation Authority).
CAA (1990b), UK Airlines: Annual Operating, Traffic and Financial Statistics 1989,CAP 568 (London: Civil Aviation Authority).
CAB (1969), Charter Travel and Economic Opportunity. (Washington, DC: CivilAeronautics Board).
CAB (1975), Report of the CAB Special Staff on Regulatory Reform (Washington, DC:Civil Aeronautics Board).
Cambau, D. and Lefevre, G. (1981), Panorama of World Non-Scheduled PassengerTransport (Paris: Institut du Transport Aerien).
Carey (1858), Principles of Social Science, Vol. I, pp. 41–3 (Philadelphia).CEC (1975), Action Programme for the European Aeronautical Sector, R/2461/75
(Brussels: Commission of the European Communities).CEC (1981), Scheduled Passenger Air Fares in the EEC, COM (81) 398 Final (Brussels:
Commission of the European Communities).CEC (1983), Council Directive Concerning the Authorisation of Scheduled Inter-
Regional Air Services between Member States (Brussels: Commission of theEuropean Communities).
CEC (1984), Civil Aviation Memorandum No. 2 Progress towards the Development of aCommunity Air Transport Policy, COM (84) 72 Final (Brussels: Commission of theEuropean Communities).
CEC (1987a), Council Directive of 14 December 1987 on fares for scheduled air servicesbetween Member States, 87/601/EEC, Council Decision of 14 December 1987 on thesharing of passenger capacity on scheduled air services between Member States, 87/602/EEC (Brussels: Commission of the European Communities).
CEC (1987b), Council Regulations (EEC) No. 3975/87 and No. 3976/87 of 14 December1987 on the application of rules of competition in the air transport sector (Brussels:Commission of the European Communities).
CEC (1988), Commission Regulation (EEC) No. 2671/88 of July 1988 (Brussels:Commission of the European Communities).
CEC (1989), Council Regulation (EEC) No. 2299/89 on A Code of Conduct forComputerised Reservation Systems. 24 July 1989 (Brussels: Commission of theEuropean Communities).
Cross, R. and Schemerhorn, R. (1989), ‘Managing uncertainty’, Airline Business(London), November.
328 BIBLIOGRAPHY

CTC (1981), The Basic Economics of Air Carrier Operations, Report No. 40– 81–04.(Ottawa/Hull: Research Branch, Canadian Transport Commission).
D’Arcy Harvey (1951), ‘Airline passenger traffic pattern within the United States’,Journal of Air Law and Commerce.
Dennis, Nigel (1990), ‘Hubbing as a marketing tool’, Paper to Air Transport ExecutiveSeminar, November 1990 (London: Transport Studies Group, Polytechnic of CentralLondon).
Department of Trade (1978), United Kingdom Air Traffic Forecasting. Research andRevised Forecasts (London).
Department of Trade (1981), Report of the Air Traffic Forecasting Working Party 1981(London).
Dept. of Transportation (1990), Secretary’s Task Force on Competition in the USDomestic Airline Industry (Washington, DC: Department of Transportation).
Doganis, Rigas (1966), ‘Traffic forecasting and the gravity model’, Flight International,29 September.
Doganis, Rigas (1973), ‘Air transport—a case study in international regulation’, Journalof Transport Economics and Policy, vol. VII, no. 2, May.
Doganis, Rigas (1977), ‘Current trends in the international regulation of air transport’, ITABulletin (Paris: Institut du Transport Aerian), nos 40 and 41, 28 November and 5December.
Doganis, Rigas (1986a), ‘Efficiency: measure for measure’, Airline Business, May.Doganis, Rigas (1986b), ‘South East Asian airlines. The rise and rise of SIA, Thai, MAS,
PAL and Garuda’, Travel and Tourism Analyst, December.Doganis, Rigas (1989), ‘How good are long term traffic forecasts?’ Airfinance Journal,
January.Doganis, Rigas and Dennis, Nigel (1989), ‘Lessons in hubbing’, Airline Business, March.Douglas (1989), World Economic and Traffic Outlook 1989–2010 (Long Beach, Calif.:
Douglas Aircraft Company).Eads, George G. (1975), ‘Competition in the domestic trunk airline industry: too much or
too little’, in Promoting Competition in Regulated Markets, ed. Almarin Phillips(Washington, DC: The Brookings Institution).
ECAC(1981), Report on Intra—European Scheduled Air Fares, ECAC Doc. No. 23(Paris: European Civil Aviation Conference).
ECAC (1982), Report on Competition in Intra—European Air Services, ECAC Doc. No.15 (Paris: European Civil Aviation Conference).
Gallacher, J. (1988), ‘Ticketing Europe’, Airline Business, January.Garcia-Fuertes, Juan A. (1980), A Proposed Air Freight Forecasting Methodology (Los
Angeles: Flying Tiger Line).Gillen, D.W., Tae Hoon Oum, Tretheway, M.W. (1985), Airline Costs and Performance:
Implications for Public Industry Policies (Vancouver: Centre for Transport Studies,University of British Columbia).
HMSO (1946), Final Act of the Civil Aviation Conference and Agreement between theGovernment of the United Kingdom and the Government of the USA Relating to AirServices between their Respective Territories, Cmnd 6747 (London).
HMSO (1956), Multilateral Agreement on Commercial Rights of Non-Scheduled AirServices in Europe, Cmnd 1099 (London).
HMSO (1969), British Air Transport in the Seventies, Report of the Committee of Inquiryinto Civil Air Transport (London).
FLYING OFF COURSE 329

HMSO (1971), Agreement between the Government of the United Kingdom and theGovernment of the Republic of Singapore (see Article 9), Treaty Series No. 20,Cmnd 44619 (London).
HMSO (1977), Agreement between the Government of the United Kingdom and theGovernment of the United States of America concerning Air Services. Treaty SeriesNo. 76, Cmnd 7016 (London).
HMSO (1988), Airline Competition: Computer Reservation Systems. Third Report, Houseof Commons Transport Committee. Session 1987–88 (London).
Horn, K.William (1982), ‘The frequency of air travel’, in Airline Economics, ed. GeorgeW.James (Lexington, Mass: Lexington Books), pp. 23–4.
Hogan, Paul (1989), ‘Why the Euro-majors should follow TNT’s example’, AvmarkAviation Economist (London), December.
IATA (1974), Agreeing Fares and Rates: A Survey of the Methods and Procedures Usedby the Member Airlines of the International Air Transport Association (Geneva:International Air Transport Association).
IATA (1984), Airline Economic Results and Prospects 1982–1986 (Geneva: InternationalAir Transport Association).
IATA (1985), Deregulation Watch. Second Report, June 1985 (Geneva: International AirTransport Association).
IATA (1986), World Air Transport Statistics No. 31 and 32 (Geneva: International AirTransport Association).
IATA (1988), Airline Economic Results and Prospects 1986–1989, Report by the IATACost Committee (Geneva: International Air Transport Association).
IATA (1989), World Air Transport Statistics No. 33 (Geneva: International Air TransportAssociation).
ICAO (1974), The Economic Situation of Air Transport 1963–73 (Montreal: InternationalCivil Aviation Organization).
ICAO (1978), Standard Bilateral Tariff Clause, Doc. 9228-C/1036 (Montreal:International Civil Aviation Organization).
ICAO (1980), Convention on International Civil Aviation. Sixth Edition, Doc. 7300/6(Montreal: International Civil Aviation Organization).
ICAO (1983), A Review of the Economic Situation of Air Transport 1972–1982, Circular177-AT/67 (Montreal: International Civil Aviation Organization).
ICAO (1988a), Digest of Statistics, No. 363, Financial Data, 1988. Series F, No. 42(Montreal: International Civil Aviation Organization).
ICAO (1988b), Survey of International Air Transport Fares and Rates, September 1987,Circular 208-AT/82 (Montreal: International Civil Aviation Organization).
ICAO (1989a), Regional Differences in Fares, Rates and Costs for International AirTransport 1987, Circular 220-AT/88 (Montreal: International Civil AviationOrganization).
ICAO (1989b), Digest of Statistics. Traffic 1984–88. Series T (Montreal: InternationalCivil Aviation Organization).
ICAO (1990), The Economic Situation of Air Transport. Review and Outlook. 1978 to2000, Circular 222-AT/90 (Montreal: International Civil Aviation Organization).
IPS (1988), MQ6 Overseas Travel and Tourism: Quarterly Statistics, Business Monitor(London: Business Statistics Office, HMSO).
330 BIBLIOGRAPHY
Ippolito, Richard A. (1981), ‘Estimating airline demand with quality of service variables’,Journal of Transport Economics and Policy (London), vol. XV, no. 1, January,pp. 7–15.
Jennings, M. (1990), ‘Federal Express. Delivering the goods’, Airline Business, July.Kanafani, A., Sadoulet, E. and Sullivan, E.C. (1974), Demand Analysis for North Atlantic
Air Travel (Berkeley: Institute of Transportation and Traffic Engineering, Universityof California).
Lang, J.T. (1989), ‘Emerging rules’, Airline Business, September.Lansing, John B. and Blood, Dweight M. (1984), The Changing Travel Market (Ann
Arbor, Mich.: Survey Research Center, University of Michigan).Lill (1889), ‘Die Grundgesetze des Personenverkehrs’, Zeitschrift für Eisenbahnen und
Dampfschiffsfahrt der Österreichischungarischen Monarchie (Vienna), no. 35–6.Lyle, C. (1988), ‘Computer-age vulnerability in the international airline industry’,
Journal of Air Law and Commerce (Dallas: Southern Methodist University), vol. 54,Issue 1.
McGowan, F. and Trengrove, C. (1986), European Aviation. A Common Market?(London: Institute of Fiscal Studies).
McGowan, F. and Seabright, P. (1989), ‘Deregulating European airlines’, EconomicPolicy, 9 October.
Martin, Peter et al. (1984), Shawcross and Beaumont Air Law, 4th edn, vol. 2, Section A,pp. 411–17, Standard Bilateral Agreement (London: Butterworth).
Nammack, John (1984), ‘Labour vs management’, Airline Executive, February, pp. 21.5.Nguyen Dai Hai (1982), ‘The Box and Jenkins approach: A recent short-term forecasting
technique applied to air transport’, ITA Bulletin (Paris: Institut du Transport Aerien),September.
Nuutinen, H. (1990), ‘Asian perspectives on post-1992 Europe’, Avmark AviationEconomist, February/March.
PCL (1989), ‘Air, transport and the southern regions of the Community. Vol. IV. RouteForecasts’, Transport Studies Group, Polytechnic of Central London (Brussels:European Commission).
Pearson, Roy J. (1976), ‘Airline managerial efficiency’, Aeronautical Journal,November.
Pearson, Roy J. (1977), ‘Establishing a methodology for measuring airline efficiency’,PhD thesis (unpublished), Polytechnic of Central London.
Presidential Documents (1978), Weekly Compilation of Presidential Documents(Washington, DC), vol. 14, no. 34, 2 August.
Pryke, Richard (1987), Competition among International Airlines, Thames Essay No. 45(Aldershot: Gower).
Raben, Hans (1980), ‘The real test: Does a liberal bilateral work?’ ITA Bulletin (Paris:Institut du Transport Aerien), no. 18, 12 May.
Reid, Samuel, R. and Mohrfeld, James W. (1973), ‘Airline size, profitability, mergers andregulation’, Journal of Air Law and Commerce, vol. 39.
Richmond, S.B. (1971), Regulation and Competition in Air Transport (New York:Columbia University Press).
Shaw, Stephen (1985), Airline Marketing and Management (London: Pitman).Shell (1990), Shell A Aviation Service Handbook. Part 2 Prices Guide (London: Shell
International Trading Co.).Simpson, C.J. (1990), ‘Computer reservations. The big three’, Airline Business, July.
FLYING OFF COURSE 331

Sletmo, Gunnar K. (1982), Demand for Air Cargo. An Econometric Approach (Bergen:Institute for Shipping Research. Norwegian School of Economics and BusinessAdministration).
Smith, A.B. and Toms, J.N. (1978), Factors Affecting Demand for International Travel toand from Australia (Canberra: Bureau of Transport Economics).
Straszheim, Mahlon, R. (1969), The International Airline Industry (Washington, DC: TheBrookings Institution).
Straszheim, M.R. (1978), ‘Airline demand functions in the North Atlantic and theirpricing implications’, Journal of Transport Economics and Policy, vol. 12, no. 2,pp. 179–95.
Taneja, Nawal K. (1978), Airline Traffic Forecasting (Lexington, Mass.: LexingtonBooks).
Taneja, Nawal K. (1988), The International Airline Industry (Lexington, Mass.:Lexington Books).
Taplin, Jon H.E. (1980), ‘Price elasticities in the vacation travel market’, Journal ofTransport Economics and Policy, vol. XIV, no. 1, pp. 19–36.
US Government (1973), Air Charter Services: Agreements between the USA and theFederal Republic of Germany. Treaties and Other International Acts Series 7605 and7804. (Washington, DC: US Government Printing Office).
Veldhuis, X. (1988), Forecasting Process at Amsterdam Airport Schiphol, IATAWorldwide Forecasting Conference 1988–1992 (Geneva).
Wassenbergh, H.A. (1978), ‘Innovation in international air transport regulation (the US—Netherlands agreement of 10 March 1978)’, Air Law, vol. III, no. 3.
Wheatcroft, Stephen (1956), The Economics of European Air Transport (Manchester:Manchester University Press).
Wheatcroft, Stephen (1964), Air Transport Policy (London: Michael Joseph).Wheatcroft, Stephen (1982), ‘The changing economics of international air transport’,
Tourism Management, June, pp. 71–82.Wheatcroft, Stephen and Lipman, Geoffrey (1986), Air Transport in a Competitive
European Market (London: Economist Intelligence Unit).Wheatcroft, Stephen and Lipman, Geoffrey (1990), European Liberalisation and World Air
Transport (London: Economist Intelligence Unit).Whitaker, R. (1988), ‘CRS—bound by politics’, Airline Business, August.White, L.J. (1979), ‘Economies of Scale and the Question of Natural Monopoly in the
Airline Industry’, Journal of Air Law and Commerce. Vol. 44.
332 BIBLIOGRAPHY

Index
Note: Numbers in bold type refer to sections and italics refer to Figures (diagrams)advance booking charters (ABC) 49–50,
176advance purchase fares (A PEX, etc) Table
7.1, 11.1, 293, Table 11.2, 299–301 303–5
advertising 166–7, 184, Table 6.8, 203,208, 216, 230
Aer Lingus 104Aero Lloyd 100Aeroflot 283Aerolift (Philippines) 64Aeromexico Table 6.6Air Algerie 166, 248–9Air Canada Table 6.1–2, 6.1–2, Table 6.7,
Table 6.9, Table 7.5, Table 8.1, Table 8.3, 277, Table 11.5, 343–4
Air Charter International 15, Table 1.5, 4.2Air Europe Table 1.5, 81, 100–1, 106, 176,
182, Table 7.3–5, 195Air France 15, 23, 45, 76, 86, 99, 4.2, 106,
108, Table 6.1, 6.1, Table 6.6–7, Table 6.9, 178, Table 7.2, Table 8.1, Table 8.3,203, 268, Table 10.3–4, Tables 11.5–6,317, 330, 332, 335, 343–4
Air India Table 6.1–2, 134, 6.1–2, 158,Tables 6.6–7, Table 6.9, Table 8.1, Table8.3
Air Inter 15, 4.2, 99, 105Air Littoral 105Air Nuigini 31Air Portugal 196, 212, 311, Table 11.6Air Tanzania 161Air UK 81, 104, 106, Table 7.5Air 2000 Table 7.5, 195
aircraftchoice 120–1, 152–3, 215economies of size 139, 143, 6.4.1, 6.3,157–8, 6.8prices 5productivity 1.1, 1.2, 120, 6.4.2, 6.4.3,156size development 1.1, 1.2, 177utilisation 181–2, Table 7.3
Airline Deregulation Act (US) 52airport charges 53, Tables 5.1–3, 110–12, 5.
2, 122, 126, 129, 6.2.3, Table 6.4, 155–6, 181, 288
Airtours 196Alitalia Table 6.1–2, 6.1–2, Table 6.7,
Table 7.2, 143, Table 8.1, Table 8.3, 268,Table 10.3, Table 10.5, 277, Tables 11.5–6
All Nippon Airways 64, 66, 69, 4.1, 166,Table 6.8, 277, 283
American Airlines 52, 58, 62, 66–7, 72,74, 132, Table 6.1, 6.1, Table 6.7, Table6.9, 167, Table 8.1, Table 8.3, 264, 267,275, Table 10.5, Table 11.5
American Transair Table 1.5anti-trust legislation 29, 62Ansett 64Asiana 64Association of European Airlines (AEA)
227, 249, Table 12.4Austrian Airlines 4.2, 267, Table 10.3Australian Airlines 64
Balair 15, Table 1.5, Table 6.6
333

Bermuda Agreements 29–30, 51, 3.6bilateral air services agreements 24, 26–7
charter regulations 49cargo rights 319effect on airlines 30, 34, 2.8, 3.10, 130,269new concepts in 3.5, 3.6, 3.7, 3.9, 4.2structure 2.3US objectives 53–5
Biman Bangladesh Airlines 283Birmingham Executive Airways 99Braniff 7, 19, 66–9, Table 3.1, 77–8, 105branding 165, 278–9break of gauge 55–6, 60, 73Britannia Airways 15, Table 1.5, 101–2,
178, Tables 7.2–5, 194British Airport Authority
forecasts 221–2, Table 8.5, 249–50British Airtours 15, Table 1.5, 196British Airways 51, 81, 86, 91, 99, 104,
106, 108, Tables 7.2–5, 203, Table 8.3cargo 252, 317–19, 330, Table 12.3,334costs Table 6.1, Table 6.7, Table 6.9,Table 7.4, 181, 188–9, 200, Table 8.1CRS 274, Table 10.5, 277financial policy 169–70hubbing 264, 268, Table 10.3losses 344pool agreements 31, 35, 45pricing 293–4, Table 11.2, 306, Tables11.5–6product features 186, 270–2, 279, Table10.4staff 132, Table 6.2, 6.1–2, 183, 344
British European Airways 15British Caledonian 81, 97, 99–100, 106British Cargo Airlines 319British Midland 81, 102, 104, 106, 139–40,
156, Tables 7.4–5, Table 8.1Brymon 81, 98
CAAC 66cabin crew
costs 116, Table 5.1, 123, Table 5.3, 5.2, 126, 147, 289numbers 163–4, 183
cabotage 91–2, 346Caledonian Table 7.5Canadian Pacific/lnternational 66, 4.1Capitol Air 66cargo see freightCargolux 23, 319–20Cathay Pacific 8, 31, 33, 41, 43, 66, 129,
Table 6.1, 6.1, 158, 163, Tables 6.7–8,165, 169, Table 8.1, Table 8.3, Table 10.4, 317, 319, 325, 334
Channel Express 320charter
airlines 7.2, Table 1.5by scheduled airlines 15, Table 1.4, 49–50, 177, 7.6demand 3.10.4, 205, 211, 219, Table 8.2deregulation 52, 55–6, 58–61, 76, 4.4.2, 102economics 155, 163, Ch. 7, Table 6.6financial advantages 7.5growth 1.4, 43, 47, 177, 3.10.4impact 39, 47, 53into scheduled 4.4.2peaks 181–2, Table 7.6, 191, 211–12prices 174, Table 7.1, 285, 298profitability 179–80, Table 7.2regulalion 1.4, 2.7, 3.2, 7.1, 7.6
Chicago Conference 26–7, 29, 52Chicago Convention 25, 27, 41, 142, 174–5China Airlines 66Civil Acronautics Act (US) 46Civil Aeronautics Board
capacity control 50–1charter authorisation 12, 15, 50domestic regulation 51–2tariffs 301Show Cause Order 3.8
Civil Aviation Authority (UK) 19, 41, 52,110, 113, 130, 189–91, 198, 221–2, 249,263, 285
combi aircraft 318, 12.5.3combination rights 55Computer Reservation System (CRS) 72,
85, 265, 274–8code of conduct 94, 274
Conair Table 1.5, 195
334 FLYING OFF COURSE

Condor 15, Table l.5, Table 7.2, Table 7.6,197
contestability 76Continental Table 3.1, 4.1, 109costs
charters 7.3direct operating 109–15, 120–1, Tables5.1–3, 5.2, 5.4, 125, 153, 7.3.1escapability 5.4hubbing 266impact on fares/pricing 9, 123, 288, 11.4indirect operating 109–10, 5.2.3,Tables 5.1–3, 5.1, 7.3.2., 120–1, 5.4,127, 153, 7.3.2management influcnce on Ch. 6multivariate analysis of 130–1non-operating 5.2.1peak 8.6regulatory aspects 48trends 1.2, 1.1, 5.3, Table 5.2, 5.1unit costs 1.1, Table 8.1variable 5.4, 5.2, 5.5
country of origin rules 56, 59, 76, 297cross-subsidies 42, 48, 77, 96, 265, 285Crossair 102
Dan Air Table 1.5, 81, 101, 106, Table 6.6,178, Tables 7.4–5, 185
Danair 4.1Delta Table 3.1, 66–7, 72, 98, 275, Table
10.5, 277demand
elasticities 8.8, 287, 337factors influencing 8.1, 8.2, 8.4, 8.7impact on costs 129, 6.3, 8.6
demand (cont.)matching with supply 128, 196, 218,259, 280, 282, 296peaks 143, 8.6trends 9–11, 343–4
Department of Transportation (US) 53,110, 113, 262, 267, 273–4
depreciation 112–15, Tables 5.1–3, 5.2,119–20, 147, 151, 155, 6.7.1–2, 181–2
deregulationAsia/Pacific 60–1, 64–5, 3.10
Europe Ch. 4impact of 3.10, 81, 4.4new concepts 3.5North Atlantic 3.6, 58–9, 63, 65, 3.10pressures 47–8, 3.2, 3.3, 3.4theory and practice 3.11US domestic 51–3
DHL 321–2directed demand 11.1, 293–4double disapproval 56, 60, 76, 80, Table 4.
1, 83, 89, 297
Eastern Airlines 23, 209–10, 344economies of scale 4.4.1, 160–1EFTA 4.3.4El Al 23electronic data interchange (EDI) 341Emirates 35Emery Worldwide 321, 339engine
developments 1.1performance 6.4.4
en-route charges 54, 110–11, Tables 5.1–3,5.2, 6.2.3, Table 6.5, 288
European Civil Aviation Conference 62–3,79, 4.3.4, 274
European Community Commission 52, 79,4.3.6, 100, 254, 274, 285
air transport policy 4.3.1competition rules 4.3.2, 344external competence 4.3.4liberalisation 4.3.3, 302pooling 34, 103
European Court of Justice 79, 85, 87, 99Ahmed Saeed case 90Nouvelles Frontières case 83Pulp Paper case 90
fare dilution 312–5Federal Aviation Administration 141Federal Express 320–1fifth freedom 27–9, 34–5, 55, 57–8, 61, 63,
73, 83, Table 4.2, 89, 91, 102–3, 217,298, 312
financial policy 5.7financing aircraft 5–7, 18, 6.7.3, 195
INDEX 335

Finnair Table 1.5, 4.1, 139–40, 156, 187,Table 7.5
flight crew Tables 5.1–3, 109–10, 112, 5.2,122, 126–7, 145, 147, 151, 155, 161, 216
Flying Tigers 22, 62, 252, 317, 321forecasting 208–9, Ch. 9freight
all cargo services 317–18, 327, 12.5.2charters 52, 319–20costing 330–3, 12.5demand 215, 12.3, 326–7express parcels 12.2, 323, 339forecasting 232–3, 245, 9.4.2, 12.7market share 1.7, Table 1.6marketing 12.2, 326–8pricing 324, 327, 12.5, 12.6regulation 54–5, 57, 319, 321, 329–30,336revenue pools 33trends 12.1, 12.7yields 12.6.3, Table 12.4
freight all-kinds (FAK) 337–8frequent flyer schemes 273fuel costs 18–20, 110, 118–19, Tables 5.1–
3, 5.1–2, 122, 129, 131, 6.2.2, 180, 6.6,153–5, 319
Garuda 66, Table 6.8, 284Guinness Peak Aviation (GPA) 7, 172
Hamburg Airlines 102Hapag-Lloyd Table 1.5, Table 6.6, 185,
Table 7.5Heavylift Cargo Airline 320Hispania 179hubbing 73, 3.1, 10.3, 320
Iberia Table 6.6, 186, Table 7.5, Table 8.1,Table 10.3, 344
inclusive tour 205–6, 209, 219, 222, 224,292, Table 11.2, 298, 300
inclusive tour charters (ITC) 12–14, 49,176–8, 192–3, 198, 205
income elasticity 220–3, Table 8.5insurance 112, Tables 5.1–3, 147, 155,
180, 289interest charges 108–9, 170–1
International Air Transport Association(IATA)
airport charges 140–1anti-competitive 3.8, 90cargo 327, 331–2, 334, Table 12.4,336, 338
IATA (cont.)charter rules 42conditions of service 37, 39–40, 162,166, 296forecast 234losses of member airlines 19, 180mileage rule 297, 313, Table 11.7regulations 15, 2.6, 2.8, 301rule changes 40–1tariff (controls) 24, 27, 29, 33, 35–40,43–5, 47, 49, 3.8, 65, 300, 343
International Civil Aviation Organisation(ICAO)
airport charges 141cost classification 107–10, Table 5.1,115fare studies 300–1, 11.8forecasts 251–2, 341functions 27revenues 1.3, Table 1.6standards 25–7traffic trends Table 1.2–3, Table 1.6,Table 12.1
International Lease Finance Corporation 7integrated carriers 12.2, 322, 339, 341Iran Air Table 6.6
Japan Air Lines 31, 33, 51, 64, 66, 73, 129,133–4, Tables 6.1–2, 134, 6.1–2, 158–9,Tables 6.7–9, 166, Table 8.1, Table 8.3,Table 10.4, Table 11.5, 317, 322, 325
Japan Air Systems 64JAT 283just-in-time (JIT) 324
Kenya Airways 161KLM 15, 35, 81, 86, 96, 104, 127, Tables 6.
1–2, 6.1–2, 134, 140, Table 6.6–7, Table6.9, Table 7.1, Table 7.5, Table 8.1,Table 8.3, 267, Table 10.3, 274, Table10.5, 277, 318, 322, 333, 335, 343–4
336 FLYING OFF COURSE

Korean Airlines 23, 35–6, 39, 66, Table 6.6, Table 6.8, 166, 283, 317, 325
Kuwait Airways Table 8.1
labourcosts 129, 155, 158–9numbers 163, 344–5wage levels 6.2.1
Laker Airways 7, 14, 19, 58–9, 66, 68–9,71, 77–8, 195, 199
late purchase fares 11.1, Table 11.2, 293,299
leasing 7, 112, 170, 172Linjeflug 4.1long-run marginal costs 283load factors 5, 1.2, 47, 3.10.3, 78, 82, 214–
16, 282, 295, 311, 315, 333London City Airways 81LOT (Polish airlines) 23LTU 177, Table 7.2Lufthansa 15, 23, 72, 4.2, 129, Table 6.1–
2, 6.1–2, Table 6.7, Table 6.9, Table 7.2,Table 7.5, 186, Table 8.3, Table 10.3,270, Tables 11.5–6, 317–18, 322, 330,333–4
mail 1.7maintenance costs 113, Tables 5.1–2, 116,
119–20, 126–7, 158, 173, 181, 218, 230,289
Malaysian Airlines (MAS) 8, 31, 41, 43,66, Table 6.2, 158–9, Table 6.6, 163,Table 6.8, 172, Table 10.4, 273, 283
managerial efficiency 130, 160, 6.8marginal cost pricing 282–4, 291–3, 298marketing policy 1.6, 130, 6.6, 224, 8.2,
259, 269, 312Martinair 15, Table 1.5, Table 6.6, 177,
Table 7.2Monarch Airlines Table 1.5, 178, 181,
Tables 7.2–2, 188–9Middle East Airways (MEA) 4.2Mexicana Table 8.1multiple designation 55–60, Table 4.1, 81,
83, 89, Table 4.2
National 64, Table 3.1
Netherlines 81Nigerian Airways 33NLM 81non-scheduled see charterNorthwest Orient 9, Table 3.1, 66, 72–3, 3.
1, 75, 77, 134, Tables 5.1–2, 5.1–2,Table 6.7, Table 6.9, 167, Table 8.1,Table 8.3, Table 10.5, 277, Table 11.5,343
Novair Table 7.4–5Nurnberger Flugdienst 105
Olympic Airways 34, 36, 76, 83, 92, 142,Table 6.6, 186, Table 10.3, 311, Table11.6
Orient Airlines Association 284Orion Airways Table 1.5, 101, Table 6.6,
195
Pakistan Airlines (PIA) 134, 6.1–2Pan American 15, 51, 53, 62, 66–7, 69, 77,
Table 3.1, Tables 6.1–2, 6.1–2, 134,Table 6.7, Table 6.9, Table 7.5, Table 8.1, 200, Table 8.3, 273, 343–4
Paris Convention (1919) 26part-charters 49–50, 197–9, 284, 11.1, 292–
3passenger
market share 1.7motivation 8.3, 8.5service costs 116, Tables 5.1–2, 5.2,122, 165, Table 6.7, 183, Table 11.1
payload range 148–51, 6.3, 6.4, 153peak pricing 281People Express 66, 68, 71–2, 77–8, 105,
199, 284, 295Philippine Airlines 31, 33–4, 66, 78, 137,
Table 6.6, Table 6.8, 163, 165–6, 172,284
pooling agreements 29–30, 36, 2.4, 2.8, 65,84, 87–8, 90, 103
price elasticity 222–7, Table 8.6, 247–9,287, 291
pricingcost related 285–7, 11.4, 309–10discounts 37–40, 65, 3.10.2, 77–8, 104,284, 312–13, 11.6.2
INDEX 337

‘fences’ 293, 11.6.3, 302instability 11.2, 287levels 11.8limitations 44–5market related 287–8, 293, 338–9monopolistic 45, 90, 286policies 224–7, 229, 260, 11.1, 11.3, 11.5promotional 11.6.3structures 11.6zones (of reasonableness) 62–3, 65, 67,76, 82, 87–9, Table 4.2, 11.6.4
productdifferentiation 47–8homogeneity 21–2planning 6.6.1, 203, 8.5, Ch. 10, 11.5
profitability 1.5, 23, 179, Table 7.2, Table8.1
pro-rating 306, 313–14, Table 11.7
Qantas 31, 51, 64, Table 6.1–2, 6.1, 6.2,158–9, 161, Tables 6.7–9, 167, Table 8.1, Table 8.3, 344
range, see stage lengthrevenues, see yieldsRoyal Brunei 41Royal Jordanian 346royalty payments 2.5Ryanair 102–4
Sabena 86, 264, Table 10.3, 274, 344sales/promotion 6.6.2 see ticketingSAS 15, 31, 96–8, 4.1, Table 7.5, 200,
Table 8.1, 261, Table 10.3, 270, 295,Table 11.6, 343
Saudia 320Scanair 15, Table 1.5, 4.1, 195scope (benefits of) 96, 4.4.1seating density Table 6.6, 162–3, 7.3.3,
289–91, Table 11.1short-run marginal costs 282–3Singapore Airlines
costs 134, Tables 6.1–2, 114, 6.1, 6.2,140, 158–9, Table 8.1financial policy 109, 168–71freight 317, 325
marketing 39, 41, 98, Tables 6.7–9,163, 165–7, 217, Table 10.4, 278performance 19, Table 8.3profit Table 8.1royalty payments 34–5traffic rights 43, 64, 66yields 310–11, Table 11.5
sixth freedom 34–5, 51, 59, 217, 283, 291,313, 346
Spanair 4.1specific commodity rates Table 12.2, 336–
7stage length/distance 6.4.3, 6.4, 6.5, 6.5.1,
159standard foreign fare level (SFFL) 301station costs 115–16, Tables 5.1–3, 5.2,
155, 183, 289Sterling Airways Table 1.5, 195subsidies 76, 108, 284, 295Sudavia 105supplementals, see chartersupplemental airlines (US) 11–12, 15, 17,
100–1, 199Swissair 15, 4.1, 98, 132, Tables 6.1–2,
134, 6.1, 6.2, Tables 6.6–7, Table 6.9,170, Table 7.2, Table 8.1, 200, Table 8.3,267, Tables 10.3–5, 277, 295, Tables 11.5–6
tariff fences 227, 293, 298–300, 302Texas International 52Thai International 31, 36, 39, 66, 73, 4.1,
Tables 6.1–2, 6.1, 6.2, 159, 163, Table 6.7–9, 166, Table 8.1, Table 8.3, Tables10.4–5, 273, 277, 283
ticketing and sales 116–17, Tables 5.1–3, 5.2, 120, 127, 6.5.3, 6.2.2, 183–4, Table 7.4, 10.5
traffic trends 1.3Transamerica 66Transavia 15, Table 1.5, 81, 106, Table 7.5TNT 321–2Transmeridean 319TWA 51, 53, 62, 66, 72, 77, 109, Tables 6.
1–2, 6.1, 6.2, 134, Table 6.7, Table 6.9,178, Table 7.5, Table 8.1, Table 8.3,Table 10.5, 277, 318, 344
338 FLYING OFF COURSE

unit load devices (ULD) 326, 337–8United Airlines 67, 69, 73–4, 77, Tables 6.
1–2, 6.1, 6.2, Tables 6.6–7, Table 6.9,167, Table 8.1, Table 8.3, 275, Table 10.5
United Parcel Services (UPS) 321, 339US Air 72, 201, Table 10.5, 277, 344UTA 86, 4.2, 99, 105
Varig Table 6.6, 200, Table 8.1Virgin Atlantic 66, 68, 71, 78, Table 7.5,
199, Table 10.4, 271, 295
Wardair 71, Table 1.5, Table 8.1, 200Western Air Lines 68Wideroe 4.1World Airways 66, 68, 72, 100, Table 6.6,
Table 7.5
yields 9–11, 1.3, 23, Table 1.6, 3.9.2, 4.4.5, Table 8.1, Table 11.4, 309, 11.9
yield management 288, 293, 11.7, 312, 315
Zambia Airways 161, Table 6.6
INDEX 339
![From Rigas Velestinlis to Ivo Andric - balcanica.rs 29/12 Miodrag... · UDe [886.1:877.4].091 Original Scholarly Work Miodrag STOJANOVIC Faculty of Philology Belgrade FROM RIGAS VELESTINLIS](https://img.dokumen.tips/doc/110x75/5e0744c55abc2330021f83d0/from-rigas-velestinlis-to-ivo-andric-2912-miodrag-ude-88618774091.jpg)