Embed Size (px)
Citation preview

September 20, 2010
Morgan Stanley does and seeks to do business with companies covered in Morgan Stanley Research. As a result, investors should be aware that the firm may have a conflict of interest that could affect the objectivity of Morgan Stanley Research. Investors should consider Morgan Stanley Research as only a single factor in making their investment decision.
For analyst certification and other important disclosures, refer to the Disclosure Section, located at the end of this report.
* = This Research Report has been partially prepared by analysts employed by non-U.S. affiliates of the member. Please see page 2 for the name of each non-U.S. affiliate contributing to this Research Report and the names of the analysts employed by each contributing affiliate.
+= Analysts employed by non-U.S. affiliates are not registered with FINRA, may not be associated persons of the member and may not be subject to NASD/NYSE restrictions on communications with a subject company, public appearances and trading securities held by a research analyst account.
M O R G A N S T A N L E Y B L U E P A P E R
The China Files US Corporates and China’s Megatransition
China is still the next big thing. China is poised for a “megatransition” between now and 2020—from leading producer of globally distributed goods to the world’s largest market for consumer and industrial products. For multinationals and investors seeking exposure, size is only part of the story. Competitive landscapes in specific industries are becoming more complex, reflecting the powerful secular trends (which we call the “megatrends”) driving the megatransition: demographics, urbanization, infrastructure, social security network, consumer financing, and education.
We identify 16 US companies best positioned for the opportunities we see in China. A team of 33 contributors—our China strategy team along with industry analysts from the US and China for 16 industries— systematically reviewed the landscape of each industry, evaluating companies’ current position, growth strategy, and competitive headwinds. Their top picks are Nike, Wynn Resorts, Yum! Brands, Procter & Gamble, Pfizer, Medtronic, Yahoo!, Apple, Marvell, Dow Chemical, Mosaic, General Dynamics, Emerson Electric, Caterpillar, FedEx, and Diana Shipping.
Winning strategies of multinationals in China should feature two elements, we think: 1) a shift to franchise-building (establishing brands and distribution/service networks) over revenue generation (maximizing short-term sales); and 2) a preference for integration (making China a second home market) over localization (treating China like another foreign market).
M O R G A N S T A N L E Y R E S E A R C H G L O B A L
China Strategy
Jerry Lou [email protected] +852 2848-6511 Morgan Stanley Asia Limited+
Allen Gui [email protected] +86 21 2326-0036 Morgan Stanley Asia Limited+
US & China Research Teams See page 2 for the authors of this report*

M O R G A N S T A N L E Y R E S E A R C H
2
September 20, 2010The China Files
China Team
Charlie Chan1 Technology +852 2848-5636 [email protected]
Grace Chen2 Technology +886 2 2730-2890 [email protected]
Jeremy Chen2 Autos, Building & Construction, Chemicals, Consumer, Fertilizer, Mid Cap +886 2 2730-2876 [email protected]
Praveen Choudhary1 Gaming, Multi-Industry +852 2848-5068 [email protected]
Allen Gui1 Strategist +86 21 2326-0036 [email protected]
Lin He1 Leisure & Lodging, Mid Cap +86 21 2326-0016 [email protected]
Richard Ji1 Internet Services, Media +852 2848-6926 [email protected]
Bin Li1 Healthcare +852 2239-7596 [email protected]
Jerry Lou1 Strategist +852 2848-6511 [email protected]
Bill Lu1 Technology +852 2848-5214 [email protected]
Jasmine Lu1 Technology +852 2239-1348 [email protected]
Angela Moh1 Consumer +852 2848-5405 [email protected]
Wee-Kiat Tan1 Coal, Oil & Gas +852 2848-7488 [email protected]
Helen Wen1 Capital Goods, Utilities +852 2848-5438 [email protected]
Edward Xu1 Transportation +852 2239-1521 [email protected]
Kate Zhu1 Automobiles, Building & Construction, Capital Goods +852 2848-6843 [email protected]
US Team
Vincent Andrews3 Food, Agricultural Chemicals +1 (212) 761 3293 [email protected]
Scott Davis3 Electrical Equipment & Industrial Conglomerates +1 (212) 761 7670 [email protected]
Sanjay Devgan3 Semiconductors +1 (415) 576 2382 [email protected]
Scott Devitt3 Internet & Consumer Software +1 (212) 761 3365 [email protected]
John Glass3 Restaurants +1 (617) 856 8752 [email protected]
William Greene3 Freight Transportation +1 (212) 761 8017 [email protected]
Katy Huberty3 Systems and PC Hardware +1 (212) 761 6249 [email protected]
Chi H. Lee3 Apparel and Footwear +1 (415) 576 8738 [email protected]
David R. Lewis3 Medical Technology +1 (415) 576 2324 [email protected]
Paul Mann3 US Chemicals +1 (212) 761 3865 [email protected]
Mary Meeker3 Internet & Consumer Software +1 (212) 761 8042 [email protected]
Dara Mohsenian3 Household & Personal Care +1 (212) 761 6575 [email protected]
David Risinger3 Large Cap & Specialty Pharmaceuticals +1 (212) 761 6494 [email protected]
Ole Slorer3 Commodity Shipping +1 (212) 761 6198 [email protected]
Mark Strawn3 Gaming & Lodging +1 (212) 761 4990 [email protected]
Robert Wertheimer3 Electrical Equipment & Industrial Conglomerates +1 (212) 761 6334 [email protected]
Heidi Wood3 Aerospace & Defense +1 (212) 761 4407 [email protected]
1Morgan Stanley Asia Limited+ 2Morgan Stanley Taiwan Limited+ 3Morgan Stanley & Co. Incorporated

M O R G A N S T A N L E Y R E S E A R C H
3
September 20, 2010The China Files
Table of Contents
The China Landscape .............................................................................................................................................................. 4
US Multinationals' Winning Strategies in China......................................................................................................................... 10
What’s Your China Plan? US Top Picks.................................................................................................................................... 13
Market Overviews / Top Picks
Apparel.................................................................................................................................... Angela Moh / Chi H. Lee 14
Casinos & Gaming .................................................................................................. Praveen Choudhary / Mark Strawn 16
Restaurants.................................................................................................................................... Lin He / John Glass 18
HPC ............................................................................................................................... Angela Moh / Dara Mohsenian 20
Pharmaceuticals......................................................................................................................... Bin Li / David Risinger 22
Medical Devices ......................................................................................................................... Bin Li / David R. Lewis 24
Internet............................................................................................................. Richard Ji / Mary Meeker /Scott Devitt 26
Tech Hardware................................................................................................. Jasmine Lu / Grace Chen / Katy Huberty 28
Semis ................................................................................................................ Bill Lu / Charlie Chan / Sanjay Devgan 31
Chemicals ............................................................................................................................ Wee-Kiat Tan / Paul Mann 33
Agrichemicals.............................................................................................................. Jeremy Chen / Vincent Andrews 35
Aerospace & Defense ................................................................................................................ Allen Gui / Heidi Wood 37
Industrials................................................................................................................ Kate Zhu / Helen Wen/ Scott Davis 39
Machinery .......................................................................................................................... Kate Zhu / Rob Wertheimer 41
Transportation .................................................................................................................. Edward Xu / William Greene 43
Shipping .................................................................................................................................... Edward Xu / Ole Slorer 45
Runners-Up.............................................................................................................................................................................. 47
Appendix: Morgan Stanley US China Exposure Basket .......................................................................................................... 52
Morgan Stanley is acting as financial advisor to Bristol-Myers Squibb in relation to the announced tender offer to acquire ZymoGenetics, Inc ("ZymoGenetics"), as announced on September 7, 2010. The proposed acquisition is subject to the successful tender offer for the shares of ZymoGenetics and other closing conditions. This report and the information provided herein is not intended to (i) provide advice with respect to whether to tender ZymoGenetics shares, (ii) serve as an endorsement of the proposed transaction, or (iii) result in the procurement or exchange of a security by a security holder. Bristol-Myers Squibb has agreed to pay fees to Morgan Stanley for its financial services, including transaction fees that are subject to the consummation of the proposed transaction. Please refer to the notes at the end of this report.
M O R G A N S T A N L E Y R E S E A R C H
4
September 20, 2010The China Files
The China Landscape: Megatrends and Megatransition
Megatrends: From producer to consumer economy. Several secular trends are forcing a “megatransition” in China as the country evolves from one of the world’s foremost producers of globally distributed goods into a leading consumer. The trends driving this growth, as we see it, are the seismic shifts in China’s demographics; the country’s continued urbanization; the ongoing development of a world-class infrastructure; the expansion of a comprehensive public security network; positive consumer financing developments; and the benefits of an educated workforce in an ever-improving industrial workplace.
Obstacles: Environmental concerns and finite resources. We foresee two primary impediments to China’s growth in the upcoming decade: The country’s fragile environment and the decreasing availability of resources. To sustain growth, it is essential that China address its environmental policies and reduce its current level of dependence on energy and certain commodities.
Megatransition. We believe that by 2020 China will triple its nominal GDP to account for 14% of the world economy, more than double its fixed asset investment and more than triple consumer spending. We also see exciting opportunities at the micro level: China’s “baby boomers” will predominate among consumers; urban populations will expand by 300 million people; wages will more than quadruple; and consumer credit will surge rapidly.
Megatrends
China is entering a new phase of economic growth, one where rebalancing and reform will stimulate domestic consumption, effect industrial improvements, and spark global interest in the possibilities of China’s economy, the second -largest in the world. Behind this optimistic view of China lie several specific drivers—what we call “megatrends.”
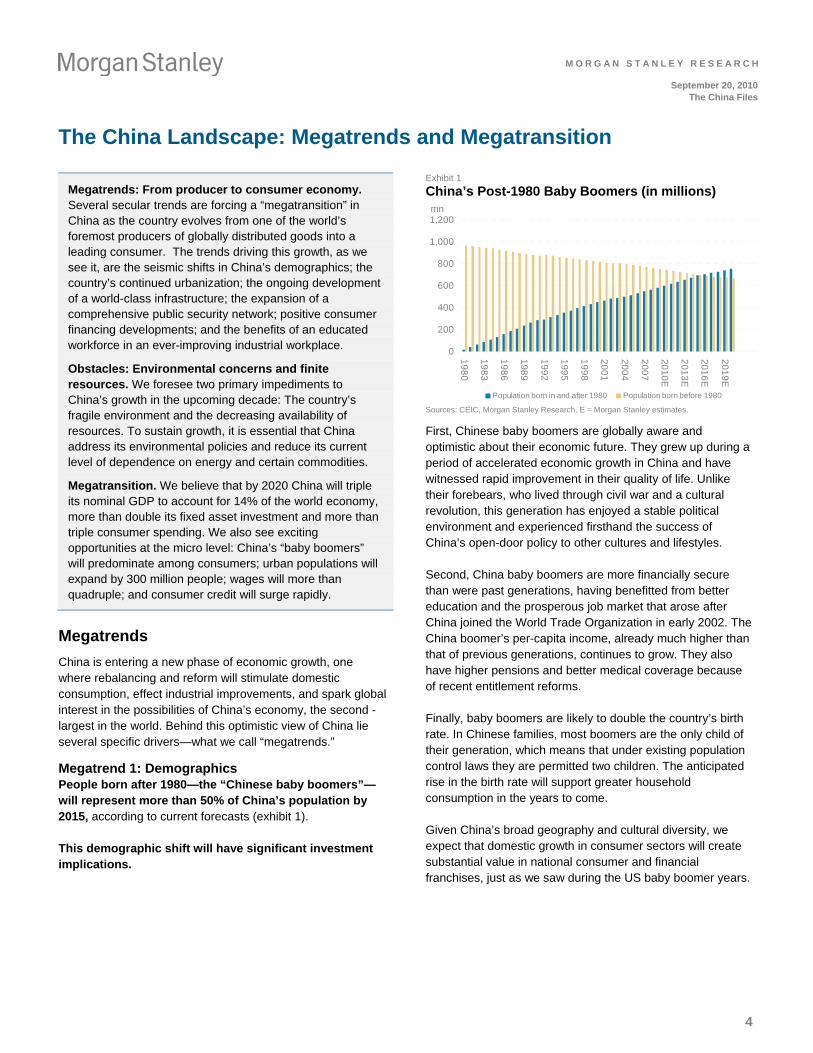
Megatrend 1: Demographics People born after 1980—the “Chinese baby boomers”—will represent more than 50% of China’s population by 2015, according to current forecasts (exhibit 1).
This demographic shift will have significant investment implications.
Exhibit 1
China’s Post-1980 Baby Boomers (in millions)
0
200
400
600
800
1,000
1,200
19
80
19
83
19
86
19
89
19
92
19
95
19
98
20
01
20
04
20
07
20
10
E
20
13
E
20
16
E
20
19
E
mn
Population born in and after 1980 Population born before 1980 Sources: CEIC, Morgan Stanley Research, E = Morgan Stanley estimates.
First, Chinese baby boomers are globally aware and optimistic about their economic future. They grew up during a period of accelerated economic growth in China and have witnessed rapid improvement in their quality of life. Unlike their forebears, who lived through civil war and a cultural revolution, this generation has enjoyed a stable political environment and experienced firsthand the success of China’s open-door policy to other cultures and lifestyles.
Second, China baby boomers are more financially secure than were past generations, having benefitted from better education and the prosperous job market that arose after China joined the World Trade Organization in early 2002. The China boomer’s per-capita income, already much higher than that of previous generations, continues to grow. They also have higher pensions and better medical coverage because of recent entitlement reforms.
Finally, baby boomers are likely to double the country’s birth rate. In Chinese families, most boomers are the only child of their generation, which means that under existing population control laws they are permitted two children. The anticipated rise in the birth rate will support greater household consumption in the years to come.
Given China’s broad geography and cultural diversity, we expect that domestic growth in consumer sectors will create substantial value in national consumer and financial franchises, just as we saw during the US baby boomer years.

M O R G A N S T A N L E Y R E S E A R C H
5
September 20, 2010The China Files
Another powerful demographic trend to consider is China’s aging population. As a result of China’s population control policies from the late 1970s, at some point between 2015 and 2020 the number of new retirees will outpace the number of new laborers (exhibit 2). This shift in China’s labor market will open up market opportunities for automation and machinery applications in manufacturing, transforming the industry’s current labor-intensive business model into a capital-intensive one.
Exhibit 2
China Dependent Ratio Evolution China Dependent Ratios - MS estimates
0%
35%
70%
105%
140%
19
50
19
60
19
70
19
80
19
90
20
00
20
10
20
20
20
30
20
40
20
50
Total dependent ratio (TDR) Elderly dependent ratio (EDR)
Child dependent ratio (CDR) Notes: CDR = number of children and youth (aged 0-19) as percentage of working population (aged 20-59); EDR = elderly population (aged 60+) as percentage of working population (aged 20-59); TDR = CDR+EDR. Sources: UN, Morgan Stanley Research.
The shift also will increase workers’ value—and bargaining power—in the labor market, which will directly push up labor’s share of GDP, as we have seen in Japan (exhibit 3). We forecast that China nominal GDP will triple by 2020 and that labor’s share of GDP will normalize to 22% (at current average developing country levels), which implies an increase in absolute wages (in renminbi terms) of more than four times (exhibits 4 and 5).
Exhibit 3
Japan: Labor’s Share of GDP versus Dependent Ratio
41%
43%
45%
47%
49%1
98
5
19
86
19
87
19
88
19
89
19
90
19
91
19
92
19
93
19
94
19
95
19
96
19
97
19
98
19
99
20
00
50%
52%
54%
56%
Total dependency ratio Labor cost as % of GDP (right) Note: Dependent ratio is plotted using UN data reported every five years Sources: UN, CEIC, Morgan Stanley Research.
Exhibit 4
China Labor as Percentage of GDP versus Other Countries
0% 10% 20% 30% 40% 50% 60% 70%
Denmark
Germany
Japan
Australia
Norway
Luxembourg
New Zealand
Mexico
Thailand
China
Sources: CEIC, OECD, Morgan Stanley Research.
Exhibit 5
China Wage Forecasts
0
2,500
5,000
7,500
10,000
12,500
15,000
17,500
20,000
2005 2007 2009 2011 2013 2015 2017 2019
billions Rmb
0%
5%
10%
15%
20%
25%
30%
35%Total wages Total labor cost as % of GDP (right)
Sources: CEIC, Morgan Stanley Research.
China’s aging population also will create investment opportunities in financial services such as life insurance and mutual funds, and in healthcare, medical devices, and the pharmaceutical industry.
Megatrend 2: Urbanization Our economist Qing Wang expects urbanization to remain China’s main growth driver over the next 10 years (exhibit 6). Wang also holds that the rapid urbanization of the previous decade will remain or even accelerate as we enter the next decade, lifting China’s urbanization ratio to the level of developed countries, from the current 47% to 63% in the long-term. In fact, as part of its initiative to support urbanization in midsize and small cities—particularly in the inland provinces—the Chinese government recently decided to speed up the reform of the household registration system. This reform seeks to equalize rural and urban citizens’ entitlements to pension, education, and other social benefits so that migrant workers from rural areas can more easily relocate to urban areas.

M O R G A N S T A N L E Y R E S E A R C H
6
September 20, 2010The China Files
Exhibit 6
China Rate of Urbanization
0
10
20
30
40
50
60
70
80
1949 1969 1989 2009 2029 2049 2069
US in 1840
US in 1960
Share of urban population (%)
China US in 1900
Artificially suppressed
Sources: CEIC, Morgan Stanley Research.
We also see signs that China is planning to enhance its public services network as the country’s urban areas expand (see Megatrend 4).
This powerful urbanization trend will positively affect both capital formation and personal consumption, leading to long-term opportunities in sectors like capital goods, building materials, property, utilities, and basic materials. Consumer franchises will likely benefit as well. Urbanization also is a strong engine for creating wealth, bringing new consumers to the marketplace. If, in the long run, urbanization reaches 63% of China’s 1.4 billion people, 300 million additional consumers will see their spending power increase substantially. The main beneficiaries of this trend will be the consumer staples and personal care sectors, along with household product companies that sell “black and white goods,” such as TVs, video players, refrigerators, and air conditioners.
Megatrend 3: Infrastructure China has made tremendous strides in developing its infrastructure, but there is room for more economic expansion and rebalancing. Specifically, the country needs to further develop its national high-speed rail and highway grids, ultra-high-voltage power transmission network, nuclear power plants, gas distribution grid, and sewage and solid waste treatment facilities.
Plans for infrastructure development are already in place: China intends to lengthen its total rail network from 86,000 kilometers to 120,000 by 2015, and at least 60% of this system will be electrified, up from 40%. China’s high-speed passenger rail system will reach 16,000 kilometers in length from the current 3,500 kilometers by 2015, at which point China will operate one of the most extensive high-speed rail networks in the world. And within five years China’s total roadway capacity—now at 70% of US capacity—will surpass that of the US.
Megatrend 4: Completion of Public Services Network China’s high rate of personal savings stems from individuals’ concerns about retirement without a comprehensive, government-sponsored social security system in place (exhibit 7). We believe that an aggressive reform and funding of the country’s pension, healthcare, and education systems would go a long way to unleashing domestic demand and that planned reforms of China’s entitlement programs over the next decade will push consumer growth beyond levels previously seen.
Exhibit 7
High Savings Rate Equals Consumption Potential
0% 10% 20% 30% 40% 50% 60%
US
UK
Germany
Korea
Japan
China
Source: Country Statistics, Morgan Stanley Research.
Beijing is already well on its way to reforming the social security system: More than 90% of rural households already participate in the new Rural Cooperative Medicare system (which offers only basic medical coverage), and within the next five years all urban populations should participate in a government health plan, as compared with 60% now (exhibit 8). By 2015 all citizens in urban areas will be enrolled in a state-sponsored pension plan, and those in rural areas will be enrolled by 2020 (exhibit 9).

M O R G A N S T A N L E Y R E S E A R C H
7
September 20, 2010The China Files
Exhibit 8
Expansion of Medical Insurance Coverage
0
20
40
60
80
100
1999 2001 2003 2005 2007 2009 2011E 2013E
%
% of urban population covered % to rural population covered Sources: MoH, Morgan Stanley Research. E = Morgan Stanley estimates.
Exhibit 9
Overview of China’s Pension Schemes
Urban employee
pension Rural social
pension
Rollout date Early 1990s Early 1990s
Total population* (mil.) 450 500
Covered population** (mil.) 234 60
Current coverage (%) 52 12
Target coverage 100% by ~2015 ~20% in 2010;
100% by 2020
Funding source (%) 30/70, employee/employer 50/50, resident/government
Monthly pension payout (est.) 20%-50% local avg. wage 100-150 Rmb
Current avg. monthly cost
of living (Rmb)
1,600 450
Monthly pension payout vs.
current monthly cost of living***
(%)
48
28
*Working and retired population. **As of 2009. ***As example only. Percentage varies based on pre-retirement wages. Sources: Government data, Morgan Stanley Research.
Megatrend 5: Consumer Finance Consumer finance in China lags that of developed economies such as the US and Europe: Total credit spending in China is about 10% of consumers’ total expenditure, compared with around 50% in more developed economies. Thus, as consumer credit becomes more accessible in China consumer spending will increase.
A thriving internet environment makes online shopping possible and so drives consumer credit. Since China has the highest number of internet users in the world—390 million—we see substantial upside for online settlement and credit cards as e-commerce continues to develop in China. Today about 20% of Chinese internet users shop online, far below the rate in developed countries, which is about 60%. Should online shopping penetration rise to 50%, there could be as many as 120 million additional credit card users in China (today there are about 150 million cardholders).
As credit use grows, consumer credit reports are becoming more useful in China, where the central bank has kept credit records on 600 million individuals and more than 6 million corporations since 1997. This credit tracking will make further consumer credit extension easier and will enhance credit protection efforts—a major concern. To combat identity theft and fraud—two ills that have plagued China’s credit industry in the past—China started using second-generation identification cards in 2004, making identify theft and fraud almost impossible today.
We estimate that China’s consumer credit spending as a percentage of total consumption will meet the world average of 40% by 2020, boosting consumers’ purchasing power by a dramatic 30%—and this is before taking into account the reduction in personal savings and improved wages across China.
Megatrend 6: Industrial Upgrades In the early 1990s—when China started to rise as a global producer—only 3% of its working population had college degrees. This lack of educated laborers forced Chinese companies to adopt a low-quality, mass-produced approach to their businesses. But this scenario is changing rapidly.
Today, approximately 10% of China’s work force has a college degree (exhibit 11), and Chinese companies are changing their business models to make a place for this better-educated worker. Soon, China’s cheap and low-value-add approach to production will become obsolete as a younger, college-educated population enters the workforce.
We estimate that by 2020 some 35% of China’s workforce will be college educated. This level will match that of the US today, where we see a strong correlation between education and the value added of manufacturing (exhibit 10).
Exhibit 10
US Manufacturing Value-Added versus Education
22%
24%
26%
28%
30%
32%
34%
36%
38%
19
92
19
93
19
94
19
95
19
96
19
97
19
98
19
99
20
00
20
01
20
02
20
03
20
04
20
05
20
06
20
07
20
08
20
09
900
1,000
1,100
1,200
1,300
1,400
1,500
1,600
1,700
US
$ b
n
Percentage of college graduates in total employment (left) GDP - Manufacturing value added (right)
Sources: CEIC, Morgan Stanley Research.

M O R G A N S T A N L E Y R E S E A R C H
8
September 20, 2010The China Files
Exhibit 11
China Baby Boomers Receive Better Education
Sources: CEIC, Morgan Stanley Research.
Obstacles to Growth
As China heads toward the megatransition that these megatrends portend, the country will doubtless face obstacles to its ongoing growth. It must therefore adjust its growth model to address these obstacles if it hopes to continue on a trajectory of expansion. The two main obstacles to ongoing growth are environmental issues and the availability of certain resources.
Environmental issues China, the world’s top carbon emitter, accounts for approximately 21% of global carbon emissions—and its emissions liability is growing faster than that of any other nation. Further industrialization, growing urbanization, and rising disposable income will drive up energy consumption in the coming decade, and the rate of carbon emissions will multiply unless China makes a concerted effort to alter its current growth model (exhibit 12).
Exhibit 12
China Carbon Emissions
R2 = 0.7058
-5
0
5
10
15
20
25
-10,000 - 10,000 20,000 30,000 40,000 50,000 60,000
Per capita GDP (US$)
CO
2 e
mis
sio
n p
er
cap
, to
ns
US
EU25
CanadaAustralia
UK
Japan
Korea
India
China
China 2020e -efforts taken
GDP/CO2 curve
China 2020e - BAU*
Note: Size of bubble measures each country’s emissions, 2005 data. BAU—Business as usual. Sources: CAIT, Morgan Stanley Research. E=Morgan Stanley estimates.
Curbing carbon emission has become part of China’s national priorities, especially after the Copenhagen Summit last year. At the summit, Premier Wen committed to “reducing carbon emissions per unit of GDP by 40% to 45%, by 2020, from the 2005 level.”
China’s strategy to reduce carbon emissions—different from that of developed countries—will be to develop less carbon-intensive businesses and new energy sources, with an eye toward reducing marginal carbon emission per dollar. China’s secondary focus will be to reduce carbon emissions in existing production processes and streamline consumption.
We expect that China’s energy structure in the coming decade will evolve away from coal and toward clean and/or renewable sources of energy. In our view, this evolution of China’s energy structure will be the most effective way to reduce carbon emissions, cutting them by at least 51% by 2020. Further reductions will come from improved efficiency at thermal plants (a 37% reduction) and at industrial sites (mainly within the cement industry, with a 12% reduction).
Resource constraints Today, China consumes a significant share of the global supply of commodities and energy. Given China’s high rate of growth, this rate of consumption cannot continue over the long term (exhibit 13).
Exhibit 13
China Percentage of Total Global Commodities Consumption, 2008 - 2009
20% 25% 30% 35% 40% 45% 50%
Copper
Aluminum
Zinc
Lead
Tin
Coal
Sources: CEIC, Factiva, Morgan Stanley Research.
Today, China competes for these limited resources with other growing economies in a global market vastly different from the one that it entered as the dominant emerging economy in 1993. Since then, more countries have started to develop—Brazil, Russia, and India, for example—and now demonstrate considerable demand for the same resources as China.
If China and other emerging economies keep growing at current speeds without reducing their energy and commodity dependency, prices for these resources may move beyond
-
5,000
10,000
15,000
20,000
25,000
1949 1959 1969 1979 1989 1999 2009
millions
China - College students per million of population
baby boomers

M O R G A N S T A N L E Y R E S E A R C H
9
September 20, 2010The China Files
what China can afford, triggering an economic slowdown in the country.
The Megatransition: China by 2020
As the first decade of the 21st century winds down, China stands ready to make a megatransition, from the world’s factory to an economic powerhouse on the global stage. The megatrends we identified, while facing some constraints, are the push and pull factors to help China achieve such a megatransition.
At macro levels, we believe that by 2020:
China’s GDP share in the world economy will grow to 14% from the current 8%.
China’s domestic FAI will keep growing at 11.0% CAGR, or more than double.
China’s private consumption will grow at 12.6% CAGR, or more than triple.
China will have made its currency, the renminbi, freely convertible and its capital account open.
China will become one of the largest outbound investors, in both financial direct investment and world capital markets.
At micro levels, we believe that by 2020:
China baby boomers—those born after 1980—will represent 45% of the workforce and be the dominant consumer.
China will have deepened its urbanization ratio to 63%, having added 300 million to its urban population, an increase of 50% from today.
China’s labor cost-to-GDP ratio will go up to 30%, with wages more than quadrupling.
China will complete a comprehensive social security network, covering the majority of its population, with health insurance for the entire population of 1.3 billion and pension coverage for 0.8 billion employed workers.
Of Chinese workers, 35% will have college degrees.
China will have developed a comprehensive consumer finance industry, driven by advances in e-commerce and credit reporting. The credit consumption ratio could rise to 40% from today’s 10%.
China will have in place a nationwide, world-class infrastructure, from ports to airports, highways to high-speed rail lines, and power grids to gas distribution networks.
Also see “China Economics: Chinese Economy Through 2020: Not
Whether but How Growth Will Decelerate”, by Qing Wang, 19
September 2010.

M O R G A N S T A N L E Y R E S E A R C H
10
September 20, 2010The China Files
US Multinationals’ Winning Strategies in China
China’s challenge. China’s rising stature in the world economy will pose a critical challenge to multinationals in the coming decade: how to remain competitive globally in the face of China’s rapid growth.
Protectionist concerns. Despite the growing consensus that China is becoming more protectionist, we believe that multinationals’ success in China will be the market’s choice, not the government’s choice.
Two factors that will contribute to multinationals’ winning strategy. By adopting a franchise approach rather than focusing on short-term sales, multinationals will fare well in China. Also, if multinationals integrate their current products and operations into the Chinese market they will win over China’s buying public.
Three opportunities for US multinationals. We have seen that US multinationals can find a competitive advantage by making the most of opportunities related specifically to the consumers’ boom, anticipated industrial upgrades, and demand for materials.
China’s Challenge
The challenge for multinationals in the coming decade is clear: If China’s economy comes to represent 14% of global GDP by 2020, as our China economist Qing Wang estimates, multinationals need to think about how they can benefit strategically from China’s advancement (exhibit 14). In 2009, Asia made up only 5.2% of S&P 500 sales, and the China portion is surely lower than that, though we do not know by how much. With this in mind, China’s significance as an overseas market will undoubtedly increase over time, offering an opportunity that US multinationals cannot ignore. In short, a multinational today cannot remain truly multinational in the coming decade without a proper China strategy.
Exhibit 14
China Economy Size in the World
-
1,000
2,000
3,000
4,000
5,000
6,000
7,000
8,000
9,000
10,000
2000 2002 2004 2006 2008 2010E 2012E 2014E
2%
4%
6%
8%
10%
12%
14%
China GDP as % of World (right) China GDP US$ bn Sources: IMF, Morgan Stanley Research. E = IMF estimates.
Exhibit 15
Foreign Companies’ Share in China Industry Value Added
5%
10%
15%
20%
25%
30%
19
94
19
95
19
96
19
97
19
98
19
99
20
00
20
01
20
02
20
03
20
04
20
05
20
06
20
07
20
08
Source: CEIC, Morgan Stanley Research
We believe that China also stands to gain from multinationals’ presence in the region. At present, only a few large multinationals operate in the country, limiting China’s opportunities for cultural and technology exchanges (exhibit 15). There are no official data available regarding foreign companies’ share of Chinese GDP, but our rough math shows that they are still under-represented. First, foreign companies accounted for 28% of industrial sales in 2009. Given that foreign companies' contribution to primary and tertiary industries is almost negligible, we estimate foreign companies’ share of GDP would be slightly higher than 13% (secondary industry was about 46% of GDP in 2009). The upside to this share is, in our view, quite significant.
How Big a Concern Is Protectionism?
Contrary to the view that China is becoming more protectionist, a development that might limit multinationals’ upside in China, we see it differently. We believe that business success is the market’s choice, not the government’s choice, and that US multinationals will succeed in China in the long term. Our rationale: More important than any government initiative is China’s growing need for marketing expertise and technology, and the multinationals have them.
Multinationals, especially consumer brands from the US and Europe, are experienced in building franchises. Chinese companies will need to develop expertise in this area if they hope to compete in China’s geographically broad, culturally diverse, highly stratified marketplace, where foreign companies can leverage expertise from their home markets to great success. We expect that as the Chinese market continues to expand in the coming decade, the China

M O R G A N S T A N L E Y R E S E A R C H
11
September 20, 2010The China Files
consumer will welcome multinationals that can adapt to regional differences.
Multinationals, especially industrial firms, have invested significantly in technological development over the last two decades. Chinese companies will likely seek to build alliances with multinationals that are more technologically advanced; these new business relationships will help eliminate existing barriers to trade and will ease multinationals’ entry into the market.
There are many great success stories of foreign companies in China. To name a few—none of which was the government’s choice:
Nike generates 10% of their sales from China, holding the top premier sportswear brand position in Tier 1 and Tier 2 cities;
Yum! Brands now operates 3,500 restaurants in China and has seen profits grow at 30% CAGR in the past five years, making it one of the top players in the catering business and far ahead of most local players;
Procter & Gamble holds 13% of the household and personal care market, and is the largest H/PC company in China among both local and foreign players;
China is already the fourth largest market for Emerson Electric, contributing 12% to its total revenue; and
China has contributed to about 30% of Dow Chemical’s sales since 2008.
These stories illustrate how well the market economy is working in China, how China’s decision to build a market economy paved the way for its current economic success. In order for this success to continue, however, the market must determine which goods and services it prefers.
Two Factors for Success
Market experience and technology are what multinationals can offer to the China market, but these two contributions do not guarantee multinationals’ success there over the next decade. We believe that before all else, multinationals need to devise a clear, long-term strategy in China.
Most multinationals employ two strategies in China: They maximize sales revenue—often by running parallel brands and business lines—and they try to localize operations, from production to service and support. While we do not fault this model, we believe these strategies can be improved.
We see opportunity in moving from a revenue model to a franchise model. A franchise model relies on an extensive network of sales and services for long-term, sustainable
growth. A franchise model also requires a centralized decision-making process about branding, sales, marketing, and relationships management.
Multinationals with multiple brands and business lines could benefit from adopting this model, in our view, beginning with the implementation of a unified marketing and branding strategy. They then could consolidate their sales networks to avoid internal competition and inconsistent handling of clients. They might also consolidate the management of different business lines’ clients, government relations, and marketing.
Indeed, many large firms have used the franchise model to achieve success in China—GE, Emerson, and Proctor & Gamble, for instance. These companies all came to China early in its rise, to be sure, but even though they also ran multiple business lines and/or brands, they centralized their branding, marketing, distribution, and relationships management operations from their start here. We believe this approach is crucial for companies hoping to establish a long-term business in China.
We also see opportunity in moving from a localization model to an integration model. Given the size of the Chinese market, we think multinationals would be well served to view China as a secondary home market, or even as a second headquarters, rather than as just another foreign market. Using a localization model, multinationals typically do two things: They bring products from their home market into China and localize the production, and they employ local workers. This could be improved upon, we think, by adapting to regional differences and integrating foreign products and services in that way. To accomplish this, multinationals could offer different products and/or services that appeal specifically to the Chinese consumer and work through existing institutional and operational structures to improve system efficiency and reduce bureaucratic delays.
Unfortunately, although there are many good examples of foreign firms’ localization, we have found very few that are good at integration. On the product-offering side, P&G and Unilever are the two rare examples of foreign firms that understand the differences in the China market and design broad lines of products specifically for this market. Clearly, these companies have been very successful in China.
At the corporate structure level, an example of integration is even harder to find. Most multinationals have their Asian headquarters outside of China, even in instances where a company derives most of its revenue from China. IBM, GE, GM, and Honeywell are the few exceptions, having moved their regional headquarter to China in the past decade. Managing from a distance is not the optimal model, in our view. China is not just a big market, it is a quickly growing and

M O R G A N S T A N L E Y R E S E A R C H
12
September 20, 2010The China Files
changing market. It is impossible to manage a China business efficiently from an offshore headquarters using a remote control. Given the difficulty of managing from afar and the importance of China to multinationals, we believe that most multinationals should build a second global headquarter in this country.
Three Categories of Opportunity for US Firms
We group the China opportunities into three general categories. The first two categories represent companies that will benefit from the direct opportunities offered by China’s consumer boom and industrial upgrades. Taken together, these two direct opportunities create a third, indirect opportunity—a demand for materials, from which companies in the third category will benefit (exhibit 16).
Although foreign companies today make up more than 20% of China’s gross industrial output, most of these foreign companies are concentrated in low value-added businesses such as OEM factories. We believe that the greater upside potential for foreign companies, especially the US companies, lies in the franchise-critical consumer sectors and technology-intensive capital goods sectors. This view is consistent with our analysts’ findings as well.
Some examples of foreign companies in sectors underrepresented in China are:
Pfizer, which captures only 2% of the market, even though it’s the largest foreign pharmaceutical company in China;
Starbucks, which has only 400 outlets in China, even though it has been growing at a rate of 15%-20% per year. China’s contribution to Starbucks’ group sales is almost negligible; and
Caterpillar, which generates only 5%-7% of sales from China, the largest machinery market in the world.
US firms in general are competitive in technology and experienced in franchise-building, which gives them certain advantages at the micro level. With these advantages in mind, in the consumers category, we believe US companies are more competitive in household consumption (apparel, HPC, computer hardware, semiconductors, and air freight & logistics); culture and leisure (internet, casinos & gaming, and restaurants); and healthcare (healthcare supplies and pharmaceuticals). In the industrial upgrade category, US companies are more competitive in aerospace & defense, industrial conglomerates, and machinery. US companies also have opportunities in selective material and related sectors, such as fertilizers & agrichemicals and chemicals, as well as marine.
Exhibit 16
US Companies’ China Opportunity Map
machinery
Consumer Boom
Industrial Upgrade
Materials
restaurants
household consumption
apparel
HPC
tech hardware
semis
transportation
culture and leisure
internet
casinos & gaming
medical deviceshealthcare
pharmaceuticals
shipping
chemicals
agrichemicals
aero space & defense
industrials
Source: Morgan Stanley Research.

M O R G A N S T A N L E Y R E S E A R C H
13
September 20, 2010The China Files
What’s Your China Plan? US Top Picks
The secular growth dynamics of the Chinese market don’t leave US companies with much of a choice. If China’s rate of economic growth and the potential of its various industry sectors are anywhere close to what analysts forecast, the difference between playing in the game and sitting on the sidelines will be big enough to affect companies’ earnings and valuation multiples relative to their peers’.
Given this macro reality, the question for US companies today simply becomes: What’s your China plan?1
In this next section, we asked our US industry analysts to identify the companies in their coverage universe that are best positioned to participate in the secular growth dynamics that our China strategist Jerry Lou describes in the introduction, “The China Landscape: Megatrends and Megatransition.” For each of the industry sectors discussed in this report, our local China industry experts provide the relevant market overview as well.
A full-blown competitive analysis would involve an in-depth study of current market shares, projected market sizes, and various competitive strategies across industry sectors and global peer companies. Such an analysis is outside the scope of this report and is best accomplished at the industry sector level. Instead, we have asked our analysts to qualitatively assess their top picks along three simple but distinct dimensions, with the understanding that any one or all of these can determine a company’s success in new markets.
Exposure Today Some US companies have already established a beachhead in China and can claim China as their third- or even second-largest regional market. Other foreign companies may hold a dominant position in the Chinese market, even though China operations contribute a relatively small percentage to their global sales. All of these companies have significant exposure to the Chinese market, with all of the opportunity and risk that this exposure entails.
We must stress that what works elsewhere does not necessarily work in China. Therefore, the extent to which US companies have gained market share in China reflects their ability to overcome barriers to entry related to:
Aligning products and pricing with local client preferences;
Identifying and cooperating with the right distribution partners; and
Understanding how to navigate a complex new market via formal and informal networks.
1This topic of US corporate strategy in China has received recent attention in
the financial press. See, for example, “Divided by a Two-Track Economy: Foreign Demand Buoys Some U.S. Firms, but Others Face Wary Consumers at Home,” The Wall Street Journal, September 7, 2010.
What this means is that beyond the headline revenue number, market share in China is directly related to experience and access in the region. Companies eager to do business in China—like our top picks—cannot underestimate the significance of this point.
Strategy Even companies with a strong foothold in China must continue to assess their positioning there as market conditions change. Conversely, because the Chinese market is ever changing, even a company with little exposure in China today may become a dominant player there tomorrow.
Therefore, it is imperative that we understand the strategies of the companies our analysts have chosen. How focused is management on the Chinese market? What investments are being made and what alliances forged? Taken in sum, the answers to these questions lead us to the likely winners in the region.
Some of our top picks may actually have a smaller presence in China when compared to some of their American peers. However, we predict that within five years the strategies that these companies employ will prove to succeed in China’s rapidly evolving market.
Competition We believe that even with the significant exposure and the credible strategies of some of our top picks, a company can be overcome by local and foreign competition. To address this concern, we have asked our analysts to provide a brief assessment of the competitive headwinds for each of their top picks.
As mentioned, a full-blown analysis of the competitive landscape is beyond the scope of this introductory, cross-sector China Files report and is best addressed at the industry sector level. Such an analysis would be necessary, however, to gain a more in-depth understanding of the challenges that might confront a US corporate operating in China.
To be able to track the performance of our top picks and runners-up as the China growth theme unfolds, and for investors wishing to participate in the theme via these US stocks, we created a US-China Exposure basket2 (Bloomberg ticker <MSMSCHX>; see Appendix for constituents).
2 The information contained herein has been prepared solely for informational purposes and is not a solicitation of any offer to buy or sell any security or any other financial instrument or to participate in any trading strategy. Products and trades of this type may not be appropriate for each investor. Please consult with you legal and tax advisors before making any investment decision. Please contact your Morgan Stanley sales representative for more details.

M O R G A N S T A N L E Y R E S E A R C H
14
September 20, 2010The China Files
Market Overview ApparelAngela Moh
Rosier Outlook Ahead
Market Today
Exciting growth delivered
The sportswear industry experienced rapid growth from 2002 to 2008, with a CAGR of between 30% and 35%. Even so, per-capita consumption is still at a low level when compared to that of developed counties.
The apparel market in China remains fragmented, with the high-end/premium apparel market mostly dominated by international brands.
The three main drivers of the apparel industry are heightened fashion and brand awareness, higher incomes, and the swelling of the urban population and middle class.
Foreign firms have a strong foothold in the luxury/sports apparel and footwear segments.
Long-term Outlook
Better than expected
We expect solid growth across all segments of the apparel and footwear industries as a result of the secular boom of domestic consumption in China.
In the sportswear segment specifically, we project growth at a CAGR of 15%-20% during 2008-2013, driven by a higher sports participation rate, an increase in disposable income and ongoing urbanization. We also see significant potential in the lower-tier cities for this segment.
Apparel and Footwear Consumption in China
0 6 13 20
63
119133 137
176
211233
0
50
100
150
200
250
Ind
ia
Ch
ina
Ch
ina
(Ad
just
ed
)
Sin
ga
po
re
Jap
an
Ko
rea
Fra
nce
U.K
.
Ge
rma
ny
U.S
.
Ca
na
da
US$
Source: Morgan Stanley Research.
Per Capita Consumption of Sportswear by Country
Apparel and Footwear Consumption in China
-
500
1,000
1,500
2,000
2,500
1998
1999
2000
2001
2002
2003
2004
2005
2006
2007
2008
2009
E
2010
E
2011
E
2012
E
2013
E
Rmb bn
2008-13CAGR = 14%
1998-08 CAGR = 11%
Source: Morgan Stanley Research.
What Does it Take to Win in China?
Branding, design, marketing, and distribution

M O R G A N S T A N L E Y R E S E A R C H
15
September 20, 2010The China Files
Top Pick: Nike ApparelNKE, $76.56
Chi H. Lee
Growth Without Equity Dilution Comments from management
Exposure Today A doubling of sales within five years
Nike enjoys strong brand recognition across both footwear and apparel in China and is positioned more as a lifestyle brand than as a pure athletic brand. Its products are not commoditized, which allows for a strong price premium that we think is sustainable in Tier 1 and Tier 2 cities.
Nike currently generates about 10% of total sales ($1.7 billion) from China, making this the third -largest market after North America (35%) and Europe (26%), but ahead of Japan (6%) and Brazil (estimated at about 5%). We expect Nike to double its current sales over the next five years, equal to a CAGR of about 15% per year.
Nike is currently the premier brand in both Tier 1 and Tier 2 cities. Its growth trajectory relies on increasing in share lower-tier cities, which will require greater utilization of the lower ends of its price band. The company is not aiming to compete on price with local competitors—Li Ning and Anta—which currently dominate the lower-tier cities, but some competitor convergence is likely as Nike increases its penetration in the lower tiers and the local players migrate upwards.
Strategy Competitor convergence—increasing penetration in lower-tier cities
Nike’s reputation as a premier brand is not under threat in China. The company will continue to push retail expansion in lower tier cities, principally through key licensing partners, and will begin to push growth in the Converse brand in 2011 as a directly operated business (currently licensed).
Competition Enough room for domestic and foreign competitors to grow
The market may remain skeptical of Nike’s longer-term growth trajectory, even as it acknowledges the company’s growing presence in lower-tier cities. Nike’s distribution partners will continue to add stores and square footage in these cities, and we think Nike can successfully avoid the inventory problems suffered during the Beijing Olympics (point-of-sale infrastructure is improving). And while local producers do offer some competition, we do not see them posing any serious contest to multinationals’ sales within developed markets over the next five years. Finally, Nike operates one of the most diversified sourcing bases within footwear, providing some offset to rising Chinese cost and currency pressures, like wage inflation and labor constraints.
“I’ve made it clear to our leadership team that we will not leave any key growth opportunities untapped. China is a great example….We are the leading force in this incredible market and we’ll leverage that position to exceed our current market revenue of 1.7 billion. And that’s just with the NIKE brand.… When we stay connected to consumers and focused on our key growth opportunities, I’m confident we’ll manage through the uncertainties of the global economy to deliver continued momentum and another strong year.”1
Mark Parker, President and CEO
1FactSet, 4Q2009 earnings call transcript.

M O R G A N S T A N L E Y R E S E A R C H
16
September 20, 2010The China Files
Market Overview Casinos & GamingPraveen Choudhary
Leveraged Macro Play
Market Today
A special gaming zone for the whole country
Macau, a special administration region of China, is the only place in the country where gaming is legal. Macau gaming industry revenue grew at 27% CAGR from 2003-2009 on the strength of Hong Kong and China GDP and a robust tourist industry.
So far, Macau revenue growth has remained unaffected by the slowdown in loan growth and property prices in the wake of government-imposed austerity measures.
At 70% of total revenue, the VIP sector is much larger in size and shows better growth than the mass business segment. Still, the VIP segment is more volatile, riskier, and vulnerable to any downturn. The mass business is more resilient and less volatile and generates a higher margin for the operators. Thus we prefer the mass business segment over the VIP segment.
Foreign companies operate in both the VIP and the mass business segments. Wynn Macau concentrates more on the VIP side, with 74% of its second-quarter gross revenue generated by the VIP segment. Sands China, by contrast, concentrates more on mass and non-gaming businesses, with 53% of gross revenue from the VIP segment for the same time period.
Long-term Outlook
Expecting normalized but stable growth
In the long term, the sustainable growth rate should be around 10%-15% for the Macau gaming industry.
The VIP business in Macau could be negatively affected by the licensing of new junkets in Singapore, but the mass business segment should enjoy more stable and resilient growth.
What Does it Take to Win in China?
The execution of expansion plans
Macau Gaming Revenue versus Visitation
-40%
-20%
0%
20%
40%
60%
80%
100%
Jan-08 Jun-08 Nov-08 Apr-09 Sep-09 Feb-10 Jul-10
Gaming Revenue YoY % Visitation YoY %
Sources: DSEC, Morgan Stanley Research.
Mass Business versus VIP Market
-0.4
-0.2
0.0
0.2
0.4
0.6
0.8
1.0
May-08 Oct-08 Mar-09 Aug-09 Jan-10 Jun-10
VIP Roll Mass Revenue
Growth YoY %
Source: Morgan Stanley Research.

M O R G A N S T A N L E Y R E S E A R C H
17
September 20, 2010The China Files
Top Pick: Wynn Resorts Casinos & Gaming WYNN, $90.28
Mark Strawn
WYNN brings Las Vegas to Macau Comments from management
Exposure Today
Gaming market opens up
Three years after the liberalization of the gaming industry in Macau, in 2006 WYNN opened its first casino in the region. Like the local competition but unlike Las Vegas Sands, its main foreign competitor, WYNN focuses almost exclusively on the VIP segment of the casino business, which accounts for 75% of total revenue in the $20-billion Macau gaming market. Over the 12 months ending June 30, 2010, 77% of WYNN’s $2.7 billion of casino revenues in Macau came from the VIP segment.
WYNN currently derives 70% of its revenue and 75% of its EBITDA from Macau (the remainder comes from Las Vegas). WYNN generates the highest returns on invested capital—50%, as compared with the industry average of 21%—and the highest operating metrics (EBITDA per gaming table and EBITDA per square foot of development) in Macau.
Year to date, overall gaming revenues in Macau are up 67% and VIP revenues 85% in response to three recent changes in the region’s gaming industry: the improved availability of credit for VIP players; the opening of additional casinos in Macau, including WYNN’s Encore hotel in April 2010; and the removal of travel restrictions from China into Macau in late 2009. Longer term, as year-over-year comparisons get tougher, we expect the Macau gaming market to grow at a rate of 10%-15% per year. The major drivers will be continued economic growth in China, rising disposable incomes, an expanding middle class, and China’s commitment to making Macau the leisure hub of the Pan Pearl River Delta.
Strategy
Expansion in Cotai
With a relatively clean balance sheet (1.1x net debt) and strong free cash flow generation ($700 million per year), the next step in WYNN’s development plan likely will be a major project in Macau’s Cotai district, which resembles the Las Vegas Strip in Nevada. We expect an announcement later this year of a WYNN Cotai project costing more than $2.75 billion, with completion expected in 2014.
Competition
Courting the VIP segment
WYNN competes almost exclusively in the VIP segment of Macau, where it has the second highest market share (behind the local incumbent, SJM Holdings.) While this has been an extremely profitable strategy to date, we believe growth will decelerate, with the mass casino segment becoming the fastest growing segment of the business starting in 2011. We believe future casino projects on Cotai and infrastructure developments throughout the Pan Pearl River Delta will increase the appeal of and facilitate travel to Macau.
The major risks for all Macau operators include government intervention (such as travel and currency restrictions between China and Macau) and slowing economic growth in China.
“The Asian market is very, very aware of the top brands, and that’s why we’re so meticulous in making sure that we meet that demand. For example, it is nonproductive for us to appeal to the low-end market in China because the government does not encourage the low-end of China to go to Macau. They don’t mind if people who can afford it go and gamble, but they’re sensitive to people who can’t afford it going across the border to Macau. That’s why they pulled back on the visas. But for those people in Hong Kong and South China from Taiyuan and Shanghai who can afford the good life, there’s no stigma attached to that in China, and there are so many of them.” 1
Stephen Wynn, Chairman and
CEO
1FactSet, 1Q2010 earnings call transcript.

M O R G A N S T A N L E Y R E S E A R C H
18
September 20, 2010The China Files
Market Overview RestaurantsLin He
Dining Out in China
Market Today
Strong but fragmented
China’s restaurant industry has posted robust growth, outpacing nominal GDP and consumer expenditure growth.
From 2000 to 2008, the share of restaurant food as a percentage of the total food budget for Chinese urban residents climbed from 14.7% to 20.6%. For rural residents, this ratio climbed from 2002’s 10.6% to 2007’s 13.7%. By means of comparison, in 2008 restaurant food accounted for about 47% of total food expenditures in the US.
Current growth topped 20% during the 1990-2008 period. We attribute this to rising per-capita income, a faster-paced lifestyle, and a demographic shift to smaller families.
Foreign brands like KFC and McDonald’s are the leading players in the fast food segment, with market share of 17.6% and 6.1%, respectively, in consumer food service in 2009.
Long-term Outlook
Moving into the fast lane
China’s Ministry of Commerce projected 16.5% CAGR for the industry for the time period of 2009-2013.
Although independent outlets still dominate China’s restaurant industry, chain brands will grow much more quickly than will non-chained restaurants.
We believe that foreign brands will continue to lead in the fast food segment because of their existing presence in the sector, economies of scale, and strong logistical capabilities.
What Does it Take to Win in China?
Standardized operations, strong brand awareness, and rapid expansion through franchising
Industry Revenue Growth
-
500
1,000
1,500
2,000
2,500
3,000
3,500
90 91 92 93 94 95 96 97 98 99 00 01 02 03 04 05 06 07 08 09 10e
13e
(Rmb bn)
90-08: 21.1% CAGR
09-13e: 16.5% CAGR
Sources: China Statistical Year Book, Morgan Stanley Research. E=China Cuisine Association estimates and Mofcom.
GDP and Total Consumer Spending
0%
10%
20%
30%
40%
50%
90 91 92 93 94 95 96 97 98 99 00 01 02 03 04 05 06 07 08 09
Nominal GDP YoY Growth Restaurant Industry Revenue YoY GrowthTotal Consumer expenditure YoY
Sources: China Statistical Year Book, Morgan Stanley Research.

M O R G A N S T A N L E Y R E S E A R C H
19
September 20, 2010The China Files
Top Pick: Yum! Brands RestaurantsYUM, $45.92
John Glass
YUM Defines Food-Service Market in China Comments from management
Exposure Today
The industry standard
For more than two decades, YUM has set the standard for food service operations in China. Building on a reputation for innovation and expansion, the company has developed a broad supply chain and distribution network that allows faster unit growth and higher store returns than peers over time. China contributed 31% of total company revenues in 2009, second only to the US, at 41%. Within five years, we expect China will be YUM’s largest market, generating more than 50% of revenues and between 45%-50% of operating profits.
YUM operates more than 3,500 restaurants in mainland China; in 2009 these restaurants generated operating margins of 20%. YUM’s operating profit has grown on average about 30% each year over the last five years. From here, YUM’s primary profit growth driver will remain the expansion of its store base, with same-store sales growth and G&A leverage as secondary drivers. Currently, YUM is opening around 475 new stores per year; we look for this pace to continue over the next five years, at approximately 2,400 stores, with sales expected to grow around 15% CAGR.
Strategy
New stores, new services
China is management’s primary geographic focus. With average unit volumes at more than $1.2 million and margins of 20%, YUM can open new restaurants with a cash payback of within two to three years. The company plans to expand its Pizza Hut Home Service and a Chinese quick service restaurant chain, East Dawning, with 21 stores currently, and it has a 27% stake in Little Sheep, a Chinese hot pot concept. Additional growth opportunities may exist through day-part expansion (breakfast and late-night service) and new product categories, like fountain and hot beverages.
“Our strategy is to have the leading brands in every significant category. What we’re trying to do is build every one of our brands into power brands so [that] we compete effectively. And as the buying power of the consumer increases, which it will inevitably do, we will be able to take advantage of it.”
1
“When you step back and look at where we’re at with China, it’s pretty difficult to imagine a better scenario. We couldn’t be happier, and we just keeping growing talent like you can’t believe there. That’s one of those intangibles that you can’t see. But our talent level is better, our operations continue to be best-in-class, [and] we’re leveraging the asset throughout the day. We’re in one thousand stores in home delivery, one thousand stores in 24-hour service—we’re just getting started.” 1
David Novak, Chairman, CEO
and President
Competition
A breakaway leader
YUM has world-class infrastructure, with its own food distribution system, and one of the largest real estate and construction teams anywhere in the world—two competitive advantages. McDonald’s, YUM’s primary competitor in China, is less than half of YUM’s size, and the market can easily accommodate both. The strengthening renminbi offers a benefit to earnings, with inputs sourced locally and profits denominated in US dollars. We estimate that every 1% appreciation of the renminbi is worth $0.01 per share of EPS annually (our 2010 EPS estimate is $2.50). Exogenous risks such as political restrictions on property building, which would limit planned unit expansion, or a health scare (for example, the 2006 avian flu outbreak), could significantly affect YUM’s growth plans.
1FactSet, 2Q2010 earnings call transcript.

M O R G A N S T A N L E Y R E S E A R C H
20
September 20, 2010The China Files
Market Overview HPCAngela Moh
Foreign Dominance to Continue
Market Today
Foreign players already claim dominant positions
China's household and personal care industry has enjoyed solid growth over the past 10 years; CAGRs for the years 1998-2008 range from 5% to 10%, depending on the category.
Markets are still far from saturation, though: Per-capita consumption of many product categories remains very low, compared with that in more developed countries.
Industry growth could accelerate over the next three to five years, supported by sustained per-capita income growth, continued urbanization, premiumization (consumers trading up for better quality), and enhanced distribution, with retail companies gradually tapping into low-tier cities.
Foreign players have been very successful in HPC markets due to advertising and marketing efforts. Local players are also strong in select categories due to a more comprehensive distribution network.
Long-term Outlook
Stable, rapid growth
We expect 10%-15% annual growth rates for leading players in HPC markets in the next decade.
Foreign players will continue dominate many sub-segments, but local rivals are rising quickly in a few niche fields such as natural products based on traditional Chinese herbs.
What Does it Take to Win in China?
Marketing, branding, and distribution
Hair Care: China Market Growth
Retail Sales of Hair Care Products in China
-
10,000
20,000
30,000
40,000
50,000
1999
2000
2001
2002
2003
2004
2005
2006
2007
2008
2009
2010
E
2011
E
2012
E
2013
E
2014
E
Rmb mn
1999-09 CAGR = 8.9%
2009-14 CAGR = 10.4%
Source: Morgan Stanley Research.
Skin Care: China Market Growth
Retail Sales of Skin Care Products in China
-
20
40
60
80
100
120
1998
1999
2000
2001
2002
2003
2004
2005
2006
2007
2008
2009
E
2010
E
2011
E
2012
E
2013
E
Rmb bn
1998-08 CAGR = 16.8%
2008-13 CAGR = 14.8%
Source: Morgan Stanley Research.

M O R G A N S T A N L E Y R E S E A R C H
21
September 20, 2010The China Files
Top Pick: Procter & Gamble HPCPG, $61.11
Dara Mohsenian
Procter & Gamble Already a Dominant Player Comments from management
Exposure Today
A major product leader
Procter & Gamble holds a 13% share of the household and personal care market and is the largest consumer products company in China. PG is the market leader in 11 of its 12 product categories within the region.
Overall, PG has grown at a 5% CAGR over the last five years, and over the next five years we expect a 4% CAGR. Today China is PG’s second biggest market, but it only accounts for around 6% of total sales, well behind the US, at 39%. We expect sales to grow from $5 billion to $8 billion by 2015, which would equal about 8% of total company sales.
We estimate that the Chinese household and personal care segment will grow at an 11% CAGR over the next five years. Three cultural shifts will contribute to this growth: consumer preference for premium products as income levels rise, consumer preference for natural and organic products in reaction to concerns about product safety, and product-driven changes in personal habits.
Strategy
More options on the menu
PG will continue to roll out new products as the market becomes more receptive (see bullet 3 above). Management sees significant potential to expand horizontally by introducing more product categories in the region as appropriate for the rising economic power of the Chinese consumer (PG is currently underpenetrated in several categories in China, such as home care and consumer health). PG has already invested heavily in infrastructure (like distribution) and is preparing to diversify its product offerings into lower-end price segments so as to offer a complete portfolio of products to Chinese consumers.
Competition
Room to expand
PG’s overall HPC market share is disproportionately low in China because of its narrower range of product offerings. The company is preparing to access this untapped potential through its improved infrastructure and a stronger focus on the region. Per capita consumption of PG products in China is about $3 annually, below the BRIC’s weighted average rate of $4 and much lower than the $20 rate in Mexico, or the even higher rate developed markets—$110 in the US. For perspective, if PG were able to close the personal care consumer gap for its products between China and Brazil, it would add a total estimated 15% to its current top-line. PG faces stiff competition in China from Colgate (in oral care), L’Oreal and Unilever (in beauty/personal care), and SC Johnson (in home care), and from strong local companies in paper products, consumer health, and fabric care.
“The biggest opportunity we have is to get all of our categories into all of our countries around the world. We have about 36 product categories, and we’re in all those categories in the United States, where we’ve been for 172 years. But in countries like China, where we lead, we’re in just over a dozen—probably about 16. So we have work to do to adapt those categories for the Chinese market.” 1
Bob McDonald, Chairman, President, and CEO
“Some companies may take the attitude that China is a growth market where they need to build a position for tomorrow, thinking that eventually they could raise profitability to target levels. This is not what we are trying to accomplish in China. We have set adequate, definable profit objectives for ourselves and believe that from both a strategic and an organizational focus this is the best way to take on the cost challenge involved in serving the mid-tier consumer segment in China. Tough profit objectives force you to get your cost structure competitive.” 2
Laurent Philippe, President for Greater China
1FactSet, 4Q2010 (FY) earnings call transcript.
2McKinsey Quarterly, “Understanding the Chinese Consumer,” July 2004.

M O R G A N S T A N L E Y R E S E A R C H
22
September 20, 2010The China Files
Market Overview PharmaceuticalsBin Li
Visible Fast Growth Ahead
Market Today
A counter-cyclical growth industry
We saw a 21% CAGR for the overall healthcare market during the last six years, versus a global average of 9%.
China’s aging population drives demand. In 2007 China had 107 million citizens aged 65 and above, versus 88 million in 2000, for a CAGR of 2.8%. Another driver is China’s rising income level, especially in urban areas, and greater access to insurance (we expect full coverage of China’s 1.3 billion people by 2020).
Multinational healthcare companies are actively seeking partnerships with Chinese companies, although the regulatory environment favors local players. Competition is intense in low-/mid-end products.
Long-term Outlook
Fast growth sustainable
Industry growth could reach a CAGR of more than 20% in the next five years, well above the estimated global average of 5%.
We expect that China’s healthcare reform will increase the country’s pharmaceutical user base and medical spending per capita. The government also plans to allocate more resources to underserved rural areas and nonworking classes and provide more affordable healthcare services to a broader population.
Multinationals should choose to enter partnerships with strong local players.
What Does it Take to Win in China?
Distribution and technology
Industry Sales Trend
0
200
400
600
800
1,000
2004 2005 2006 2007 2008E
0%
5%
10%
15%
20%
25%
30%
China Pharmaceuticals Sales (RMB bn) YOY (%)
Source: Morgan Stanley Research.
Industry Margin Trend
0%
10%
20%
30%
40%
50%
2004 2005 2006 2007 2008E
Gross Margin% Net Margin% Source: Morgan Stanley Research.

M O R G A N S T A N L E Y R E S E A R C H
23
September 20, 2010The China Files
Top Pick: Pfizer PharmaceuticalsPFE, $17.27
David Risinger
Major Commitment to Build Presence Comments from management
Exposure Today
Top foreign pharmaceutical company in China
Pfizer is the largest foreign pharmaceutical company in China, and China is one of Pfizer’s priority markets. We estimate PFE’s 2010 China sales will be about $2 billion, or approximately 3% of its global sales. China’s pharmaceutical market—estimated at about $40 billion in 2010—is highly fragmented, however, and Pfizer has captured only about 2% of it. To increase its market share, the company plans to expand its presence in the region from the 2009 level of about 2,300 sales reps in 177 cities to 3,300 sales reps in 272 cities in 2010 and 5,400 sales reps in 360 cities by 2012. Pfizer also plans to extend its research and development capabilities in China: The company has operated one manufacturing facility in Dalian since 1989 and a research hub in Shanghai since 2005; to these Pfizer will add a new clinical R&D center in Wuhan to support its global clinical programs. Pfizer estimates that the China pharmaceutical market will grow to about $100 billion by 2015, at which point it will become Pfizer’s third-largest market.
Strategy
Adapt to China’s unique business environment
PFE plans to drive incremental organic growth by focusing on core brands and new product launches. Chronic diseases common in the US and Europe (for example, high cholesterol, hypertension, and diabetes) are increasing in China due to a richer diet and more sedentary lifestyle. To address these conditions and others, Pfizer offers blockbuster drugs that we expect to be major drivers of growth in China: Lipitor for cholesterol, Norvasc for high blood pressure, and the Prevnar-13 vaccine for pneumococcal disease.
PFE will pursue strategic acquisitions and partnerships. Pfizer has entered into strategic partnerships with China-based companies for distribution and promotion of its products—for example, with NovaMed for oncology products and BMP Sunstone for Depo-Provera. Pfizer also started co-promoting Takeda Pharmaceutical’s diabetes drug Actos in China in late 2009.
PFE will develop good relationships with the government and healthcare providers. Pfizer provided emergency supplies of the anti-fungal drug Vfend for the treatment of secondary infection during the SARS crisis in 2003. Vfend is still widely used in China, even though it does not have a local patent protection. Brand image is particularly important in China because of high intellectual property and counterfeit risk: Patent law was only established in 1993 and most of Pfizer drugs in China are not patented.
PFE will seek game-changing opportunities for innovation. In 2009 Pfizer and PlaNet Finance China started working on expanding healthcare access for low-income populations in China.
“…In China, our legacy Pfizer business produced operational growth of about 30%. Together with the addition of the Wyeth products, we now have a business in China that is twice as large as it was a year ago, a business that generated nearly $0.5 billion in this quarter [2Q10].” 1
Jeff Kindler, CEO and Chairman
“…health reform that has been announced in China last April [2009], with the decision from the Chinese government to invest $125 billion in healthcare reform….there would be an impact on the volume. There will be an impact on the rate of diagnosis. There would be an impact on the rate of prescription in China. So Pfizer is working very closely with the Chinese government and the stakeholder in China to ensure that we can quickly adapt our business model. So it won’t be like immediate impact.” 2
Jean-Michel Halfon, President and General Manager of the
Emerging Market Business Unit
Competition
Heating up
The Chinese pharmaceutical market is growing quickly, with a 20% CAGR projected for 2010-2014. Such high growth prospects make China an important market for many US-based pharmaceutical companies.
1FactSet, 2Q2010 earnings call transcript. 2FactSet, Morgan Stanley “Unplugged” Conference transcript, September 15, 2009.

M O R G A N S T A N L E Y R E S E A R C H
24
September 20, 2010The China Files
Market Overview Medical DevicesBin Li
Young Industry with Strong Growth Prospects
Market Today
Stellar growth delivered
The Chinese government has significantly increased spending on healthcare since 2007 and, in particular, on the medical devices segment. This spending trend is likely to continue, and healthcare reform will further stimulate demand for medical products.
Industry sales have been growing at a CAGR of 26% over the past several years and net margin is stable at around 9%.
Growth drivers are a strong domestic economy, favorable demographic trends, and low penetration of devices.
Local players are better positioned on the cost front, but less competitive on the technology side.
Long-term Outlook
Fast growth sustainable
With continued spending and healthcare reform, we expect to see industry topline growth at more than 20% in the next decade.
Foreign players with unique technology that is hard to copy should benefit from the rapid expansion of Chinese demand. This type of company may not have a big sales infrastructure, but its technology is advanced and difficult for domestic competitors to replicate.
What Does it Take to Win in China?
Established sales network and sufficient capital for network expansion, the right products, and technology
China Device Market Growing at 25% CAGR (billions of renminbi)
0
200
400
600
800
04 05 06 07E 08E 09E 10E 11E 12E 13E
Source: Morgan Stanley Research.
Sub-Segments Overview
Hospital Instruments
2%
Surgical2%
Orthopaedics1%
Disinfection1%
Others1%
Dental4%
Materials37%
Diagnostics / Patient
monitors52%
Source: Morgan Stanley Research.

M O R G A N S T A N L E Y R E S E A R C H
25
September 20, 2010The China Files
Top Pick: Medtronic Medical DevicesMDT, $33.59
David R. Lewis
Early Mover Advantage Across Product Lines Comments from management
Exposure Today
An established presence
Medtronic’s business in China has already reached a substantial level of diversity, with marketed products in pacemakers, orthopedic implants, and hospital equipment.
Chinese revenue for MDT reached roughly $400 million through the fiscal year ending April 2010, with growth of 30%, including roughly 25% growth in units. Through the July quarter of 2010 growth remained robust for MDT China at 24%.
China is a critical anchor of MDT’s broader emerging markets strategy, comprising roughly one-third of the overall $1.2 billion MDT exposure to emerging markets, which is driving 7%-8% of revenue growth.
Strategy
Focus on local partnership and diverse offering
MDT’s entry to China has been accelerated via a joint venture with a local medical products company, Shandong Weigao. The Weigao joint venture immediately provided MDT with a local distribution channel for existing product lines and an early start on the process of building a local presence, with the benefit of Weigao’s local regulatory and marketing expertise.
MDT’s Weigao alliance allows the combined joint venture to play effectively in both the more advanced implant technology spaces of the market, including pacemakers, and in the lower-priced orthopedic implant space. Medtronic has increasingly taken a differentiated leadership position by investing in the relatively undeveloped Chinese market for microelectronic implants with locally targeted technology including the first Chinese-language pacemaker programmer.
MDT is near completion of a new production facility in Singapore to supply targeted emerging markets with cost-advantaged positioning starting in early 2011.
Competition
Early and aggressive moves build a competitive foothold
MDT’s efforts to partner locally with a company marketing a diverse orthopedic implant line both completes the company’s implantable product offering and has allowed the company to develop early infrastructure and local presence. This year, MDT will become the first US medical device company to open a government-backed patient and physician education center in partnership with a major hospital in Beijing.
“…I was in China two weeks ago for the opening of the Medtronic Patient Care Centre in Beijing, the first of its kind in providing a much-needed place where patients and their families can meet with medical technology experts and physicians to better understand the treatment options available. This is just one of the many examples where Medtronic is investing to expand patient access and drive long-term growth in emerging markets.” 1
William Hawkins, Chairman and CEO
“…We also know that the government is investing very, very heavily, particularly in developing the rural area for healthcare, because today the pressure on the urban system on healthcare is unattainable and unmanageable for the Chinese government. So they are spending about $125 billion to develop the infrastructure in rural China. The development of that infrastructure will help us push our therapies.” 2
Jean-Luc Butel, EVP-International
1FactSet, 1Q2010 earnings call transcript. 2FactSet, analyst meeting transcript, June 7, 2010.

M O R G A N S T A N L E Y R E S E A R C H
26
September 20, 2010The China Files
Market Overview InternetRichard Ji
Opportunities in Mobile Internet
Market Today
Local payers dominate
China’s internet sector is among the fastest growing in the country, showing more than 20% growth, year-over-year.
The main drivers behind this impressive growth are consumers’ new interest in internet content over traditional media and the shift in consumer focus from upgrading food and shelter to upgrading internet content.
Foreign players are generally facing a tough battle in the China market because Chinese internet users are very different from their counterparts in developed countries. Local internet players are better positioned in most of the internet sub-segments, especially e-commerce, search engines, online advertising, and gaming.
Long-term Outlook
Going mobile
Mobile will be ramping faster than desktop internet did and will be bigger than the consensus is predicting. The convergence of five trends (3G, social networking, video, VoIP, and new mobile devices) will create substantial new demand.
American companies like Apple, Facebook, Amazon.com, and Google have started to ramp up their mobile internet efforts. American companies should be able to profit from the expansion of mobile internet in China via partnerships with still-nascent local players.
What Does it Take to Win in China?
Partnerships with strong local players, deep understanding of local users’ needs, and relationship with local regulators
Booming Online Population
23 34 59 80 94 111 137210
298384
0
200
400
600
800
1,000
2000 2001 2002 2003 2004 2005 2006 2007 2008 2009
0%
20%
40%
60%
80%
Internet population (mn)
Source: Morgan Stanley Research.

M O R G A N S T A N L E Y R E S E A R C H
27
September 20, 2010The China Files
Top Pick: Yahoo! InternetYHOO, $14.27
Mary Meeker
Alibaba Group Gives Access to China Internet Market
Comments from management
Exposure Today
Substantial share of Alibaba Group
Yahoo! owns 44% of Alibaba Group, and as a result, owns about 33% of the Overweight-rated Alibaba.com (covered by China internet analyst Richard Ji), a leader in the Chinese internet market. Alibaba.com operates two B2B marketplaces that collectively are the most trafficked B2B websites on the internet. The international marketplace focuses on global importers/exporters, while the China marketplace services Chinese suppliers/buyers (60% of B2B market share in China).
Yahoo! also owns 44% of Alibaba Group’s other businesses, including Taobao and Alipay, providing exposure to China’s nascent e-commerce and e-payments markets. Taobao is the leading e-commerce company in China, managing online retailing operations (similar to Amazon.com) and auction services (similar to eBay).
In 2005, Yahoo! exchanged its Yahoo! China operations and $1 billion in cash for its stake in Alibaba Group.
Strategy
Ownership in China internet leaders
Yahoo! recognized relatively early that operating in China as a foreign internet company might be challenging. As such, the company chose to exchange its Yahoo! China internet operations for a significant ownership position in the market leader, Alibaba Group. Google and eBay invested heavily in China too, but both encountered a difficult operating environment: eBay exited in late 2006 and chose to partner with Tom Online (a local competitor), while Google made a well-publicized decision to redirect visitors of its China website to its uncensored Hong Kong site.
"In terms of monetizing the China assets, to be honest, again, we see those as a terrific, terrific investment that becomes more and more valuable over time. It’s a great way to play to the Chinese market. The management team there is fantastic. They’ve got a great position. We’re very happy to be part of that. We think that that’ll be worth much more, again, as we go forward here." 1
Tim Morse, CFO Yahoo!
Competition
Outperforming US competition
Yahoo!, through its ownership of Alibaba Group, competes with several companies in China. Alibaba Group remains the leader in several markets, including e-commerce, e-payments, and online auctions. In search, Alibaba Group is a less significant competitor, trailing both Baidu and Google, but that may change as Google continues to debate its position in that country.
1FactSet, 1Q2010 earnings call transcript.
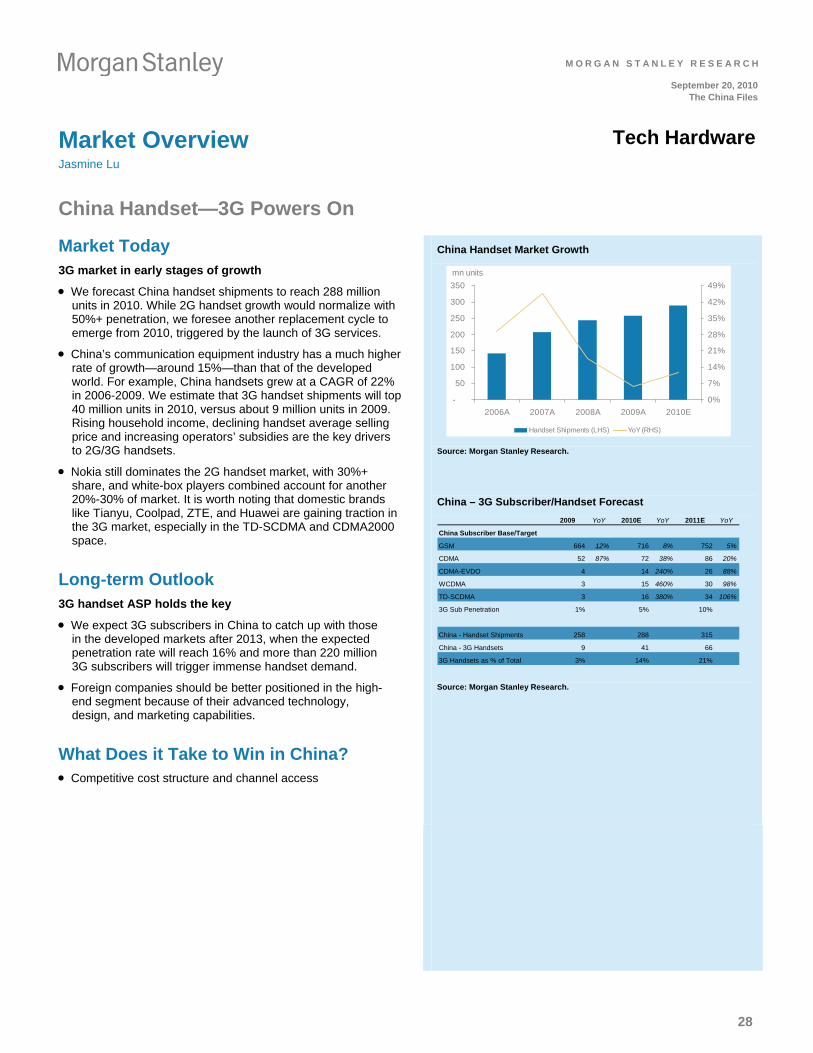
M O R G A N S T A N L E Y R E S E A R C H
28
September 20, 2010The China Files
Market Overview Tech HardwareJasmine Lu
China Handset—3G Powers On
Market Today
3G market in early stages of growth
We forecast China handset shipments to reach 288 million units in 2010. While 2G handset growth would normalize with 50%+ penetration, we foresee another replacement cycle to emerge from 2010, triggered by the launch of 3G services.
China’s communication equipment industry has a much higher rate of growth—around 15%—than that of the developed world. For example, China handsets grew at a CAGR of 22% in 2006-2009. We estimate that 3G handset shipments will top 40 million units in 2010, versus about 9 million units in 2009. Rising household income, declining handset average selling price and increasing operators’ subsidies are the key drivers to 2G/3G handsets.
Nokia still dominates the 2G handset market, with 30%+ share, and white-box players combined account for another 20%-30% of market. It is worth noting that domestic brands like Tianyu, Coolpad, ZTE, and Huawei are gaining traction in the 3G market, especially in the TD-SCDMA and CDMA2000 space.
Long-term Outlook
3G handset ASP holds the key
We expect 3G subscribers in China to catch up with those in the developed markets after 2013, when the expected penetration rate will reach 16% and more than 220 million 3G subscribers will trigger immense handset demand.
Foreign companies should be better positioned in the high-end segment because of their advanced technology, design, and marketing capabilities.
What Does it Take to Win in China?
Competitive cost structure and channel access
China Handset Market Growth
-
50
100
150
200
250
300
350
2006A 2007A 2008A 2009A 2010E
mn units
0%
7%
14%
21%
28%
35%
42%
49%
Handset Shipments (LHS) YoY (RHS)
Source: Morgan Stanley Research.
China – 3G Subscriber/Handset Forecast
2009 YoY 2010E YoY 2011E YoY
China Subscriber Base/Target
GSM 664 12% 716 8% 752 5%
CDMA 52 87% 72 38% 86 20%
CDMA-EVDO 4 14 240% 26 88%
WCDMA 3 15 460% 30 98%
TD-SCDMA 3 16 380% 34 106%
3G Sub Penetration 1% 5% 10%
China - Handset Shipments 258 288 315
China - 3G Handsets 9 41 66
3G Handsets as % of Total 3% 14% 21%
Source: Morgan Stanley Research.

M O R G A N S T A N L E Y R E S E A R C H
29
September 20, 2010The China Files
Market Overview Tech HardwareGrace Chen
Fast-Growing China PC Market
Market Today
Market penetration rate still low
We expect China PC shipments will reach 68.9 million units in 2010 (against the U.S. rate of 79.2 million and Western Europe’s 77.5 million). China’s PC market is still at an early stage of development, with a low penetration rate of about 17% in 2010e, versus the U.S. rate at 101% and Western Europe at 68%.
The China PC market grew at a CAGR of 26% in 2006-2009. Economic growth, rising household income, and increased technology demand are the three drivers behind the growth.
The local China brand Lenovo still dominates the China PC market, with close to 30% market share. Other local brands are being squeezed out by foreign vendors such as HP and Dell.
Long-term Outlook
Tier 4-6 cities as growth driver
Market research institutes generally forecast China PC shipments to grow at a CAGR of 16%-20% in 2009-2014, outpacing the global PC growth of 14%-15%.
Tier 4-6 cities, where PC penetration rate is still low, will be key for growth in the next couple of years, as Tier 1-3 cities become more saturated.
Given robust consumer strength and fast-growing GDP in China, outside observers expect China’s long-term growth in the PC market to be sustained by the huge population pool and increasing purchasing power.
What Does it Take to Win in China?
Comprehensive distribution and sales networks and better access or control channels in the low-tier cities
China PC Worldwide Market Share
K units
-
20,000
40,000
60,000
80,000
100,000
120,000
140,000
2005
2006
2007
2008
2009
2010
E
2011
E
2012
E
2013
E
0.0%
5.0%
10.0%
15.0%
20.0%
25.0%
China PC shipments Worldwide market share
Sources: IDC, Morgan Stanley Research.
China PC Shipments by City Tiers
K units
-
2,000
4,000
6,000
8,000
10,000
12,000
14,000
Tier 1 Tier 2 Tier 3 Tier 4 Tier 5 Tier 6
0.0%
5.0%
10.0%
15.0%
20.0%
25.0%
30.0%
35.0%
2008 shipments 2009 shipments 2010e shipments
2009 growth rate 2010e growth rate
Sources: IDC, Morgan Stanley Research.

M O R G A N S T A N L E Y R E S E A R C H
30
September 20, 2010The China Files
Top Pick: Apple Tech HardwareAAPL, $270.22
Katy Huberty
Don’t Write Off China Comments from management
Exposure Today
China iPhone market rivals largest European/Asian markets
Apple’s primary revenue drivers in China are the iPhone and the iPod; the Mac, for the most part, lies outside the average Chinese consumer’s price range. AAPL officially launched iPad Wi-Fi models in China on September 17.
We estimate that there are approximately 2 million iPhones in use in China (this number includes phones bought on the grey market)—a level of usage rivaling that of other major European/Asian countries. Although structurally the China market is less attractive overall—a higher percentage of users buy prepaid phones and the average revenue per user (ARPU) is lower—our proprietary research estimates the number of potential smart iPhone consumers (those with annual income of at least $20,000, monthly wireless ARPU of $22, and post-paid mix of 50%) at about 50 million. These numbers are on par with those of the UK (76 million users) and Spain (53 million). Thus we see the potential for AAPL to sell between 4 and 5 million iPhones in China, at a penetration rate of 8%-10% of the addressable market.
Price is the biggest impediment to iPhone adoption in China: Handset cost and prepaid deposit bring the upfront payment to between $879 and $1172—and this is before the monthly service fee. In comparison, the average cost of a handset is about $100. But a possible prepaid price cut to $350 or $400 could double the iPhone’s market, from 5 million to 10 million.
Strategy
Retail boom
Despite already strong brand recognition, greater retail presence in China will further increase the level of interest in AAPL’s products. The company aims to open 25 stores within the next two years, a rate not replicated in any other foreign market.
AAPL currently derives about 11% of its revenue from Asia-Pacific ex Japan. Of this, China represents between 25% and 50%. This compares with the Americas at 42%, Europe at 27%, and Japan at 5%. We estimate that over the next five years AAPL’s CAGR may be as high as 35% (although off a low base); this growth outlook is a function of both rising smartphone penetration and a growing middle class that can afford AAPL’s premium-priced products. In addition, a maturing credit system will help reduce the upfront costs of the iPhone.
“If you look at greater China…the iPhone units were up year over year over nine times, and we added another 800 points of distribution in China. The revenue also – we’ve never released this number before but I’ll do this in this particular case – is through the first half of the fiscal year that we just completed. So the six-month period, our revenue from greater China was almost 1.3 billion, and this is up over 200% year over year. And so we’re real pleased with how the company’s positioned to take advantage of the growth in greater China.” 1 “We have just really got going in China. I really like what I see so far. Although the average income is not nearly as high as perhaps the United States and some other Western European markets, there is a significant size middle class and up there. And so I think it’s somewhat a – I think to do a real deep analysis, you really have to look not just at the averages, but at the distribution of income within these countries.” 2
Tim Cook, COO
Competition
Favored brand
AAPL has many competitors in China. In handsets the major names are Google (with the Android), Nokia, Samsung, LG, Motorola, HTC, and RIM; and in computers, HP, Acer, Dell, Asustek, and Lenovo. Many of these players also will enter the tablet market in the near future. The market is competitive, but our survey work shows that AAPL has the most favorable future brand consideration among high-end Chinese handset users—a factor that will help AAPL to increase its consumer base significantly, even with its premium-priced products.
1FactSet, 2Q2010 earnings call transcript. 2FactSet, 1Q2010 earnings call transcript.
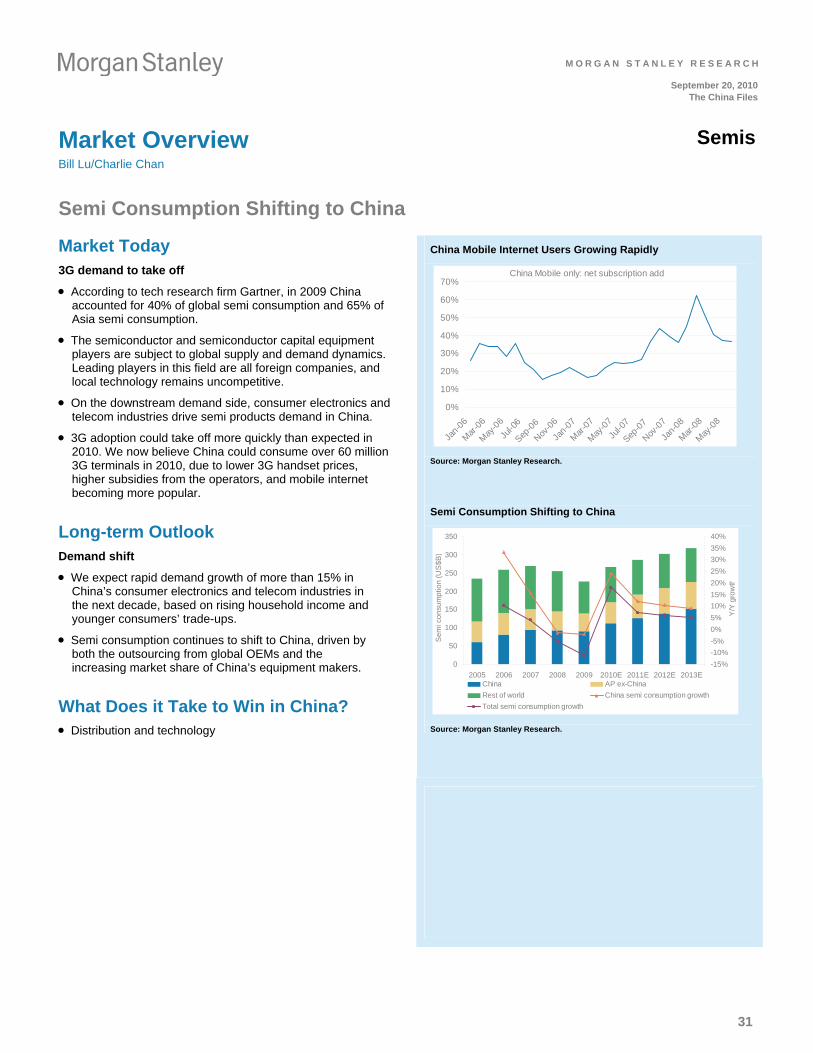
M O R G A N S T A N L E Y R E S E A R C H
31
September 20, 2010The China Files
Market Overview SemisBill Lu/Charlie Chan
Semi Consumption Shifting to China
Market Today
3G demand to take off
According to tech research firm Gartner, in 2009 China accounted for 40% of global semi consumption and 65% of Asia semi consumption.
The semiconductor and semiconductor capital equipment players are subject to global supply and demand dynamics. Leading players in this field are all foreign companies, and local technology remains uncompetitive.
On the downstream demand side, consumer electronics and telecom industries drive semi products demand in China.
3G adoption could take off more quickly than expected in 2010. We now believe China could consume over 60 million 3G terminals in 2010, due to lower 3G handset prices, higher subsidies from the operators, and mobile internet becoming more popular.
Long-term Outlook
Demand shift
We expect rapid demand growth of more than 15% in China’s consumer electronics and telecom industries in the next decade, based on rising household income and younger consumers’ trade-ups.
Semi consumption continues to shift to China, driven by both the outsourcing from global OEMs and the increasing market share of China’s equipment makers.
What Does it Take to Win in China?
Distribution and technology
China Mobile Internet Users Growing Rapidly
China Mobile only: net subscription add
0%
10%
20%
30%
40%
50%
60%
70%
Jan-
06
Mar
-06
May
-06
Jul-0
6
Sep-0
6
Nov-0
6
Jan-
07
Mar
-07
May
-07
Jul-0
7
Sep-0
7
Nov-0
7
Jan-
08
Mar
-08
May
-08
Source: Morgan Stanley Research.
Semi Consumption Shifting to China
0
50
100
150
200
250
300
350
2005 2006 2007 2008 2009 2010E 2011E 2012E 2013E
Se
mi c
on
sum
ptio
n (
US
$B
)
-15%
-10%
-5%
0%
5%
10%
15%
20%
25%
30%
35%
40%
Y/Y
gro
wth
China AP ex-China
Rest of world China semi consumption growth
Total semi consumption growth
Source: Morgan Stanley Research.

M O R G A N S T A N L E Y R E S E A R C H
32
September 20, 2010The China Files
Top Pick: Marvell SemisMRVL, $17.32
Sanjay Devgan
Riding the Wireless Wave Comments from management
Exposure Today
Smart phones opportunity
Marvell makes communication, storage, and consumer silicon chips for application across many platforms. Late last year the company won the rights to supply 3G network TD-SCDMA chips to China Mobile, the largest mobile carrier in the world, for use in the mass market O-Phone smart phone, presenting a 20%-30% growth opportunity for MRVL’s Chinese operations.
China has the single largest cell phone subscriber base in the world, estimated at 722 million in 2010, and the most net adds globally: China is expected to add 288 million handsets this year and over 360 million annually by 2013. MRVL has just 53% market penetration in China, as compared with 89% in North America, and is poised for growth in the region, especially in the smart phones market. MRVL currently has only 3% smart phone penetration in mainland China, as compared with 27% of the market in the US. MRVL also has an EDGE solution that is applicable to all non-3G handsets within China.
China accounts for 25.7% of MRVL’s global revenue, while the Asia-Pacific region in its entirety contributes 86.7% to company sales (Thailand represents 17.3%, Malaysia 10.7%, and Singapore 8.3%). By contrast, North America is 5.5% of global revenue. We believe that MRVL’s Chinese revenue can grow at a 20%-30% CAGR over the next five years, primarily because of growth in the TD-SCDMA chips segment.
Strategy
Key expansion in TD-SCDMA
Consumer handsets are the key to MRVL’s growth in mainland China. China Mobile has approximately 500 million subscribers and has already begun converting subscribers to the TD-SCDMA standard. We estimate MRVL will sell 10 million TD-SCDMA chips in China this year and 16 million next year. The company has made a concerted effort to invest in the Chinese market, with over 1,000 engineers based in China and operations in Shanghai, Beijing, Hefei, and Shenzhen.
In addition to TD-SCDMA, MRVL has the Armada processor, which will be used in affordable, mass-market tablet computers. MRVL also is competitive in chips used in blue tooth and other handset add-ons, which are becoming increasingly popular with Chinese consumers.
“The one thing we’ve been pretty clear on is: while we have a first mover advantage, and we feel we have a very competitive total solution, this is not an exclusivity. And we fully anticipate that as this gets to be a very significant build program in China in the next several years, we will face some competition. But we think we have enough of a lead that it’s going to put some distance between us and our nearest competitors for that space.” 1
Jeff Palmer, Vice President of Investor Relations
Competition
The leading edge
MRVL's competitors are primarily Asian-based companies that cater specifically to the TD-SCDMA wireless standard, like T3G, Spreadtrum, and Mediatek. These companies will find it difficult to match MRVL’s diversity of product offerings—Bluetooth, wi-fi, power management, and apps processors—and the price advantage that bundling them would provide. Besides this, MRVL has the majority (more than 90%) of the handset design wins for China Mobile's O-Phone.
1FactSet, UBS Global Technology and Services Conference transcript, July 9, 2010.
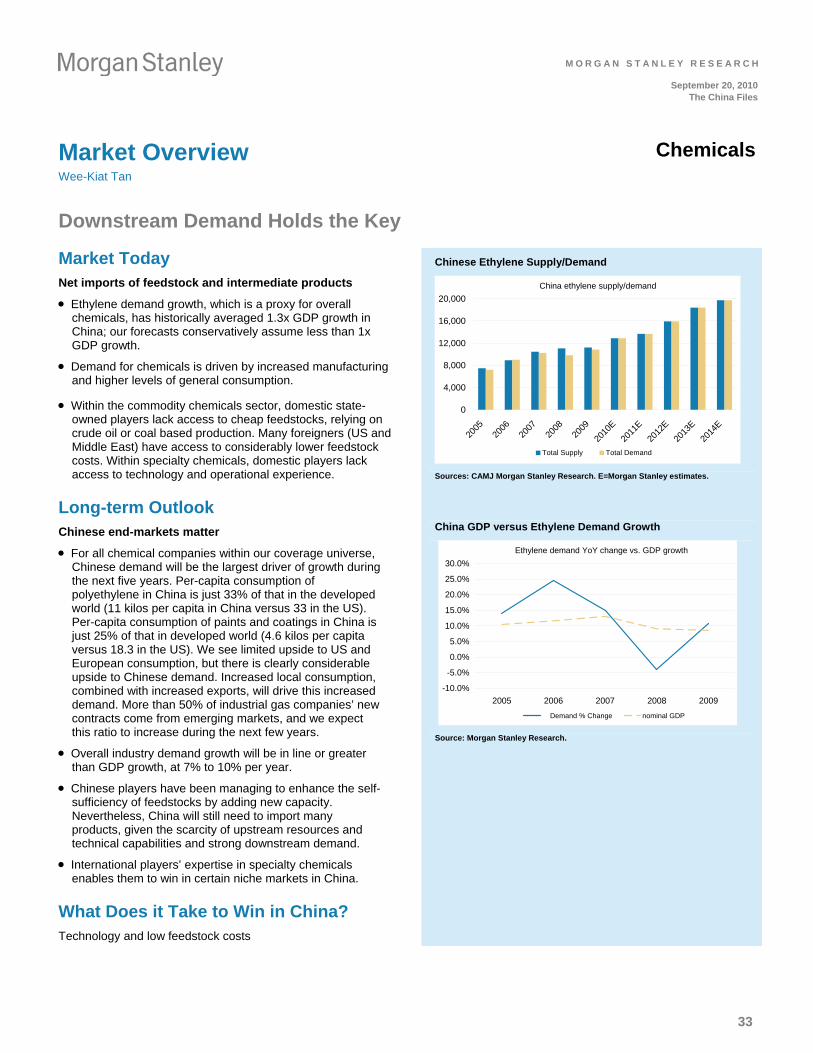
M O R G A N S T A N L E Y R E S E A R C H
33
September 20, 2010The China Files
Market Overview ChemicalsWee-Kiat Tan
Downstream Demand Holds the Key
Market Today
Net imports of feedstock and intermediate products
Ethylene demand growth, which is a proxy for overall chemicals, has historically averaged 1.3x GDP growth in China; our forecasts conservatively assume less than 1x GDP growth.
Demand for chemicals is driven by increased manufacturing and higher levels of general consumption.
Within the commodity chemicals sector, domestic state-owned players lack access to cheap feedstocks, relying on crude oil or coal based production. Many foreigners (US and Middle East) have access to considerably lower feedstock costs. Within specialty chemicals, domestic players lack access to technology and operational experience.
Long-term Outlook
Chinese end-markets matter
For all chemical companies within our coverage universe, Chinese demand will be the largest driver of growth during the next five years. Per-capita consumption of polyethylene in China is just 33% of that in the developed world (11 kilos per capita in China versus 33 in the US). Per-capita consumption of paints and coatings in China is just 25% of that in developed world (4.6 kilos per capita versus 18.3 in the US). We see limited upside to US and European consumption, but there is clearly considerable upside to Chinese demand. Increased local consumption, combined with increased exports, will drive this increased demand. More than 50% of industrial gas companies’ new contracts come from emerging markets, and we expect this ratio to increase during the next few years.
Overall industry demand growth will be in line or greater than GDP growth, at 7% to 10% per year.
Chinese players have been managing to enhance the self-sufficiency of feedstocks by adding new capacity. Nevertheless, China will still need to import many products, given the scarcity of upstream resources and technical capabilities and strong downstream demand.
International players’ expertise in specialty chemicals enables them to win in certain niche markets in China.
What Does it Take to Win in China?
Technology and low feedstock costs
Chinese Ethylene Supply/Demand
China ethylene supply/demand
0
4,000
8,000
12,000
16,000
20,000
2005
2006
2007
2008
2009
2010
E
2011
E
2012
E
2013
E
2014
E
Total Supply Total Demand
Sources: CAMJ Morgan Stanley Research. E=Morgan Stanley estimates.
China GDP versus Ethylene Demand Growth
Ethylene demand YoY change vs. GDP growth
-10.0%
-5.0%
0.0%
5.0%
10.0%
15.0%
20.0%
25.0%
30.0%
2005 2006 2007 2008 2009
Demand % Change nominal GDP
Source: Morgan Stanley Research.

M O R G A N S T A N L E Y R E S E A R C H
34
September 20, 2010The China Files
Top Pick: Dow Chemical ChemicalsDOW, $26.17
Paul Mann
Dow Products a Mainstay of China Economy Comments from management
Exposure Today
Real value in the global plastics value chain Within China, Dow operates in plastics, licensing, and a broad array of chemicals. Its
products touch nearly every part of the economy—from plastic bottles and bags to paint and wiring. In 2008, China became the biggest global consumer of basic plastics (which account for 30% of Dow’s sales), and over the next three years, Chinese per-capita plastic consumption will likely grow another 40%. This secular demand shift will likely drive plastics prices higher worldwide—not just in China—and enhance Dow’s margins.
Global petrochemical prices (and margins) are set by supply/demand ratios and relative feedstock costs. The global market is currently in oversupply, but US producers are still generating attractive margins, driven by cheap feedstocks. Chinese producers will operate at a much higher variable cost, as we believe their feedstock (naphtha or syngas) will be significantly more expensive than Dow’s and China will continue to set the global floor in ethylene/ polyethylene pricing. While consensus is bearish on petrochemical demand (given the uncertainty over OECD GDP rates), we believe we are set to enter a period of strong demand, driven by China, and this demand will result in the supply/demand ratio tightening, leading to higher prices and margins.
Strategy
Leveraging global feedstock advantage In addition to its concentration of upstream production in cost-advantaged North
America, Dow operates 20 downstream manufacturing plants in China. This number will likely continue to grow as the company sells more into Chinese end-markets (the company tends to match revenues with production to create natural currency hedges).
Like all companies within the Chemicals sector, China offers Dow strong organic growth in higher-margin businesses, like advanced materials and performance products and systems, where Dow can leverage its breadth of technologies to offer unique solutions for high-value manufactured products. As Chinese internal consumption grows, Dow will benefit from increased demand in markets like automotive and consumer electronics.
Dow’s US-based commodity plastic business will likely do well, regardless of US and European economic strength (unlike many of Dow’s other businesses, such as electronics materials, coatings, and infrastructure, which will require a strong developed market consumer). Driven by attractive feedstock costs, Dow has assets in the most attractive (Middle East), second most attractive (Alberta), and third most attractive (US) regions, and petrochemical producers in these regions will likely continue to produce and export globally regardless of local demand.
“The story for emerging geographies is strong growth continuing at a robust pace. Volume growth of 27% versus one year ago, with China, Brazil, Eastern Europe and Southeast Asia and India leading the way. In fact, volume growth, as we have already said, in Greater China was an impressive 46% [and] driven primarily by growing domestic consumption.” 1
“Another advantage of Dow, we pretty much are in the high-end polyethylene business with our solution polyethylene business. It serves premium uses, differentiated uses. Ninety percent of what we sell in China in terms of polyethylene is all high-end, very differentiated polyethylene consumption that actually there is no real alternative to us to supply it." 1
Andrew N. Liveris, Chairman and CEO
Competition
Feedstock advantage likely sustainable In petrochemicals the global players compete purely on price, and profitability is based
on containing input prices. Dow is relatively well positioned because it produces plastics in the three cheapest regions globally (Middle East, Alberta, and the US), where natural gas prices (a main input price) are low. We expect this dynamic to continue for the foreseeable future, with below-trend ethane prices keeping Dow very competitive and operating at high utilization rates.
In commodity chemicals Dow competes globally with a number of companies—BASF, LyondellBasell, SABIC, and Formosa Petrochemical—but there are no significant local players in China. Within Specialty Chemicals, Dow competes with an even larger group of companies. We believe Dow is differentiated with respect to its Chinese opportunities by its feedstock advantage in Basic Plastics, which we believe is sustainable.
1FactSet, Goldman Sachs Basic Materials Conference transcript, June 2, 2010

M O R G A N S T A N L E Y R E S E A R C H
35
September 20, 2010The China Files
Market Overview AgriChemicalsJeremy Chen
Solid Long-Term Demand for China Fertilizer
Market Today
Demand rebounds
After falling 4% per year in 2008-2009, demand for fertilizer in China should bounce back in an effort to maintain soil nutrients and raise crop yields as regional demand for grain increases.
The main fertilizers used in China are nitrogen, phosphate, and potash. China has an oversupply of nitrogen and phosphate but an undersupply of potash; this lack of supply leaves imports as the primary source of this type of fertilizer.
Long-term Outlook
Potash growth takes the lead
China demand for fertilizer will remain strong, given the growing population and the country’s changing diet. Our proprietary China fertilizer demand model assumes a 3.5% CAGR in China from 2010-2018, with potash demand likely to grow the fastest, at 10.2%.
We believe that potash will be among the strongest products in 2010-11, after two years of severe depletion in the soil nutrients of China’s cropland.
What Does it Take to Win in China?
Potash production capability, rights to import potash, extensive distribution network, and branding
China’s Fertilizer Demand
0
10
20
30
40
50
60
70
1979
1982
1985
1988
1991
1994
1997
2000
2003
2006
2009
2012
E
mn tons
-10%
-5%
0%
5%
10%
15%
20%
25%
Total China Fertilizer Consumption YoY
Sources: CEIC, Morgan Stanley Research. E—Morgan Stanley estimates.
Shrinking Cultivated Land Area and Increasing Fertilizer Consumption
119
120
121
122
123
124
125
126
127
2002
2003
2004
2005
2006
2007
2008
2009
E
2010
E
2011
E
2012
E
mn ha
0
10
20
30
40
50
60
70
mn tons
Cultivated Land Area (LHS) Fertilizer Consumption (RHS)
Per capita arable land is diminishing
Source: CEIC, Morgan Stanley Research. E-Morgan Stanley estimates.

M O R G A N S T A N L E Y R E S E A R C H
36
September 20, 2010The China Files
Top Pick: Mosaic AgriChemicalsMOS, $57.59
Vincent Andrews
Mosaic to Fill Global Demand Comments from management
Exposure Today
China demand takes off
US-based Mosaic is one of the world’s largest fertilizer companies by capacity, producing two primary crop nutrients—potash and phosphate. Potash is a substantial earnings driver of the company (about 70%) and has the highest growth potential. According to academic studies, potash consumption is likely to grow in the key emerging markets (China, India, and Brazil) in order to improve regional crop yields and nutrient balances in the soil. China’s annual potash consumption needs to triple from its 2008 level (an increase of almost 18 million tons) in order to achieve the recommended levels to reach the above objectives.
Currently China accounts for ~1% of direct sales. However, MOS’s total exposure to China is higher due to the significant impact that China has on global pricing. We expect MOS’ revenues from China to grow at a CAGR of about 34% from 2011 to 2015, a significant rise from the 2002-2007 CAGR of about 11%. The US accounts for approximately 30% of direct sales, but we expect much slower growth in the US, where normal application rates have already been achieved: Stateside, we expect about 1% volume growth and some pricing growth.
Our outlook on the company takes into consideration China’s burgeoning population and the rising domestic demand for meat, fruits, and vegetables. More food for more people must come from less land per person, and fertilizer is an important means to that end. The government’s efforts to reduce the disparity between rural and urban food consumption will positively affect food production and demand—and lead to greater use of potash to maximize production. Over the long term, we expect China to import about 75% of its annual potash requirements.
Strategy
Expansion projects
A few years ago MOS began investing in expansion projects to increase capacity, and by the end of 2020, these projects will nearly double the company’s operational capability to about 16 million tons. While the company does not have any current plans to open new mines—development of a new mine takes at least seven years—we expect that MOS’ projects will represent more than a third of the world’s constructed capacity over the next decade.
“China continues to import significant amounts of soybeans, and this year they’re starting to import noticeable amounts of corn. Our reports are that China will continue to be importing corn at ever-increasing rates in the years ahead, and they know that they have to get their…crop nutrient balances back in line. The government has sent out thousands of agronomists throughout the country to get this message back to the farmers. So the longer answer to a simple question, Are the potash production numbers going up? No, we don’t see that. And two, do their potash consumption numbers have to go up? Yes, absolutely.” 1
James Prokopanko, President
and CEO
Competition
Leading global producer
China consumes approximately 10 to 12 million tons of potash fertilizer annually—a number that will likely change as China increases its grain production—but it can only produce about four million tons domestically. Of the remaining eight million tons that must be imported, 25%-30% is imported from Canpotex, a marketing exporter that is about 40% owned by MOS. Since MOS is one of the world’s leading potash producers (providing about 14% of global capacity) with few local competitors, we believe that MOS will be well positioned to continue its growth trajectory in China. Looking forward, we project that 75% of expansion in the region will come from MOS and its competitor Potash Corp., both of whom hold ownership stakes in the Saskatchewan potash mines.
1FactSet, 4Q2009 earnings call transcript.

M O R G A N S T A N L E Y R E S E A R C H
37
September 20, 2010The China Files
Market Overview Aerospace & DefenseAllen Gui
Business Jet Segment to Boom
Market Today
Still lagging demand
Demand in civil aviation has expanded dramatically in China in the past decade. But the overall market is still in the early stages and could develop further: Per capita airplane capacity is only at about 3% of the US level.
RPK (revenue passenger kilometer) has been growing at a CAGR of approximately 20%. China’s economic growth, rising household income, and increased leisure time are the three drivers behind the growth.
Foreign companies produce most of the aircraft in the civil aviation sector, and local manufacturing remains underdeveloped. Order books are split almost equally between Boeing and Airbus.
Long-term Outlook
Fast growth
International aircraft suppliers generally estimate China’s fleet size to grow at a CAGR of about 6% for the next decade.
The business jet market should expect much higher growth as this underdeveloped subsector begins to grow. In the US, more than 20,000 companies own or operate about 10,000 business jets, as compared with China, where about 200 Chinese companies own or operate approximately 50 business jets. If the number of Chinese companies expands to 3,000 by 2020, and the penetration rate reaches current US levels, China could have 1,500 jets, implying a CAGR of 40%. Also, according to estimates made by Teal Group, the fleet size of business jets in China could reach as many as 1,200 in the next decade.
What Does it Take to Win in China?
China Air Traffic Growth
China Air Freight Traffic Vs Export
-40%
-20%
0%
20%
40%
60%
80%
100%
Jan-
07
Apr-0
7
Jul-0
7
Oct-07
Jan-
08
Apr-0
8
Jul-0
8
Oct-08
Jan-
09
Apr-0
9
Jul-0
9
Oct-09
Jan-
10
Apr-1
0
Jul-1
0
YoY % Chg
RFTK Export Source: Morgan Stanley Research. RPK = revenue passenger kilometer; RFTK = revenue freighter ton kilometer.
China GDP versus RPK Growth
-20%
-10%
0%
10%
20%
30%
40%
50%
1980
1982
1984
1986
1988
1990
1992
1994
1996
1998
2000
2002
2004
2006
2008
0%
2%
4%
6%
8%
10%
12%
14%
16%
RPK Real GDP
RPK %YoY Chg Real GDP %Chg
Source: Morgan Stanley Research.
Technology, safety, local service capabilities, and a brand name in the business jet segment

M O R G A N S T A N L E Y R E S E A R C H
38
September 20, 2010The China Files
Top Pick: General Dynamics Aerospace & DefenseGD, $61.27
Heidi Wood
Wealthy Chinese Ready for Gulfstream Jets
Exposure Today
Business jets in demand
General Dynamic’s business jet segment, Gulfstream, accounts for about 20% of profits currently. We expect that number will grow to more than 30% by 2012, with the business jets segment of the GD portfolio showing the most top-line and earnings growth over the next three to four years. Historically, North American/European markets have represented drivers of growth for Gulfstream, but emerging markets—China, for the most part—will offer significant opportunity for growth over the next several years.
China has an installed base of about 100 business jets for a population of 1.3 billion (as compared with approximately 9,600 jets in North America). Recent government initiatives that should increase business jet demand include reduced airspace restrictions; lower tariffs, from 23% to mid-single-digits; and plans to expand airport infrastructure (by 2020 China’s General Administration of Civil Aviation will add 97 airports to the 150 already accessible to business jets in China).
Speaking conservatively, China’s fleet will increase at least seven-fold over the next decade, though we believe the actual number is well north of that, at more than 1,000. To put it in context, Gulfstream delivered about 100 jets in 2008 with no meaningful contribution from China.
Strategy
Improved service
Gulfstream continues to improve its service footprint throughout China by signing service agreements—most recently with Deer Jet—that help owners/operators to maintain and operate a Gulfstream business jet.
Gulfstream management remains focused on the Chinese market and recognizes the region as key to future growth. Gulfstream represents more than 50% of the global market share of the large/super-large category, and there’s little reason to expect dissimilar figures from Chinese buyers.
Competition
Best-in-class brand
Gulfstream most likely will have an outsized share of the market over the next several years, with near-term demand concentrated in the high-end /large cabin segment, where Gulfstream is recognized as best-in-class.
Chinese high-net-worth individuals have, in general, been predisposed towards strong brand names in the consumer luxury goods market, and Gulfstream is widely recognized as the premier brand in the world of executive aviation, making it a likely contender for the HNW market in China. Within weeks of the Chinese government’s change in flight restrictions, Chinese customers had bought five Gulfstream large-cabin aircraft.

M O R G A N S T A N L E Y R E S E A R C H
39
September 20, 2010The China Files
Market Overview IndustrialsKate Zhu/Helen Wen
Demand for Foreign Products to Rise
Market Today
Local players dominate
China’s industrial sector has been growing at a CAGR of about 15% in recent years because of the fast pace of industrialization and strong fixed-asset investment.
Equipment for the energy, resources, and power subsectors registered the highest rates of growth.
Foreign players have advantages in a few high-end segments but are less competitive in the mid-/low segments because of their significantly higher costs.
The major players in China’s power equipment industry are three local providers: Dongfang Electric, Shanghai Electric, and Harbin Power, which claimed total market share of 63.9% in 2009.
Long-term Outlook
Foreign players to benefit from industrial upgrade
We think the industrial sector should grow at least 10% per year in the next decade. Subsectors such as energy and resource equipment, advanced power transmission equipment, and industrial automation should see much better growth.
Foreign companies should be able to seize opportunities in areas where domestic players have not gained technological acumen, especially in industrial automation and advanced power transmission equipment.
What Does it Take to Win in China?
Local relationships and technology
Weight of Industry Value Added in GDP
20%
25%
30%
35%
40%
45%
50%
1995
1996
1997
1998
1999
2000
2001
2002
2003
2004
2005
2006
2007
2008
0
2000
4000
6000
8000
10000
12000
14000
Value Added of Industry, Rmb bn (right) as % of GDP
Source: Morgan Stanley Research.

M O R G A N S T A N L E Y R E S E A R C H
40
September 20, 2010The China Files
Top Pick: Emerson Electric Industrials
EMR, $50.05
Scott Davis
Emerson Electric—a Long-Term Commitment in China Comments from management
Exposure Today
A vast array of businesses
Emerson already has a well-diversified earnings base within China. Key segments include network power/embedded computing (48% of total Chinese sales), process management (30%), climate technology (12%), and industrial automation (8%). At 11% of the company’s total revenue, China is EMR’s third-largest market, behind the US at 45% of total revenue and Europe/Asia at 21%.
EMR looks to grow its Chinese revenue at between 12%-15% CAGR over the next five years. This compares with 6%-8% growth for the entire company. By 2015, the percentage of company revenue from China may reach the high teens.
EMR’s growth outlook is leveraged into a number of key areas within China. Rising consumer incomes, urbanization, and residential construction will boost EMR’s climate division (air-conditioners and heaters), and the rise in commercial construction—infrastructure, manufacturing facilities, and corporate offices, with the attendant need for data center power management and automation systems—will bolster EMR’s network power and process management divisions.
Strategy
No change to a successful strategy
EMR was early into China, and it has the highest exposure to China in its group. The company has about 25 manufacturing facilities in China and more than 2,300 engineers dedicated to local research and development specifically for the Chinese market. EMR prefers to invest directly in China rather than to use joint ventures.
The company plans to expand its manufacturing facilities and to enhance its sales and service capacities so as to be more closely aligned with customers. In EMR’s latest earnings call, management stated plans to add capacity in climate tech, process management, and other industrial and storage businesses within China. China remains a top priority for company management.
Competition
A long history in the region
EMR’s competitors tend to be other multinational players, not Chinese-sourced competition. Its competitors vary by product, but include Honeywell International, Eaton, and Johnson Controls. EMR, which has operated in the area for a longer time than have its competitors, enjoys a competitive advantage over newcomers through its established relationships and businesses.
“We’ve been there [in China] 31 years, and we have a very good relationship. China respects IP. If you actually have the patent protection and you own the patent protection, you filed it and protect it, they will support you. We are 29 for 30 in all our patent litigation there. And they know it’s an economic weapon, so they’re going to- I feel very comfortable what we’re trying to do right now in trying to protect our growth initiatives. And if you don’t play, you will not be playing in China in 10 years from now.” 1
David Farr, Chairman, CEO and
President
1FactSet, 3Q2009 earnings call transcript.

M O R G A N S T A N L E Y R E S E A R C H
41
September 20, 2010The China Files
Market Overview MachineryKate Zhu
Growing Demand for Foreign Players
Market Today
Domestic players dominate
Machinery sales in China generally follow fixed-asset investment in various industries, in particular real estate, transportation infrastructure, and energy exploration. Overall industry sales have been growing at a 15%-20% CAGR in the past few years.
Foreigner players generally focus on the high end of the market, such as excavators, while demand remains tilted toward the low end, where domestic players offer value-for-money products with good service.
Foreign players have a technical advantage with the higher-end products because of their more comprehensive networks, but domestic competition still provides a challenge.
Long-term Outlook
More diversified demand, more opportunities
Overall industry growth will be at least 10% tracking GDP and fixed-asset investment growth. We see highest growth potential in the concrete machinery and construction crane sectors, where upgrade demands are emerging quickly.
Foreign companies should benefit as the sector evolves into a more sophisticated and diversified phase. As the industry evolves we expect to see more emphasis on low emission machinery, and product reengineering will benefit the more experienced foreign players.
What Does it Take to Win in China?
Local relationships and technology
Excavator Sales versus Real Estate Investment
0%
5%
10%
15%
20%
25%
30%
35%
40%
45%
Jul-0
5
Jan-
06
Jul-0
6
Jan-
07
Jul-0
7
Jan-
08
Jul-0
8
Jan-
09
Jul-0
9
Jan-
10
Jul-1
0
-100%
-50%
0%
50%
100%
150%
200%
250%
300%
China Real Estate Investment YoY (LHS) Excavator Industry Sales YoY (RHS)
Source: Morgan Stanley Research.
Excavator Sales versus Coal Mining Volume
-20%
0%
20%
40%
60%
80%
100%
Jul-0
5
Jan-
06
Jul-0
6
Jan-
07
Jul-0
7
Jan-
08
Jul-0
8
Jan-
09
Jul-0
9
Jan-
10
Jul-1
0
-100%
-50%
0%
50%
100%
150%
200%
250%
300%
Coal Mining Investment YoY (LHS) Excavator Sales YoY (RHS)
Source: Morgan Stanley Research.

M O R G A N S T A N L E Y R E S E A R C H
42
September 20, 2010The China Files
Top Pick: Caterpillar MachineryCAT, $72.13
Rob Wertheimer
Direct Opportunity with Two-Brand Strategy
Exposure Today
Rising sales share despite falling market share
Caterpillar sells the premium brand in China and has more recently expanded in a second, domestic-branded product line, SEM. CAT’s market share has fallen in recent years, mostly on capacity constraints, but also as the market has increasingly shifted toward lower-end product. The company recently reiterated its determination to win in China, adding both capacity and product. At this stage, China captures only 5%-7% of global sales, as compared with 22% for all of Asia/Pacific, 38% in North America, 28% in EAME, and 12% in Latin America. Mining globally is around 15% of sales, fueled by demand from China.
The dramatic run-up in construction machinery sales this year has set a high bar for CAT and could result in only modest sales increases in coming years: CAT might not be able to repeat its first-half 2010 performance, when wheel loader sales surged 65% year-over-over and excavator sales jumped 88%. But China’s infrastructure needs will remain significant over the next decade, with the country’s ongoing plans to build a high-speed railway, ultra-high-voltage power transmission network, nuclear power plants, and sewage- and solid-waste treatment plants. While CAT is reasonably well positioned to leverage this growth, share gains will be difficult, given strong competition from local Chinese producers that are expanding technology, improving manufacturing techniques, pricing aggressively, and taking advantage of good local distribution and strong political support.
Strategy
Extended reach through dealerships
CAT’s strategy is to grow organically in its premium-priced/high-quality name-branded products while expanding distribution, production, and, possibly, its product line in locally branded product. Its dealer network also has been refocused with increased incentives and competition. CAT believes in long-term growth opportunity and is investing in capacity accordingly, after failing to keep up with the most recent surge.
Competition
Price, not brand/quality, is the key to rising share
China’s construction equipment market at present is dominated by low-cost and unspecialized equipment. In the long term the market should move away from a singular excavator and wheel loader focus into more full equipment lines, where CAT thrives. Shorter term, CAT’s local brand needs to be more successful in order to serve a customer base that focuses more on value. Competitors are currently mostly limited to China, but they are growing fast and have big ambitions.
1FactSet, analyst meeting transcript, August 19, 2001.

M O R G A N S T A N L E Y R E S E A R C H
43
September 20, 2010The China Files
Market Overview TransportationEdward Xu
A Market That Needs Differentiation
Market Today
Strong market expansion in recent years
China saw 1.9 billion of express mail services processed in 2009, a 24% CAGR from 2007 to 2009.
The strong volume drivers in this sector are foreign trade (imports/exports), on-line shopping, and e-commerce.
The domestic express segment is fragmented, with a growing number of small domestic express operators.
The international express segment is highly concentrated, with about 80% of the market dominated by the major international players FedEx, UPS, DHL, and TNT.
Long-term Outlook
Sustained demand growth
International express should be able to grow at rate of 20%+ year-over-year in the next decade given the potential import demand led by domestic consumption upgrade and renminbi appreciation, and the import demand by Chinese firms.
Foreign express majors would continue to dominate the market shares given advantages in their global networks.
What Does it Take to Win in China?
Low cost, local connections, a strong commitment of financial resources, and an ability to adapt to the strategic changes of multinational companies in China
China Air Cargo Carried and Express Mail Services Growth
-40%
-20%
0%
20%
40%
60%
80%
Jan-
09
Mar
-09
May
-09
Jul-0
9
Sep-0
9
Nov-0
9
Jan-
10
Mar
-10
May
-10
Jul-1
0
YoY%
No of Express Mail Services Air Cargo Carried
Sources: CEIC, Morgan Stanley Research.
China Export and Import Growth
-45%
-25%
-5%
15%
35%
55%
75%
95%
Jan-
03
Jul-0
3
Jan-
04
Jul-0
4
Jan-
05
Jul-0
5
Jan-
06
Jul-0
6
Jan-
07
Jul-0
7
Jan-
08
Jul-0
8
Jan-
09
Jul-0
9
Jan-
10
Jul-1
0
CN: Export fob CN: Import cif
Source: Morgan Stanley Research.

M O R G A N S T A N L E Y R E S E A R C H
44
September 20, 2010The China Files
Top Pick: FedEx Transportation FDX, $85.94
William Greene
Global Trade Drives Outlook Comments from management
Exposure Today
Strong international presence
FedEx’s primary China business is international express package and freight services, which connect China’s output with its major trading partners.
We estimate that Asian currencies represented about 7%-8% of the company’s total fiscal year 2010 revenue (ended May 2010); 27% of total corporate revenue comes from international sources. Historically, international priority shipments have grown in the double digits, with Asia priority shipments capturing the most growth: In the most recent quarter, international priority shipments rose 23% overall, while Asia shipments grew 41%. We estimate a five-year China CAGR of more than 15%, assuming no major acquisitions.
FDX is leveraged to continued globalization and world trade. Global trade tends to grow at a 1.86 multiple to global GDP. We estimate growth to stay on track next year at a rate of 4.2% globally and 9.5% in China specifically, meaning that the rate of global trade growth could hit 7.8% in 2011.
Strategy
Focus on international shipping with Boeing 777
FDX already has over 6,000 employees serving 400 cities in China; since February 2009 its primary Asia-Pacific hub has been in Guangzhou, China. The company sees China as the biggest growth opportunity globally and is adding to its flights out of China, most notably with new Boeing 777s.
Through fiscal year 2013 the company expects delivery of 16 new Boeing 777 aircraft for direct service between China and major world markets, primarily the US and EU. This direct service will cut total transport time by one to three hours per flight and allow for later cut-off times since planes will no longer need to stop for refueling. The B777F also will drive down unit costs given its greater payload capacity, lower operating costs, and an 18% improvement in fuel efficiency over planes in the existing fleet.
Domestic delivery service in China also is a potential opportunity, but certain current governmental restrictions make this a longer-term aspirational goal.
“…the largest economy in the world is the economy of global trade, and the fastest growing part of that economy is the movement of high tech and high value-added items, and those things are increasingly moving by door to door Express that is required by this fast cycle, where we live in, where everybody can go on the internet and sell and source any product to any other person and on the planet that also has an internet connection, and we sit right in the middle of that…. In my mind, that very large trend of the emergence of these middle classes in India and China and Brazil that are now integrated into this trading nation of global trade is something that’s pretty profound, and people have an undue sense of pessimism relative to what’s actually happening out there, in my opinion.” 1
Frederick Smith, Chairman, President, and CEO
Competition
The infrastructure edge
There are four major international players in the parcel market—UPS, FDX, TNT, and DHL. FDX’s competitive advantage comes from its large and still-growing Chinese air express infrastructure and ongoing investment in its fleet.
1FactSet, 4Q2010 earnings call transcript.

M O R G A N S T A N L E Y R E S E A R C H
45
September 20, 2010The China Files
Market Overview ShippingEdward Xu
Secular Demand with Cyclical Dynamics
Market Today
Flourishing, thanks to soaring trade
Annual growth rates of about 20% in both exports and imports have bolstered shipping demand in China.
The coastal shipping market is open only to Chinese vessels; foreign tankers lose market share to Chinese carriers under this policy.
Long-term Outlook
Secular demand ahead
China will remain a “factory for the world,” producing a surplus of manufactured goods and supporting outbound shipping volume growth.
Higher domestic income level with renminbi appreciation could drive consumption and the demand for imports.
China’s hunger for energy and commodities should sustain the shipping demand for dry bulk (iron ore, coal, natural gas, etc.) and oil, to the benefit of foreign shipping liners.
We believe that China’s import of raw materials could sustain a 20% year-over-year growth rate for the next 10 years, which would outpace the country’s export.
What Does it Take to Win in China?
Government and client relationships, and cost controls
China’s Foreign Trade Throughput Growth
-
2.0
4.0
6.0
8.0
10.0
12.0
Jan-10 Feb-10 Mar-10 Apr-10 May-10 Jun-10 Jul-10
0%
5%
10%
15%
20%
25%
30%
35%
40%
Container Outbound (mn TEU) YoY%
Sources: MOC, CBC, Morgan Stanley Research.
Imports of Major Commodities
-40%
-20%
0%
20%
40%
60%
80%
100%
Jan-
07
Apr-0
7
Jul-0
7
Oct-07
Jan-
08
Apr-0
8
Jul-0
8
Oct-08
Jan-
09
Apr-0
9
Jul-0
9
Oct-09
Jan-
10
Apr-1
0
Jul-1
0
YoY%
-100%
0%
100%
200%
300%
400%
500%
600%
Iron Ore & Concentrates Crude Petroleum Oil Coal(RHS)
Sources: CEIC, Morgan Stanley Research.

M O R G A N S T A N L E Y R E S E A R C H
46
September 20, 2010The China Files
Top Pick: Diana Shipping ShippingDSX, $12.33
Ole Slorer
Established Leader Positioned for Booming Trade Comments from management
Exposure Today
Focus on Chinese-dominated iron ore and coal trade
Diana Shipping owns a fleet of 10 Capesize and 14 Panamax dry bulk vessels, which are primarily focused on transporting iron ore and coal. The company is a majority investor in a joint venture that owns two containerships, used in the east-west trade of finished goods.
Approximately 70% of global iron ore exports are heading to China, making Chinese imports the single most important driver for the iron ore trade, which represents about 30% of the global dry bulk shipments. We expect global iron ore exports to grow by 14% in 2010 and 8.8% in 2011, becoming the fastest growing segment in the dry bulk shipping sector. Chinese imports out of Brazil especially will have a significant impact on shipping demand, since the travel distance between these two countries is longer than that between China and other exporting countries like Australia and India.
Although Chinese imports are only 14% of the coal market, the emergence of China as a net importer has increased its significance for coal trade. Global coal exports are expected to grow by 10% in 2010 and 6.3% in 2011, with China being responsible for more than a third of this growth.
Based on the current fleet, DSX operating cash flow is expected to be about $175 million per year, or 17.5% cash flow yield. However, being net debt free, the company is in position to double its fleet without new equity, effectively doubling its earnings.
The main driver for the dry bulk sector is global economic growth and the demand for raw materials from Asian economies—China in particular. Dry bulk shipping is highly dependent on demand for iron ore and coal by Chinese steel mills, thermal coal by Chinese coal-fire power plants, and inter-coastal trade among various Asian countries.
Strategy
Low leverage, strong customer relationships, and high acquisition power
DSX’s strategy is to maintain maximum flexibility in terms of acquisition capacity so that the company can take full advantage of market volatility. The company has contracted a significant portion of its new charters with major iron ore producers and commodity traders (BHP, Cargill, NYK, Louis Dreyfus, and Bunge), securing a large part of its revenue. Its existing charters expire at different times, giving them a solid mix of chartered (fixed) and spot revenue. This provides stable cash flow, as well as the ability to capture any upside during strong freight rate environments.
“We face an environment in which on the one hand we have improvement in world economies should lead to greater demand for dry bulk shipping services, yet on the other hand the supply side of the industry is likely to place continued pressure on shipping rates and vessel values.” 1
Simeon P. Palios, Chairman and CEO
“…The sentiment in China as regards real estate construction has improved, with the acceleration of social housing construction and economic growth seems to be stabilizing, if not picking up. This has led to an improvement in rates…There is a genuine willingness, it seems, by the government in China to start again encouraging the building of social housing and cities nearer where the rural population is, as opposed to now just in the coastal areas.” 1
Anastasios C. Margaronis, President
Competition
Strongest balance sheet among peers
DSX is the company with the strongest balance sheet in the sector, owning $1 billion worth of net debt-free assets, compared to an average of 55%-60% for its peer group. The company holds around $400 million in cash reserves that, together with its unlevered balance sheet, gives DSX over $1 billion of acquisition power without need of external equity.
1FactSet, 2Q2010 earnings call transcript.
M O R G A N S T A N L E Y R E S E A R C H
47
September 20, 2010The China Files
Runners-Up
Apparel
Ralph Lauren RL, $85.83 Chi H. Lee
RL began operating directly in China in 1Q10, after bringing its Southeast Asia-licensed operations in-house. Southeast Asia will represent just about 3% of RL’s consolidated sales in fiscal year 2011, but there is attractive long-term potential—given the company’s global brand recognition, premium positioning, and its established strategy for international expansion—to gain local operating knowledge through distribution partners, take ownership, increase retail distribution, and, finally, introduce a tiered pricing strategy.
Casinos & Gaming
Las Vegas Sands LVS, $32.28
Mark Strawn LVS currently generates 45% of its EBITDA from Macau (30% from Singapore and 15% from Las Vegas). But unlike the majority of its competition in Macau, LVS focuses on the mass-market customer as opposed to the VIP segment of the business and other non-gaming segments. As a result, LVS’s revenue share is low, at 20%, but the company’s EBITDA bests competitors’, at approximately 40%. Long term, with its mass focus and a project pipeline that includes a least one more major property, LVS should benefit from the mainland government’s commitment to further development of Macau as the mass leisure hub in the Pan Pearl River Delta.
Starwood Hotels & Resorts Worldwide HOT, $51.04 The Asia-Pacific region accounts for 18% of HOT’s fee business, and 43% of HOT’s Asia-Pacific hotels are in China. The company sees long-term secular growth in its emerging markets, with China being at the forefront of this opportunity. It currently has over 50 hotels in China, with another 80 under construction.
Restaurants
McDonalds MCD, $74.71 John Glass
MCD has about 1,200 units in China and is currently adding approximately 175 units per year. Its Chinese operations contribute about 3% to overall consolidated operating profits for the company. The plan is to continue to grow at this clip or faster over the next three to five years, depending on the availability of franchisees. China achieved an almost 6% increase in comparable sales for the second quarter 2010 as signs of recovery in the marketplace continues to emerge. Product quality in China is supported by customer satisfaction scores that are regularly among MCD’s best globally. The company has opened 48 restaurants this year and is on track to open between 150 and 175 for all of 2010. MCD is focusing on differentiating its brand through stronger customer service and enhanced convenience by adding drive-thrus, dessert kiosks and extended hours in its restaurants.
Starbucks SBUX, $25.75 John Glass SBUX has just under 400 units in mainland China and is currently growing stores at a rate of 15% to 20% per year. While the company has not disclosed the country's profit contribution, SBUX has said China is one of its most profitable markets and its single largest growth opportunity. Strategy involves new product offerings, which are localized and tailored to suit the Chinese palate. In China, comparable store sales trends are in the double digits and store profit contribution is among the highest worldwide. Their China strategy involves licensing stores via joint venture while at the same time adding wholly owned stores.

M O R G A N S T A N L E Y R E S E A R C H
48
September 20, 2010The China Files
Pharmaceuticals
Eli-Lilly LLY, $35.70 David Risinger China is LLY’s main focus in emerging markets: In 2009 LLY added 1,000 sales reps there on four lines of business (diabetes, oncology, CNS, and anti-infective). This strategy has paid off: LLY’s growth in the China hospital market caught up to other multinational pharmaceutical companies in the first quarter of 2010, with LLY at 24% versus the sector’s 23%. A year earlier, LLY was at 13% growth against the broader sector’s rate of 20%. The company is increasing both its R&D and manufacturing presence in China.
Merck MRK, $36.52 David Risinger
MRK has relatively weak presence in emerging markets, except Latin America (IMS Health ranks MRK fifth in overall emerging markets and second in Latin America). As part of its plans to invest more in emerging markets, including China, in May 2010 MRK announced that it plans to expand its sales operations in China, and in August 2010, MRK and Sinopharm announced that they may collaborate on promoting and marketing the vaccine Gardasil.
Bristol-Myers Squibb BMY, $27.01 David Risinger
BMY first invested in production facilities in Shanghai about 28 years ago, and China is the company’s primary market among developing economies. Although the company is not divulging any specific information, BMY plans to continue to invest in China operations, research and development, and manufacturing. The company also sees increased sales of its vaccine Baraclude in China.
Medical Devices
Beckman Coulter BEC, $46.07 David Lewis Beckman is a leading provider of laboratory equipment in China, currently enjoying 20% of the $1 billion market and more than 30% growth in the region. Despite recent constraints on hospital capex equipment in the US and Europe, China has continued to push forward on its plan to build 2,000 hospitals in the next three to five years, each with its own laboratory, providing a large customer base for Beckman. Further, market dynamics within laboratory equipment are favorable in China; limited local competition allows for sales of higher-end products that Beckman sells through distributors to small and mid-tier hospitals and directly to larger hospitals. Finally, the market for Life Science tools continues to hold up in China versus its domestic peers, providing another source of upside. The company anticipates more than $300 million in revenue from China in 2010, roughly 10% of total expected revenue.

M O R G A N S T A N L E Y R E S E A R C H
49
September 20, 2010The China Files
Tech Hardware
IBM IBM, $129.43 Katy Huberty IBM has one of the largest exposures to China in the Tech Hardware group. In the last 12 months, Asia Pacific provided 22% of IBM’s revenue. IBM believes the opportunities in the growth markets due to urbanization are significant and estimates that 100 million people are relocating to cities every year. IBM expects revenue growth in its growth markets overall to outpace major markets by at least eight points over the next five years and increase at least one point per year as a share of total revenue. Given China's growth potential and market size, IBM named China as one of 20 countries where it plans to expand beyond the major cities in the next five years. Currently, IBM has 28 branch offices in China, compared with only three in 2000. By 2015, IBM plans to expand to 70 branches.
Chemicals
Industrial Gases (Praxair and Air Products)APD, $81.38
PX, $88.20 Paul Mann During the past 10 to 20 years, US industrial companies have outsourced a considerable proportion of their industrial gas requirements to industrial gas companies, such as Praxair and Air Products. Industrial gas companies can generally supply gases at lower prices, with greater reliability than the industrial manufacturing customer, while generating a 14% to 16% IRR on new capital use to construct manufacturing plants. Greater than 50% of industrial gas companies’ new contracts come from emerging markets, and we expect this ratio to increase during the next few years, given the likely strength of industrial growth and the lack of local competitors (there is only one Chinese supplier). Chinese contracts are generally larger than US contracts have been and generally generate superior returns, albeit with slightly greater risk. Both APD and PX have signed numerous new contracts during the past 12 months in China, and while neither company stands out as differentiated versus the other in terms of their offerings, it is clear in our view that both will generate substantial growth during the next three to five years from China.
Albemarle ALB, $43.25 Paul Mann
Albemarle is one of the world’s leading suppliers of brominated flame retardants, an essential item in most electronic goods and hardware items. Chinese supplies of bromine are depleting at a rapid rate, which has raised local costs of production and seen global bromine prices rise from about $1,000 per ton in 2004 to about $3,000 per ton in 2010. Albemarle is one of two companies globally with a supply of bromine, so Chinese consumption is likely to continue to lead to bromine price inflation and superior margins for Albemarle. On our estimates, Asia Pacific will account for more than 50% of incremental flame retardant revenue growth for Albemarle between 2009 and 2013.

M O R G A N S T A N L E Y R E S E A R C H
50
September 20, 2010The China Files
AgriChemicals
Archer-Daniels-Midland ADM, $32.55 Vincent Andrews
As one of the world’s largest originators and exporters of grains and oilseeds (the company touches approximately 25% of global grains), ADM has significant exposure to China’s burgeoning food crop needs. China is currently the world’s largest importer of oilseeds and is expected to significantly increase its corn imports over the next decade. To advance agricultural development in the region and identify strategic growth opportunities, ADM made a $100 million cornerstone investment in Agricultural Bank of China. Additionally, it has opened up an office in Beijing to help advance its strategic growth plans in China. ADM’s Asian presence is bolstered by its 16.4% ownership interest in Wilmar International Ltd., the largest global processor and merchandiser of palm and lauric oils and a major oil palm plantation owner.
Industrials
Honeywell International HON, $43.57 Scott Davis
We see an improving rate of change in HON’s China efforts, especially in its aero business there. HON also has good China exposure in energy-efficiency products and turbo technologies. Growth in industrial production, coupled with increased safety regulations, has had a positive impact on sales in the region. China contributes about 5% to the company’s overall sales, and company looks to increase its sales by 15% CAGR 2009-2014. HON has increased its focus on developing local products and has about 1,300 engineers in China.
Danaher DHR, $40.05 Scott Davis
Danaher produces “mid-tech” products that generally fly under the radar screen of Chinese competition. High tech products like Leica are low-volume, high value-add and, we believe, have sustainable brand premium. Most production in China is for the Chinese market, not for export. Danaher Business Systems (DBS) seems to work well in China and is embraced by workers there. Tangible benefits include improved inventory turns and quality improvement. Chinese sales make up about 6% of DHR’s total sales. Company sees significantly increased Chinese demand for the business’ industrial instruments, including oscilloscopes, thermography products, and digital multi-meters. In addition, increased retail and industrial demand for the tools and components has contributed to large year-over-year growth in that segment.
3M MMM, $84.58 Scott Davis
With exposures in auto, safety products, signage, medical, and water filtration, MMM is one of the best consumer plays in China among industrial companies. MMM’s products also generally under the radar screen of Chinese competitors. Approximately 6% of MMM’s sales come from China, and company targets growth of about 17% CAGR 2009-2014. MMM sees good growth in the automotive, power and utility, healthcare, and infrastructure end-markets. China is not being used as an export source. MMM continues to increase its penetration in China; having added 13 branch offices from 2003 to 2009, the company plans to add five more by 2013.

M O R G A N S T A N L E Y R E S E A R C H
51
September 20, 2010The China Files
Machinery
Joy Global JOYG, $66.20 Robert Wertheimer
Joy Global has invested in a two-pronged strategic approach to competing in China. The company competes at the high end through its western equipment, a market dominated by two global manufacturers and not currently pressured by local Chinese companies. JOYG also competes in the mid-tier category, with a locally manufactured and branded product, and plans to expand its product offering. Competing at the mid-tier level positions, JOYG plans to serve local market demand and establish relationships that enable it to grow with its customers as they invest in infrastructure. Manufacturing for mid-tier customers also positions JOYG to monitor progress of local competition as it improves and to expand product offering.
Transportation
Eagle Bulk Shipping EGLE, $5.10 Ole Slorer
Eagle’s cargo-diversified Supramax vessels transport all types of bulk commodities and are therefore less vulnerable to the volatility of the steel market (iron ore for steel is primarily transported by larger Capesize vessels). As asset values have moved higher and the company has taken delivery of most of its new builds, EGLE’s financial risk has been significantly reduced, making it a favorable turnaround play. The company sees 80% of the growth in the coal market coming from demand in India and China, which have the lowest per-capita use of electricity in the industrialized world. Increasing electrical usage is a long-term trend that benefits the coal market—especially in China, which relies on thermal coal for electricity generation.

M O R G A N S T A N L E Y R E S E A R C H
52
September 20, 2010The China Files
Appendix: Morgan Stanley US China Exposure Basket Constituents (Bloomberg ticker: MSMSCHX>)
Our China Exposure basket contains 35 stocks covering sixteen sectors. Each sector has been equally weighted (1/16 each) with stocks within each sector weighted equally as well. The basket is denominated in USD.
Company Ticker Sector WeightNike NKE Apparel 3.1%Ralph Lauren RL Apparel 3.1%Yum! Brands YUM Restaurants 2.1%McDonalds MCD Restaurants 2.1%Starbucks SBUX Restaurants 2.1%Wynn Resorts WYNN Casinos & Gaming 2.1%Las Vegas Sands LVS Casinos & Gaming 2.1%Starwood Hotels and Resorts Worldwide HOT Casinos & Gaming 2.1%Procter & Gamble PG HPC 6.3%Yahoo! YHOO Internet 6.3%Apple AAPL Computer Hardware 3.1%IBM IBM Computer Hardware 3.1%Marvell MRVL Semiconductors 6.3%General Dynamics GD Aerospace & Defense 6.3%Emerson Electric EMR Industrial Conglomerates 1.6%Honeywell International HON Industrial Conglomerates 1.6%Danaher DHR Industrial Conglomerates 1.6%3M MMM Industrial Conglomerates 1.6%Caterpillar CAT Machinery 3.1%Joy Global JOYG Machinery 3.1%Pfizer PFE Pharmaceuticals 1.6%Eli-Lilly LLY Pharmaceuticals 1.6%Merck MRK Pharmaceuticals 1.6%Bristol-Myers Squibb BMY Pharmaceuticals 1.6%Medtronic MDT Healthcare Supplies 3.1%Beckman Coulter BEC Healthcare Supplies 3.1%Dow Chemical DOW Chemicals 2.1%Air Products APD Chemicals 1.0%Praxair PX Chemicals 1.0%Albemarle ALB Chemicals 2.1%Mosaic MOS Fertilizers & AgriChemicals 3.1%Archer-Daniels-Midland ADM Fertilizers & AgriChemicals 3.1%FedEx FDX Air Freights & Logistics 6.3%Diana Shipping DSX Marine 3.1%Eagle Bulk Shipping EGLE Marine 3.1%Source: Morgan Stanley Research
An Investable Basket: Morgan Stanley Research has created a basket of the 35 stocks that we believe are most leveraged to the themes outlined in this report. The basket is an equal weighting of the stocks and can be viewed on Bloomberg under the symbol MSMSCHX. Type MSMSCHX <Go> to access the Morgan Stanley Equity Baskets / Indices homepage and select Strategy / Research (MSMSCHX>). Investing in options is not suitable for all investors. Please see the disclosures at the end of this report and discuss whether this or any particular options strategy is suitable with your Morgan Stanley representative. Please direct all company-specific questions to the coverage analyst and all options-specific questions to Christopher Metli, Derivative Research Strategist.

M O R G A N S T A N L E Y R E S E A R C H
53
September 20, 2010The China Files
Disclosure Section The information and opinions in Morgan Stanley Research were prepared by Morgan Stanley & Co. Incorporated, and/or Morgan Stanley C.T.V.M. S.A. As used in this disclosure section, "Morgan Stanley" includes Morgan Stanley & Co. Incorporated, Morgan Stanley C.T.V.M. S.A. and their affiliates as necessary. For important disclosures, stock price charts and equity rating histories regarding companies that are the subject of this report, please see the Morgan Stanley Research Disclosure Website at www.morganstanley.com/researchdisclosures, or contact your investment representative or Morgan Stanley Research at 1585 Broadway, (Attention: Research Management), New York, NY, 10036 USA.
Analyst Certification The following analysts hereby certify that their views about the companies and their securities discussed in this report are accurately expressed and that they have not received and will not receive direct or indirect compensation in exchange for expressing specific recommendations or views in this report: Vincent Andrews, Charlie Chan, Grace Chen, Jeremy Chen, Praveen Choudhary, Scott Davis, Sanjay Devgan, Scott Devitt, John Glass, William Greene, Allen Gui, Lin He, Katy Huberty, Richard Ji, Chi H. Lee, David Lewis, Bin Li, Jerry Lou, Bill Lu, Jasmine Lu, Paul Mann, Mary Meeker, Angela Moh, Dara Mohsenian, David Risinger, Ole Slorer, Mark Strawn, Wee-Kiat Tan, Helen Wen, Robert Wertheimer, Heidi Wood, Edward Xu, Kate Zhu. Unless otherwise stated, the individuals listed on the cover page of this report are research analysts.
Global Research Conflict Management Policy Morgan Stanley Research has been published in accordance with our conflict management policy, which is available at www.morganstanley.com/institutional/research/conflictpolicies.
Important US Regulatory Disclosures on Subject Companies The following analyst or strategist (or a household member) owns securities (or related derivatives) in a company that he or she covers or recommends in Morgan Stanley Research: Mary Meeker - Amazon.com (common or preferred stock), Apple, Inc. (common or preferred stock), eBay (common or preferred stock), Yahoo! (common or preferred stock). Morgan Stanley policy prohibits research analysts, strategists and research associates from investing in securities in their sub industry as defined by the Global Industry Classification Standard ("GICS," which was developed by and is the exclusive property of MSCI and S&P). Analysts may nevertheless own such securities to the extent acquired under a prior policy or in a merger, fund distribution or other involuntary acquisition. As of August 31, 2010, Morgan Stanley beneficially owned 1% or more of a class of common equity securities of the following companies covered in Morgan Stanley Research: Alibaba.com Limited, Amazon.com, Baidu.com, Inc., Diana Shipping Inc., Honeywell International, Las Vegas Sands Corp., Wynn Resorts, Limited, Yum! Brands, Inc.. Within the last 12 months, Morgan Stanley managed or co-managed a public offering (or 144A offering) of securities of Emerson Electric, General Electric, IBM, Potash Corp of Saskatchewan Inc, Procter & Gamble Co., Yum! Brands, Inc.. Within the last 12 months, Morgan Stanley has received compensation for investment banking services from 3M Co., Air Products and Chemicals Inc., Amazon.com, Archer Daniels Midland, Beckman Coulter, Bristol-Myers Squibb Co, Danaher Corp., eBay, Eli Lilly & Co., Emerson Electric, FedEx Corporation, General Electric, Google, Honeywell International, IBM, Las Vegas Sands Corp., McDonald's Corporation, Medtronic Inc., Merck & Co., Inc., Mosaic Company, Pfizer Inc, Potash Corp of Saskatchewan Inc, Praxair Inc., Procter & Gamble Co., Starbucks Corp., Starwood Hotels & Resorts, The Dow Chemical Company, Wynn Resorts, Limited, Yum! Brands, Inc.. In the next 3 months, Morgan Stanley expects to receive or intends to seek compensation for investment banking services from 3M Co., Air Products and Chemicals Inc., Albemarle Corp., Alibaba.com Limited, Amazon.com, Apple, Inc., Archer Daniels Midland, Baidu.com, Inc., Beckman Coulter, Bristol-Myers Squibb Co, Caterpillar, Danaher Corp., Diana Shipping Inc., eBay, Eli Lilly & Co., Emerson Electric, FedEx Corporation, General Electric, Google, Honeywell International, IBM, Joy Global Inc, Las Vegas Sands Corp., Marvell Technology Group Ltd, McDonald's Corporation, Medtronic Inc., Merck & Co., Inc., Mosaic Company, NIKE, Inc., Pfizer Inc, Polo Ralph Lauren Corp., Potash Corp of Saskatchewan Inc, Praxair Inc., Procter & Gamble Co., Starbucks Corp., Starwood Hotels & Resorts, Tom Online, The Dow Chemical Company, Wynn Resorts, Limited, Yahoo!, Yum! Brands, Inc.. Within the last 12 months, Morgan Stanley has received compensation for products and services other than investment banking services from 3M Co., Air Products and Chemicals Inc., Amazon.com, Apple, Inc., Archer Daniels Midland, Beckman Coulter, Bristol-Myers Squibb Co, eBay, Eli Lilly & Co., Emerson Electric, General Electric, Google, Honeywell International, IBM, McDonald's Corporation, Medtronic Inc., Merck & Co., Inc., Pfizer Inc, Procter & Gamble Co., Starbucks Corp., Starwood Hotels & Resorts, The Dow Chemical Company, Yum! Brands, Inc.. Within the last 12 months, Morgan Stanley has provided or is providing investment banking services to, or has an investment banking client relationship with, the following company: 3M Co., Air Products and Chemicals Inc., Albemarle Corp., Alibaba.com Limited, Amazon.com, Apple, Inc., Archer Daniels Midland, Baidu.com, Inc., Beckman Coulter, Bristol-Myers Squibb Co, Caterpillar, Danaher Corp., Diana Shipping Inc., eBay, Eli Lilly & Co., Emerson Electric, FedEx Corporation, General Electric, Google, Honeywell International, IBM, Joy Global Inc, Las Vegas Sands Corp., Marvell Technology Group Ltd, McDonald's Corporation, Medtronic Inc., Merck & Co., Inc., Mosaic Company, NIKE, Inc., Pfizer Inc, Polo Ralph Lauren Corp., Potash Corp of Saskatchewan Inc, Praxair Inc., Procter & Gamble Co., Starbucks Corp., Starwood Hotels & Resorts, The Dow Chemical Company, Tom Online, Wynn Resorts, Limited, Yahoo!, Yum! Brands, Inc.. Within the last 12 months, Morgan Stanley has either provided or is providing non-investment banking, securities-related services to and/or in the past has entered into an agreement to provide services or has a client relationship with the following company: 3M Co., Air Products and Chemicals Inc., Alibaba.com Limited, Amazon.com, Apple, Inc., Archer Daniels Midland, Baidu.com, Inc., Beckman Coulter, Bristol-Myers Squibb Co, Caterpillar, Danaher Corp., eBay, Eli Lilly & Co., Emerson Electric, FedEx Corporation, General Electric, Google, Honeywell International, IBM, McDonald's Corporation, Medtronic Inc., Merck & Co., Inc., NIKE, Inc., Pfizer Inc, Praxair Inc., Procter & Gamble Co., Starbucks Corp., Starwood Hotels & Resorts, The Dow Chemical Company, Yum! Brands, Inc.. Within the last 12 months, an affiliate of Morgan Stanley & Co. Incorporated has received compensation for products and services other than investment banking services from 3M Co., Baidu.com, Inc., General Electric. An employee, director or consultant of Morgan Stanley is a director of Merck & Co., Inc., Yahoo!. Morgan Stanley & Co. Incorporated makes a market in the securities of 3M Co., Air Products and Chemicals Inc., Albemarle Corp., Amazon.com, Apple, Inc., Archer Daniels Midland, Baidu.com, Inc., Beckman Coulter, Bristol-Myers Squibb Co, Caterpillar, Danaher Corp., Diana Shipping Inc., Eagle Bulk Shipping Inc, eBay, Eli Lilly & Co., Emerson Electric, FedEx Corporation, General Electric, Google, Honeywell International, IBM, Joy Global Inc, Las Vegas Sands Corp., Marvell Technology Group Ltd, McDonald's Corporation, Medtronic Inc., Merck & Co., Inc., Mosaic Company, NIKE, Inc., Pfizer Inc, Polo Ralph Lauren Corp., Potash Corp of Saskatchewan Inc, Praxair Inc., Procter & Gamble Co., Starbucks Corp., Starwood Hotels & Resorts, The Dow Chemical Company, Wynn Resorts, Limited, Yahoo!, Yum! Brands, Inc.. The equity research analysts or strategists principally responsible for the preparation of Morgan Stanley Research have received compensation based upon various factors, including quality of research, investor client feedback, stock picking, competitive factors, firm revenues and overall investment banking revenues. Morgan Stanley and its affiliates do business that relates to companies/instruments covered in Morgan Stanley Research, including market making, providing liquidity and specialized trading, risk arbitrage and other proprietary trading, fund management, commercial banking, extension of credit, investment services and investment banking. Morgan Stanley sells to and buys from customers the securities/instruments of companies covered in Morgan Stanley Research on a principal basis. Morgan Stanley may have a position in the debt of the Company or instruments discussed in this report. Certain disclosures listed above are also for compliance with applicable regulations in non-US jurisdictions.
STOCK RATINGS

M O R G A N S T A N L E Y R E S E A R C H
54
September 20, 2010The China Files
Morgan Stanley uses a relative rating system using terms such as Overweight, Equal-weight, Not-Rated or Underweight (see definitions below). Morgan Stanley does not assign ratings of Buy, Hold or Sell to the stocks we cover. Overweight, Equal-weight, Not-Rated and Underweight are not the equivalent of buy, hold and sell. Investors should carefully read the definitions of all ratings used in Morgan Stanley Research. In addition, since Morgan Stanley Research contains more complete information concerning the analyst's views, investors should carefully read Morgan Stanley Research, in its entirety, and not infer the contents from the rating alone. In any case, ratings (or research) should not be used or relied upon as investment advice. An investor's decision to buy or sell a stock should depend on individual circumstances (such as the investor's existing holdings) and other considerations.
Global Stock Ratings Distribution (as of August 31, 2010)
For disclosure purposes only (in accordance with NASD and NYSE requirements), we include the category headings of Buy, Hold, and Sell alongside our ratings of Overweight, Equal-weight, Not-Rated and Underweight. Morgan Stanley does not assign ratings of Buy, Hold or Sell to the stocks we cover. Overweight, Equal-weight, Not-Rated and Underweight are not the equivalent of buy, hold, and sell but represent recommended relative weightings (see definitions below). To satisfy regulatory requirements, we correspond Overweight, our most positive stock rating, with a buy recommendation; we correspond Equal-weight and Not-Rated to hold and Underweight to sell recommendations, respectively. Coverage Universe Investment Banking Clients (IBC)
Stock Rating Category Count % of Total Count
% of Total IBC
% of Rating Category
Overweight/Buy 1082 42% 381 43% 35%Equal-weight/Hold 1145 44% 402 46% 35%Not-Rated/Hold 13 0% 4 0% 31%Underweight/Sell 364 14% 91 10% 25%Total 2,604 878 Data include common stock and ADRs currently assigned ratings. An investor's decision to buy or sell a stock should depend on individual circumstances (such as the investor's existing holdings) and other considerations. Investment Banking Clients are companies from whom Morgan Stanley received investment banking compensation in the last 12 months.
Analyst Stock Ratings Overweight (O). The stock's total return is expected to exceed the average total return of the analyst's industry (or industry team's) coverage universe, on a risk-adjusted basis, over the next 12-18 months. Equal-weight (E). The stock's total return is expected to be in line with the average total return of the analyst's industry (or industry team's) coverage universe, on a risk-adjusted basis, over the next 12-18 months. Not-Rated (NR). Currently the analyst does not have adequate conviction about the stock's total return relative to the average total return of the analyst's industry (or industry team's) coverage universe, on a risk-adjusted basis, over the next 12-18 months. Underweight (U). The stock's total return is expected to be below the average total return of the analyst's industry (or industry team's) coverage universe, on a risk-adjusted basis, over the next 12-18 months. Unless otherwise specified, the time frame for price targets included in Morgan Stanley Research is 12 to 18 months.
Analyst Industry Views Attractive (A): The analyst expects the performance of his or her industry coverage universe over the next 12-18 months to be attractive vs. the relevant broad market benchmark, as indicated below. In-Line (I): The analyst expects the performance of his or her industry coverage universe over the next 12-18 months to be in line with the relevant broad market benchmark, as indicated below. Cautious (C): The analyst views the performance of his or her industry coverage universe over the next 12-18 months with caution vs. the relevant broad market benchmark, as indicated below. Benchmarks for each region are as follows: North America - S&P 500; Latin America - relevant MSCI country index or MSCI Latin America Index; Europe - MSCI Europe; Japan - TOPIX; Asia - relevant MSCI country index. .
Important Disclosures for Morgan Stanley Smith Barney LLC Customers Citi Investment Research & Analysis (CIRA) research reports may be available about the companies or topics that are the subject of Morgan Stanley Research. Ask your Financial Advisor or use Research Center to view any available CIRA research reports in addition to Morgan Stanley research reports. Important disclosures regarding the relationship between the companies that are the subject of Morgan Stanley Research and Morgan Stanley Smith Barney LLC, Morgan Stanley and Citigroup Global Markets Inc. or any of their affiliates, are available on the Morgan Stanley Smith Barney disclosure website at www.morganstanleysmithbarney.com/researchdisclosures. For Morgan Stanley and Citigroup Global Markets, Inc. specific disclosures, you may refer to www.morganstanley.com/researchdisclosures and https://www.citigroupgeo.com/geopublic/Disclosures/index_a.html. Each Morgan Stanley Equity Research report is reviewed and approved on behalf of Morgan Stanley Smith Barney LLC. This review and approval is conducted by the same person who reviews the Equity Research report on behalf of Morgan Stanley. This could create a conflict of interest.
Other Important Disclosures Morgan Stanley & Co. International PLC and its affiliates have a significant financial interest in the debt securities of 3M Co., Air Products and Chemicals Inc., Archer Daniels Midland, Beckman Coulter, Bristol-Myers Squibb Co, Caterpillar, Danaher Corp., eBay, Eli Lilly & Co., Emerson Electric, FedEx Corporation, General Electric, Google, Honeywell International, IBM, Las Vegas Sands Corp., McDonald's Corporation, Medtronic Inc., Merck & Co., Inc., Mosaic Company, NIKE, Inc., Pfizer Inc, Polo Ralph Lauren Corp., Potash Corp of Saskatchewan Inc, Praxair Inc., Procter & Gamble Co., Starwood Hotels & Resorts, The Dow Chemical Company, Yahoo!, Yum! Brands, Inc.. Morgan Stanley produces an equity research product called a "Tactical Idea." Views contained in a "Tactical Idea" on a particular stock may be contrary to the recommendations or views expressed in research on the same stock. This may be the result of differing time horizons, methodologies, market events, or other factors. For all research available on a particular stock, please contact your sales representative or go to Client Link at www.morganstanley.com. Morgan Stanley Research does not provide individually tailored investment advice. Morgan Stanley Research has been prepared without regard to the individual financial circumstances and objectives of persons who receive it. Morgan Stanley recommends that investors independently evaluate particular investments and strategies, and encourages investors to seek the advice of a financial adviser. The appropriateness of a particular investment or strategy will depend on an investor's individual circumstances and objectives. The securities, instruments, or strategies discussed in Morgan Stanley Research may not be suitable for all investors, and certain investors may not be eligible to purchase or participate in some or all of them. The fixed income research analysts or strategists principally responsible for the preparation of Morgan Stanley Research have received compensation based upon various factors, including quality, accuracy and value of research, firm profitability or revenues (which include fixed income trading and capital markets profitability or revenues), client feedback and competitive factors. Fixed Income Research analysts' or strategists' compensation is not linked to investment banking or capital markets transactions performed by Morgan Stanley or the profitability or revenues of particular trading desks.

M O R G A N S T A N L E Y R E S E A R C H
55
September 20, 2010The China Files
Morgan Stanley Research is not an offer to buy or sell or the solicitation of an offer to buy or sell any security/instrument or to participate in any particular trading strategy. The "Important US Regulatory Disclosures on Subject Companies" section in Morgan Stanley Research lists all companies mentioned where Morgan Stanley owns 1% or more of a class of common equity securities of the companies. For all other companies mentioned in Morgan Stanley Research, Morgan Stanley may have an investment of less than 1% in securities/instruments or derivatives of securities/instruments of companies and may trade them in ways different from those discussed in Morgan Stanley Research. Employees of Morgan Stanley not involved in the preparation of Morgan Stanley Research may have investments in securities/instruments or derivatives of securities/instruments of companies mentioned and may trade them in ways different from those discussed in Morgan Stanley Research. Derivatives may be issued by Morgan Stanley or associated persons. With the exception of information regarding Morgan Stanley, Morgan Stanley Research is based on public information. Morgan Stanley makes every effort to use reliable, comprehensive information, but we make no representation that it is accurate or complete. We have no obligation to tell you when opinions or information in Morgan Stanley Research change apart from when we intend to discontinue equity research coverage of a subject company. Facts and views presented in Morgan Stanley Research have not been reviewed by, and may not reflect information known to, professionals in other Morgan Stanley business areas, including investment banking personnel. Morgan Stanley Research personnel may participate in company events such as site visits and are generally prohibited from accepting payment by the company of associated expenses unless pre-approved by authorized members of Research management. The value of and income from your investments may vary because of changes in interest rates, foreign exchange rates, default rates, prepayment rates, securities/instruments prices, market indexes, operational or financial conditions of companies or other factors. There may be time limitations on the exercise of options or other rights in securities/instruments transactions. Past performance is not necessarily a guide to future performance. Estimates of future performance are based on assumptions that may not be realized. If provided, and unless otherwise stated, the closing price on the cover page is that of the primary exchange for the subject company's securities/instruments. Morgan Stanley may make investment decisions or take proprietary positions that are inconsistent with the recommendations or views in this report. To our readers in Taiwan: Information on securities/instruments that trade in Taiwan is distributed by Morgan Stanley Taiwan Limited ("MSTL"). Such information is for your reference only. Information on any securities/instruments issued by a company owned by the government of or incorporated in the PRC and listed in on the Stock Exchange of Hong Kong ("SEHK"), namely the H-shares, including the component company stocks of the Stock Exchange of Hong Kong ("SEHK")'s Hang Seng China Enterprise Index; or any securities/instruments issued by a company that is 30% or more directly- or indirectly-owned by the government of or a company incorporated in the PRC and traded on an exchange in Hong Kong or Macau, namely SEHK's Red Chip shares, including the component company of the SEHK's China-affiliated Corp Index is distributed only to Taiwan Securities Investment Trust Enterprises ("SITE"). The reader should independently evaluate the investment risks and is solely responsible for their investment decisions. Morgan Stanley Research may not be distributed to the public media or quoted or used by the public media without the express written consent of Morgan Stanley. Information on securities/instruments that do not trade in Taiwan is for informational purposes only and is not to be construed as a recommendation or a solicitation to trade in such securities/instruments. MSTL may not execute transactions for clients in these securities/instruments. To our readers in Hong Kong: Information is distributed in Hong Kong by and on behalf of, and is attributable to, Morgan Stanley Asia Limited as part of its regulated activities in Hong Kong. If you have any queries concerning Morgan Stanley Research, please contact our Hong Kong sales representatives. Morgan Stanley Research is disseminated in Japan by Morgan Stanley MUFG Securities Co., Ltd.; in Hong Kong by Morgan Stanley Asia Limited (which accepts responsibility for its contents); in Singapore by Morgan Stanley Asia (Singapore) Pte. (Registration number 199206298Z) and/or Morgan Stanley Asia (Singapore) Securities Pte Ltd (Registration number 200008434H), regulated by the Monetary Authority of Singapore, which accepts responsibility for its contents; in Australia to "wholesale clients" within the meaning of the Australian Corporations Act by Morgan Stanley Australia Limited A.B.N. 67 003 734 576, holder of Australian financial services license No. 233742, which accepts responsibility for its contents; in Australia to "wholesale clients" and "retail clients" within the meaning of the Australian Corporations Act by Morgan Stanley Smith Barney Australia Pty Ltd (A.B.N. 19 009 145 555, holder of Australian financial services license No. 240813, which accepts responsibility for its contents; in Korea by Morgan Stanley & Co International plc, Seoul Branch; in India by Morgan Stanley India Company Private Limited; in Canada by Morgan Stanley Canada Limited, which has approved of, and has agreed to take responsibility for, the contents of Morgan Stanley Research in Canada; in Germany by Morgan Stanley Bank AG, Frankfurt am Main and Morgan Stanley Private Wealth Management Limited, Niederlassung Deutschland, regulated by Bundesanstalt fuer Finanzdienstleistungsaufsicht (BaFin); in Spain by Morgan Stanley, S.V., S.A., a Morgan Stanley group company, which is supervised by the Spanish Securities Markets Commission (CNMV) and states that Morgan Stanley Research has been written and distributed in accordance with the rules of conduct applicable to financial research as established under Spanish regulations; in the United States by Morgan Stanley & Co. Incorporated, which accepts responsibility for its contents. Morgan Stanley & Co. International plc, authorized and regulated by the Financial Services Authority, disseminates in the UK research that it has prepared, and approves solely for the purposes of section 21 of the Financial Services and Markets Act 2000, research which has been prepared by any of its affiliates. Morgan Stanley Private Wealth Management Limited, authorized and regulated by the Financial Services Authority, also disseminates Morgan Stanley Research in the UK. Private U.K. investors should obtain the advice of their Morgan Stanley & Co. International plc or Morgan Stanley Private Wealth Management representative about the investments concerned. RMB Morgan Stanley (Proprietary) Limited is a member of the JSE Limited and regulated by the Financial Services Board in South Africa. RMB Morgan Stanley (Proprietary) Limited is a joint venture owned equally by Morgan Stanley International Holdings Inc. and RMB Investment Advisory (Proprietary) Limited, which is wholly owned by FirstRand Limited. The information in Morgan Stanley Research is being communicated by Morgan Stanley & Co. International plc (DIFC Branch), regulated by the Dubai Financial Services Authority (the DFSA), and is directed at Professional Clients only, as defined by the DFSA. The financial products or financial services to which this research relates will only be made available to a customer who we are satisfied meets the regulatory criteria to be a Professional Client. The information in Morgan Stanley Research is being communicated by Morgan Stanley & Co. International plc (QFC Branch), regulated by the Qatar Financial Centre Regulatory Authority (the QFCRA), and is directed at business customers and market counterparties only and is not intended for Retail Customers as defined by the QFCRA. As required by the Capital Markets Board of Turkey, investment information, comments and recommendations stated here, are not within the scope of investment advisory activity. Investment advisory service is provided in accordance with a contract of engagement on investment advisory concluded between brokerage houses, portfolio management companies, non-deposit banks and clients. Comments and recommendations stated here rely on the individual opinions of the ones providing these comments and recommendations. These opinions may not fit to your financial status, risk and return preferences. For this reason, to make an investment decision by relying solely to this information stated here may not bring about outcomes that fit your expectations. The trademarks and service marks contained in Morgan Stanley Research are the property of their respective owners. Third-party data providers make no warranties or representations of any kind relating to the accuracy, completeness, or timeliness of the data they provide and shall not have liability for any damages of any kind relating to such data. The Global Industry Classification Standard ("GICS") was developed by and is the exclusive property of MSCI and S&P. Morgan Stanley Research, or any portion thereof may not be reprinted, sold or redistributed without the written consent of Morgan Stanley. Morgan Stanley Research is disseminated and available primarily electronically, and, in some cases, in printed form.
Additional information on recommended securities/instruments is available on request.

M O R G A N S T A N L E Y R E S E A R C H
The Americas 1585 Broadway New York, NY 10036-8293 United States Tel: +1 (1)212 761 4000
Europe 20 Bank Street, Canary Wharf London E14 4AD United Kingdom Tel: +44 (0)20 7425 8000
Japan 4-20-3 Ebisu, Shibuya-ku Tokyo 150-6008 Japan Tel: +81 (0)3 5424 5000
Asia/Pacific 1 Austin Road West Kowloon Hong Kong Tel: +852 2848 5200
56
Ticker Company Name Close Price
(as of 9/17/2010)
MMM.N 3M Co. 86.08
APD.N Air Products and Chemicals Inc. 82.20
ALB.N Albemarle Corp. 43.38
1688.HK Alibaba.com Limited 14.98 HKD
AMZN.O Amazon.com 148.33
AAPL.O Apple, Inc. 275.37
ADM.N Archer Daniels Midland 32.38
BIDU.O Baidu.com, Inc. 85.73 USD
BEC.N Beckman Coulter 46.38
BMY.N Bristol-Myers Squibb Co 27.31
CAT.N Caterpillar 73.17
DHR.N Danaher Corp. 40.78
DSX.N Diana Shipping Inc. 12.11
EGLE.O Eagle Bulk Shipping Inc 5.00
EBAY.O eBay 24.22
LLY.N Eli Lilly & Co. 35.80
EMR.N Emerson Electric 51.22
FDX.N FedEx Corporation 82.21
GD.N General Dynamics 62.69
GOOG.O Google 490.15
HON.N Honeywell International 43.77
IBM.N IBM 130.19
JOYG.O Joy Global Inc 67.23
LVS.N Las Vegas Sands Corp. 32.01
MRVL.O Marvell Technology Group Ltd 17.91
MCD.N McDonald's Corporation 74.32
MDT.N Medtronic Inc. 33.35
MRK.N Merck & Co., Inc. 36.33
MOS.N Mosaic Company 60.02
NKE.N NIKE, Inc. 77.26
PFE.N Pfizer Inc 17.06
RL.N Polo Ralph Lauren Corp. 87.67
POT.N Potash Corp of Saskatchewan Inc 147.28
PX.N Praxair Inc. 88.36
PG.N Procter & Gamble Co. 60.97
1066.HK Shandong Weigao 19.26
SBUX.O Starbucks Corp. 25.53
HOT.N Starwood Hotel & Resorts 51.94
DOW.N The Dow Chemical Company 26.72
WYNN.O Wynn Resorts, Limited 91.91
YHOO.O Yahoo! 13.89
YUM.N Yum! Brands, Inc. 45.75