Embed Size (px)
Citation preview
Facilitating Trade Across Africa with Ports Infrastructure Development
Presented by: Derrick Chikanga
Infrastructure Research Analyst
Frost & Sullivan

Agenda…
OverviewCurrent SituationFuture DevelopmentsImplications and Conclusions

Overview
WHY DOES The Future Hold?Key Takeaway: An efficient infrastructure system is key to facilitating trade and regional integration
An efficient transport infrastructure network enables the smoothflow of goods and services between countries and across regions.
Developed transport systems drive economic growth and fostereconomic development.
Integrated transport systems create corridors for trade and inter-continental cooperation.
Regional
Integration
Economic
Development
Facilitating
Trade

Africa – Key Infrastructure and Trade Statistics
$403 billionThe value of on-
going and bankable projects running till 2025 and beyond.
% of investment in Sub-Saharan
Africa on transport
infrastructure
56%
70%In land-locked
countries, transport accounts for 70%
Is the number of
countries in Africa which have regular
power outages (out
of 55)
30Expected
(2020) increase in intra-regional trade volumes in Sub-Saharan
Africa from 34.9Mt in 2009
120.4Mt 50 years It will take 50 years for most
countries in Africa to reach
universal access to modern
infrastructure
50%Infrastructure
development has been responsible
for more than half of Africa’s
improved economic
performance
723MtExpected
(2020) increase in Sub-Saharan African trade volumes from 376Mt in 2009
of the value of exported
goods
*based on active projects in 2011
Source: World Bank and Frost and
Sullivan analysis
$810 billionTotal spending
needed over the next five years to upgrade,
rehabilitate and expand Africa’s infrastructure

Current Situation
WHY DOES The Future Hold?
Current Situation
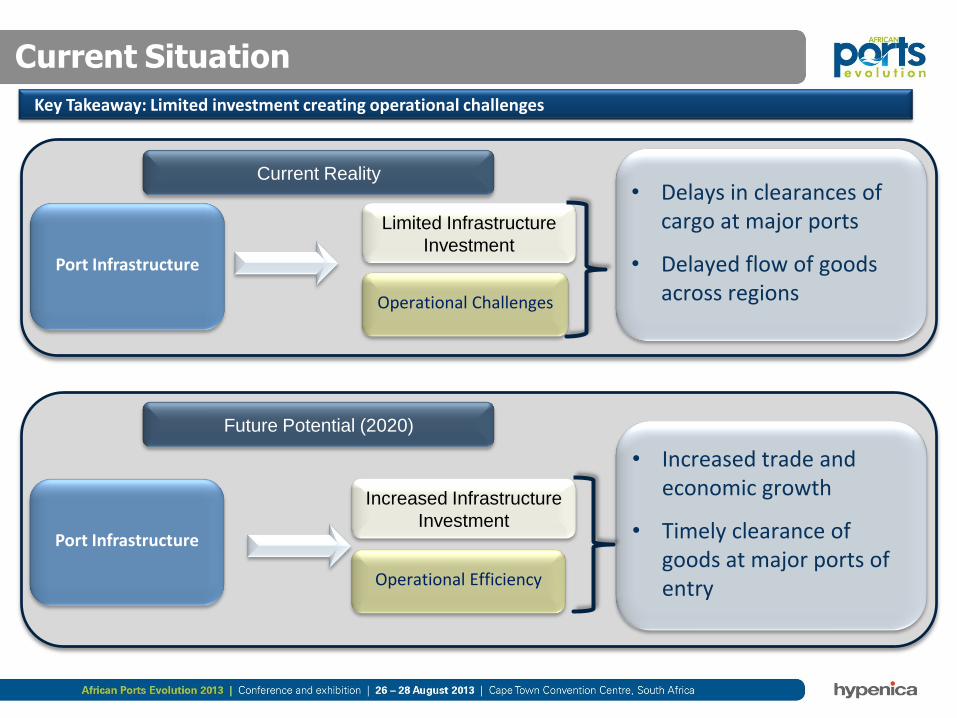
WHY DOES The Future Hold?Key Takeaway: Limited investment creating operational challenges
Current Reality
Future Potential (2020)
Port Infrastructure
Limited Infrastructure
Investment
Operational Challenges
• Increased trade and economic growth
• Timely clearance of goods at major ports of entry
• Delays in clearances of cargo at major ports
• Delayed flow of goods across regions
Port Infrastructure
Increased Infrastructure
Investment
Operational Efficiency
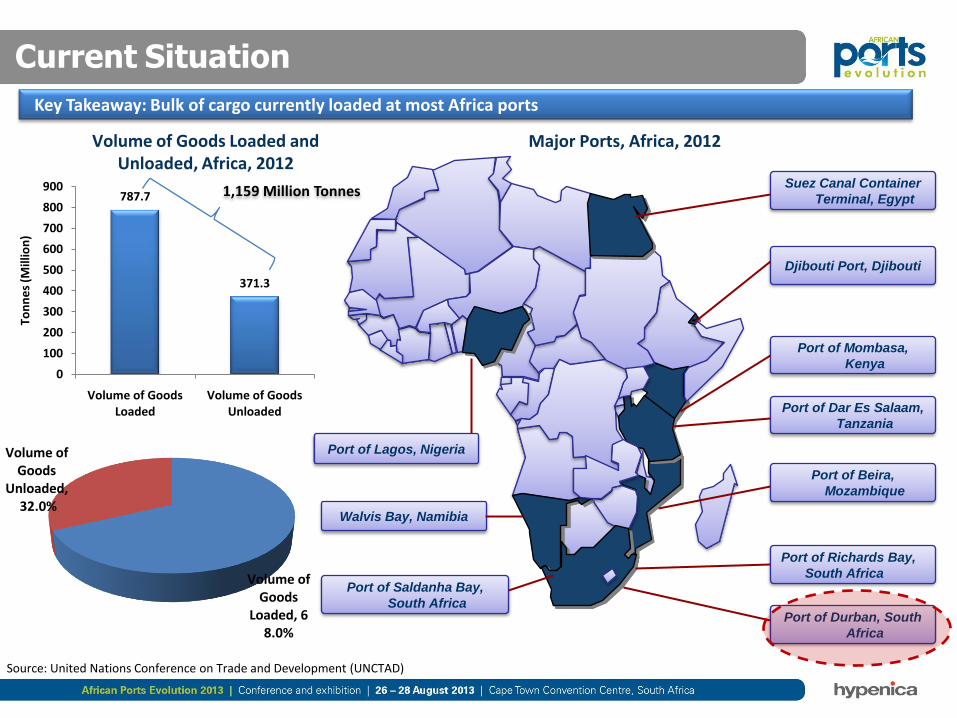
Port of Durban, South
Africa
Port of Richards Bay,
South Africa
Port of Mombasa,
Kenya
Port of Dar Es Salaam,
Tanzania
Port of Beira,
Mozambique
Djibouti Port, Djibouti
Suez Canal Container
Terminal, Egypt
Port of Lagos, Nigeria
Walvis Bay, Namibia
Port of Saldanha Bay,
South Africa
Key Takeaway: Bulk of cargo currently loaded at most Africa ports
787.7
371.3
0
100
200
300
400
500
600
700
800
900
Volume of Goods Loaded
Volume of Goods Unloaded
Ton
ne
s (M
illio
n)
Volume of Goods
Loaded, 68.0%
Volume of Goods
Unloaded,32.0%
Major Ports, Africa, 2012Volume of Goods Loaded and Unloaded, Africa, 2012
Current Situation
Source: United Nations Conference on Trade and Development (UNCTAD)
1,159 Million Tonnes
Current Situation
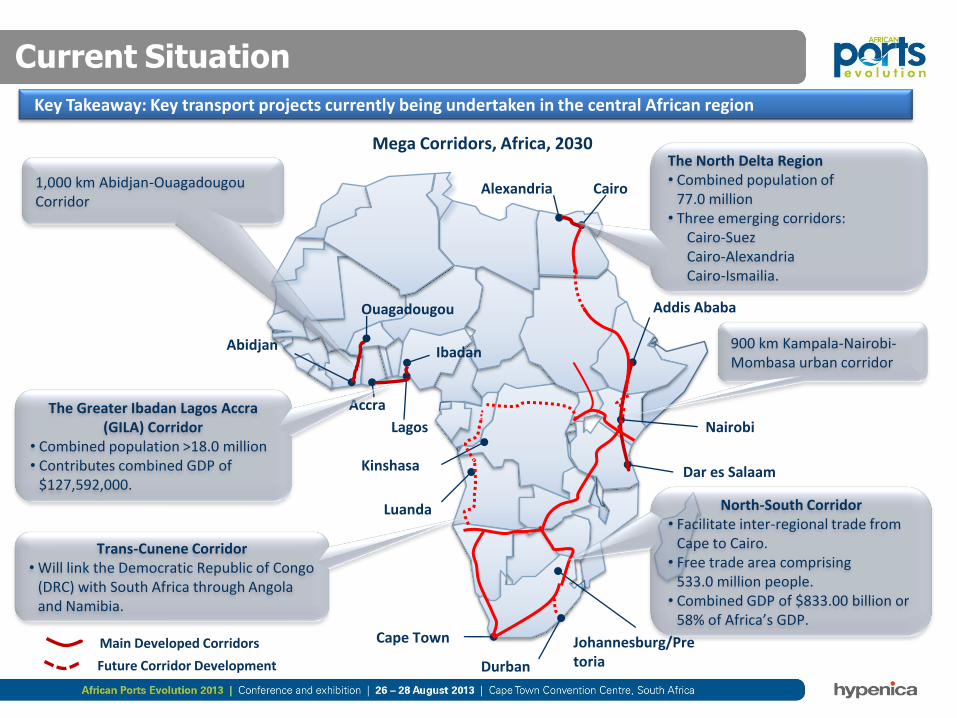
Key Takeaway: Key transport projects currently being undertaken in the central African region
Lagos
Luanda
Johannesburg/Pretoria
Cairo
Dar es Salaam
Alexandria
Nairobi
Accra
Abidjan
Kinshasa
Addis Ababa
Main Developed Corridors Cape Town
Durban
The Greater Ibadan Lagos Accra (GILA) Corridor
• Combined population >18.0 million• Contributes combined GDP of
$127,592,000.
The North Delta Region• Combined population of
77.0 million• Three emerging corridors:
Cairo-SuezCairo-AlexandriaCairo-Ismailia.
900 km Kampala-Nairobi-Mombasa urban corridor
1,000 km Abidjan-Ouagadougou Corridor
North-South Corridor• Facilitate inter-regional trade from
Cape to Cairo. • Free trade area comprising
533.0 million people. • Combined GDP of $833.00 billion or
58% of Africa’s GDP.
Trans-Cunene Corridor• Will link the Democratic Republic of Congo
(DRC) with South Africa through Angola and Namibia.
Ouagadougou
Ibadan
Future Corridor Development
Mega Corridors, Africa, 2030
Current Situation
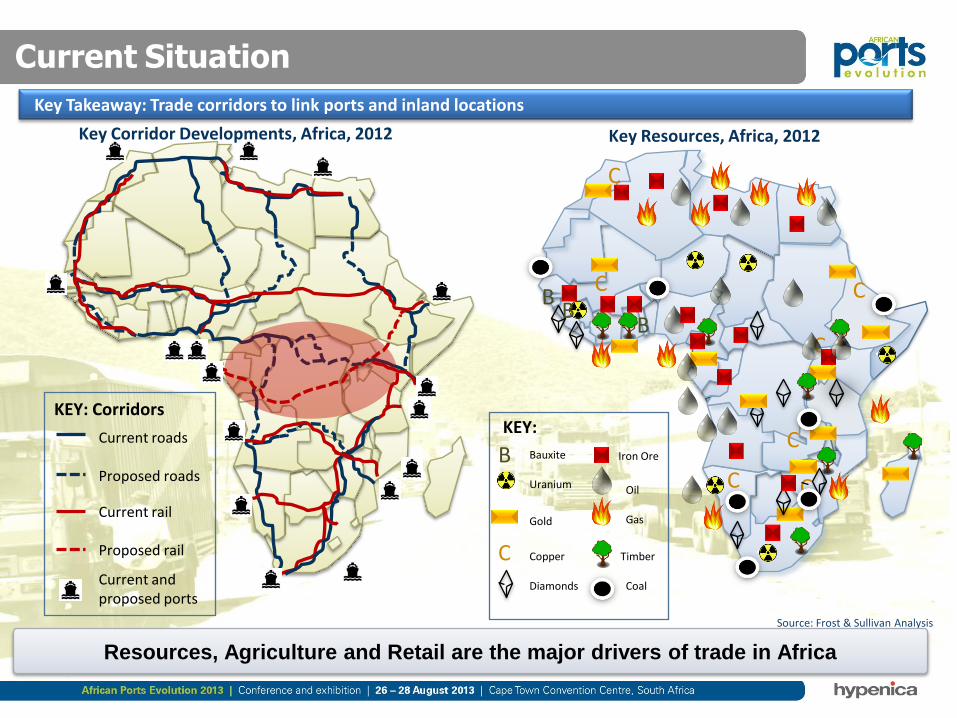
Key Takeaway: Trade corridors to link ports and inland locations
C
B Bauxite
Uranium
Gold
Copper
Diamonds
Oil
Gas
Timber
KEY:
Iron Ore
Coal
C
CC
CC
C
C
BB
B
Source: Frost & Sullivan Analysis
KEY: Corridors
Current roads
Proposed roads
Current rail
Proposed rail
Current and proposed ports
Resources, Agriculture and Retail are the major drivers of trade in Africa
Key Resources, Africa, 2012Key Corridor Developments, Africa, 2012
Current Situation
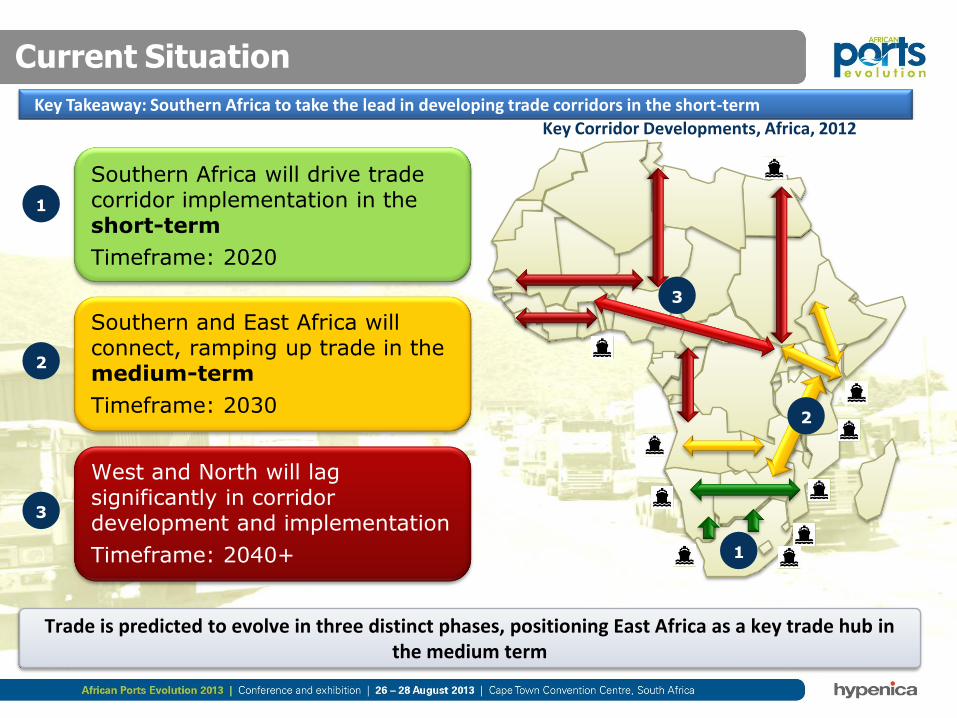
Key Takeaway: Southern Africa to take the lead in developing trade corridors in the short-term
1
Southern Africa will drive trade corridor implementation in the short-term
Timeframe: 2020
Southern and East Africa will connect, ramping up trade in the medium-term
Timeframe: 2030
West and North will lag significantly in corridor development and implementation
Timeframe: 2040+
2
3
Trade is predicted to evolve in three distinct phases, positioning East Africa as a key trade hub in the medium term
3
2
1
Key Corridor Developments, Africa, 2012

Current SituationKey Takeaway: Key transport projects to be undertaken in the east African region
$2 billion
900km railway
linking port of
Nacala to Moatize
$5.2 billion
Rehabilitation of railway
to improve transhipment
$5.3 billion
Construction of
a new port in
Northern Kenya
$2.23 billion
Railway
linking
Tanzania to
Rwanda
$1.4 billion
Tema-Accra
railway link
$1.2 billion
Increase port
capacity from 2.7 to
11.0 million tonnes
$6 billion
Development of a
new deep sea port
*based on active projects in 2013
Source: Frost & Sullivan Analysis
$9.34 billion
1,100 km railway linking
Botswana to Mozambique via
Zimbabwe , new port at Matatuine
Future Developments
WHAT DOES THE FUTURE HOLD?
Future Developments
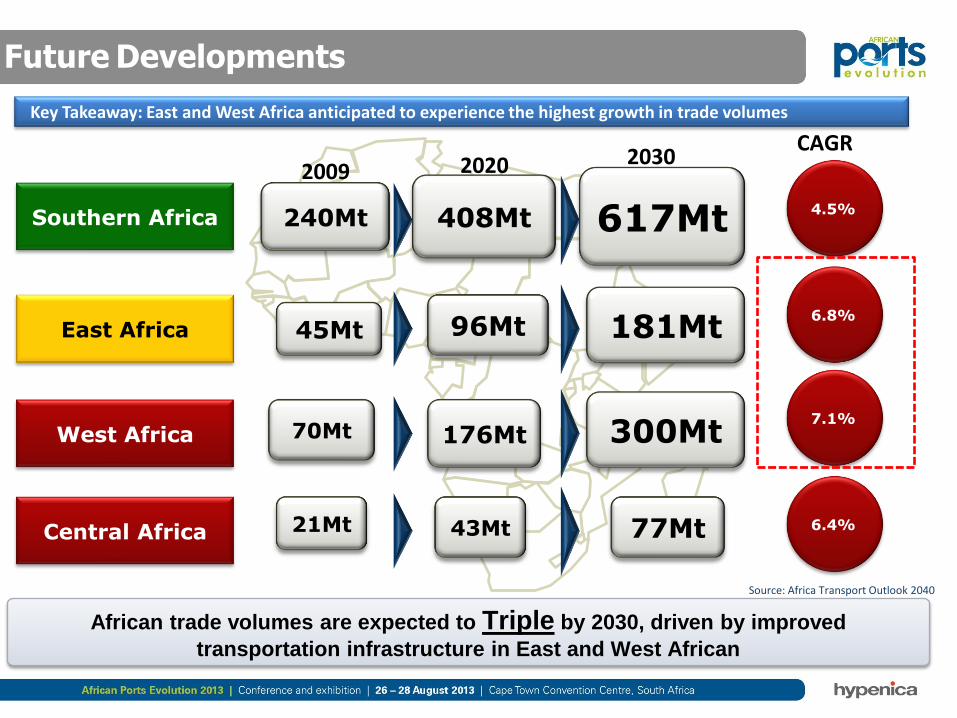
Key Takeaway: East and West Africa anticipated to experience the highest growth in trade volumes
2030CAGR
240Mt 408Mt
2009
617Mt
2020
70Mt 176Mt 300Mt
Southern Africa
East Africa
West Africa
Central Africa
45Mt 96Mt 181Mt
21Mt 43Mt 77Mt
4.5%
6.8%
7.1%
6.4%
Source: Africa Transport Outlook 2040
African trade volumes are expected to Triple by 2030, driven by improved
transportation infrastructure in East and West African
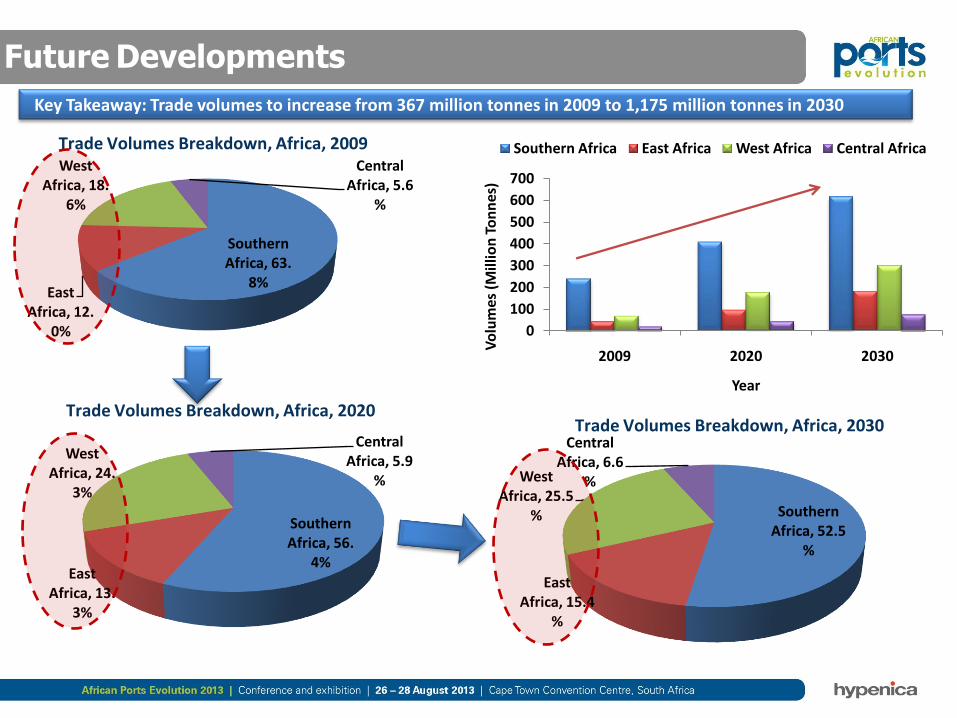
WHY DOES The Future Hold?Key Takeaway: Trade volumes to increase from 367 million tonnes in 2009 to 1,175 million tonnes in 2030
0
100
200
300
400
500
600
700
2009 2020 2030
Vo
lum
es (
Mill
ion
To
nn
es)
Year
Southern Africa East Africa West Africa Central Africa
Southern Africa, 63.
8%East
Africa, 12.0%
West Africa, 18.
6%
Central Africa, 5.6
%
Southern Africa, 56.
4%East
Africa, 13.3%
West Africa, 24.
3%
Central Africa, 5.9
%
Southern Africa, 52.5
%
East Africa, 15.4
%
West Africa, 25.5
%
Central Africa, 6.6
%
Trade Volumes Breakdown, Africa, 2009
Trade Volumes Breakdown, Africa, 2020Trade Volumes Breakdown, Africa, 2030
Future Developments

Key Takeaway: Most imports to come from Asia by 2020
North AmericaUSA & Canada
Europe UK, Germany, France, Netherlands and Norway
Source: United Nations Conference on Trade and Development (UNCTAD)
Volume of Goods:131 Million Tonnes
SOUTHERN AFRICA
Volume of Goods:56 Million Tonnes
WEST AFRICA
EAST AFRICA
Volume of Goods:31 Million Tonnes
Imports Volumes Origin, Africa, 2012
AsiaChina, Japan, India and Korea
Total Volume 218 Million Tonnes
Future Developments

Key Takeaway: Europe remains the biggest market for most African countries
Volume of Goods:277 Million Tonnes
SOUTHERN AFRICA
Volume of Goods:120 Million Tonnes
WEST AFRICA
EAST AFRICA
Volume of Goods:65 Million Tonnes
Exports Volumes Destinations, Africa, 2012
North AmericaUSA & Canada
Europe UK, Germany, France, Netherlands and Norway Asia
China, Japan, India and Korea
Source: United Nations Conference on Trade and Development (UNCTAD)
Total Volume 462 Million Tonnes
Future Developments
WHY DOES The Future Hold?
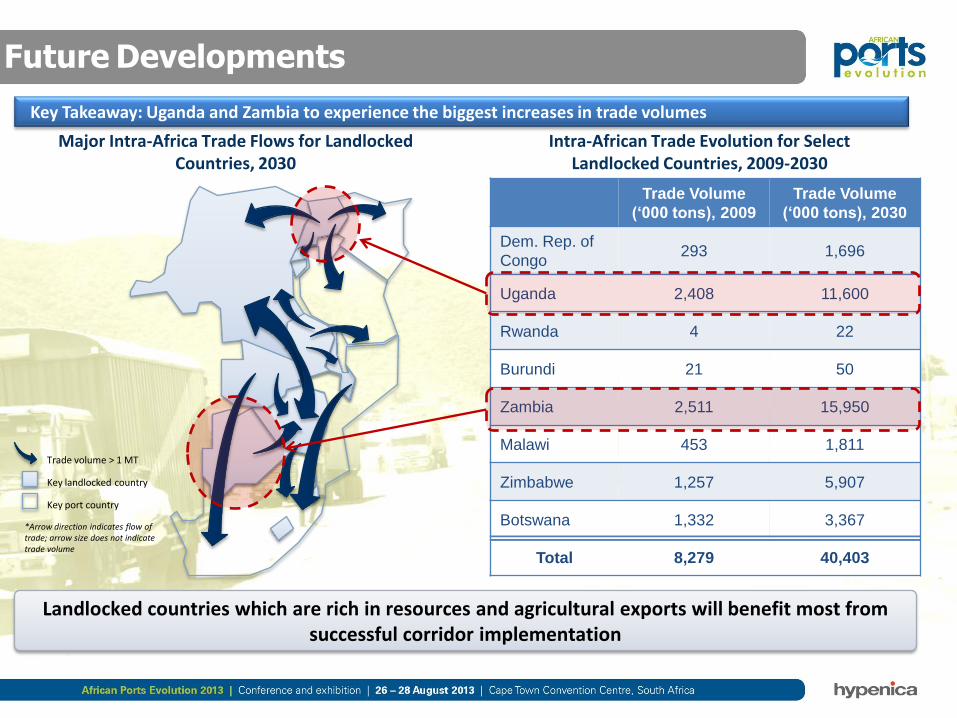
Trade Volume
(‘000 tons), 2009
Trade Volume
(‘000 tons), 2030
Dem. Rep. of
Congo293 1,696
Uganda 2,408 11,600
Rwanda 4 22
Burundi 21 50
Zambia 2,511 15,950
Malawi 453 1,811
Zimbabwe 1,257 5,907
Botswana 1,332 3,367
Total 8,279 40,403
Trade volume > 1 MT
Key landlocked country
Key port country
*Arrow direction indicates flow of trade; arrow size does not indicate trade volume
Landlocked countries which are rich in resources and agricultural exports will benefit most from successful corridor implementation
Major Intra-Africa Trade Flows for Landlocked Countries, 2030
Intra-African Trade Evolution for Select Landlocked Countries, 2009-2030
Key Takeaway: Uganda and Zambia to experience the biggest increases in trade volumes
Future Developments
Implications and Conclusions
What are the Implications for Africa’s Development

Key Takeaway: Large funding deficit for infrastructure development currently exists in the short-term
Current on-going and bankable projects running till
2025 and beyond are valued at $403 billion.
However, approximately $810 billion will be required
in the next 5 years.
Sub-Saharan African trade volumes are expected to
increase from 376Mt in 2009 to 723Mt in 2020.
Volumes anticipated to reach 1,175Mt in 2030.
Intra-regional trade corridors are expected to near
completion over the next three decades, in the
following sequence: Southern Africa (2020), East
Africa (2030), West & North Africa (2040+).
1
2
4
East Africa’s established intra-regional connectivity
and improved regulatory environment is likely to
drive access to markets in multiple countries.3
Implications and Conclusions
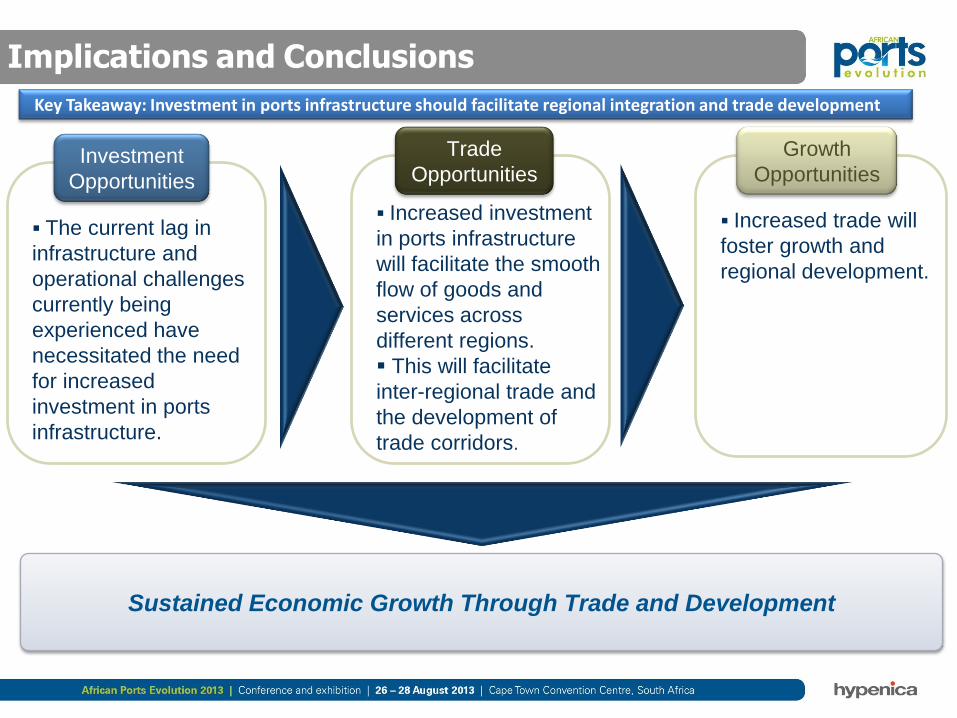
WHY DOES The Future Hold?Key Takeaway: Investment in ports infrastructure should facilitate regional integration and trade development
The current lag in
infrastructure and
operational challenges
currently being
experienced have
necessitated the need
for increased
investment in ports
infrastructure.
Trade
OpportunitiesInvestment
Opportunities
Growth
Opportunities
Sustained Economic Growth Through Trade and Development
Increased investment
in ports infrastructure
will facilitate the smooth
flow of goods and
services across
different regions.
This will facilitate
inter-regional trade and
the development of
trade corridors.
Increased trade will
foster growth and
regional development.
Implications and Conclusions

The End
Your contacts:
Derrick Chikanga
Infrastructure Analyst, Africa
Tel: +27 (0) 21 680 3204
Email: [email protected]
Samantha James
Corporate Communications
Tel: +27 (0) 21 680 3260
Email: [email protected]